Molecular analysis of ivy cells of the hippocampal CA1 stratum radiatum using spectral identification of immunofluorophores
- 1Medical Research Council Anatomical Neuropharmacology Unit, Department of Pharmacology, Oxford University, Oxford, UK
- 2Department of Pharmacology, Oxford University, Oxford, UK
Neuronal nitric oxide synthase-expressing (nNOS+) GABAergic interneurons are common in hippocampal stratum (str.) radiatum. However, these cells are less well characterized than nNOS+ ivy cells in str. pyramidale or neurogliaform cells (NGC) in str. lacunosum-moleculare. Here we have studied the laminar distribution of the axons and dendrites, and the immunoreactivity of these neurons recorded in rat hippocampal slices. We have used spectral analysis of antibody- or streptavidin-conjugated fluorophores to improve recognition of genuine signals in reactions for molecules such as nNOS and neuropeptide-Y (NPY). We found that most nNOS+ cells with soma in the CA1 area str. radiatum exhibit characteristic properties of ivy cells, and were positive for NPY and negative for reelin. However, laminar distributions of their neurites differ from original characterization of ivy cells with the soma in or close to str. pyramidale. Both their dendrites and axon are mainly in str. radiatum and to a lesser extent in str. oriens, and in addition often extend to str. lacunosum-moleculare. We conclude that ivy cells in str. radiatum may predominantly be feedforward inhibitory interneurons in the CA1 area, and their axonal output delivering GABA, NPY, and NO can influence both the entorhinal cortex innervated and the CA3 innervated zones pre- and post-synaptically. Spectral analysis of fluorophores provides an objective algorithm to analyze signals in immunoreactions for neurochemical markers.
Introduction
In the CA1 area of the hippocampus, three major types of neuronal nitric oxide synthase (nNOS)-expressing GABAergic interneurons have been identified with different laminar distribution. Large intensely nNOS+ projection neurons are rare and have mostly horizontal dendrites in stratum (str.) oriens. These cells are most frequently located at the border with the subiculum (Freund and Buzsáki, 1996; Somogyi, 2010). Of the other two related neuron types, neurogliaform cells (NGC) are located predominantly in str. lacunosum-moleculare where their dendrites receive excitatory synapses from the perforant pathway and the efferent axons form connections to other interneurons and pyramidal cell apical dendrites (Somogyi, 2010; Capogna, 2011; Maccaferri, 2011). The cell bodies of the closely related nNOS+ ivy cells were reported to be most numerous in str. pyramidale and their axons and dendrites extend from str. oriens through str. radiatum, rarely entering str. lacunosum-moleculare (Fuentealba et al., 2008; Szabadics and Soltesz, 2009; Tricoire et al., 2010, 2011). Although interneuron somata expressing nNOS are also common in str. radiatum (Catania et al., 1995; Fuentealba et al., 2008; Tricoire et al., 2010; Krook-Magnuson et al., 2011), the distributions of their processes have rarely been reported.
Here we have studied the laminar distribution of axons and dendrites of ivy cells with soma in str. radiatum of the CA1 area. Cells were filled with neurobiotin in rat acute hippocampal slices using whole-cell patch technique and reconstructed. Most studied nNOS-expressing cells showed co-labeling for neuropeptide-Y (NPY) (Fuentealba et al., 2008; Karagiannis et al., 2009; Tricoire et al., 2010; Krook-Magnuson et al., 2011). Because whole-cell recording and in vitro slice conditions reduce immunoreactivity for certain molecules, we spectrally analyzed fluorophore emissions and measured the intensity of antibody-conjugated fluorophore signals to conclude visual observations of laser confocal microscope images.
We report here that nNOS-expressing neurons, which have soma in the CA1 str. radiatum, show many characteristics of ivy cells reported in the pyramidal layer, but some may differ from those characterized previously in their laminar distribution of axons and dendrites (Fuentealba et al., 2008). Spectral analysis improves the evaluation of immunoreactions, which are often compromised in slice preparations and in neurons studied with whole-cell clamp technique.
Materials and Methods
Hippocampal Slices and Cell Labeling
Three- to four-week-old-male Sprague–Dawley rats were killed according to the Animals (Scientific Procedures) Act 1986 and transverse hippocampal slices were prepared as described previously (Oren et al., 2009). Slices (350 μm) were cut with a vibrating microtome (Microm HM650V, Carl Zeiss Ltd., Germany) and kept submerged at 32°C in sucrose solution for 20–25 min before transferred to an interface chamber. The sucrose solution contained the following (in mM): sucrose (75), NaCl (87), KCl (2.5), CaCl2 (0.5), MgCl2 (7), NaH2PO4 (1), NaHCO3 (25), glucose (25), pH 7.4, bubbled with 95% O2/5% CO2. Slices were maintained in Earle's balanced salt solution (EBSS, Gibco-Invitrogen, with 3 mM Mg2+ and 1 mM Ca2+) at room temperature (20–25°C) for at least 60 min in an interface chamber (gassed with 95% O2/5% CO2) before starting experiments. Then, slices were placed in a recording chamber (Luigs & Neumann, Germany) mounted on the stage of an upright microscope (Olympus BX51WI, Japan), where they were held under a nylon mesh grid and superfused at a rate of 3–5 mL min−1 with artificial cerebrospinal fluid (ACSF) at 31–33°C. The recording solution contained (in mM): NaCl (119), KCl (2.5), CaCl2 (2.5), MgSO4 (1.3), NaH2PO4 (1.25), NaHCO3 (25), glucose (11); osmolarity 295 mOsm/L and final pH 7.4 (equilibrated with 95% O2/5% CO2). Slices were visualized using a 20× water immersion objective with 2–4× zoom and infra-red differential interference contrast (DIC) optics and camera.
Neurons were filled with neurobiotin (0.2–0.3%) using whole-cell clamp with a solution containing (mM): CsCl (145), HEPES (20), Cs-EGTA (0.2), NaCl (8), Mg-ATP (2), GTP (0.3), QX-314 Br (1), pH 7.2, 290 mOsm/L. Following at least 20 min of filling, the pipette was retracted and the slice was transferred to a perfused (3–5 mL min−1) and heated (30–32°C) submerged chamber for recovery (1 h). Electrophysiological data recorded from some of the ivy cells reported here have been published elsewhere (Szabo et al., 2012).
Tissue Processing and Analysis
The slices were fixed overnight at 4°C in a solution containing 4% paraformaldehyde, 0.05% glutaraldehyde, and ~0.2% picric acid in 0.1 M sodium phosphate buffer (PB) (pH 7.3–7.4) (Oren et al., 2009). The next day, slices were washed thoroughly in 0.1 M phosphate-buffer and stored in PB containing 0.05% sodium azide at 4°C. For re-sectioning, slices were embedded and fixed in 20% gelatin and re-sectioned at 70 μm thickness using a vibrating microtome (Leica VT1000S, Leica Microsystems, Germany). The sections were washed once in 0.1 M PB, and several times in 50 mM Tris-buffered saline (TBS, Sigma, UK) with 0.3% Triton X-100, and then incubated for at least 5 h with Alexa Fluor 488-labeled streptavidin (Invitrogen, UK, diluted 1:2000) in TBS with 0.3% Triton X-100. Sections were mounted in Vectashield (Vector Laboratories, Burlingame, CA, USA) under coverslips. Cells were digitally imaged from two to four 70 μm thick sections using Axio Imager.Z1 epifluorescence microscope (Carl Zeiss Microimaging Gmbh, Germany) with filter set 38HE, 20× (0.8 NA) or 40× (1.3 NA) immersion objectives and AxioVision 4.7.1 software with modules for Multichannel Fluorescent, Mosaic, and Z-stack imaging. Using maximum intensity projection, Z-stacks (step size 1.3 μm) were collapsed and inverted to show cells on white background in ImageJ 1.42 (NIH, USA). To ensure match the eight-bit images were joined with GIMP (GNU Image Manipulation Program) as linked layers. For quantification NeuronJ plugin for ImageJ was used for neurite tracing at a preset pixel width (3 pixels). We observed dye coupling (multiple-cell staining) only in one (k031192) of the 23 studied cells.
Somata were removed from reconstructed images before analysis. The Plot Profile function of ImageJ was used to detect and summate pixels covering the traced axons and dendrites. For binning the images were divided into 10 μm wide horizontal laminae starting from str.oriens/alveus to the distal end of str. lacunosum-moleculare. Horizontal histograms in Figure 1 show pixels over axons and dendrites in each 10 μm bin as proportion of the total number of pixels in all laminae. Since line thickness was uniform in the reconstructed image, the pixel count is an approximate representation of the proportion of the axon or dendrites in the analyzed layers.
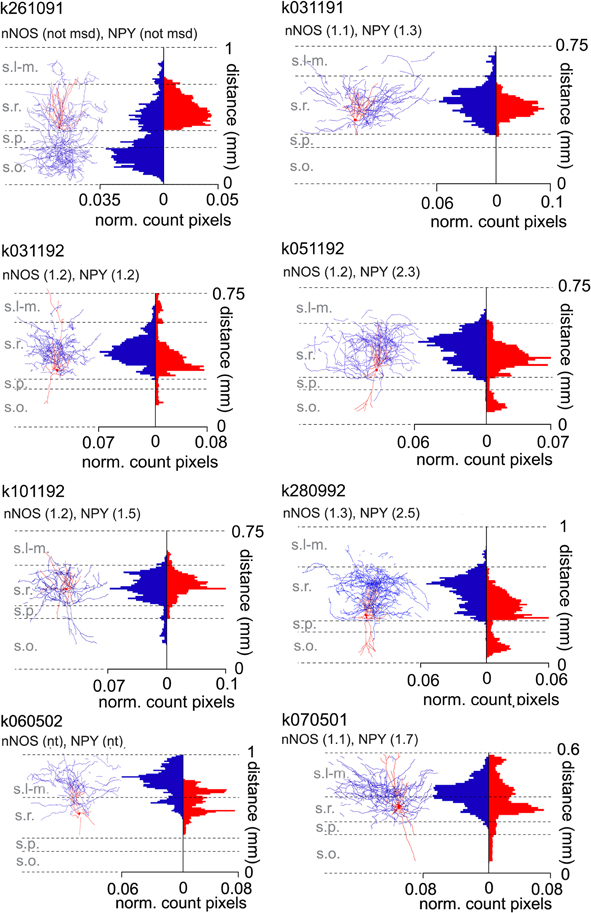
Figure 1. Laminar distribution of axons and dendrites of ivy cells with soma in the CA1 stratum radiatum. Eight reconstructed ivy cells with soma in str. radiatum. Individual images show digital, two-dimensional reconstructions of soma and dendrite (red) and axon (blue) from fluorescence image stacks of 2–4 merged sections, each 70 μm thick. Cell K261091 has most of its axonal arbor in str. oriens, whereas five cells have axon predominantly in str. radiatum and two (k060502, k070501) in strata radiatum and lacunosum-moleculare (s.l-m.). The axons and dendrites of most cells penetrate into s.l-m to a varying extent. The distributions of axons and dendrites in different laminae are illustrated as histograms on the right which show normalized pixel count detected for the axon and dendrites in the two-dimensional representations. Each bar shows proportion of pixels per bin (10 μm); the sum of all bins being 1. Ordinate: radial distance from the alveus towards the hippocampal fissure in mm. The cells were tested for nNOS and NPY immunoreactivity by epifluorescence and/or confocal spectral imaging. Semiquantitative fluorescence analysis values by confocal microscopy are shown above the cells as a ratio of cytoplasmic to neuropil pixel brightness. An arbitrary threshold of 1.5 was set as lower limit to consider a cell immunopositve. Cells showing ratios below 1.5 could either have a reduced immunoreactivity due to dialysis of the cytoplasm during whole-cell recording, or might not express the molecule. Laminae are indicated by abbreviations. not msd, not measured; nt, not tested because of damaged soma.
As layers have different curvatures in different slices, curvatures were digitally flattened to horizontal lines using the curve bend filtering options of the GIMP. This has a small effect on the relative number of pixels. Due to projection onto the X-Y plane, the Z component of fiber lengths was omitted. Because of the square form of pixels, the length of diagonally oriented lines may have been underestimated. Laminar distribution data of ivy cells in Figure 1 were pooled and reported with additional cells in a summary histogram in Szabo et al. (2012).
Immunohistochemistry
Non-specific binding of antibodies was blocked by 20% normal horse serum (NHS, Vector Laboratories, Burlingame, CA, USA) in TBS for 1 h and the sections were incubated in mixtures of appropriate primary antibodies for 48 h at 4°C as described previously (Oren et al., 2009). All antibodies were diluted in TBS containing 0.3% Triton-X and 1% NHS. After washing in TBS, sections were incubated in a mixture of appropriate secondary antibodies conjugated with indocarbocyanine 3 (Cy3) or indodicarbocyanine 5 (Cy5) overnight at 4°C. Sections were then washed in TBS, mounted in Vectashield (Vector Laboratories, Burlingame, CA, USA). Method specificity was tested by omitting the primary antibodies and using the full range of secondary antibodies and imaging parameters as with the full reaction. Under these conditions, no cell specific signal resembling those produced by the primary antibodies was detected. Some autofluorescence was detected (Figure 2), but easily differentiated from the antibody signal. Secondary antibody cross-reactivity was not detected in the tests of applying only one primary antibody with the full range of secondary antibodies and the same imaging conditions for recording as with the full reaction. Selected sections were examined under a confocal laser-scanning microscope using sequential multitrack, single channel operation mode. Hence, only one laser was applied at any one time. Control incubations using two primary antibodies and only one secondary antibody resulted in the detection of only the appropriate primary antibody. When fluorescence was not detectable in the relevant area of the section where similar parts of other non-recorded cells were immunopositive, cells were considered immunonegative. Details of primary antibodies are reported in Table 1. Secondary antibodies were purchased from Jackson ImmunoResearch Lab (Cy3-conjugated products 706165148, 711165152, and 715165151, dilution 1:400; Cy5-conjugated products 706175148 and 711175152, dilution 1:250), and Thermo Scientific (Cy5-conjugated product 33515, dilution 1:250).
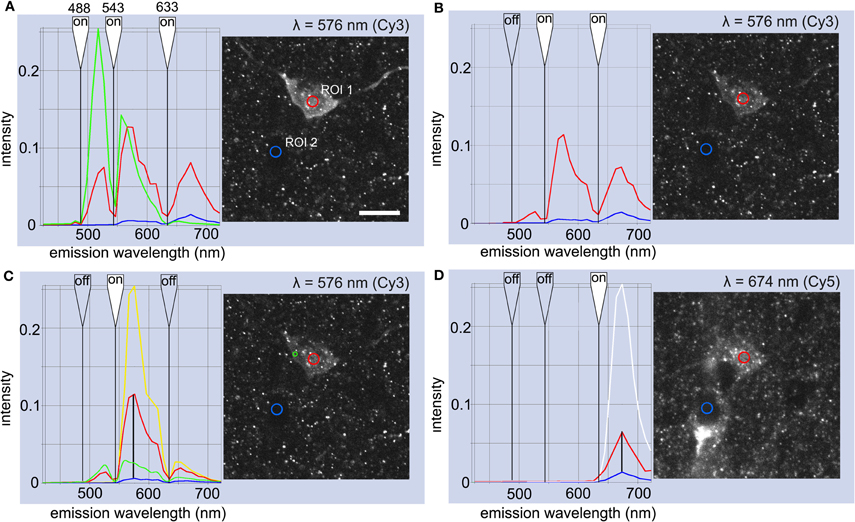
Figure 2. Evaluation of immunoreactions for cytoplasmic nNOS and NPY using semi-quantitative spectral analysis of fluorophore emission in one ivy cell (k111291). Fluorophore-specific spectral peak amplitudes were used to evaluate the specificity of emissions. (A) The red line illustrates emission spectrum from a region of interest (ROI 1) in the cytosol when three lasers are simultaneously activated in a cell reacted with streptavidin-Alexa Fluor 488, Cy3-conjugated secondary antibody testing for nNOS, and Cy5-conjugated secondary antibody testing for NPY. Blue line shows corresponding emission signal from a reference area (ROI 2) in the nucleus of a non-recorded cell nearby. Green line in plot A represents Alexa Fluor 488 emission reference spectrum recorded separately from another section which was labeled only with a secondary antibody-conjugated to Alexa Fluor 488. The sharp drop of signal strength at each laser wavelength (flagged as white indicates “on”) is caused by the triple band primary beam splitter. Ordinate values stand for emission intensity normalized to the maximum (255) in eight-bit images. Micrograph illustrates emission detected in one bin at the maximum wavelength (λ = 576 nm). Scale bar 10 μm. (B) The same cell when the 488 nm laser was switched off showing emission spectra measured in the two ROIs (line colors as in A). (C) Emission spectra from the cytoplasm (red) and reference area (blue) when only the 543 nm laser was activated (yellow line shows the reference emission spectrum of Cy3 fluorophore). Vertical black line at 576 nm points to amplitudes measured in the two ROIs at Cy3 emission peak wavelength. Green line shows emission from another somatic area with non-granular fluorescence pattern. In this area, the 543 nm laser elicits proportionally larger amplitude response in the Alexa-488 emission band, indicating the excitation of the Alexa488 fluorophore. In addition, a significant emission signal may emerge from autofluorescence over a wide range of wavelengths. Note that the amplitude ratios are higher here than in the cells reported in Table 2, because of the very low level of background in the reference area over the nucleus of an unlabeled cell, rather than from neuropil or from the nucleus of the recorded cell. (D) Emission spectrum when the 633 nm laser was activated alone. White line shows the reference emission spectrum from Cy5 measured separately. Vertical black line at 674 nm points to the amplitudes in the two ROIs at the peak emission wavelength of Cy5. Micrograph illustrates emission detected in one bin at the maximum wavelength (λ = 674 nm). The presence or absence of fluorophore-specific emission in the cell can be established, because the emission spectrum of each fluorophore has its characteristic peak at specific wavelength, as seen on both sides of the beam splitter (see green spectral line for Alexa Fluor 488 in A and yellow line for Cy3 in C). Because in spectrum B (red line) the emission amplitude is low at the wavelength of the peak of the emission from Alexa Fluor 488, while it is several times higher at the Cy3-specific emission peak, we can conclude that Cy3 emission provides the bulk of the signal. No significant cross-talk or shine-through from the Alexa Fluor 488 emission contributes to the signal measured from a ROI in the cytoplasm.
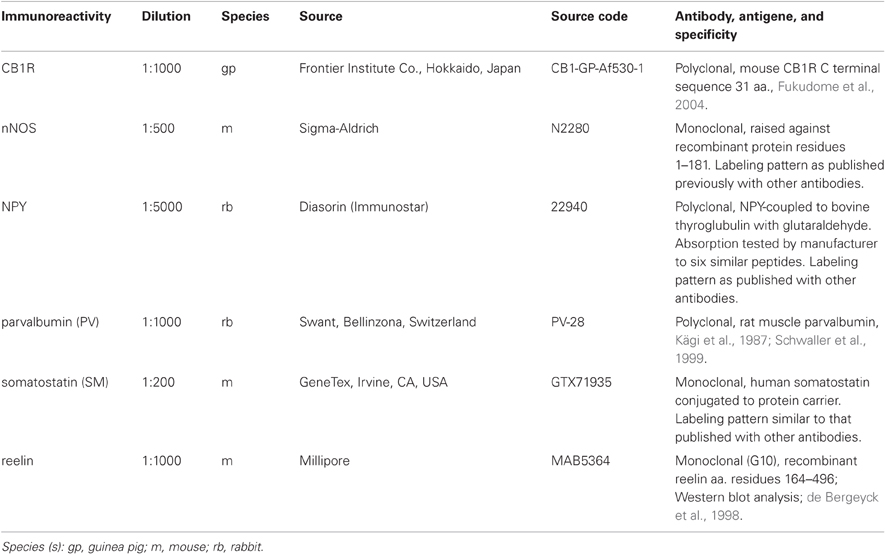
Table 1. Primary antibody list.
Semiquantitative Fluorophore Spectral Analysis (SFSA) of Immunoreaction
Spectral analysis and quantification of fluorophore-specific emissions were used to evaluate specificity of immunoreactions in ivy cells. First, using the QUASAR spectral detector of Zeiss Axio Imager.Z1-LSM 710 confocal microscope, cells were imaged in lambda mode to record emission spectra from 400 to 730 nm (collected in 32 bins, 10.3 nm wide each) using all three lasers individually. Because the emission spectrum of each fluorophore has specific wavelengths, the presence or absence of fluorophore emission can be established in the area. Analysis of the fluorophore-specific wavelengths in the recorded cell cytoplasm and in neuropil were used to test presence of the fluorophore. The ratio values are reported in Table 2 with details on immunoreactions. In some cells the nucleus was damaged by retrieval of the pipette and therefore nuclear analysis was omitted and only cytoplasmic and neuropil values were compared to judge labeling specificity.
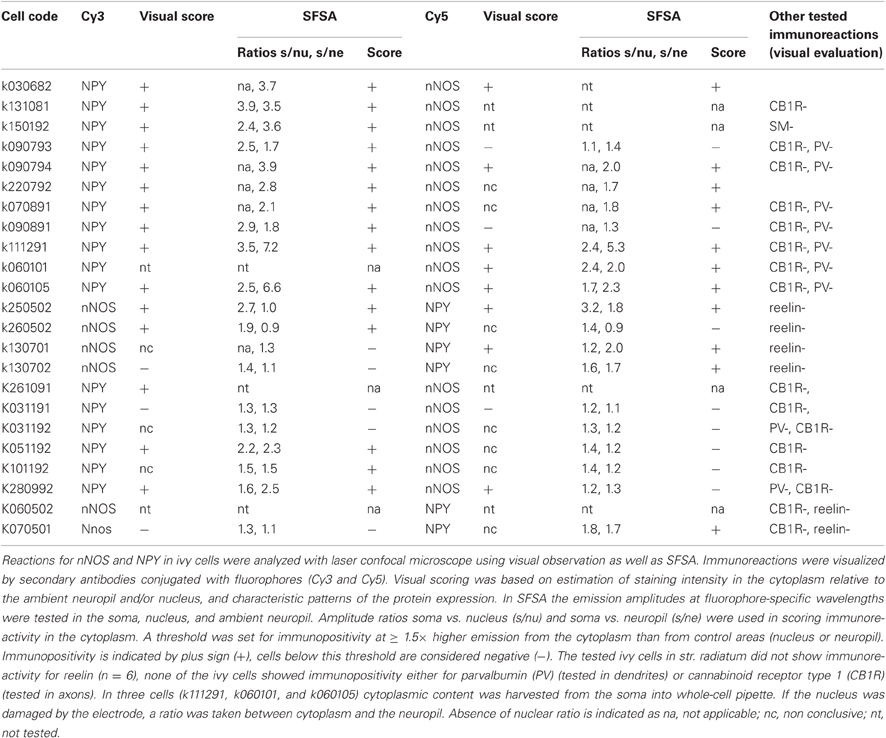
Table 2. Semiquantitive fluorophore spectral analysis results of nNOS and NPY immunoreactions in ivy cells.
Results
We labeled interneurons in the str. radiatum of rat acute hippocampal slices with neurobiotin using the whole-cell recording method. Under visual guidance using infrared-DIC video microscopy, we targetted neurons with small soma characteristic of nNOS- and NPY-expressing neurons (Fuentealba et al., 2008; Karayannis et al., 2010; Tricoire et al., 2010; Krook-Magnuson et al., 2011). Following over-night fixation, slices were re-sectioned to allow full penetration of reagents and cells were visualized with streptavidin-fluorophore conjugate (Oren et al., 2009). Data on some ivy cells presented here have been published recently in Szabo et al. (2012) (see Materials and Methods).
Putative nNOS-expressing neurons were selected by their characteristic dense axon with small boutons (Tamas et al., 2003; Price et al., 2005; Szabadics et al., 2007; Fuentealba et al., 2008; Szabadics and Soltesz, 2009; Karayannis et al., 2010; Somogyi, 2010; Armstrong et al., 2011; Krook-Magnuson et al., 2011). Eight cells were reconstructed for analysis of the laminar distribution of their axons and dendrites (Figure 1).
Axonal and Dendritic Laminar Distribution of ivy Cells with Soma in Stratum Radiatum
To express the laminar distribution of neurites, we counted pixels in digital images of the reconstructed cells. First, streptavidin-Alexa488-visualized neurites were imaged from sections and stacks of pictures were collapsed to two-dimensional digital images. Dendrites and axons identified by visual inspection of the sections were marked with a preset line thickness and the extent of lines was expressed as the number of pixels covering them. Finally, pixel counts in laminae from different sections of a cell were merged.
The distribution of pixels over neurites showed that ivy cells, which had soma in str. radiatum, also had their axons mostly in this layer and to a lesser extent in str. oriens. In addition, the axon of these cells regularly projected to str. lacunosum-moleculare to a small extent (Figure 1). Their dendrites were mostly in str. radiatum, although some penetrated into strata oriens, pyramidale, and lacunosum-moleculare.
Although laminar properties of many cells moderately differ from the ivy cells characterized in or in the vicinity of str. pyramidale, their translaminar axon, and dendrites indicate that they are ivy cells (Fuentealba et al., 2008). The axonal and dendritic distributions of these cells are different from NGC, which are focused on str. lacunosum-moleculare (Price et al., 2005; Capogna, 2011; Maccaferri, 2011).
The two ivy cells in Figure 1 with their somata closest to the border of str. radiatum with str. lacunosum-moleculare had a large proportion of both the axons and dendrites in str. lacunosum-moleculare. Both cells appeared to be negative for reelin, although the negative results can be due to the whole-cell recording conditions. We conclude that laminar distribution of ivy cell somata in the CA1 area extends to distal str. radiatum.
Semi-Quantitative Spectral Analysis of Immunoreactions for nNOS and NPY in ivy Cells
In addition to the cells analyzed above, we labeled 15 ivy cells which had soma and dense axon in str. radiatum. The intracellular recording techniques of the whole-cell method often compromise cytoplasmic protein detection by immunohistochemistry due to the dilution of proteins. In addition, cytoplasm was harvested from the soma of three of the cells into pipette for single-cell RT-PCR analysis reported in Szabo et al. (2012) compromising the detection of the proteins by immunohistochemistry (see Table 2) (Lambolez et al., 1992).
In conventional channel imaging, two fluorophores may be excited simultaneously, one sub-optimally by the laser used in neighboring channels resulting in an excitation crosstalk, which is impossible to separate even by sequential scanning. This poses a problem when the amount of the two fluorophores in a cell are grossly different, like intense AlexaFluor-488 reporting the injected neurobiotin and weak Cy3 signal from immunoreactivity of a diluted cytoplasmic molecule. Similarly, crosstalk may apply if fluorescence is strong in Cy3 channel and weak in Cy5. In order to establish a reproducible lower threshold for immunopositivity, we applied Semi-quantitative Fluorophore Spectral Analysis (SFSA) to quantify immunofluorophore emissions in subcellular domains and to judge immunoreaction quality and specificity.
Peak amplitudes of Alexa Fluor488, Cy3 and Cy5 fluorophore emissions at their specific spectral wavelengths were used to assess specificity for NPY and nNOS immunofluorescence. Firstly, by exciting a fluorophore with its specific laser, the emission spectral profile was recorded from 400 to 730 nm. This was obtained in lambda mode for each fluorophore by stimulating control cells in reference sections containing one of these fluorophores only (e.g., cells filled with neurobiotin and visualized with AlexaFluo 488, but not exposed to any secondary antibodies. Similarly, reference spectra were obtained from Cy3 and Cy5 emissions from sections tested either for nNOS or NPY antibody and their secondary antibody only).
Secondly, the amplitude at each fluorophore's maximum emission wavelength (referred here as a specific lambda wavelength) was obtained in the recorded cell cytoplasm. As an example, when the emission amplitude is low at the wavelength specific to Alexa Fluor 488 when stimulating with 543 nm laser while it is several times higher at the Cy3-specific emission wavelength, we can conclude that the cytosol contains Cy3 emission and no significant cross-talk or shine through from the Alexa Fluor 488 emission contributes to the signal measured.
Thirdly, when the presence of Cy3 or Cy5 fluorophore in the cell was confirmed, we evaluated specificity of the fluorophore-conjugated antibody binding. We compared emission peaks from selected areas in the recorded cell; cytoplasm, nucleus, and ambient neuropil (Figure 2). A signal was considered positive if the fluorophore emission peak amplitude from the cytoplasm was at least 1.5 times larger than from reference areas.
We found that 17 of the 23 ivy cells identified on the basis of their axons were positive for NPY by SFSA and 15 of 23 when scored by visual evaluation only. Correspondingly, nNOS+ was verified in eight cells with SFSA and in seven cells when evaluated visually only (of the 18 cells evaluated with both). All analyzed cells with ratio values and fluorophores are shown in Table 2. In conclusion, SFSA can be used to detect and deal with excitation cross-talk in weak cytoplasmic immunoreactions. This facilitates the recognition of genuine weak signals in a reproducible and quantitative manner.
Discussion
We report here that nNOS-immunopositive and/or NPY GABAergic ivy cell somata are widely distributed in str. radiatum of the rat hippocampal CA1 area. The laminar distribution of ivy cell axons and dendrites varies and this may be related to soma location. Cells characterized in this study had somata, efferent axon, and dendrites predominantly in str. radiatum and the processes regularly penetrated into str. lacunosum-moleculare.
The laminar distribution of axon and dendrites is somewhat different from earlier illustrations of ivy cells with their soma close to str. pyramidale and axon densely innervating both strata oriens and radiatum, but hardly ever penetrating str. lacunosum-moleculare (Fuentealba et al., 2008). This indicates that ivy cells in strata pyramidale and radiatum may be differently connected in the hippocampus. The major proportion of dendritic length in str. radiatum indicates predominant glutamatergic input form the CA3 area pyramidal cells, whereas dendrites in str. oriens receive synapses both form CA3 and CA1 pyramidal cells. Therefore, we suggest that ivy cells in str. radiatum are predominantly involved in feedforward inhibition, whereas ivy cells close to str. pyramidale probably are in addition under feedback influence from CA1 pyramidal cells (Fuentealba et al., 2008; Somogyi, 2010). Moreover, it is likely that many ivy cells in str. radiatum also receive input from the perforant pathway and innervate postsynaptic domains in str. lacunosum-moleculare (Price et al., 2008; Szabo et al., 2012).
Although ivy and NGC share many features, the nNOS and/or NPY-expressing neurons reported here in str. radiatum resemble ivy cells because of their afferent and efferent connections (Armstrong et al., 2011; Capogna, 2011; Maccaferri, 2011). Their dendrites and axon extended from str. oriens and pyramidale to radiatum and lacunosum-moleculare (Szabo et al., 2012). In addition, these cells were different from NGCs immunohistochemically, because they failed to show reelin expression, which is a characteristic of NGC in str. lacunosum-moleculare (Fuentealba et al., 2008; Somogyi, 2010).
Fluorophores with selective binding specificity provide a powerful tool for analysis of localization of biomolecules, but identification of individual fluorophores can be challenging when they have similar localization and strongly overlapping emission spectra (Valm et al., 2011) or when their emission is observed against high fluorescent background (Leavesley et al., 2012). We employed spectral analysis of antibody-conjugated fluorophore emission for neuron type identification. This method allowed us to verify the presence of fluorophores (Cy3 or Cy5) in recorded and labeled cells and to make judgments on emission specificity by comparing emission values in relevant subcellular sites and in control areas. Both nNOS and NPY immunoreactivity is cytoplasmic, probably associated with the Golgi apparatus and secretory granules for NPY and various protein complexes for nNOS. Therefore, nuclear and ambient neuropil areas provide good test for unspecific antibody binding. In this study a ratio of 1.5 was used as a threshold of immunopositivity and specificity of the immunoreactions. However, this value is arbitrary and it is highly possible that future studies with analysis of larger sample pools will show that lower ratios could be used. The major benefit of SFSA is that emission intensities can be measured at selected lambda values for linear unmixing and thus quantifying cross-talk in imaging channels. Furthermore, unmixed values render comparison of staining intensities. We conclude that this SFSA method provides an objective and quantitative way to judge immunohistochemical reactions in subcellular regions where multiple fluorophores need to be tested simultaneously. Based on an algorithm, the analysis improves reproducibility and recognition of genuine positive signals in weak reactions. This approach may be critically important when intracellular recording techniques such as the whole-cell method is used for cell labeling, because these can compromise intracellular protein immunoreaction by dialyzing the cytoplasm.
Conflict of Interest Statement
The authors declare that the research was conducted in the absence of any commercial or financial relationships that could be construed as a potential conflict of interest.
Acknowledgments
Supported by the Wellcome Trust and The John Fell Fund (Andras Szabo, Karri Lamsa), Medical Research Council (Jozsef Somogyi, Peter Somogyi). We thank Dr. Rachel Ingram and Ms. Linda Katona for helpful discussions and comments on the manuscript and Dr. Damien Lapray for microscopic screening of putative ivy cells for axon distribution.
References
Armstrong, C., Szabadics, J., Tamas, G., and Soltesz, I. (2011). Neurogliaform cells in the molecular layer of the dentate gyrus as feed-forward gamma-aminobutyric acidergic modulators of entorhinal-hippocampal interplay. J. Comp. Neurol. 519, 1476–1491.
Capogna, M. (2011). Neurogliaform cells and other interneurons of stratum lacunosum-moleculare gate entorhinal-hippocampal dialogue. J. Physiol. 589, 1875–1883.
Catania, M. V., Tolle, T. R., and Monyer, H. (1995). Differential expression of AMPA receptor subunits in NOS-positive neurons of cortex, striatum, and hippocampus. J. Neurosci. 15, 7046–7061.
de Bergeyck, V., Naerhuyzen, B., Goffinet, A. M., and Lambert de Rouvroit, C. (1998). A panel of monoclonal antibodies against reelin, the extracellular matrix protein defective in reeler mutant mice. J. Neurosci. Methods 82, 17–24.
Fuentealba, P., Begum, R., Capogna, M., Jinno, S., Marton, L. F., Csicsvari, J., Thomson, A., Somogyi, P., and Klausberger, T. (2008). Ivy cells: a population of nitric-oxide-producing, slow-spiking GABAergic neurons and their involvement in hippocampal network activity. Neuron 57, 917–929.
Fukudome, Y., Ohno-Shosaku, T., Matsui, M., Omori, Y., Fukaya, M., Tsubokawa, H., Taketo, M. M., Watanabe, M., Manabe, T., and Kano, M. (2004). Two distinct classes of muscarinic action on hippocampal inhibitory synapses: M2-mediated direct suppression and M1/M3-mediated indirect suppression through endocannabinoid signalling. Eur. J. Neurosci. 19, 2682–2692.
Kägi, U., Berchtold, M. W., and Heizmann, C. W. (1987). Ca2+-binding parvalbumin in rat testis. Characterization, localization, and expression during development. J. Biol. Chem. 262, 7314–7320.
Karagiannis, A., Gallopin, T., David, C., Battaglia, D., Geoffroy, H., Rossier, J., Hillman, E. M., Staiger, J. F., and Cauli, B. (2009). Classification of NPY-expressing neocortical interneurons. J. Neurosci. 29, 3642–3659.
Karayannis, T., Elfant, D., Huerta-Ocampo, I., Teki, S., Scott, R. S., Rusakov, D. A., Jones, M. V., and Capogna, M. (2010). Slow GABA transient and receptor desensitization shape synaptic responses evoked by hippocampal neurogliaform cells. J. Neurosci. 30, 9898–9909.
Krook-Magnuson, E., Luu, L., Lee, S. H., Varga, C., and Soltesz, I. (2011). Ivy and neurogliaform interneurons are a major target of mu-opioid receptor modulation. J. Neurosci. 31, 14861–14870.
Lambolez, B., Audinat, E., Bochet, P., Crépel, F., and Rossier, J. (1992). AMPA receptor subunits expressed by single Purkinje cells. Neuron 9, 247–258.
Leavesley, S. J., Annamdevula, N., Boni, J., Stocker, S., Grant, K., Troyanovsky, B., Rich, T. C., and Alvarez, D. F. (2012). Hyperspectral imaging microscopy for identification and quantitative analysis of fluorescently-labeled cells in highly autofluorescent tissue. J. Biophotonics 5, 67–84.
Maccaferri, G. (2011). Modulation of hippocampal stratum lacunosum-moleculare microcircuits. J. Physiol. 589, 1885–1891.
Oren, I., Nissen, W., Kullmann, D. M., Somogyi, P., and Lamsa, K. P. (2009). Role of ionotropic glutamate receptors in long-term potentiation in rat hippocampal CA1 oriens-lacunosum moleculare interneurons. J. Neurosci. 29, 939–950.
Price, C. J., Cauli, B., Kovacs, E. R., Kulik, A., Lambolez, B., Shigemoto, R., and Capogna, M. (2005). Neurogliaform neurons form a novel inhibitory network in the hippocampal CA1 area. J. Neurosci. 25, 6775–6786.
Price, C. J., Scott, R., Rusakov, D. A., and Capogna, M. (2008). GABA(B) receptor modulation of feedforward inhibition through hippocampal neurogliaform cells. J. Neurosci. 27, 6974–6982.
Schwaller, B., Dick, J., Dhoot, G., Carroll, S., Vrbova, G., Nicotera, P., Pette, D., Wyss, A., Bluethmann, H., Hunziker, W., and Celio, M. R. (1999). Prolonged contraction-relaxation cycle of fast-twitch muscles in parvalbumin knockout mice. Am. J. Physiol. 276, C395–C403.
Somogyi, P. (2010). “Hippocampus: intrinsic organization,” in Handbook of Brain Microcircuits, eds G. M. Shepherd and S. Grillner (New York, NY: Oxford University Press), 148–164.
Szabadics, J., and Soltesz, I. (2009). Functional specificity of mossy fiber innervation of GABAergic cells in the hippocampus. J. Neurosci. 29, 4239–4251.
Szabadics, J., Tamas, G., and Soltesz, I. (2007). Different transmitter transients underlie presynaptic cell type specificity of GABAA, slow and GABAA, fast. Proc. Natl. Acad. Sci. U.S.A. 104, 14831–14836.
Szabo, A., Somogyi, J., Cauli, B., Lambolez, B., Somogyi, P., and Lamsa, K. (2012). Calcium-permeable AMPA receptors provide a common mechanism for LTP in glutamatergic synapses of distinct hippocampal interneuron types. J. Neurosci. 32, 6511–6516.
Tamas, G., Lorincz, A., Simon, A., and Szabadics, J. (2003). Identified sources and targets of slow inhibition in the neocortex. Science 299, 1902–1905.
Tricoire, L., Pelkey, K. A., Daw, M. I., Sousa, V. H., Miyoshi, G., Jeffries, B., Cauli, B., Fishell, G., and McBain, C. J. (2010). Common origins of hippocampal Ivy and nitric oxide synthase expressing neurogliaform cells. J. Neurosci. 30, 2165–2176.
Tricoire, L., Pelkey, K. A., Erkkila, B. E., Jeffries, B. W., Yuan, X., and McBain, C. J. (2011). A blueprint for the spatiotemporal origins of mouse hippocampal interneuron diversity. J. Neurosci. 31, 10948–10970.
Keywords: feedforward inhibition, feedback inhibition, slow GABA action, dendritic modulation, spectral imaging
Citation: Somogyi J, Szabo A, Somogyi P and Lamsa K (2012) Molecular analysis of ivy cells of the hippocampal CA1 stratum radiatum using spectral identification of immunofluorophores. Front. Neural Circuits 6:35. doi: 10.3389/fncir.2012.00035
Received: 02 April 2012; Paper pending published: 12 April 2012;
Accepted: 18 May 2012; Published online: 31 May 2012.
Edited by:
Bruno Cauli, CNRS/Université Pierre et Marie Curie, FranceReviewed by:
Gianmaria Maccaferri, Northwestern University, USALudovic Tricoire, Université Pierre et Marie Curie, France
Copyright: © 2012 Somogyi, Szabo, Somogyi and Lamsa. This is an open-access article distributed under the terms of the Creative Commons Attribution Non Commercial License, which permits non-commercial use, distribution, and reproduction in other forums, provided the original authors and source are credited.
*Correspondence: Karri Lamsa, Department of Pharmacology, Oxford University, Mansfield Road, Oxford OX1 3QT, UK. e-mail: karri.lamsa@pharm.ox.ac.uk