Differences in structural MRI and diffusion tensor imaging underlie visuomotor performance declines in older adults with an increased risk for Alzheimer’s disease
 Alica Rogojin
 Diana J. Gorbet
 Kara M. Hawkins
 Lauren E. Sergio
- 1School of Kinesiology and Health Science, York University, Toronto, ON, Canada
- 2Centre for Vision Research, York University, Toronto, ON, Canada
- 3Vision: Science to Applications (VISTA) Program, York University, Toronto, ON, Canada
Introduction: Visuomotor impairments have been demonstrated in preclinical AD in individuals with a positive family history of dementia and APOE e4 carriers. Previous behavioral findings have also reported sex-differences in performance of visuomotor tasks involving a visual feedback reversal. The current study investigated the relationship between grey and white matter changes and non-standard visuomotor performance, as well as the effects of APOE status, family history of dementia, and sex on these brain-behavior relationships.
Methods: Older adults (n = 49) with no cognitive impairments completed non-standard visuomotor tasks involving a visual feedback reversal, plane-change, or combination of the two. Participants with a family history of dementia or who were APOE e4 carriers were considered at an increased risk for AD. T1-weighted anatomical scans were used to quantify grey matter volume and thickness, and diffusion tensor imaging measures were used to quantify white matter integrity.
Results: In APOE e4 carriers, grey and white matter structural measures were associated with visuomotor performance. Regression analyses showed that visuomotor deficits were predicted by lower grey matter thickness and volume in areas of the medial temporal lobe previously implicated in visuomotor control (entorhinal and parahippocampal cortices). This finding was replicated in the diffusion data, where regression analyses revealed that lower white matter integrity (lower FA, higher MD, higher RD, higher AxD) was a significant predictor of worse visuomotor performance in the forceps minor, forceps major, cingulum, inferior fronto-occipital fasciculus (IFOF), inferior longitudinal fasciculus (ILF), superior longitudinal fasciculus (SLF), and uncinate fasciculus (UF). Some of these tracts overlap with those important for visuomotor integration, namely the forceps minor, forceps major, SLF, IFOF, and ILF.
Conclusion: These findings suggest that measuring the dysfunction of brain networks underlying visuomotor control in early-stage AD may provide a novel behavioral target for dementia risk detection that is easily accessible, non-invasive, and cost-effective. The results also provide insight into the structural differences in inferior parietal lobule that may underlie previously reported sex-differences in performance of the visual feedback reversal task.
1. Introduction
Alzheimer’s disease (AD) is a slowly progressive neurodegenerative disease and the most common cause of dementia in older adults. AD pathology begins several decades before the onset of clinical dementia, and symptoms appear only after there has already been significant damage to the brain (Morris, 2005), which means the assessment of increased dementia risk in the early stages of AD is crucial. Recently published guidelines suggest that effective interventions could be initiated during this early stage of disease progression (Dubois et al., 2016). Even in the absence of effective disease-modifying treatments that prevent neuronal loss and resultant cognitive decline (Vaz and Silvestre, 2020), the early recognition of dementia risk is important for improving patient outcomes now and in the future when effective therapies become available. Current clinical diagnosis of AD involves procedures that can be invasive, expensive, and time-ineffective (such as cerebrospinal fluid analysis, blood tests, and neuroimaging), making their use as frontline screening tools limited. Furthermore, studies have shown that dementia is under-diagnosed in primary care (Connolly et al., 2011; Lang et al., 2017; Amjad et al., 2018) even as the prevalence of AD is projected to rise due to increased life expectancy (Alzheimer’s Association, 2019). A number of medical, environmental, and lifestyle factors have been associated with an increased risk for developing mild cognitive impairment and dementia, some of which include modifiable risk factors such as diabetes, tobacco use, physical inactivity, obesity, and social isolation (Livingston et al., 2020; Litke et al., 2021). These factors highlight the need for the development of a non-invasive and cost-effective assessment tool for those at increased dementia risk. By identifying individuals at a greater risk for developing dementia, healthcare providers can provide evidence-based recommendations on lifestyle changes, interventions, and management of physical and mental health conditions to delay or slow down the progression of AD (World Health Organization, 2019).
As an alternative to current diagnostic tools and procedures, measuring the dysfunction of brain networks underlying visuomotor transformations in early-stage AD may provide a novel behavioral target for dementia risk detection that is easily accessible and cost-effective. Default or “standard” visually-guided arm movements typically involve looking towards the intended target of a reach, followed by an arm movement to the same location (Gielen et al., 1984; Wise et al., 1996; Helsen et al., 1998). For example, reaching directly towards a cup of tea to pick it up. However, many tasks in our everyday lives require us to spatially dissociate the targets of the eye and arm movements, such as during a plane-change or a visual feedback reversal. A common example of a plane-change is using a computer with a mouse or trackpad. Arm movements controlling the mouse or trackpad are made along the horizontal plane in order to move a cursor on the vertical computer screen. An example of a visual feedback reversal is seen when using some computer trackpads, where sliding up on the trackpad scrolls the page down. Another example would be the use of a car’s rear-view camera (or, rear-view mirror) while backing up. To avoid hitting any objects, one must turn the steering wheel leftward in a vertical plane while the object on the screen (or, in the mirror) moves to the right. Here, the plane of limb movement is decoupled from the guiding visual information, and there is a visual feedback reversal as well. These decoupled or “non-standard” visually-guided arm movements require the integration of some form of cognitive information into the visuomotor transformation, and the mapping between the visual stimulus and response must be learned and calibrated (Wise et al., 1996). Some patient populations show an impaired ability to successfully perform non-standard visuomotor tasks, even while their performance on standard mapping tasks remains unaffected. These impairments have been observed in patients with mild cognitive impairment (Salek et al., 2011), in the early stages of dementia due to AD (Tippett et al., 2012; de Boer et al., 2014, 2015, 2016), and in individuals at an increased risk for future dementia (due to a dementia family history, or a genetic risk due to being an APOE e4 carrier) who did not yet show any cognitive deficits (Hawkins and Sergio, 2014; Lu et al., 2021).
Visuomotor integration relies on interconnected brain regions within the frontoparietal network (Wise et al., 1997; Sabes, 2000; Filimon, 2010; Caminiti et al., 2017). There are some areas of activity common to both standard and non-standard visuomotor reaching tasks including the contralateral primary, premotor, and medial motor regions, as well as the postcentral gyrus (Gorbet et al., 2004). Additional brain regions become active during non-standard reaching tasks as visuomotor transformations become increasingly dissociated. These brain areas include the anterior prefrontal cortex, precuneus, and large regions of the occipital lobe for non-standard visuomotor integration involving a plane-change (Gorbet and Sergio, 2018), as well as areas of the premotor, primary motor and somatosensory, posterior parietal, middle occipital, and medial occipital cortices during a visual feedback reversal task (Gorbet and Sergio, 2016). When contrasting a standard task with a non-standard task involving both a feedback reversal and plane-change using a joystick, the non-standard task showed increased activity in the left precuneus, the right superior frontal and middle temporal gyri, and bilaterally in the angular gyri (Gorbet et al., 2004). The precuneus and inferior parietal lobule in particular appear to be important for discriminating between standard and non-standard task conditions (Gorbet and Sergio, 2016, 2018).
Given the known functional substrates of non-standard visuomotor transformations, several white matter tracts that connect these areas of the frontoparietal network may be implicated in visually-guided reaching. The superior longitudinal fasciculus (SLF) has been shown to be important for visuomotor integration (Rodríguez-Herreros et al., 2015; Budisavljevic et al., 2017) and to a lesser extent, the inferior fronto-occipital fasciculus (IFOF) which has been implicated in visuospatial attention and goal-directed behavior (de Schotten et al., 2011;Waller et al., 2017; Herbet et al., 2018). Both the SLF and IFOF have connections with the inferior parietal lobule (de Schotten et al., 2011; Burks et al., 2017), which is one of the regions important for non-standard visuomotor mapping. The inferior longitudinal fasciculus (ILF) runs between the anterior temporal and posterior occipital lobes (Bennett et al., 2012; Wycoco et al., 2013), and is involved in processing visual cues and thus also in visually-guided decisions and goal-oriented behaviors (Waller et al., 2017; Herbet et al., 2018). A meta-analysis reported that the corpus callosum also plays a central role in visuomotor integration, as well as in higher-order cognitive functions such as spatial attention and executive control (Schulte and Müller-Oehring, 2010).
Little evidence exists regarding the role of the medial temporal lobe in visual guidance of movements and in visuomotor or motor tasks. Some areas of the medial temporal lobe have been implicated in visuomotor coordination. The parahippocampal cortex may be an important relay for the transformation between visual inputs and hand kinematics (outputs), and the hippocampus, parahippocampus, and entorhinal cortex appear to encode the position of the hand in space (Tankus and Fried, 2012). The retrosplenial cortex has extensive connections with the parietal cortex (Vann et al., 2009), playing a central role in the coordination of information between internal and external spatial frames of reference (Clark et al., 2018) which is important for visually-guided movements. Although dramatic neuronal loss is not observed in preclinical AD, there is mild grey matter atrophy in areas of the medial temporal lobe including the entorhinal, perirhinal, hippocampal, and parahippocampal cortical regions during this stage (Honea et al., 2009, 2011). There is increasing evidence that hippocampal subregions are differentially affected by AD progression, with the earliest atrophy found in the subiculum and CA1 subfields in preclinical AD (Apostolova et al., 2010; Donix et al., 2010a,b). The CA1 has reciprocal connections with the inferior parietal lobule (Rockland and Van Hoesen, 1999; Clower et al., 2001). The retrosplenial cortex is also affected early in AD progression (Nestor et al., 2003).
Diffusion tensor imaging measures (fractional anisotropy, FA; mean diffusivity, MD; radial diffusivity, RD; and axial diffusivity, AxD) provide information about white matter microstructure and pathology (Song et al., 2002, 2003), and have been used as an index of white matter integrity (Pfefferbaum et al., 2000; Acosta-Cabronero and Nestor, 2014; Molloy et al., 2021). Several studies have suggested that white matter damage may precede grey matter atrophy in AD (Hong et al., 2016; Hoy et al., 2017; Dadar et al., 2020). White matter integrity declines have been found in several major white matter tracts including the corpus callosum, cingulum, SLF, IFOF, ILF, and uncinate fasciculus (UF) in cognitively healthy adults who are APOE e4 carriers and have a parental family history of AD (Bendlin et al., 2010; Gold et al., 2012; Westlye et al., 2012; Adluru et al., 2014). Some of these tracts overlap with those mentioned previously to be involved in visuomotor integration. Known early AD pathology (Thal et al., 2002; Mintun et al., 2006; Pletnikova et al., 2018) and atrophy (Chelat et al., 2010; Jacobs et al., 2011; Doré et al., 2013) in frontal and parietal regions, combined with frontoparietal tract involvement in healthy rule-based visuomotor integration, suggest that reduced communication along these tracts may underlie impaired performance in those at an increased risk for dementia.
In the present study, we first examined whether individuals at an increased risk for AD (due to a family history or a genetic risk) showed grey matter atrophy or declines in white matter integrity in brain regions and tracts typically affected early in disease progression. However, the main objective was to explore the neural underpinnings to previous behavioral findings, where individuals with a positive family history of dementia and APOE e4 carriers demonstrated performance deficits on non-standard visuomotor tasks (Rogojin et al., 2019). There were also sex-related differences in performance of the non-standard visuomotor task involving a feedback reversal. In the current study, we examined the neural anatomy underlying impaired non-standard visuomotor performance, and whether this impairment is affected by family history of AD, APOE e4 status, or sex. We hypothesized a positive relationship between brain structural and white matter integrity measures and visuomotor performance. We predicted grey matter atrophy within the inferior parietal lobule, precuneus, and retrosplenial cortex to be associated with deficits in non-standard visuomotor integration. We were also interested in exploring whether atrophy in the areas of the medial temporal lobe that have been previously implicated in visuomotor coordination would be predictive of worse visuomotor task performance. Based on the importance of the SLF, IFOF, ILF, and corpus callosum in visuomotor integration and goal-directed behavior, we also predicted that white matter integrity declines in these tracts would similarly be associated with declines in non-standard visuomotor integration performance. An exploratory component to the study was to explore the effects of family history, APOE status, and sex on these brain-behavior relationships.
2. Methods
2.1. Participants
Forty-nine right-handed older adults aged 49 to 69 were included in the current study: 25 individuals with a positive family history of dementia but with no cognitive impairment (n = 12 females), and 24 individuals with no family history of dementia (n = 12 females; see Table 1 for demographic information). Classification of a positive family history of dementia was based on self-reported maternal or multiple family history (including at least one first-degree relative) of late-onset AD or probable AD. Cognitive function was measured with the Montreal Cognitive Assessment (MoCA), where scoring at or above education-adjusted norms of 26 or higher indicated no cognitive impairment. A higher risk for AD is associated with a maternal history of dementia, while paternal history does not confer the same increased risk and was therefore not used for high-dementia risk classification (Honea et al., 2010, 2011). Participants were excluded if their parents were deceased at a young age before dementia could be detected, or if the participant was estranged from either of their biological parents and did not know their medical history. Classification of no family history of dementia was based on participants having no family history of AD or any other type of dementia, not demonstrating memory impairments outside of their age range norm, and scoring at or above age-average on the MoCA. Participants with a positive family history of dementia were age-balanced with participants without a family history of dementia. At present, the apolipoprotein E (APOE) e4 allele represents the strongest and best-established genetic risk factor for progression to clinical AD (Reitz and Mayeux, 2014; Dubois et al., 2016). Participants with a family history of dementia or who were APOE e4 carriers were considered at an increased risk for AD. The exclusion criteria included uncorrected visual impairments, upper-limb impairments, any medical conditions that would hinder motor task performance (e.g., severe arthritis or dystonia), neurological illnesses (e.g., Parkinson’s disease, depression, schizophrenia, alcoholism, epilepsy), history of head injury (e.g., mild, severe), stroke, and medical diagnoses that might impact white matter integrity and brain connectivity (i.e., hypertension or diabetes). The study protocol was approved by the Human Participants Review Sub-Committee of York University’s Ethics Review Board.
Table 1. Participant demographic features.
2.2. APOE genotyping
A total of 2 ml of saliva were collected from each participant in microtubes from Diamed Lab Supplies Inc. using collection aids from Cedarlane Labs. Samples were sent to DNA Genotek Inc. (Ottawa, ON, Canada) for DNA extraction and APOE genotyping. DNA was isolated from samples according to the manufacturer’s protocols. Genotyping for APOE involved single nucleotide polymorphism (SNP) genotyping, and tested for SNPs rs429358 and rs7412. The proteins that are produced by the APOE gene are either E2, E3, or E4 combinations (for instance, E2/E3). The breakdown of the APOE genotyping in female participants was as follows: e3/e3 (n = 12), e3/e4 (n = 11). The breakdown of the APOE genotyping in male participants was as follows: e2/e3 (n = 1), e3/e3 (n = 18), e2/e4 (n = 1), e3/e4 (n = 4). One female and one male participant were excluded from statistical analyses looking at the APOE genotype as their genotyping results were inconclusive.
2.3. Behavioral data
2.3.1. Behavioral data acquisition
A detailed description of our visuomotor assessment has been previously published (Rogojin et al., 2019). Briefly, all subjects completed four visuomotor transformation tasks, similar to those previously used by our laboratory (Tippett and Sergio, 2006; Tippett et al., 2007; Salek et al., 2011; Tippett et al., 2012; Hawkins and Sergio, 2014, 2016; Hawkins et al., 2015). These tasks were found to discriminate between women at high- and low-AD risk with a classification accuracy of 86.4% (sensitivity: 81.8%, specificity: 90.9%; Hawkins and Sergio, 2014). The tasks involved making simple sliding finger movements between targets displayed on an Acer Iconia 6,120 dual-touchscreen tablet. These tasks were divided into one standard mapping condition (gaze and movement were coupled) and three different non-standard mapping conditions (gaze and movement were decoupled). In all four conditions, participants were instructed to slide the index finger of their right hand along the touch screen (either the vertical or horizontal screen depending on the condition) in order to displace the cursor from a central target to one of four peripheral targets (up, down, left, right) as quickly and as accurately as possible. In the standard mapping task (S), the spatial location of the visual target and the required hand movement were the same. The non-standard mapping tasks involved the finger movements being made either on a different plane (plane-change, PC), in the opposite direction (feedback reversal, FR), or both (PC + FR), from the spatial target location (see Figure 1A for depictions of all four visuomotor transformation task conditions). Eye movements were the same across all conditions (i.e., always to the guiding visual target on the vertical screen).
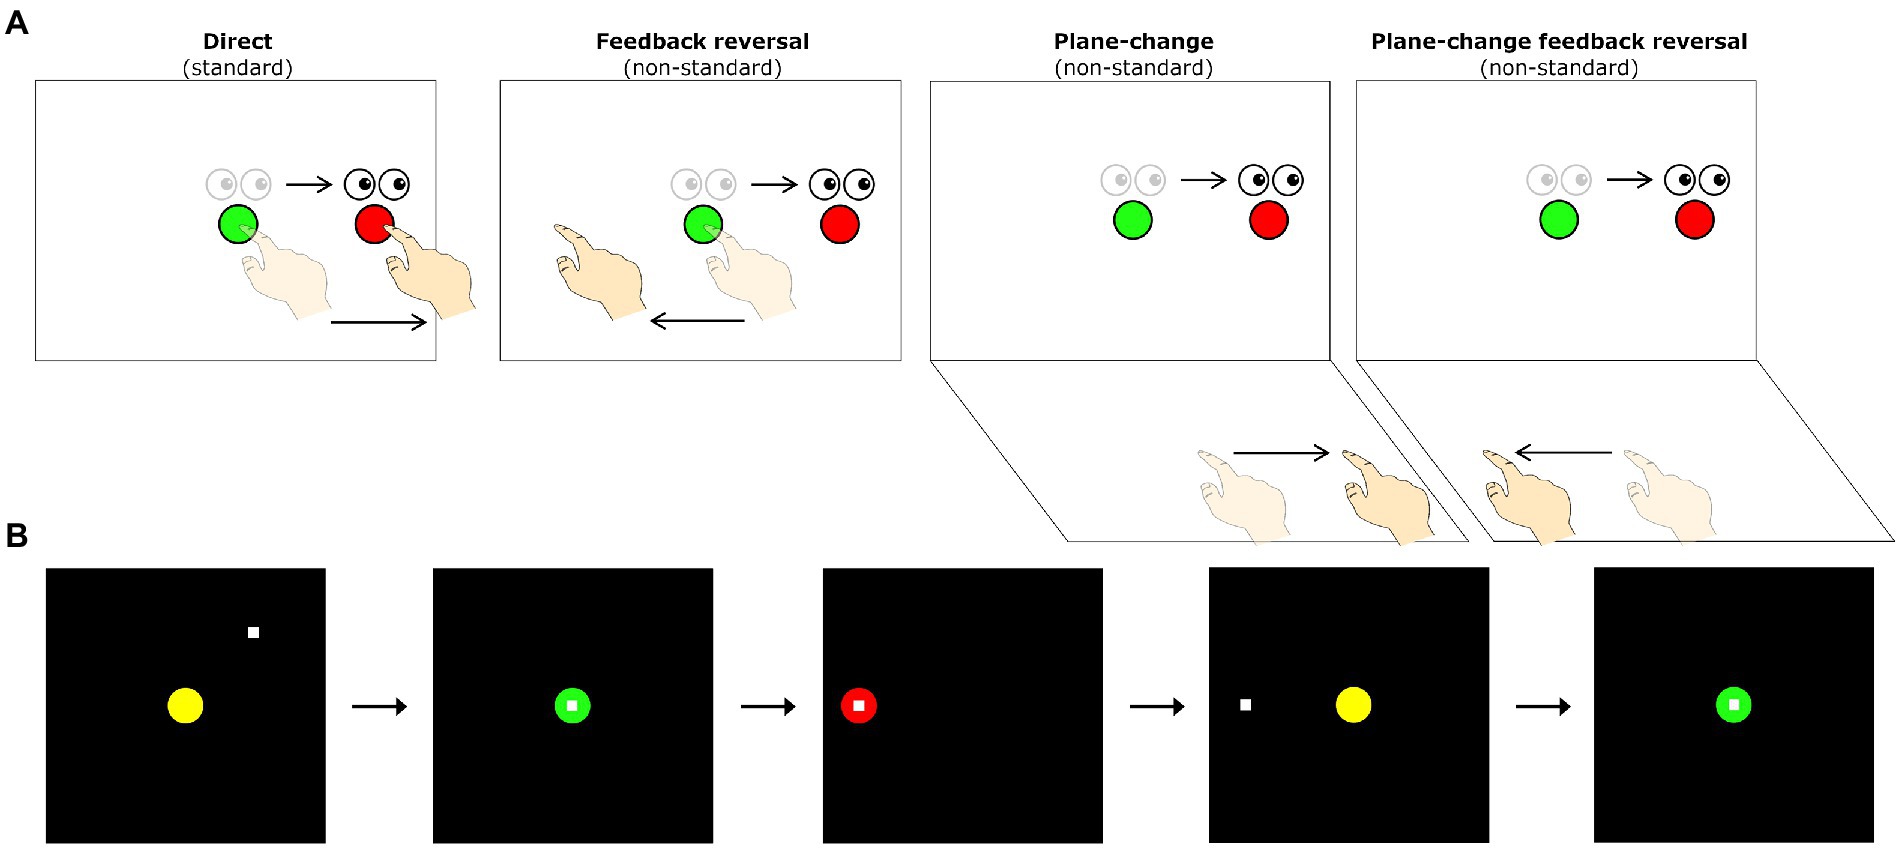
Figure 1. (A) Schematic drawing of the visuomotor task conditions. Lighter eye and hand symbols denote the starting position for each trial (green central target). Darker eye and hand symbols denote the instructed eye and hand movements for each task. Red circles denote the peripheral (reach) target, presented randomly in one of four locations (left, up, right, or down relative to the central target). The direct interaction task requires standard mapping, where participants slide their finger on a touch screen to move a cursor from a central target to one of four peripheral targets. The other three conditions involve non-standard visuomotor integration, where targets either have a 180° feedback reversal (feedback reversal), are spatially dissociated from the plane of hand motion (plane-change), or both (plane-change + feedback reversal). (B) Sequence of events during one trial of the visuomotor task. All trials begin in the central (home) target. Once the participant moves the cursor (denoted by the white square) into the central target, the target changes from yellow to green to signify a movement preparation period. After 4,000 ms, a red peripheral target appears in one of four directions (up, down, left, or right of the center) and serves as the ‘Go’ signal. Once the peripheral target is acquired and held for 500 ms it disappears, signaling the end of the trial. After an inter-trial interval of 2000 ms, the central yellow target reappears, and the participant moves back to the central target to initiate the next trial.
The four conditions were presented in randomized blocks, each consisting of five pseudo-randomly presented trials to each of the four peripheral targets. Peripheral targets were located 75 mm from the central target, with target diameters set to 20 mm. The tasks were displayed on a 170 × 170 mm black square and a surrounding grey background. There was a total of 20 trials per condition, and thus each participant completed a total of 80 trials across the four conditions. To ensure task comprehension, each participant was given two practice trials per peripheral target prior to each of the four conditions. The trial timings and participant movements consisted of the following steps: (1) a yellow central (home) target was presented on the vertical tablet, (2) participants moved a white cursor to the central target, changing its color to green once they reached it, (3) after holding the central target for 4,000 ms, one of four red peripheral targets appeared and the central target disappeared, serving as the ‘Go’ signal for initiation of a movement, (4) participants were told to look towards the visual target and slide their finger along the touchscreen to direct the cursor towards the target, (5) once the peripheral target was reached and the participant held it for 500 ms, it disappeared, signaling the end of the trial, (6) the next trial began with the presentation of the central target after an inter-trial interval of 2000 ms (see Figure 1B for visual representations of a single trial completion).
In the standard condition, participants were asked to slide their finger directly to the target on the vertical screen (the cursor was directly under their finger). In the PC condition (non-standard), participants needed to move on the horizontal screen while looking at the vertical screen in order to direct the cursor towards the visual target displayed on the vertical screen. In the FR condition (non-standard), the cursor moved in the opposite direction of the participant’s finger movements, requiring them to slide their finger on the vertical screen away from the visual target in order to move the cursor towards it. Finally, in the PC + FR condition (non-standard), movements needed to be made in the opposite direction and on a different plane from the visual target in order to direct the cursor towards it.
2.3.2. Behavioral data preprocessing
Kinematic measures, including timing, finger position (x, y coordinates; 50 Hz sampling rate), and error data were recorded for each trial and converted into a MATLAB readable format using a custom written (C++) application. Custom analysis software (Matlab, Mathworks Inc.) was used to process individuals’ finger trajectories with a fourth-order (dual pass) low-pass Butterworth filter at 10 Hz. Finger trajectories were generated from these filtered paths for each successful trial and displayed on a Cartesian plot illustrating finger location data superimposed on central and peripheral target locations. Movement onsets and ballistic movement offsets (the initial movement prior to any corrective movements) were scored at 10% peak velocity. Total movement offsets were scored as the final 10% peak velocity point once the finger position was within the correct peripheral target. If the initial movement successfully resulted in the finger reaching the peripheral target, then ballistic and total movement offsets were the same. These movement profiles were then verified by visual inspection, and manually corrected when necessary. Unsuccessful trials (error data) were detected by the data collection software by meeting the following criteria: finger left the home target too early (<4,000 ms), reaction time (RT) was <150 or >8,000 ms, or total movement time was >10,000 ms. Trials in which the first ballistic movement exited the boundaries of the central target in the wrong direction (>90o in either direction from a straight line to the target) were coded as direction reversals. Direction reversals were not included in metrics from correct trials, but instead were analyzed as a separate variable. All scored data were then processed to compute 7 different timing, accuracy, and precision measures described below. Any trials exceeding 2 standard deviations from the participant’s mean for any of the outcome measures were eliminated from final outcome calculations.
The kinematic outcome measures were as follows: (1) Reaction time (RT), the time interval (in ms) between the central target disappearance and movement onset; (2) Full movement time (MTf), the time (in ms) between movement onset and offset; (3) Peak velocity (PV), the maximum velocity obtained during the ballistic movement, and used to calculate the 10% threshold used for determining movement onsets and offsets; (4) Path length (PL), the total distance (in mm, calculated from the x and y trajectories) travelled between movement onset and offset; (5) Absolute error (AE), a measure of end-point accuracy, and the average distance (in mm) from the individual ballistic movement endpoints (∑ x/n, ∑ y/n) to the actual target location; (6) Variable error (VE), a measure of end-point precision, and the distance (in mm) between the individual ballistic movement endpoints (σ) from their mean movement; and (7) Direction reversals (DR), recorded as a percentage of total completed trials. Corrective path length (CPL) represents corrective movements and was quantified by subtracting the PLb (initial movement offset) from the PLf (full movement offset).
2.4. Magnetic resonance imaging
2.4.1. Image acquisition
MRI data were acquired using a 3 Tesla (3 T) Siemens Trio scanner at York University. Participants received a T1-weighted anatomical scan using a sagittal volumetric magnetization-prepared rapid gradient echo (MP-RAGE) sequence. The MP-RAGE consisted of the following acquisition parameters: 192 sagittal slices (slice thickness of 1 mm, with no gap), field of view (FOV) of 256 × 256 mm, matrix size of 256 × 256 resulting in a voxel resolution of 1 × 1 × 1 mm, echo time (TE) = 2.96 ms, repetition time (TR) = 2,300 ms, flip angle = 9o. The MP-RAGE scan was used to quantify grey matter volume and thickness. For assessing white matter integrity, a whole-brain diffusion-weighted scan was acquired with 64 encoding directions using diffusion-weighted spin-echo single-shot echo planar imaging. The diffusion tensor imaging (DTI) sequence used the following acquisition parameters: 56 axial slices (slice thickness of 2 mm, with no gap), FOV of 192 × 192 mm, matrix size of 128 × 128 resulting in a voxel resolution of 1.5 × 1.5 × 2.0 mm, TE = 86 ms, TR = 6,900 ms, b-value = 1,000 s/mm2 (including one volume with no diffusion gradient, b = 0 s/mm2).
2.4.2. Structural MRI
Preprocessing: The cortical surface was reconstructed using FreeSurfer 7.1 (Harvard Medical School, Boston, United States; https://surfer.nmr.mgh.harvard.edu/) with individual T1-weighted MR images serving as input. The main Freesurfer reconstruction pipeline (“recon-all”) was used to parcellate and segment the brain into anatomically distinct regions of the cortex and subcortical nuclei, respectively. Visual inspection of each participant’s parcellation and segmentation was performed to ensure that there were no obvious errors.
Grey matter volume and thickness (Figures 2A,B): Volume and thickness measures for the precuneus, inferior parietal lobule, and parahippocampal cortex were obtained from the Desikan-Killiany atlas (Desikan et al., 2006) used in recon-all. Volume and thickness measures for the entorhinal cortex and perirhinal cortex were obtained from the cytoarchitecturally-defined ex vivo labels in FreeSurfer. The retrosplenial cortex was defined as the posterior-ventral part of the cingulate gyrus, or the isthmus of the cingulate gyrus, from the Destrieux atlas (Destrieux et al., 2010) used in recon-all. The posterior-ventral part of the cingulate gyrus provides a mask slightly larger than Brodmann areas 29 and 30 (i.e., the retrosplenial cortex proper; Shine et al., 2016; Calati et al., 2018).
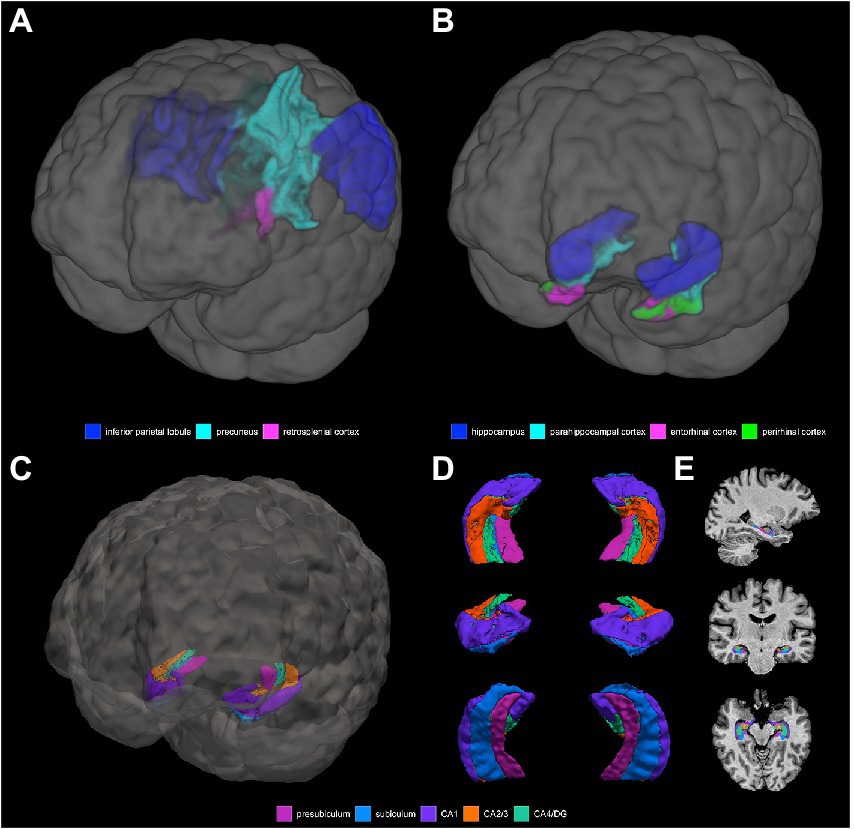
Figure 2. 3D depictions of (A) areas important for non-standard visuomotor integration, and (B) areas of the medial temporal lobe, used for grey matter volume and cortical thickness analyses. Hippocampal subfields obtained from FreeSurfer segmentation and used for analysis are shown in (C) a 3D brain, (D) 3D superior, anterior, and inferior views, and (E) sagittal, coronal, and axial slices.
Hippocampal subfield segmentation (Figures 2C–E): Segmentation of the hippocampus into its subfields was performed with the FreeSurfer hippocampal module using the T1-weighted volumes processed with recon-all (Iglesias et al., 2015). This tool uses a probabilistic atlas constructed from ex vivo MRI data and a separate in vivo MRI dataset to automatically segment the hippocampal substructures. The resultant hippocampal subfields are the parasubiculum, presubiculum, subiculum, CA1, CA2/3, CA4/dentate gyrus (DG), molecular layer, fimbria, hippocampal fissure, hippocampus-amygdala-transition-area (HATA), and hippocampal tail. Visual inspection of each participants’ hippocampal subfield segmentation was performed to ensure that there were no obvious errors, with the caveat that precise visualization of the distinct subfield boundaries at the spatial resolution used in this study is difficult. The following subfields were excluded: the parasubiculum (volume of <100 μl and may be more prone to noise), the molecular later (at risk of partial volume effects), HATA (volume of <100 μl and may be more prone to noise), fimbria (thin white matter whose segmentation is less reliable and is at risk of partial volume effects), the hippocampal fissure (a sulcus containing a thin layer of cerebrospinal fluid, rather than a hippocampal substructure exactly, whose segmentation is less reliable), and the hippocampal tail (a region where the subfields are not histologically distinct and discernible from each other; Van Leemput et al., 2009; Kühn et al., 2012; Iglesias et al., 2015; Parker et al., 2019). The following 5 subfields were therefore used for the final analysis: the presubiculum, the subiculum, CA1, CA2/3, and CA4/DG.
Intracranial volume adjustment: Intracranial volume (ICV) adjustment is an important step as it takes individuals’ variations in head size into account (i.e., the confound that subjects with large ICV and/or of younger age would be expected to have a larger hippocampus). ICV was calculated from the T1-weighted images using Statistical Parametric Mapping (SPM) 12 software. The hippocampal subfield, parahippocampal, entorhinal, perirhinal, precuneus, inferior parietal lobule, and retrosplenial cortical volumes of interest (VOI) were ICV-corrected using the residuals method. This method was originally described by (Mathalon et al., 1993) and it aims to remove the ICV-VOI relationship. The residuals method obtains estimates of the ICV-VOI regression model parameters based on information solely from the control group, and these estimates are then used to compute residuals for the entire dataset (O’Brien et al., 2011). The assumption behind this method is that the regression slope β is representative of a non-pathological relationship between VOI and ICV (Voevodskaya, 2014). Thus, in studies where there is suspected brain atrophy (e.g., due to having a family history of dementia and being APOE e4-positive), the VOI-ICV regression line is calculated from controls (i.e., for the current study, controls are individuals who do not have a family history of dementia and who are also APOE-e4 non-carriers). Cortical thickness was not normalized as thickness measures do not scale linearly with head size.
2.4.3. Diffusion-weighted imaging
Preprocessing: T1-weighted images for each participant were aligned into AC-PC space to provide a common orientation for brain visualization and tractography. This alignment involved manually defining several anatomical landmarks in the T1 images: the AC (anterior commissure), the PC (posterior commissure), and the mid-sagittal plane. Diffusion-weighted images were preprocessed in FMRIB’s Software Library (FSL) using FMRIB’s Diffusion Toolbox (FDT) for eddy current correction and head motion correction. The preprocessed diffusion-weighted images and the ACPC-aligned T1-weighted images were then input into the automated fiber quantification (AFQ) software (Yeatman et al., 2012). AFQ, a software package implemented in MATLAB, was used to identify the core of 20 major white matter tracts in each subject’s brain and then quantified the tissue properties of voxels near the core of the estimated tracts (Yeatman et al., 2012). The AFQ procedure is based on a combination of the methods described by (Hua et al., 2008) and (Zhang et al., 2008), and can be summarized in 6 steps: (1) Whole-brain tractography is done for each subject, where all fibers are tracked with a white matter mask defined as all the voxels with an FA value >0.3; (2) Fiber tract segmentation is performed based on the waypoint ROI procedure described in (Wakana et al., 2007). Fibers are assigned as candidates to a specific fiber tract if they pass through two waypoint ROIs that define the central portion of the tract; (3) Fiber tract refinement involves scoring each candidate fiber based on its similarity to a standard fiber tract probability map from (Hua et al., 2008). Fibers with high probability scores are retained, thus defining the fiber tract core; (4) Fiber tract cleaning filters out stray fibers that deviate substantially from the core of a fiber group represented as a 3-dimensional Gaussian distribution; (5) Fiber tract clipping to the central portion that spans between the two defining ROIs for that tract; and finally (6) Fiber tract quantification to calculate diffusion measures at 100 equidistant nodes along the trajectory of the fiber group. The diffusion measures are calculated at each node by taking the weighted average of each fiber making up the tract based on its distance from the tract core. Thus, the AFQ pipeline produces a set of “tract profiles” that measure the tissue properties (FA, RD, AxD, and MD) at equidistant sample positions (100 nodes were used for our analysis) from the start to the end of the tract core. There is one profile for each tract and tissue property combination (e.g., FA along the inferior fronto-occipital fasciculus). The 20 fiber tracts identified with AFQ are: bilateral anterior thalamic radiation, bilateral corticospinal tract, bilateral cingulum cingulate, bilateral cingulum hippocampus, callosum forceps minor, callosum forceps major, bilateral inferior fronto-occipital fasciculus, bilateral inferior longitudinal fasciculus, bilateral superior longitudinal fasciculus, bilateral uncinate fasciculus, and bilateral arcuate fasciculus (Hua et al., 2008). The literature has shown that the cingulum bundle, corpus callosum, inferior fronto-occipital fasciculus, inferior longitudinal fasciculus, superior longitudinal fasciculus, and uncinate fasciculus are affected early in AD progression. The corpus callosum, inferior fronto-occipital fasciculus, inferior longitudinal fasciculus, and superior longitudinal fasciculus have also been implicated in non-standard visuomotor transformations. We excluded the cingulum hippocampus which could not be properly tracked and was missing diffusion measures in over 5 subjects. The following 12 tracts of interest were therefore used in the final analysis: left (n = 47) and right (n = 46) cingulum cingulate (CGC), callosum forceps minor (n = 49), callosum forceps major (n = 49), left (n = 48) and right (n = 47) inferior fronto-occipital fasciculus (IFOF), left (n = 48) and right (n = 49) inferior longitudinal fasciculus (ILF), left (n = 49) and right (n = 48) superior longitudinal fasciculus (SLF), and left (n = 48) and right (n = 49) uncinate fasciculus (UF; Figure 3).
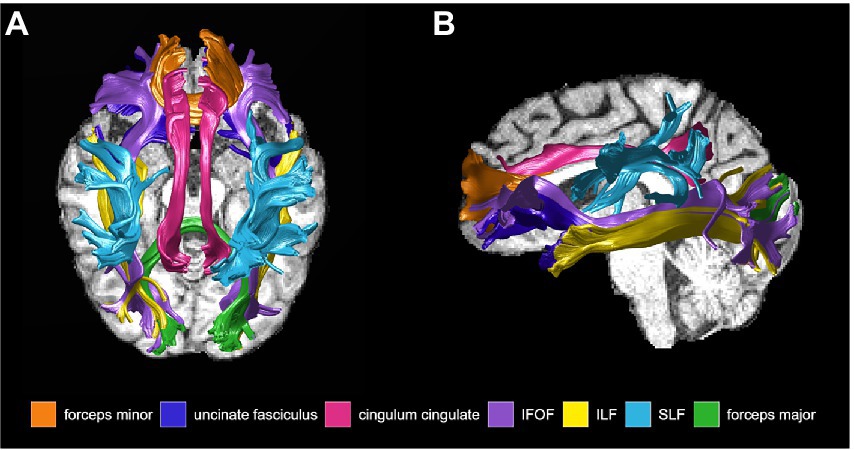
Figure 3. White matter tracts of interest obtained from Automated Fiber Quantification software and used for analysis, shown in (A) sagittal, and (B) axial view. IFOF, inferior fronto-occipital fasciculus; ILF, inferior longitudinal fasciculus; SLF, superior longitudinal fasciculus.
2.5. Statistical analysis
All statistical analyses were carried out using open-source R software v4.1.0 (R Core Team, 2021). All participant groups were age-balanced, with no statistically significant differences in age observed between individuals with vs. without a family history of dementia (p = 0.87), APOE e4 positive vs. e4 negative participants (p = 0.64), and female vs. male participants (p = 0.82). There were also no statistically significant differences observed between groups on MoCA scores (FH+ vs. FH− p = 0.58; e4+ vs. e4− p = 0.74; female vs. male p = 0.20), years of education (FH+ vs. FH− p = 0.57; e4+ vs. e4− p = 0.15; female vs. male p = 0.54), computer experience (FH+ vs. FH− p = 0.36; e4+ vs. e4− p = 0.51; female vs. male p = 0.46), and touchscreen experience (FH+ vs. FH− p = 0.92; e4+ vs. e4− p = 0.62; female vs. male p = 0.55).
2.5.1. Differences In structural MRI and DTI measures between groups
Three-way ANOVAs were used to compare differences in structural MRI and DTI measures between three groups: (1) individuals with a family history of dementia and individuals without a family history of dementia, (2) females and males, and (3) APOE e4 carriers and non-carriers. Specifically, the neuroimaging measures being compared were (1) grey matter volumes of the hippocampal subfields, parahippocampal cortex, entorhinal cortex, perirhinal cortex, retrosplenial cortex, inferior parietal lobule, and precuneus, (2) grey matter thickness of the parahippocampal cortex, entorhinal cortex, perirhinal cortex, retrosplenial cortex, inferior parietal lobule, and precuneus, and (3) mean diffusivity measures (i.e., FA, MD, RD, AxD) across the white matter tracts of interest. Post-hoc analyses were adjusted for multiple comparisons using the Holm correction method. Corrections were considered statistically significant at an alpha of p < 0.05.
2.5.2. Effects of structural MRI and DTI measures on visuomotor performance
Some of the kinematic measures were combined into composite scores to decrease the number of comparisons made in the data analysis, and the procedure was previously described in detail (Rogojin et al., 2019). Briefly, all kinematic measures were standardized using z-scores and composite scores were then created using simple averaging. The timing score was a composite score of RT, MTf, and PV, and the endpoint error score was a composite score of AE and VE. The Cronbach’s alpha values for the timing and endpoint error scores were 0.897 and 0.772, respectively, indicating a high internal consistency.
Multiple regression analyses previously revealed both sex and family history as significant predictors of greater endpoint error scores (indicative of worse visuomotor performance) in the visual feedback reversal condition. The regression analyses also provided preliminary evidence that having an APOE e4 allele was a significant predictor of greater endpoint error scores in the plane-change feedback reversal condition, and greater corrective path lengths (indicative of worse visuomotor performance) in both plane-change conditions. Based on these previous behavioral findings, the current study used multiple linear regression analysis to explore whether visuomotor performance declines are associated with grey and white matter structural neuroimaging measures. The white matter tracts of interest were the cingulum cingulate, callosum forceps minor, callosum forceps major, IFOF, ILF, SLF, and UF. The grey matter regions of interest were the retrosplenial cortex, inferior parietal lobule, and precuneus, all shown to be involved in visually-guided reaching. Regression models were set up with grey or white matter measures as the predictor variable, visuomotor performance measures as the dependent variable, and were controlled for (1) sex and family history in the feedback reversal condition, and (2) APOE e4 status in the two plane-change conditions. The p-values were adjusted for multiple comparisons using the Holm correction method and were considered statistically significant at p < 0.05. For example, the regression models in the plane-change feedback reversal condition were set up as follows:
where: Y is the continuous dependent variable,
X is the continuous independent variable,
Z is the dichotomous independent variable,
X*Z is the interaction term calculated as X multiplied by Z,
β0 is the intercept,
β1 is the effect of X on Y,
β2 is the effect of Z on Y, and.
β3 is the effect of XZ on Y.
A sample model looking at whether FA in the right ILF is predictive of endpoint error scores in the plane-change feedback reversal condition, moderated by APOE e4 status:
If a significant moderated relationship has been identified (i.e., significant interaction X*Z), we used simple slopes analysis to examine the effects of X on Y within the individual levels of Z. A simple slope is the regression of Y on X at a specific value of Z. In this study, all moderator variables (family history of dementia, sex, and APOE e4 status) were binary - therefore, we tested the regression of Y on X at 0 (no family history, female, APOE e4 non-carrier) and 1 (family history of dementia, male, APOE e4 carriers). Simple slopes analysis was used to determine whether either of the slopes differed significantly from zero (the horizontal).
3. Results
3.1. Grey matter volume and thickness
There was a significant main effect of family history on retrosplenial cortical volume (Figure 4A), where individuals with a family history of dementia had lower grey matter volumes in the left retrosplenial cortex compared to individuals without a family history of dementia (F1,43 = 6.903, p < 0.05). There was a significant main effect of family history on parahippocampal cortical volume (Figure 4B), where individuals with a family history of dementia had greater grey matter volumes in the right parahippocampal cortex compared to individuals without a family history of dementia (F1,43 = 14.2647, p < 0.01). Conversely, there was a significant main effect of APOE status on parahippocampal cortical volume (Figure 4C), where APOE e4 carriers had lower grey matter volumes in the right parahippocampal cortex compared to individuals without an APOE e4 allele (F1,43 = 5.4288, p < 0.05). Lastly, there was a significant main effect of sex on inferior parietal lobule thickness (Figure 4D), where males had lower cortical thickness in the left inferior parietal lobule compared to females (F1,43 = 10.1512, p < 0.01). There were no statistically significant differences between (1) positive and negative family history, (2) females and males, and (3) APOE e4 carriers and non-carriers found for grey matter volume or thickness in the hippocampal subfields, entorhinal cortex, and perirhinal cortex.
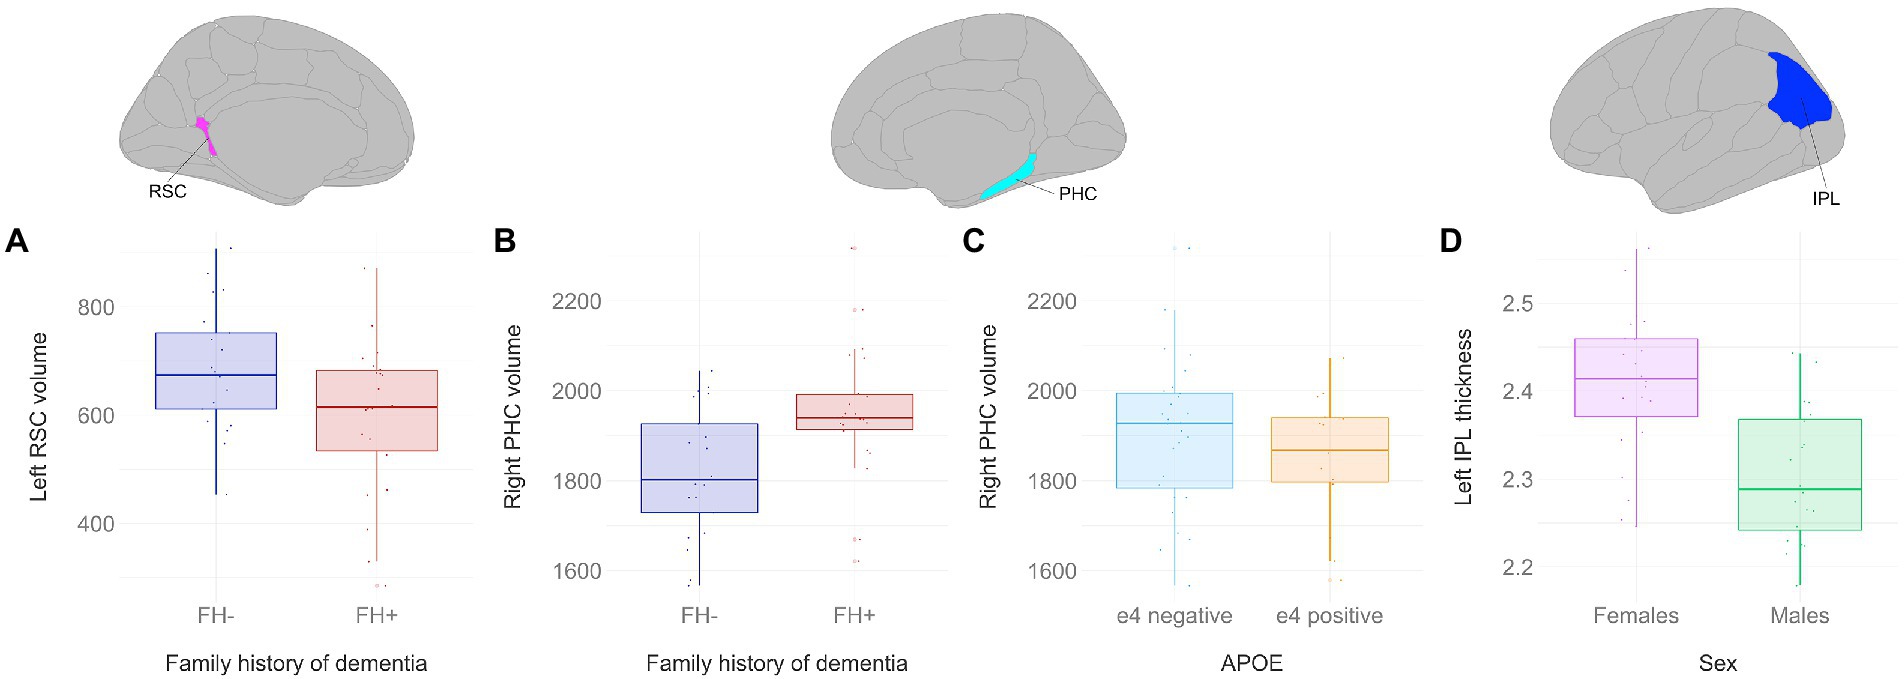
Figure 4. Grey matter volume and thickness differences between participant groups. Significant results shown from three-way ANOVAs. Individuals with a family history of dementia had (A) lower left retrosplenial volumes (F1,43 = 6.903, p < 0.05), but (B) greater right parahippocampal volumes compared to individuals without a family history of dementia (F1,43 = 14.2647, p < 0.01). (C) APOE e4 carriers had lower right parahippocampal volumes compared to non-carriers (F1,43 = 5.4288, p < 0.05). (D) Males had lower cortical thickness in the left inferior parietal lobule compared to females (F1,43 = 10.1512, p < 0.01). Brain figures made with “ggseg” R package (Mowinckel and Vidal-Piñeiro, 2020). RSC, retrosplenial cortex; PHC, parahippocampal cortex; IPL, inferior parietal lobule; FH+, positive family history of dementia; FH−, no family history of dementia; APOE, apolipoprotein E.
3.2. Relationship between grey matter measures and non-standard visuomotor performance
There were no significant interaction effects between the inferior parietal lobule, precuneus, or restrosplenial cortex and family history, sex, or APOE status in the multiple regression models that were based on previous behavioral findings. Multiple linear regression analyses revealed that presubiculum, subiculum, and parahippocampal volumes, as well as entorhinal cortical thickness were predictors of visuomotor performance in several of the non-standard conditions.
Hippocampal subfields (Figures 5A–C): There was a significant interaction effect of left presubiculum volume and sex (β = −0.054317, p < 0.05) on endpoint error scores in the feedback reversal condition. The results of the regression indicated that the predictors explained 35.8% of variance (R2adj = 0.3584, F5,39 = 5.915, p < 0.001). Simple slopes analysis showed that smaller left presubiculum volume was a significant predictor of greater endpoint error scores only in males (simple slope = −0.06, S.E. = 0.02, p < 0.01). There was a significant interaction effect between right presubiculum volume and APOE status (β = 0.042356, p < 0.01) on corrective path length in the plane-change condition, where the two predictors explained 43.1% of variance (R2adj = 0.4312, F3,39 = 11.61, p < 0.0001). Simple slopes analysis showed that larger left presubiculum volume was a significant predictor of greater corrective path length only in APOE e4 carriers (simple slope = 0.04, S.E. = 0.01, p < 0.01). There was a significant interaction effect between right subiculum volume and APOE status (β = 0.02861, p < 0.05) on corrective path length in the plane-change condition, where the two predictors explained 32.5% of variance (R2adj = 0.3248, F3,39 = 7.736, p < 0.001). Simple slopes analysis showed that larger right subiculum volume was a significant predictor of greater endpoint error scores only in APOE e4 carriers (simple slope = 0.02, S.E. = 0.01, p < 0.01).
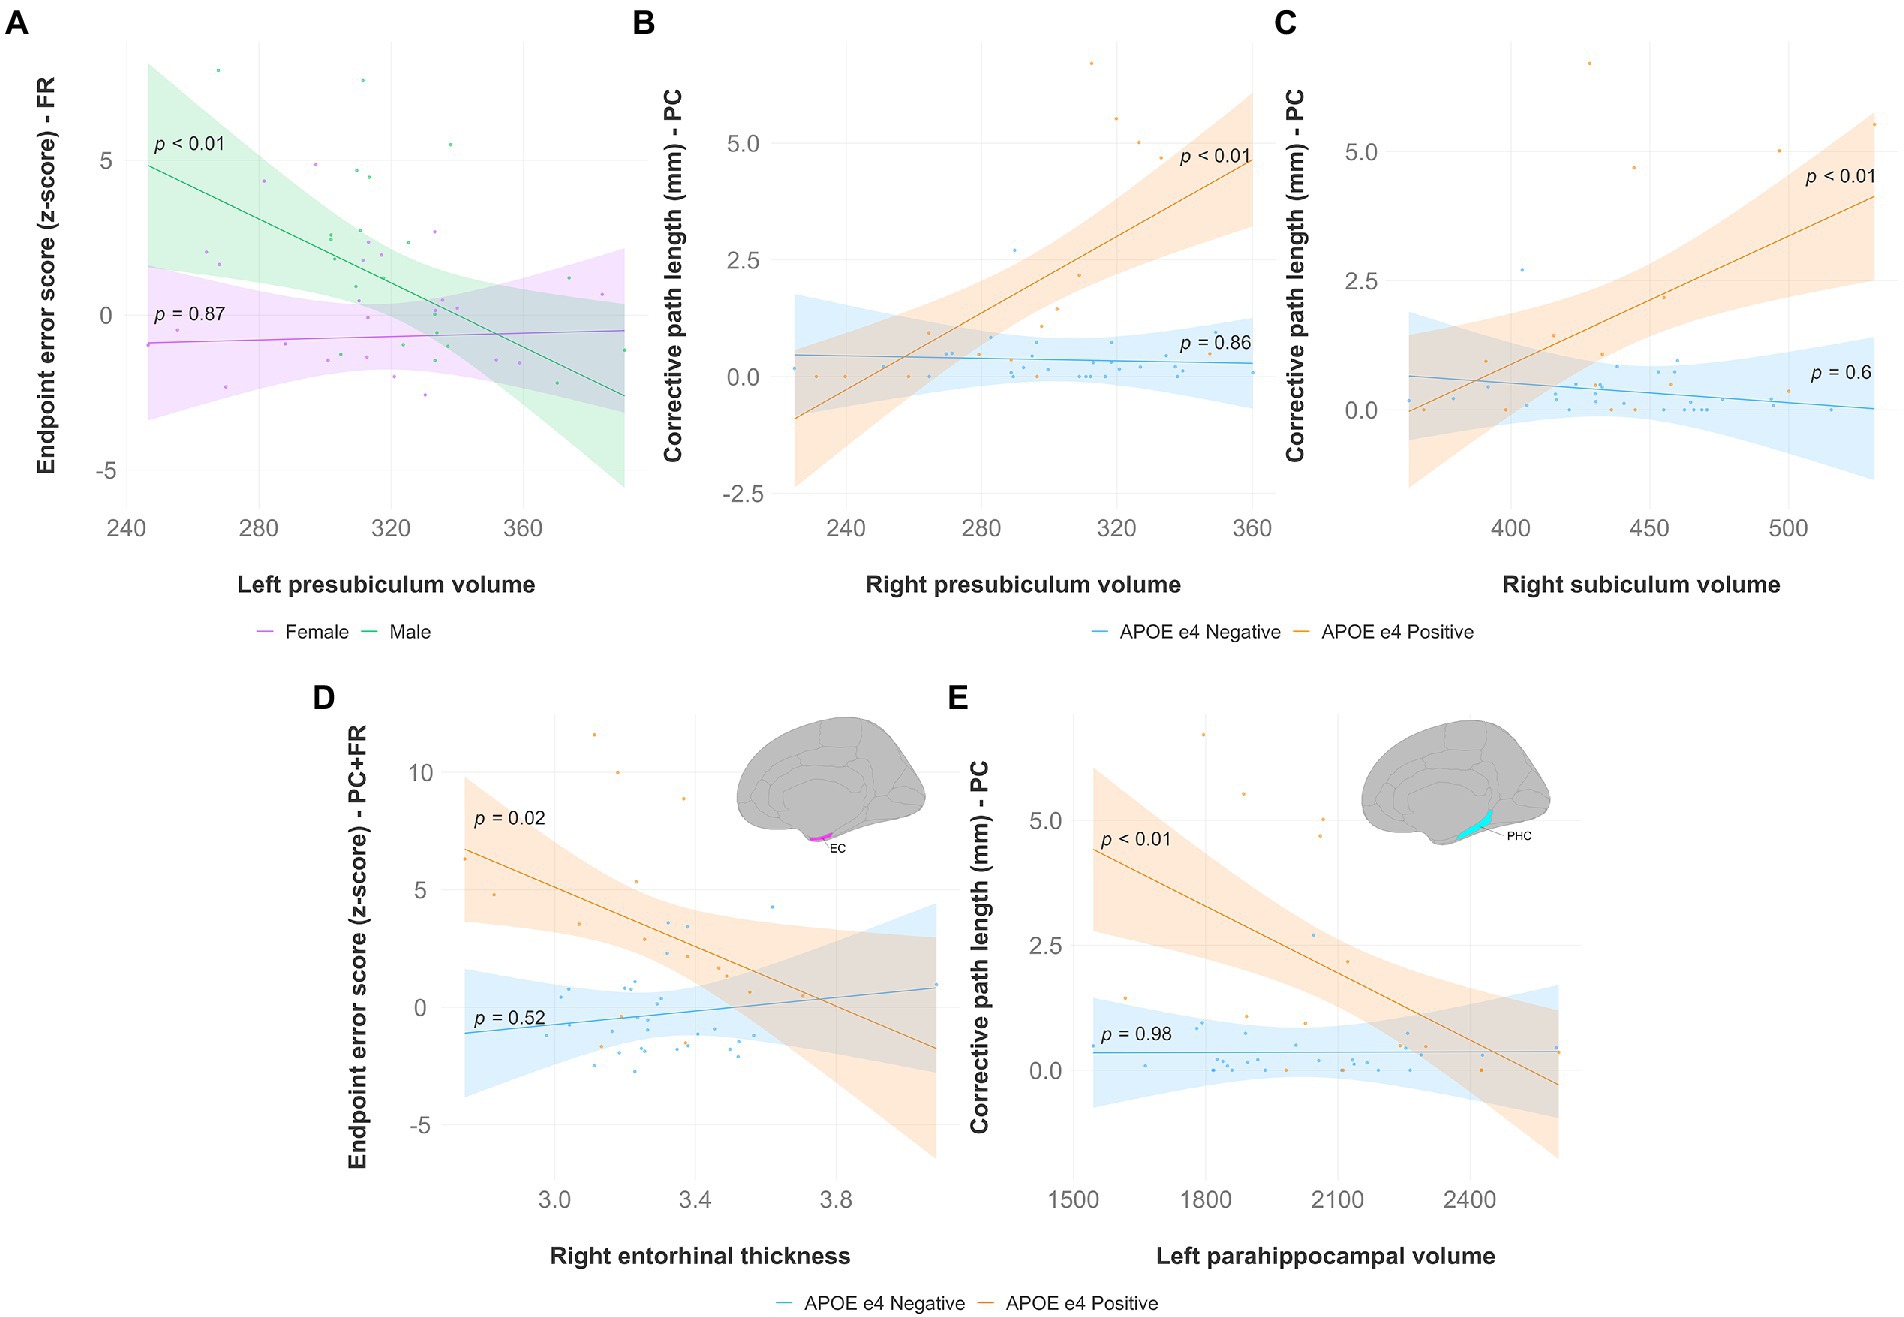
Figure 5. Significant results from hippocampal subfield, entorhinal, and parahippocampal multiple regression and simple slopes analyses. Top panel (A,B,C): Hippocampal subfield volumes predict non-standard visuomotor task performance in the feedback reversal and the plane-change conditions. (A) Higher endpoint error scores, reflecting worse visuomotor performance, were associated with smaller left presubiculum volumes (simple slope = −0.06, S.E. = 0.02, p < 0.01) only in males. Higher corrective path lengths, reflecting worse visuomotor performance, were associated with (B) greater right presubiculum volume (simple slope = 0.04, S.E. = 0.01, p < 0.01), and (C) greater right subiculum volume (simple slope = 0.02, S.E. = 0.01, p < 0.01) only in APOE e4 carriers. Bottom panel (D,E): Entorhinal thickness and parahippocampal volume predict non-standard visuomotor task performance. (D) Higher endpoint error scores, reflecting worse visuomotor performance, were associated with lower right entorhinal cortical thickness in the plane-change feedback reversal condition (simple slope = −6.32, S.E. = 2.70, p = 0.02) only in APOE e4 carriers. (E) Higher corrective path lengths, reflecting worse visuomotor performance, were associated with lower left parahippocampal volume in the plane-change condition (simple slope = −0.004, S.E. = 0.001, p < 0.01) only in APOE e4 carriers. Brain figures made with “ggseg” R package (Mowinckel and Vidal-Piñeiro, 2020). EC, entorhinal cortex; PHC, parahippocampal cortex; FR, feedback reversal; PC, plane-change; PC + FR, plane-change feedback reversal; APOE, apolipoprotein E.
Entorhinal cortex (Figure 5D): There was a significant interaction effect of right entorhinal thickness and APOE status (β = −7.759, p < 0.05) on endpoint error scores in the plane-change feedback reversal condition. The results of the regression indicated that the predictors explained 34.8% of variance (R2adj = 0.3479, F3,43 = 9.181, p < 0.0001). Simple slopes analysis showed that smaller right entorhinal thickness was a significant predictor of greater endpoint error scores only in APOE e4 carriers (simple slope = −6.32, S.E. = 2.70, p = 0.02).
Parahippocampal cortex (Figure 5E): There was a significant interaction effect of left parahippocampal volume and APOE status (β = −0.0044851, p < 0.05) on corrective path length in the plane-change condition. The results of the regression indicated that the predictors explained 35.2% of variance (R2adj = 0.3519, F3,39 = 8.601, p < 0.001). Simple slopes analysis showed that smaller left parahippocampal volume was a significant predictor of greater corrective path length only in APOE e4 carriers (simple slope = −0.004, S.E. = 0.001, p < 0.01). There was also a significant interaction effect of left parahippocampal volume and APOE status (β = −0.02192, p < 0.05) on corrective path length in the plane-change feedback reversal condition. The results of the regression indicated that the predictors explained 36.2% of variance (R2adj = 0.3616, F3,43 = 9.686, p < 0.0001), however simple slopes analysis was not significant, indicating that APOE e4 carriers and non-carriers were significantly different from each other but not from zero.
3.3. Diffusion measures
There were no statistically significant differences between (1) positive and negative family history, (2) females and males, and (3) APOE e4 carriers and non-carriers found for any of the diffusion measures in the major white matter tracts.
3.4. Relationship between diffusion measures and non-standard visuomotor performance
Multiple linear regression analyses revealed that lower FA, higher MD, higher RD, and higher AxD were significant predictors of worse visuomotor performance only in the plane-change feedback reversal condition. Simple slopes analyses revealed that the relationship between the diffusion measures and visuomotor performance was only statistically significant in APOE e4 carriers (summarized in Table 2).
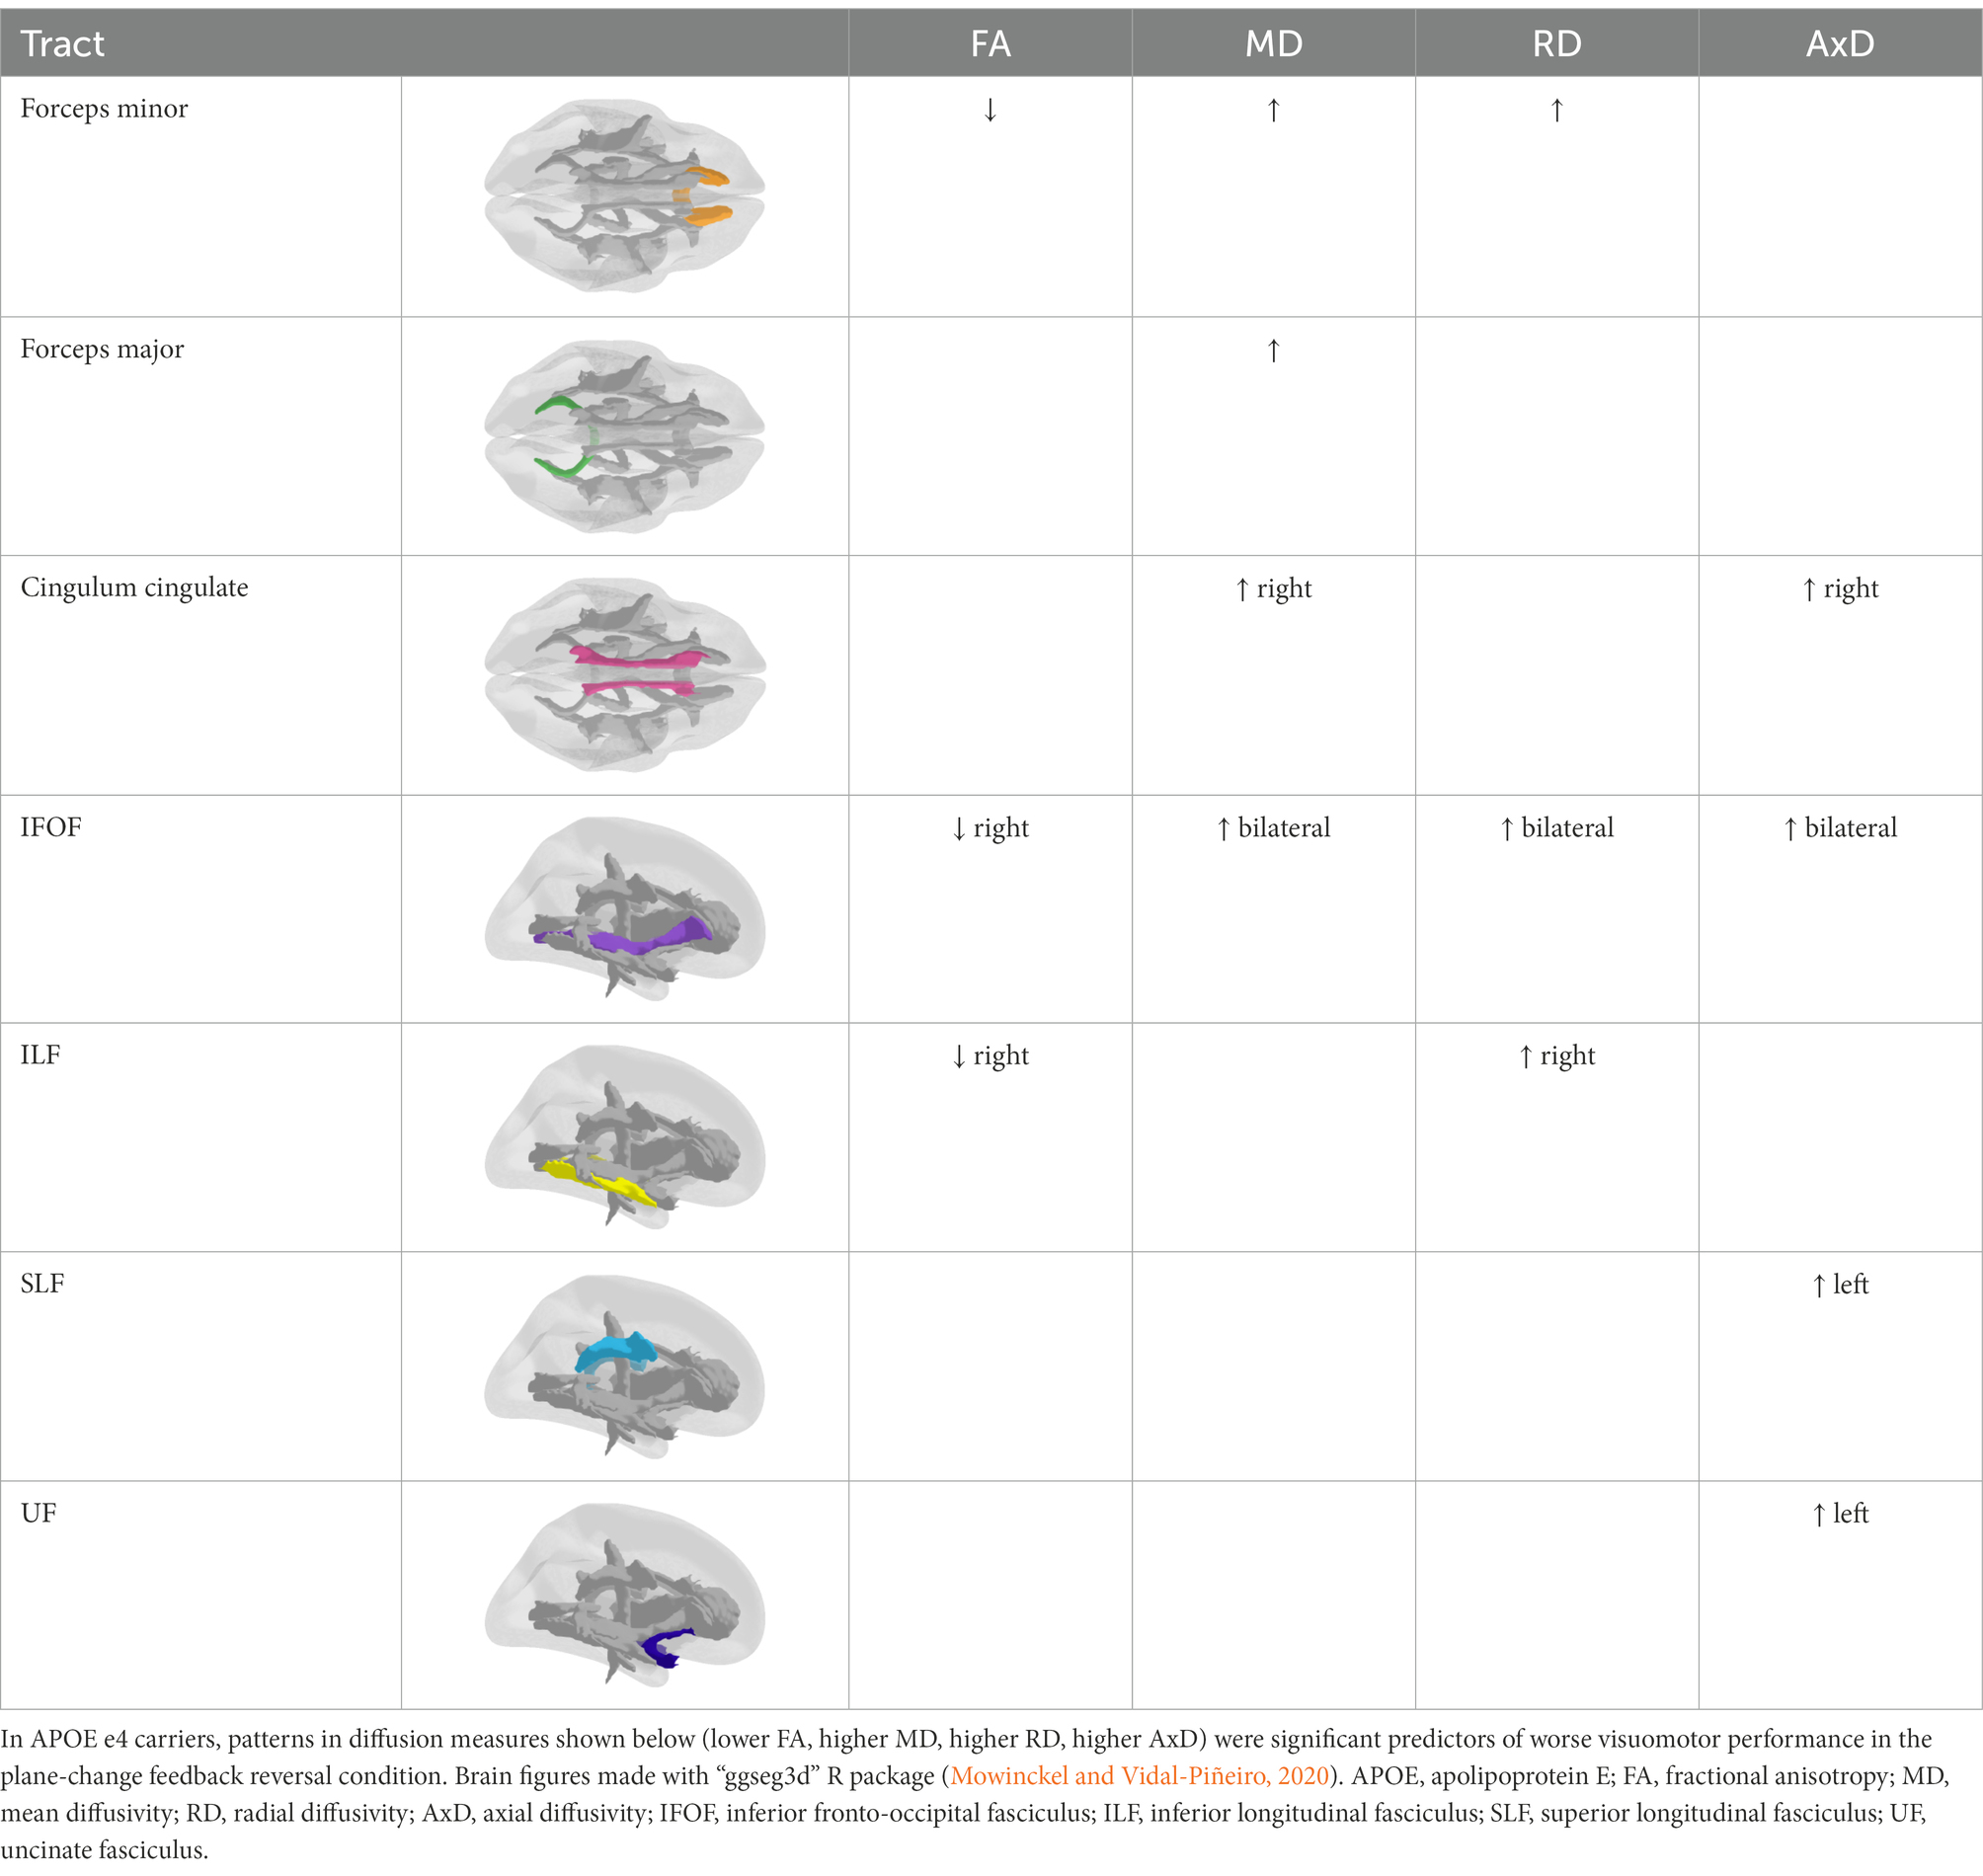
Table 2. Summary of DTI findings by tract.
Specifically, lower FA was associated with worse non-standard visuomotor performance in the forceps minor, right IFOF, and right ILF (Figure 6). Higher MD was associated with worse non-standard visuomotor performance in the right cingulum cingulate, forceps major, forceps minor, and bilateral IFOF (Figure 7). Higher RD was associated with worse non-standard visuomotor performance in the forceps minor, bilateral IFOF, and right ILF (Figure 8). Higher AxD was associated with worse non-standard visuomotor performance in the right cingulum cingulate, bilateral IFOF, left SLF, and left UF (Figure 9). Lower FA, higher MD, higher RD, and higher AxD are typically associated with damaged or impaired fiber integrity due to aging or disease pathology (Beaulieu et al., 1996; Davis et al., 2009; Acosta-Cabronero et al., 2010; Salat et al., 2010; Zhang et al., 2010; Bosch et al., 2012; Soares et al., 2013; Doan et al., 2017; Mayo et al., 2019; Bigham et al., 2020). Previous studies in preclinical Alzheimer’s populations found similar patterns of changes in diffusion measure of white matter in the same tracts (Bendlin et al., 2010; Gold et al., 2012; Westlye et al., 2012; Adluru et al., 2014), some of which overlap tracts important for visuomotor integration, namely the SLF, IFOF, ILF, and corpus callosum. Our findings support our hypothesis that white matter integrity declines in these tracts would be associated with declines in non-standard visuomotor integration performance. The statistics for these multiple linear regressions can be found in the Supplementary material.
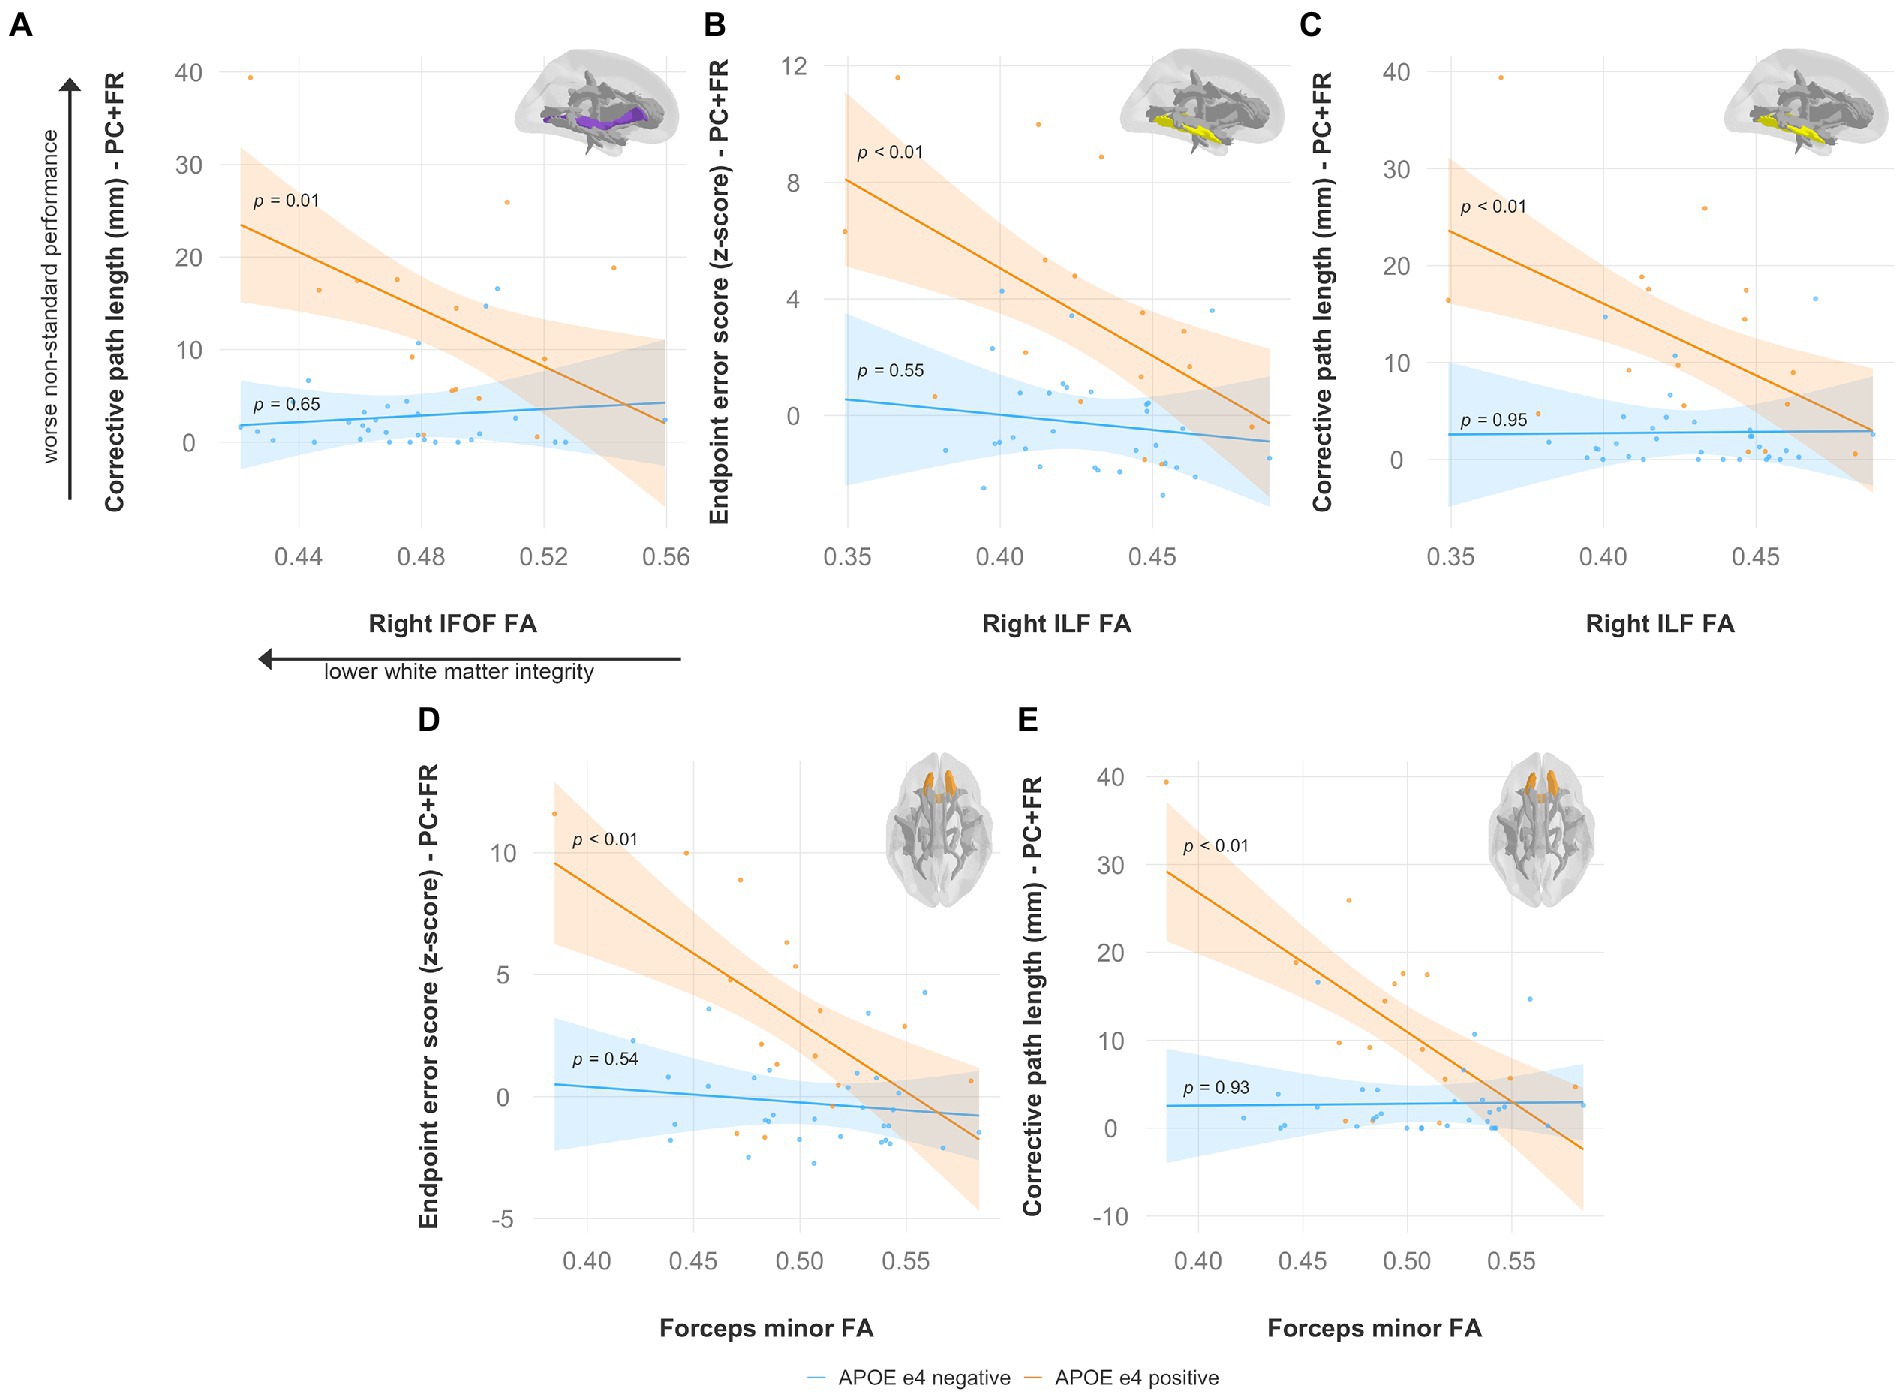
Figure 6. Lower fractional anisotropy predicts worse visuomotor performance (reflected by higher endpoint error scores or corrective path lengths) in the plane-change feedback reversal condition only in APOE e4 carriers in several major white matter tracts, including the (A) right IFOF, (B,C) right ILF, and (D,E) forceps minor. Significant results shown from multiple regression and simple slopes analyses. Brain figures made with “ggseg” R package (Mowinckel and Vidal-Piñeiro, 2020). PC + FR, plane change feedback reversal condition; APOE, apolipoprotein E; FA, fractional anisotropy; IFOF, inferior fronto-occipital fasciculus; ILF, inferior longitudinal fasciculus.
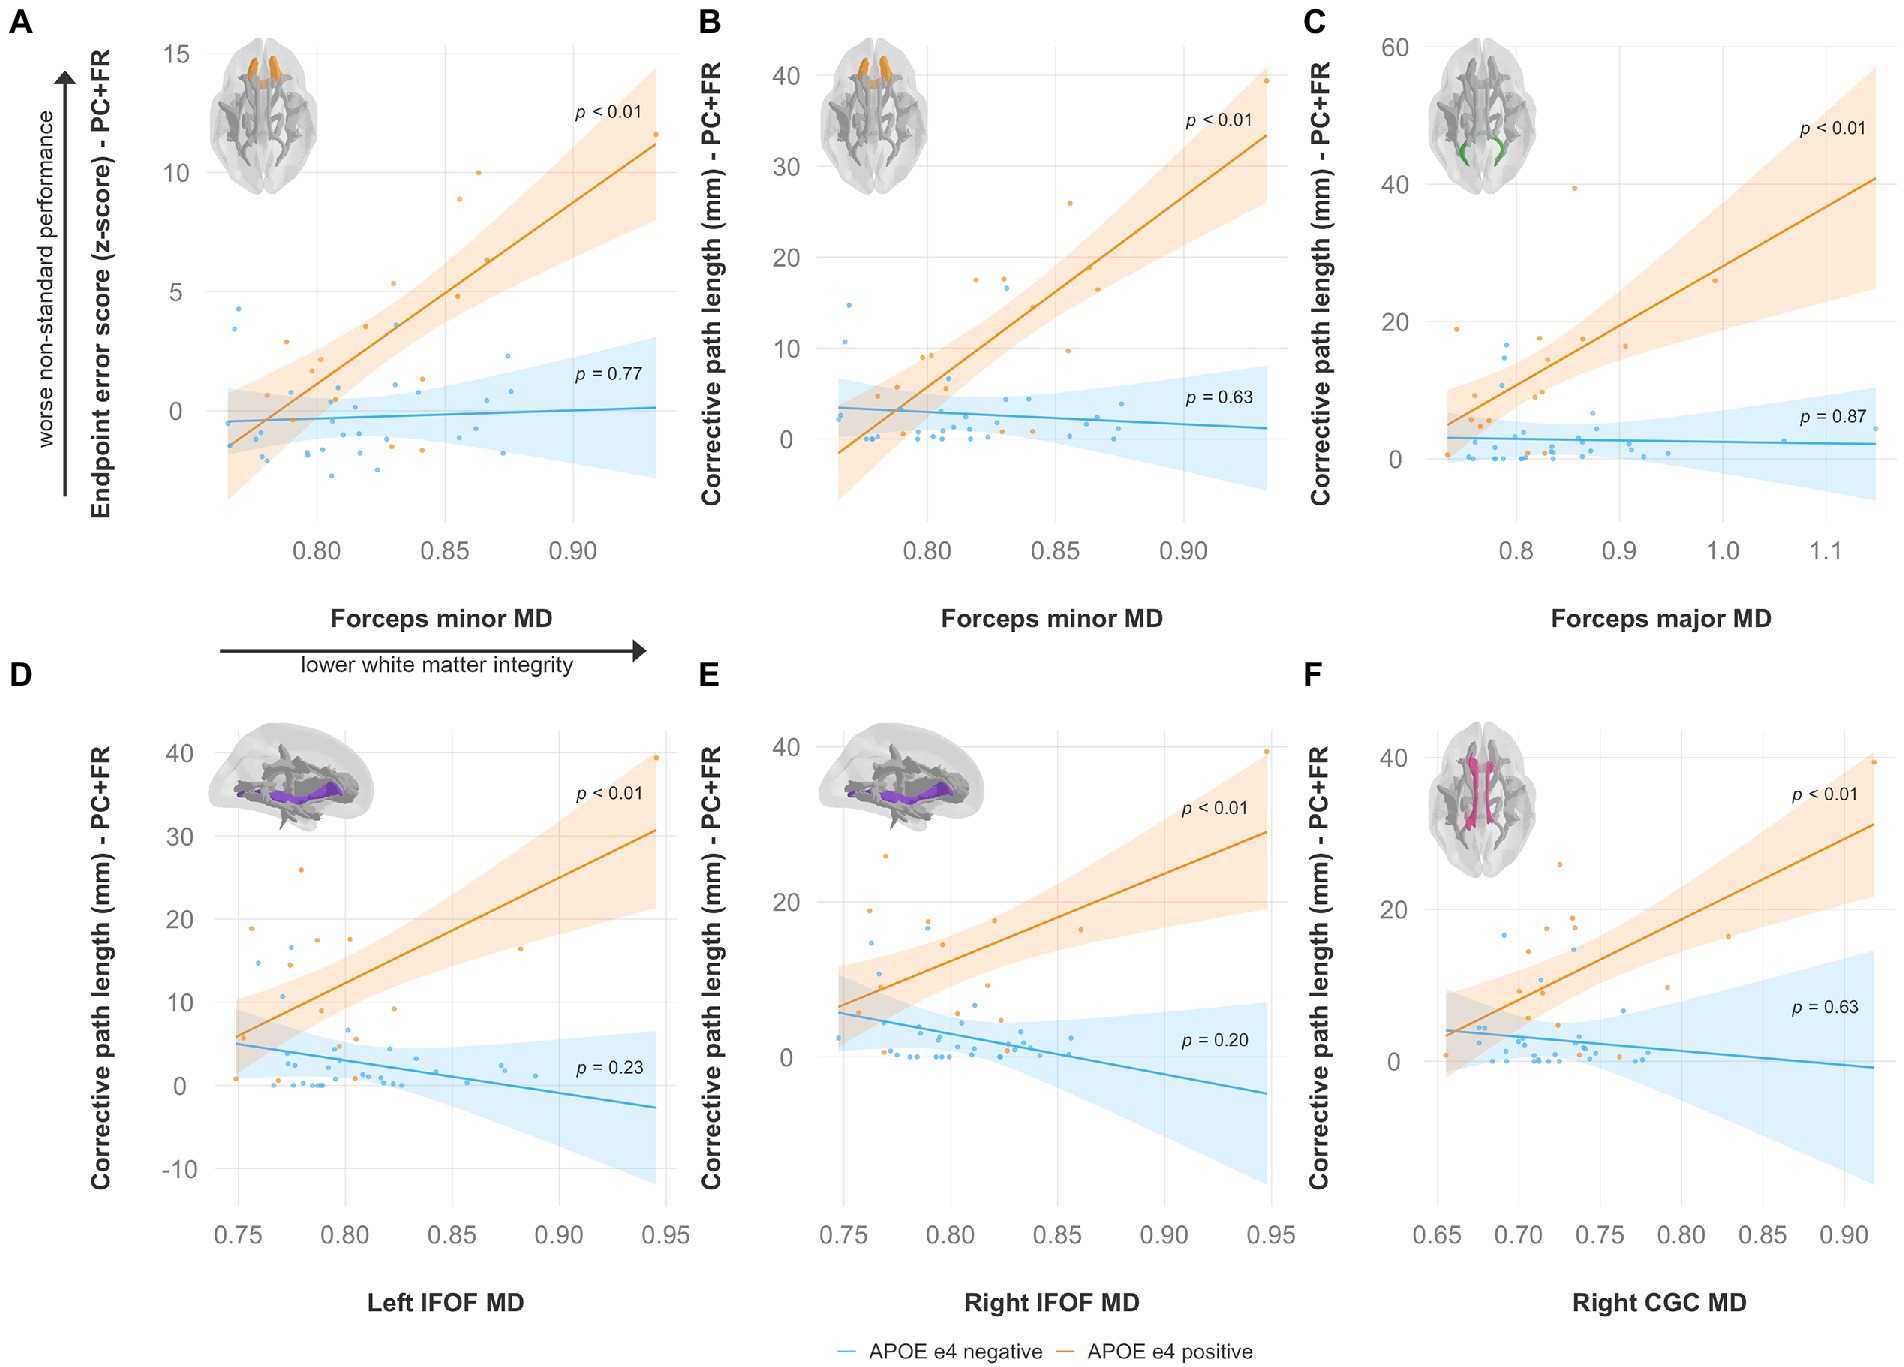
Figure 7. Higher mean diffusivity predicts worse visuomotor performance (reflected by higher endpoint error scores or corrective path lengths) in the plane-change feedback reversal condition only in APOE e4 carriers in several major white matter tracts, including the (A,B) forceps minor, (C) forceps major, (D) left IFOF, (E) right IFOF, and (F) right CGC. Significant results shown from multiple regression and simple slopes analyses. Brain figures made with “ggseg” R package (Mowinckel and Vidal-Piñeiro, 2020). PC + FR, plane change feedback reversal condition; APOE, apolipoprotein E; MD, mean diffusivity; IFOF, inferior fronto-occipital fasciculus; CGC, cingulum cingulate.
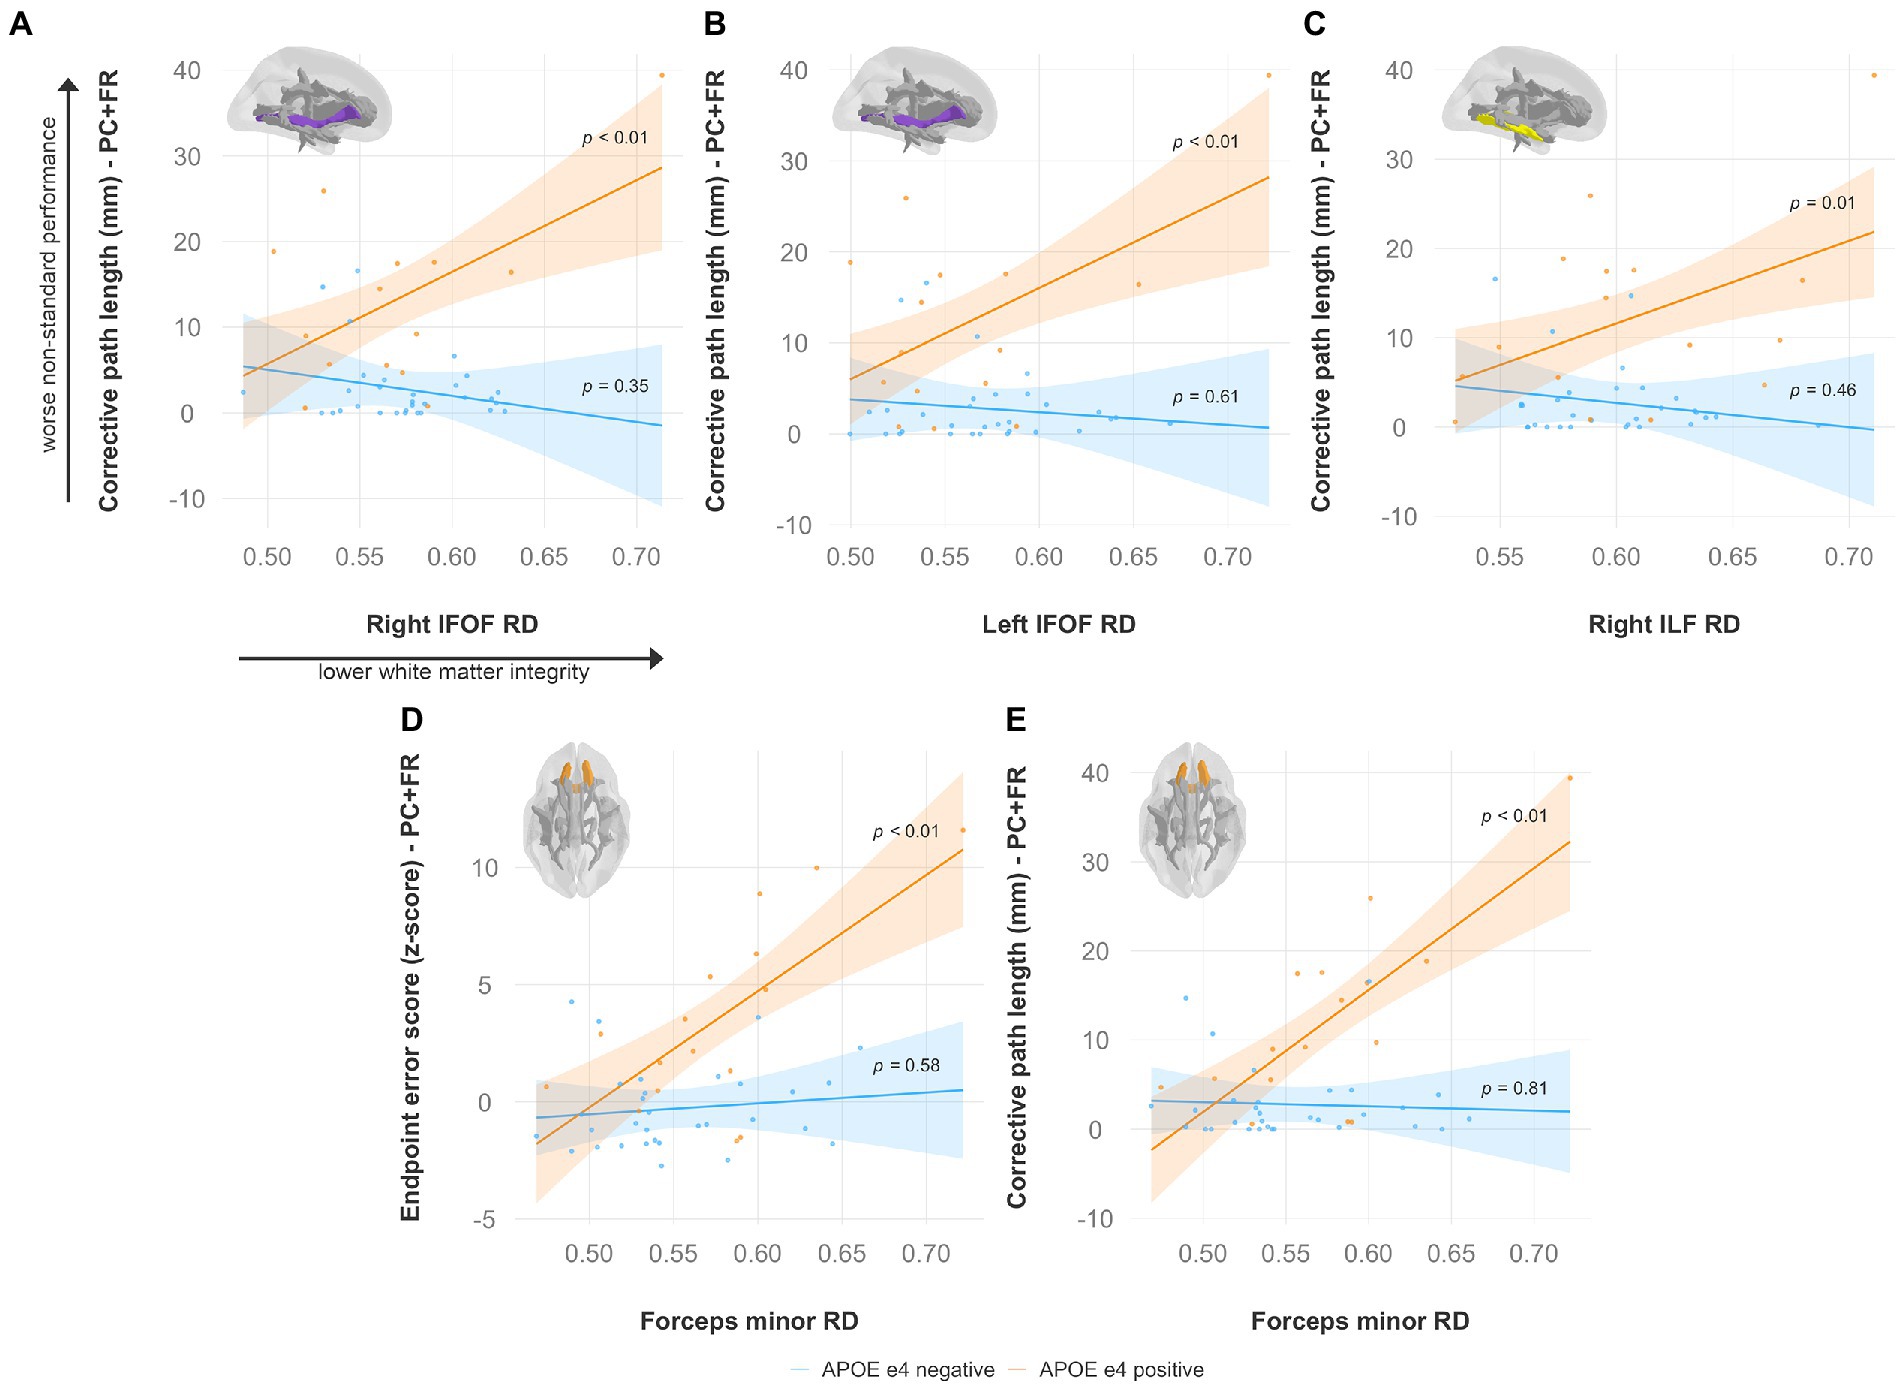
Figure 8. Higher radial diffusivity predicts worse visuomotor performance (reflected by higher endpoint error scores or corrective path lengths) in the plane-change feedback reversal condition only in APOE e4 carriers in several major white matter tracts, including the (A) right IFOF, (B) left IFOF, (C) right ILF, and (D,E) forceps minor. Significant results shown from multiple regression and simple slopes analyses. Brain figures made with “ggseg” R package (Mowinckel and Vidal-Piñeiro, 2020). PC + FR, plane change feedback reversal condition; APOE, apolipoprotein E; RD, radial diffusivity; IFOF, inferior fronto-occipital fasciculus; ILF, inferior longitudinal fasciculus.
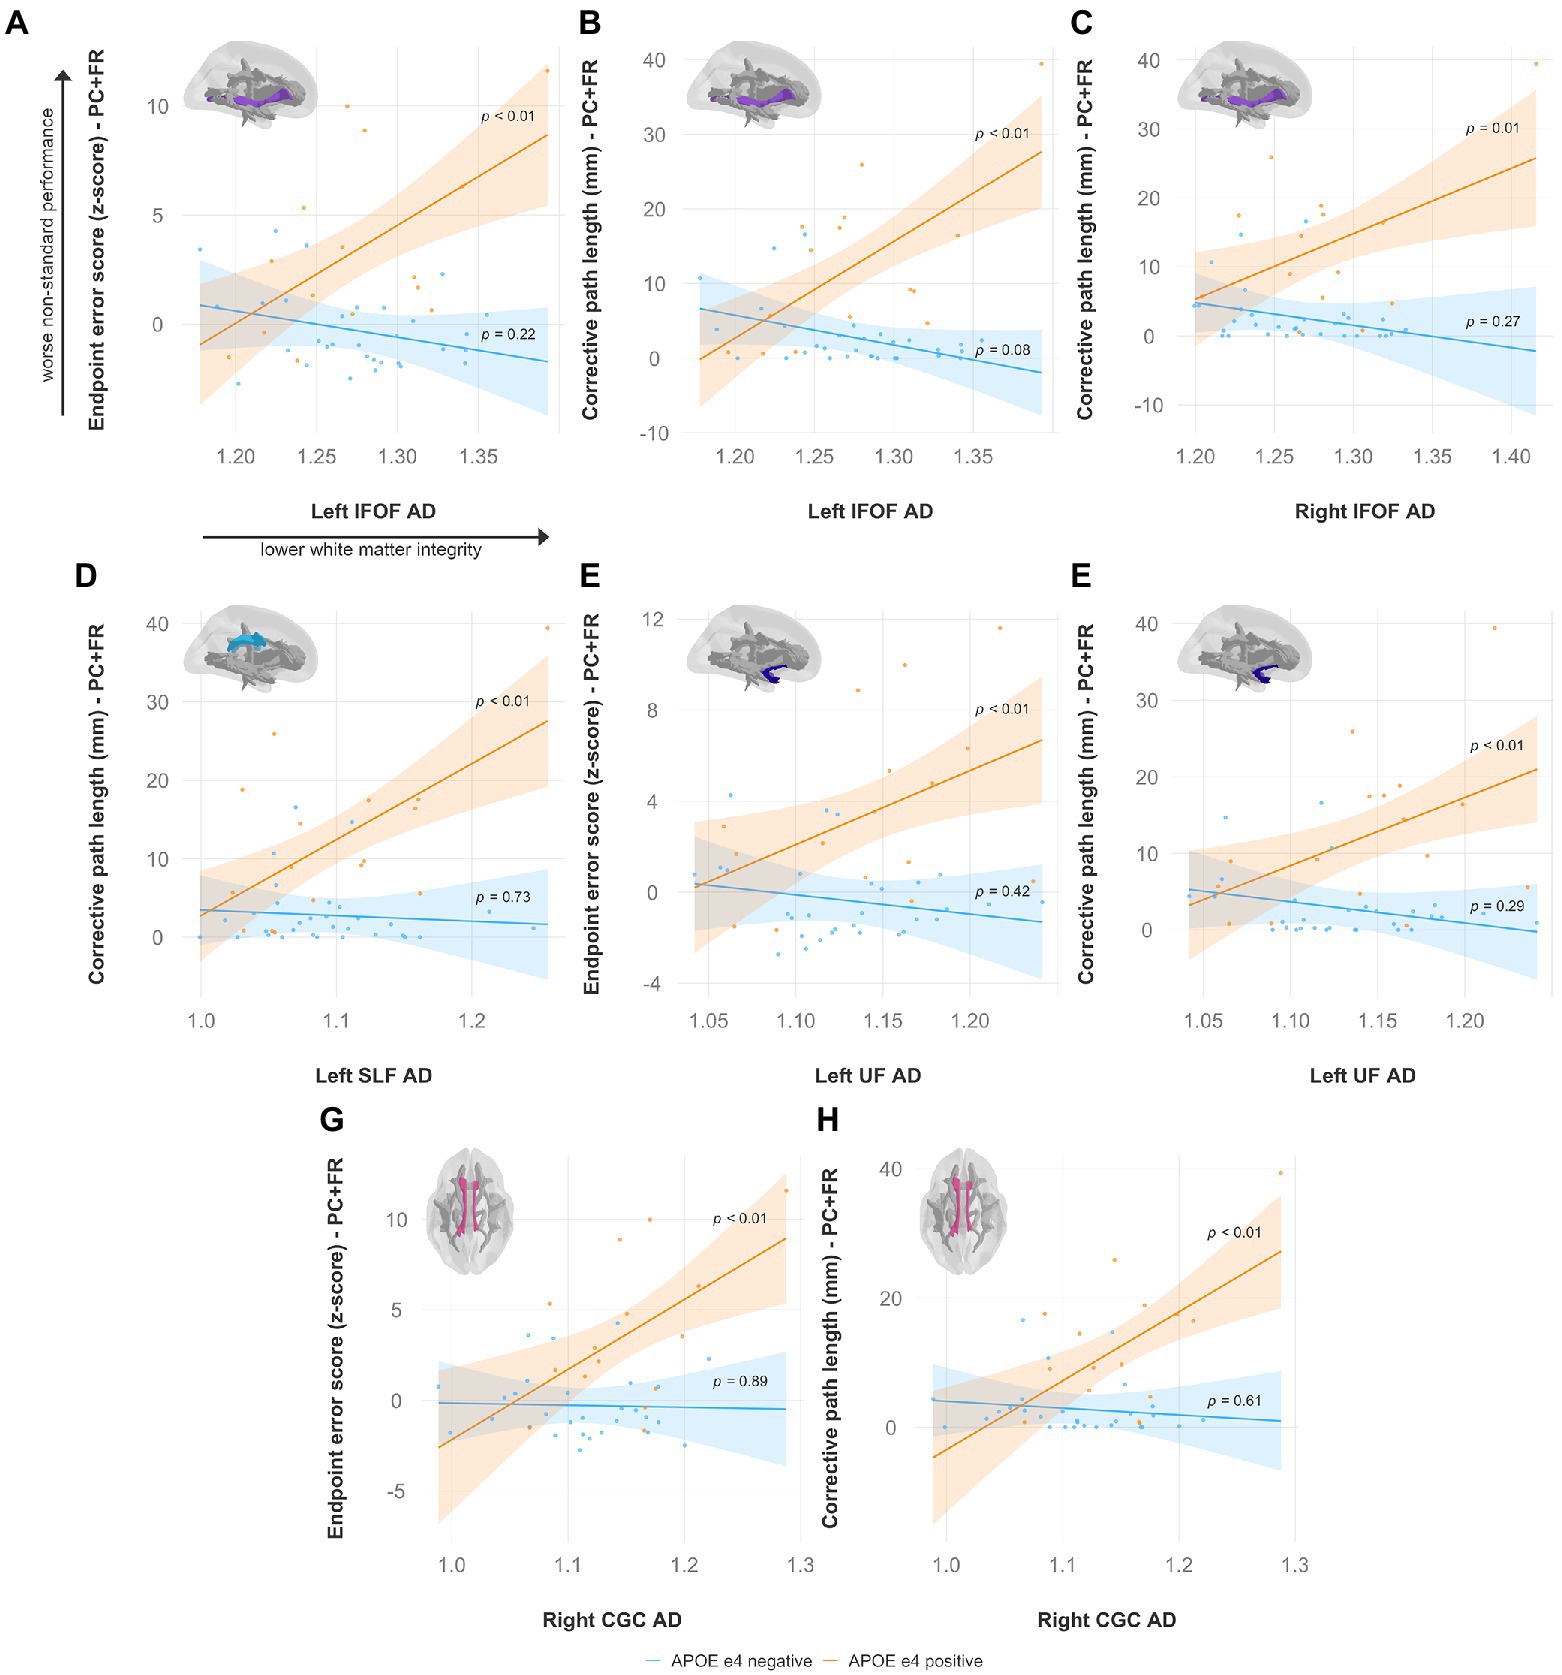
Figure 9. Higher axial diffusivity predicts worse visuomotor performance (reflected by higher endpoint error scores or corrective path lengths) in the plane-change feedback reversal condition only in APOE e4 carriers in several major white matter tracts, including the (A,B) left IFOF, (C) right IFOF, (D) left SLF, (E,F) left UF, and (G,H) right CGC. Significant results shown from multiple regression and simple slopes analyses. Brain figures made with “ggseg” R package (Mowinckel and Vidal-Piñeiro, 2020). PC + FR, plane change feedback reversal condition; APOE, apolipoprotein E; AxD, axial diffusivity; IFOF, inferior fronto-occipital fasciculus; SLF, superior longitudinal fasciculus; UF, uncinate fasciculus; CGC, cingulum cingulate.
4. Discussion
The main interest of this study was to investigate the grey and white matter neural anatomy underlying impaired visuomotor performance, and to explore the effects of family history of dementia, APOE genotype, and sex. Our key findings suggest that there is a relationship between the APOE e4 genotype and structural brain changes that predicts poorer visuomotor performance. This relationship was demonstrated in our grey matter structural findings, where lower thickness and volume in areas of the medial temporal lobe predicted visuomotor deficits, and then replicated in our diffusion data, where declines in white matter integrity also predicted impaired non-standard visuomotor performance. These visuomotor performance deficits in APOE e4 carriers were detectable using our non-standard visuomotor tasks in the absence of any measurable purely cognitive issues. We also found sex-differences in grey matter thickness and volume in areas of the posterior parietal cortex and hippocampus that are important for visuospatial processing, which may explain the poorer visual feedback reversal task performance we previously reported in males.
4.1. Grey matter measures underlying visuomotor deficits in individuals with an increased risk for Alzheimer’s disease
We first examined group differences in grey matter volume and thickness. Individuals with a family history of dementia had greater grey matter volumes in the right parahippocampal cortex compared to those without a family history of dementia. Conversely, APOE e4 carriers had lower grey matter volumes in the right parahippocampal cortex compared to individuals without an APOE e4 allele. Individuals with a family history of dementia also had lower grey matter volumes in the left retrosplenial cortex. Our main interest, however, was exploring whether structural differences in the inferior parietal lobule, precuneus, retrosplenial cortex, and areas of the medial temporal lobe may underlie visuomotor integration deficits in individuals at an increased risk for AD. Our results for hippocampal subfield volumes were surprising. We found that poorer non-standard visuomotor performance was associated with greater grey matter volumes in the right presubiculum and right subiculum. This relationship was only significant for APOE e4 carriers and is contrary to our hypothesis that atrophy within the hippocampus, one of the medial temporal lobe regions involved in visuomotor control (Tankus and Fried, 2012), may be predictive of worse visuomotor task performance. However, it should be noted that the automated hippocampal subfield segmentation module in FreeSurfer has not been validated against histological annotations within the same subjects, nor against manual segmentation on the same MRI scans (Wisse et al., 2021) caution against using 1 × 1 × 1 mm3 T1 scans for automatic segmentation of the hippocampus as the subfields are difficult to discern at this resolution. Studies that used automatic hippocampal segmentation have been shown to report contradictory and sometimes neurobiologically unexpected results (Haukvik et al., 2018; Wisse et al., 2021). Indeed (Iglesias et al., 2015), themselves mention that the volumetric results from individual subfields automatically segmented in FreeSurfer using only standard resolution (1 mm) T1 data must be interpreted with caution.
In APOE e4 carriers, a lower left parahippocampal volume and lower right entorhinal thickness were associated with worse non-standard visuomotor task performance. As mentioned previously, the hippocampal, parahippocampal, entorhinal, and retrosplenial cortices have been implicated in visuospatial processing and visuomotor control (Vann et al., 2009; Tankus and Fried, 2012). In addition to prominent memory declines, AD patients also show impairments in visuospatial processing and skilled eye-hand coordination performance (Ghilardi et al., 1999; Tippett and Sergio, 2006; Tippett et al., 2007). Apraxia, a disorder of skilled movements, is seen in some AD patients and is included as one of the criteria for AD (Lesourd et al., 2013; Dubois et al., 2014; Smits et al., 2014). Regions of the medial temporal lobe, including the hippocampus (subiculum, presubiculum, and parasubiculum) and parahippocampus, are interconnected with the parietal cortex via the retrosplenial cortex, which itself is involved in episodic memory, navigation, and translation between different frames of reference (Vann et al., 2009). Thus, early dysfunction in not only medial temporal regions but also in regions involved in visuomotor control could prove to be useful for understanding the underlying pathophysiology of AD and predicting AD risk.
Some of our findings showed increased volumes in regions of medial temporal lobe in individuals at an increased risk for AD, both in group differences (family history versus no family history of dementia) as well as associated with non-standard visuomotor deficits. Converging evidence suggests that by the time clinical impairment is detectable in AD, extensive neurodegeneration has already taken place (Morris, 2005). However, the relationship between AD pathology and brain atrophy in preclinical AD is still under debate (Chételat et al., 2013). Grey matter atrophy has been reported in cognitively healthy individuals positive for amyloid pathology (Fagan et al., 2009; Mormino et al., 2009; Villeneuve et al., 2014) and tau pathology (Wang et al., 2016; Scott et al., 2020; Xie et al., 2020), family history of dementia (Honea et al., 2010, 2011; Mosconi et al., 2014), and the APOE e4 allele (O’Dwyer et al., 2012; Haller et al., 2017; Veldsman et al., 2021). Conversely, other studies have reported increased volumes in areas of the medial temporal lobe in preclinical AD (Chételat, Villemagne, Pike, et al., 2010; Gispert et al., 2015). Therefore, the changes in grey matter volume in preclinical AD may not necessarily be linear.
4.2. Pattern of white matter integrity declines are generally consistent with the literature and predict visuomotor deficits in APOE e4 carriers
Studies examining white matter diffusion characteristics have demonstrated that white matter may be independently affected from amyloid pathology (Rabin et al., 2019) and grey matter atrophy (Amlien and Fjell, 2014) early in the pathological process, emphasizing the importance of investigating white matter changes underlying disease progression. White matter microstructural reductions have been shown in cognitively healthy individuals at an increased risk for AD (due to family history of dementia and having an APOE e4 allele) in the absence of medial temporal lobe atrophy (Gold et al., 2010). In the current study, we found no differences in white matter diffusion measures between groups (i.e., family history status, sex, or APOE e4 status). While there were no group differences in white matter integrity alone, we did observe that in APOE e4 carriers, diffusion measures of several major white matter tracts were predictive of non-standard visuomotor performance. Specifically, we found that lower FA (in the forceps minor, right IFOF, and right ILF), higher MD (in the right cingulum cingulate, forceps major, forceps minor, and bilateral IFOF), higher RD (in the forceps minor, right ILF, and bilateral IFOF), and higher AxD (in the cingulum cingulate, bilateral IFOF, left SLF, and left UF) were predictive of worse performance in the most cognitively demanding non-standard visuomotor condition (plane-change feedback reversal). Our findings are consistent with the literature, where white matter alterations have previously been detected in cognitively healthy individuals with the APOE e4 allele, with similar patterns of reduced white matter microstructure (i.e., reduced FA, and increased MD, RD, AxD) in some of the same tracts affected in our results, including the cingulum cingulate, forceps minor, IFOF, SLF, and ILF (Westlye et al., 2012; Adluru et al., 2014; Cavedo et al., 2018; Operto et al., 2018).
Our findings suggest that lower white matter integrity in several major tracts in the brain may underlie the non-standard visuomotor deficits we previously demonstrated in APOE e4 carriers compared to non-carriers. In the brain, the APOE protein plays a central role in cholesterol transport (Mahley and Rall, 2000), which is essential for axonal growth as well as synaptic formation and remodeling (Liu et al., 2013). APOE may affect white matter microstructure due to the e4 isoform having a reduced capacity of keeping cholesterol homeostasis in the brain, leading to disruptions of the myelin sheath (Operto et al., 2018). Vulnerability to the degradation of white matter microstructure may therefore be particularly high or accelerated in APOE e4 carriers. The resultant myelin disruption and axonal injury in tracts projecting between brain regions necessary for non-standard visuomotor integration, a task that heavily relies on large scale frontoparietal networks, may impact effective communication across these areas and be reflected as visuomotor deficits. Indeed, the white matter tracts in which lower white matter integrity was associated with visuomotor performance declines are some of the same white matter tracts that comprise the frontoparietal network, including the SLF, IFOF, and ILF (de Schotten et al., 2011; Rodríguez-Herreros et al., 2015; Budisavljevic et al., 2017; Waller et al., 2017; Herbet et al., 2018).
4.3. Grey matter structure underlying sex-differences in non-standard visuomotor performance
We previously showed that sex was a significant predictor of visuomotor performance in the feedback reversal condition, where males had greater endpoint error scores compared to females after controlling for family history and APOE status (Rogojin et al., 2019). In the current study, we found that males had lower left inferior parietal lobule thickness compared to females. While the right inferior parietal lobule in particular appears to be involved in non-standard visuomotor transformations involving a visual feedback reversal (Gorbet and Sergio, 2016) and is a crucial node in the frontoparietal network needed for maintaining spatial attention on current task goals (Singh-Curry and Husain, 2009), the left inferior parietal lobule has been shown to be important for visually-guided reaches as well. There was bilateral activation in the inferior parietal lobule during a reaching task, and reaching to visual targets compared to proprioceptive targets incurred more activity in the left inferior parietal lobule (Bernier and Grafton, 2010). Furthermore, the feedback reversal condition used in the current study is a version of visuomotor adaptation, and the left inferior parietal lobule is critical for successful visuomotor adaptation (Mutha et al., 2011; Crottaz-Herbette et al., 2014). It is important to note that the lower left inferior lobule thickness found in males may just be a general structural sex-difference rather than a result of age-related atrophy, as others have previously demonstrated greater cortical thickness in the inferior parietal lobules of adult females compared to males (Sowell et al., 2007). We found that having a lower left presubiculum volume was also associated with greater endpoint error scores in the visual feedback reversal condition only in males. The presubiculum of the hippocampus has extensive interconnections with the inferior parietal lobule (Rockland and Van Hoesen, 1999; Ding et al., 2000; Clower et al., 2001), and the hippocampus itself has been implicated in visuomotor coordination (Tankus and Fried, 2012).
4.4. Limitations and future directions
One of the limitations of the current study was that hippocampal subfield segmentation was obtained from T1-weighted MRI scans, which have limited tissue contrast of hippocampal structures (Wisse et al., 2021). The number of APOE e4 negative participants in the current study was also greater than the number of APOE e4 carriers. Despite this limitation, the preliminary findings on the relationship between APOE genotype, structural measures, and non-standard visuomotor performance indicate a potential mechanism underlying previous behavioral findings of visuomotor impairments in APOE e4 carriers and represent an important starting point for subsequent investigations. Another limitation is that this study was cross-sectional in nature. It would be interesting to conduct a longitudinal study to investigate if participants demonstrating visuomotor deficits prior to cognitive decline are more likely to develop mild cognitive impairment or dementia later in life. Preclinical AD has been hypothesized to begin decades before the onset of clinical symptoms. One proposed sequence of events leading to dementia suggests that disruptions in the default mode network may precede neurodegeneration (Sheline and Raichle, 2013). Several of the core nodes of the default mode network (Parvizi et al., 2006; Sperling et al., 2010; Márquez and Yassa, 2019) overlap with brain areas shown to be involved in non-standard visuomotor integration (Gorbet and Sergio, 2016, 2018). Future work could therefore investigate whether there are differences in default mode network connectivity between groups based on family history, genetic risk, or sex, and whether disruptions in functional connectivity underlie visuomotor deficits.
4.5. General conclusion
Our results suggest that a visuomotor task may have potential for detecting the early effects of the APOE e4 allele on white matter microstructure and medial temporal lobe grey matter early in dementia progression, as the white matter and grey matter declines observed here were associated with visuomotor difficulties only in e4 carriers. Importantly, the visuomotor deficits were seen prior to group differences in volumetric and diffusion measures due to genetic risk, and in advance of any cognitive deficits. We also found structural grey matter differences in the inferior parietal lobule that may underlie the sex-related differences we have previously demonstrated in non-standard visuomotor performance.
Data availability statement
The raw data supporting the conclusions of this article will be made available by the authors, without undue reservation.
Ethics statement
The studies involving human participants were reviewed and approved by Human Participants Review Sub-Committee of York University’s Ethics Review Board. The patients/participants provided their written informed consent to participate in this study.
Author contributions
AR: conceptualization, methodology, software, formal analysis, investigation, data curation, writing – original draft, writing – review and editing, and visualization. DG: conceptualization, methodology, software, formal analysis, resources, data curation, and writing – review and editing. KH: conceptualization, methodology, and investigation. LS: conceptualization, methodology, formal analysis, resources, writing – review and editing, supervision, project administration, and funding acquisition. All authors contributed to the article and approved the submitted version.
Funding
This work was supported by a Canadian Institutes of Health Research operating grant (grant number MOP-125915 to LS).
Acknowledgments
The authors wish to thank Heather Edgell and Michael Riddell for providing storage for saliva samples, as well as Joy Williams, MRT (MR), for her MR image acquisition expertise.
Conflict of interest
The authors declare that the research was conducted in the absence of any commercial or financial relationships that could be construed as a potential conflict of interest.
Publisher’s note
All claims expressed in this article are solely those of the authors and do not necessarily represent those of their affiliated organizations, or those of the publisher, the editors and the reviewers. Any product that may be evaluated in this article, or claim that may be made by its manufacturer, is not guaranteed or endorsed by the publisher.
Supplementary material
The Supplementary material for this article can be found online at: https://www.frontiersin.org/articles/10.3389/fnagi.2022.1054516/full#supplementary-material
References
Acosta-Cabronero, J., and Nestor, P. J. (2014). Diffusion tensor imaging in Alzheimer’s disease: insights into the limbic-diencephalic network and methodological considerations. Front. Aging Neurosci. 6, 1–21. doi: 10.3389/fnagi.2014.00266
Acosta-Cabronero, J., Williams, G. B., Pengas, G., and Nestor, P. J. (2010). Absolute diffusivities define the landscape of white matter degeneration in Alzheimer’s disease. Brain 133, 529–539. doi: 10.1093/brain/awp257
Adluru, N., Destiche, D. J., Lu, S. Y. F., Doran, S. T., Birdsill, A. C., Melah, K. E., et al. (2014). White matter microstructure in late middle-age: effects of apolipoprotein E4 and parental family history of Alzheimer’s disease. NeuroImage Clin. 4, 730–742. doi: 10.1016/j.nicl.2014.04.008
Alzheimer’s Association (2019). 2019 Alzheimer’s disease facts and figures. Alzheimers Dement. 15, 321–387. doi: 10.1016/j.jalz.2019.01.010
Amjad, H., Roth, D. L., Sheehan, O. C., Lyketsos, C. G., Wolff, J. L., and Samus, Q. M. (2018). Underdiagnosis of dementia: an observational study of patterns in diagnosis and awareness in US older adults. J. Gen. Intern. Med. 33, 1131–1138. doi: 10.1007/s11606-018-4377-y
Amlien, I. K., and Fjell, A. M. (2014). ‘Diffusion tensor imaging of white matter degeneration in Alzheimer’s disease and mild cognitive impairment’, Neuroscience, 276, pp. 206–215. doi: 10.1016/j.neuroscience.2014.02.017
Apostolova, L. G., Mosconi, L., Thompson, P. M., Green, A. E., Hwang, K. S., Ramirez, A., et al. (2010). Subregional hippocampal atrophy predicts Alzheimer’s dementia in the cognitively normal. Neurobiol. Aging 31, 1077–1088. doi: 10.1016/j.neurobiolaging.2008.08.008
Beaulieu, C., Does, M. D., Snyder, R. E., and Allen, P. S. (1996). Changes in water diffusion due to Wallerian degeneration in peripheral nerve. Magn. Reson. Med. 36, 627–631. doi: 10.1002/mrm.1910360419
Bendlin, B. B., Ries, M. L., Canu, E., Sodhi, A., Lazar, M., Alexander, A. L., et al. (2010). White matter is altered with parental family history of Alzheimer’s disease. Alzheimers Dement. 6, 394–403. doi: 10.1016/j.jalz.2009.11.003
Bennett, I. J., Motes, M. A., Rao, N. K., and Rypma, B. (2012). White matter tract integrity predicts visual search performance in young and older adults. Neurobiol. Aging 33, 433.e21–433.e31. doi: 10.1016/j.neurobiolaging.2011.02.001
Bernier, P. M., and Grafton, S. T. (2010). Human posterior parietal cortex flexibly determines reference frames for reaching based on sensory context. Neuron 68, 776–788. doi: 10.1016/j.neuron.2010.11.002
Bigham, B., Zamanpour, S. A., Zemorshidi, F., Boroumand, F., and Zare, H., for the Alzheimer’s Disease Neuroimaging Initiative (2020). Identification of superficial white matter abnormalities in Alzheimer’s disease and mild cognitive impairment using diffusion tensor imaging. J. Alzheimer's Dis. Rep. 4, 49–59. doi: 10.3233/ADR-190149
Bosch, B., Arenaza-Urquijo, E. M., Rami, L., Sala-Llonch, R., Junqué, C., Solé-Padullés, C., et al. (2012). Multiple DTI index analysis in normal aging, amnestic MCI and AD. Relationship with neuropsychological performance. Neurobiol. Aging 33, 61–74. doi: 10.1016/j.neurobiolaging.2010.02.004
Budisavljevic, S., Dell'Acqua, F., Zanatto, D., Begliomini, C., Miotto, D., Motta, R., et al. (2017). Asymmetry and structure of the fronto-parietal networks underlie visuomotor processing in humans. Cereb. Cortex 27, 1532–1544. doi: 10.1093/cercor/bhv348
Burks, J. D., Boettcher, L. B., Conner, A. K., Glenn, C. A., Bonney, P. A., Baker, C. M., et al. (2017). White matter connections of the inferior parietal lobule: a study of surgical anatomy. Brain Behav. 7:e00640. doi: 10.1002/brb3.640
Calati, R., Maller, J. J., Meslin, C., Lopez-Castroman, J., Ritchie, K., Courtet, P., et al. (2018). Repatriation is associated with isthmus cingulate cortex reduction in community-dwelling elderly. World J. Biol. Psychiatry 19, 421–430. doi: 10.1080/15622975.2016.1258490
Caminiti, R., Borra, E., Visco-Comandini, F., Battaglia-Mayer, A., Averbeck, B. B., and Luppino, G. (2017). Computational architecture of the parieto-frontal network underlying cognitive-motor control in monkeys. eNeuro 4, 1–35. doi: 10.1523/ENEURO.0306-16.2017
Cavedo, E., Chiesa, P. A., Houot, M., Ferretti, M. T., Grothe, M. J., Teipel, S. J., et al. (2018). Sex differences in functional and molecular neuroimaging biomarkers of Alzheimer’s disease in cognitively normal older adults with subjective memory complaints. Alzheimer’s Dement. 14, 1204–1215. doi: 10.1016/j.jalz.2018.05.014
Chételat, G., la Joie, R., Villain, N., Perrotin, A., de la Sayette, V., Eustache, F., et al. (2013). Amyloid imaging in cognitively normal individuals, at-risk populations and preclinical Alzheimer’s disease. NeuroImage Clin. 2, 356–365. doi: 10.1016/j.nicl.2013.02.006
Chelat, G. Ã., Villemagne, V. L., Bourgeat, P., Pike, K. E., Jones, G., Ames, D., et al. (2010). Relationship between atrophy and β-amyloid deposition in Alzheimer disease. Ann. Neurol. 67, NA–324. doi: 10.1002/ana.21955
Chételat, G., Villemagne, V. L., Pike, K. E., Baron, J. C., Bourgeat, P., Jones, G., et al. (2010). Larger temporal volume in elderly with high versus low beta-amyloid deposition. Brain 133, 3349–3358. doi: 10.1093/brain/awq187
Clark, B. J., Simmons, C. M., Berkowitz, L. E., and Wilber, A. A. (2018). The retrosplenial-parietal network and reference frame coordination for spatial navigation. Behav. Neurosci. 132, 416–429. doi: 10.1037/bne0000260
Clower, D. M., West, R. A., Lynch, J. C., and Strick, P. L. (2001). The inferior parietal lobule is the target of output from the superior colliculus, hippocampus, and cerebellum. J. Neurosci. 21, 6283–6291. doi: 10.1523/jneurosci.21-16-06283.2001
Connolly, A., Gaehl, E., Martin, H., Morris, J., and Purandare, N. (2011). Underdiagnosis of dementia in primary care: variations in the observed prevalence and comparisons to the expected prevalence. Aging Ment. Health 15, 978–984. doi: 10.1080/13607863.2011.596805
Crottaz-Herbette, S., Fornari, E., and Clarke, S. (2014). Prismatic adaptation changes visuospatial representation in the inferior parietal lobule. J. Neurosci. 34, 11803–11811. doi: 10.1523/JNEUROSCI.3184-13.2014
Dadar, M., Camicioli, R., Duchesne, S., and Collins, D. L., for the Alzheimer's Disease Neuroimaging Initiative (2020). The temporal relationships between white matter hyperintensities, neurodegeneration, amyloid beta, and cognition. Alzheimer’s Dement.: Diagn. Assess. Dis. Monitor. 12, e12091–e12011. doi: 10.1002/dad2.12091
Davis, S. W., Dennis, N. A., Buchler, N. G., White, L. E., Madden, D. J., and Cabeza, R. (2009). Assessing the effects of age on long white matter tracts using diffusion tensor tractography. NeuroImage 46, 530–541. doi: 10.1016/j.neuroimage.2009.01.068
de Boer, C., Pel, J. J. M., van der Steen, J., and Mattace-Raso, F. (2015). Delays in manual reaching are associated with impaired functional abilities in early dementia patients. Dement. Geriatr. Cogn. Disord. 40, 63–71. doi: 10.1159/000377674
de Boer, C., Mattace-Raso, F., van der Steen, J., and Pel, J. J. M. (2014). Mini-mental state examination subscores indicate visuomotor deficits in Alzheimer’s disease patients: a cross-sectional study in a Dutch population. Geriatr Gerontol Int 14, 880–885. doi: 10.1111/ggi.12183
de Boer, C., van der Steen, J., Mattace-Raso, F., Boon, A. J. W., and Pel, J. J. M. (2016). The effect of neurodegeneration on visuomotor behavior in Alzheimer’s disease and Parkinson’s disease. Mot. Control. 20, 1–20. doi: 10.1123/mc.2014-0015
de Schotten, M. T., Dell'Acqua, F., Forkel, S. J., Simmons, A., Vergani, F., Murphy, D. G. M., et al. (2011). A lateralized brain network for visuospatial attention. Nat. Neurosci. 14, 1245–1246. doi: 10.1038/nn.2905
Desikan, R. S., Ségonne, F., Fischl, B., Quinn, B. T., Dickerson, B. C., Blacker, D., et al. (2006). An automated labeling system for subdividing the human cerebral cortex on MRI scans into gyral based regions of interest. NeuroImage 31, 968–980. doi: 10.1016/j.neuroimage.2006.01.021
Destrieux, C., Fischl, B., Dale, A., and Halgren, E. (2010). Automatic parcellation of human cortical gyri and sulci using standard anatomical nomenclature. NeuroImage 53, 1–15. doi: 10.1016/j.neuroimage.2010.06.010
Ding, S.-L., Van Hoesen, G., and Rockland, K. S. (2000). Inferior parietal lobule projections to the Presubiculum and neighboring ventromedial temporal cortical areas. J. Comp. Neurol. 425, 510–530. doi: 10.1002/1096-9861(20001002)425:4<510::AID-CNE4>3.0.CO;2-R
Doan, N. T., Engvig, A., Persson, K., Alnæs, D., Kaufmann, T., Rokicki, J., et al. (2017). Dissociable diffusion MRI patterns of white matter microstructure and connectivity in Alzheimer’s disease spectrum. Sci. Rep. 7, 1–12. doi: 10.1038/srep45131
Donix, M., Burggren, A. C., Suthana, N. A., Siddarth, P., Ekstrom, A. D., Krupa, A. K., et al. (2010a). Family history of Alzheimer’s disease and hippocampal structure in healthy people. Am. J. Psychiatr. 167, 1399–1406. doi: 10.1176/appi.ajp.2010.09111575
Donix, M., Burggren, A. C., Suthana, N. A., Siddarth, P., Ekstrom, A. D., Krupa, A. K., et al. (2010b). Longitudinal changes in medial temporal cortical thickness in normal subjects with the APOE-4 polymorphism. NeuroImage 53, 37–43. doi: 10.1038/jid.2014.371
Doré, V., Villemagne, V. L., Bourgeat, P., Fripp, J., Acosta, O., Chetélat, G., et al. (2013). Cross-sectional and longitudinal analysis of the relationship between aβ deposition, cortical thickness, and memory in cognitively unimpaired individuals and in alzheimer disease. JAMA Neurol. 70, 903–911. doi: 10.1001/jamaneurol.2013.1062
Dubois, B., Feldman, H. H., Jacova, C., Hampel, H., Molinuevo, J. L., Blennow, K., et al. (2014). Advancing research diagnostic criteria for Alzheimer’s disease: the IWG-2 criteria. Lancet Neurol. 13, 614–629. doi: 10.1016/S1474-4422(14)70090-0
Dubois, B., Hampel, H., Feldman, H. H., Scheltens, P., Aisen, P., Andrieu, S., et al. (2016). Preclinical Alzheimer’s disease: definition, natural history, and diagnostic criteria. Alzheimers Dement. 12, 292–323. doi: 10.1016/j.jalz.2016.02.002
Fagan, A. M., Head, D., Shah, A. R., Marcus, D., Mintun, M., Morris, J. C., et al. (2009). Decreased cerebrospinal fluid Aβ 42 correlates with brain atrophy in cognitively normal elderly. Ann. Neurol. 65, 176–183. doi: 10.1002/ana.21559
Filimon, F. (2010). Human cortical control of hand movements: Parietofrontal networks for reaching, grasping, and pointing. Neuroscientist 16, 388–407. doi: 10.1177/1073858410375468
Ghilardi, M. F., Alberoni, M., Marelli, S., Marina Rossi,, Franceschi, M., Ghez, C., et al. (1999). Impaired movement control in Alzheimer’s disease. Neurosci. Lett. 260, 45–48. doi: 10.1016/S0304-3940(98)00957-4
Gielen, C. C. A. M., van den Heuvel, P. J. M., and van Gisbergen, J. A. M. (1984). Coordination of fast eye and arm movements in a tracking task. Exp. Brain Res. 56, 154–161. doi: 10.1007/BF00237452
Gispert, J. D., Rami, L., Sánchez-Benavides, G., Falcon, C., Tucholka, A., Rojas, S., et al. (2015). Nonlinear cerebral atrophy patterns across the Alzheimer’s disease continuum: impact of APOE4 genotype. Neurobiol. Aging 36, 2687–2701. doi: 10.1016/j.neurobiolaging.2015.06.027
Gold, B. T., Powell, D. K., Andersen, A. H., and Smith, C. D. (2010). Alterations in multiple measures of white matter integrity in normal women at high risk for Alzheimer’s disease. NeuroImage 52, 1487–1494. doi: 10.1016/j.neuroimage.2010.05.036
Gold, B. T., Johnson, N. F., Powell, D. K., and Smith, C. D. (2012). White matter integrity and vulnerability to Alzheimer’s disease: preliminary findings and future directions. Biochim. Biophys. Acta Mol. basis Dis. 1822, 416–422. doi: 10.1016/j.bbadis.2011.07.009
Gorbet, D., and Sergio, L. (2016). Don’t watch where you’re going: the neural correlates of decoupling eye and arm movements. Behav. Brain Res. 298, 229–240. doi: 10.1016/j.bbr.2015.11.012
Gorbet, D., and Sergio, L. (2018). Looking up while reaching out: the neural correlates of making eye and arm movements in different spatial planes. Exp. Brain Res. 237, 57–70. doi: 10.1007/s00221-018-5395-z
Gorbet, D., Staines, W., and Sergio, L. (2004). Brain mechanisms for preparing increasingly complex sensory to motor transformations. NeuroImage 23, 1100–1111. doi: 10.1016/j.neuroimage.2004.07.043
Haller, S., Montandon, M. L., Rodriguez, C., Ackermann, M., Herrmann, F. R., and Giannakopoulos, P. (2017). APOE-E4 is associated with gray matter loss in the posterior cingulate cortex in healthy elderly controls subsequently developing subtle cognitive decline. Am. J. Neuroradiol. 38, 1335–1342. doi: 10.3174/ajnr.A5184
Haukvik, U. K., Tamnes, C. K., Söderman, E., and Agartz, I. (2018). Neuroimaging hippocampal subfields in schizophrenia and bipolar disorder: a systematic review and meta-analysis. J. Psychiatr. Res. 104, 217–226. doi: 10.1016/j.jpsychires.2018.08.012
Hawkins, K. M., Goyal, A. I., and Sergio, L. E. (2015). Diffusion tensor imaging correlates of cognitive-motor decline in normal aging and increased Alzheimer’s disease risk. J. Alzheimers Dis. 44, 867–878. doi: 10.3233/JAD-142079
Hawkins, K. M., and Sergio, L. E. (2014). Visuomotor impairments in older adults at increased Alzheimer’s disease risk. J. Alzheimers Dis. 42, 607–621. doi: 10.3233/JAD-140051
Hawkins, K. M., and Sergio, L. E. (2016). Adults at increased Alzheimer’s disease risk diplay cognitive-motor integration impairment associated with changes in resting-state functional connectivity: a preliminary study. J. Alzheimers Dis. 53, 1161–1172. doi: 10.3233/JAD-151137
Helsen, W. F., Elliott, D., Starkes, J. L., and Ricker, K. L. (1998). Temporal and spatial coupling of point of gaze and hand movements in aiming. J. Mot. Behav. 30, 249–259. doi: 10.1080/00222899809601340
Herbet, G., Zemmoura, I., and Duffau, H. (2018). Functional anatomy of the inferior longitudinal fasciculus: from historical reports to current hypotheses. Front. Neuroanat. 12, 1–15. doi: 10.3389/fnana.2018.00077
Honea, R. A., Swerdlow, R. H., Vidoni, E. D., and Burns, J. M. (2011). Progressive regional atrophy in normal adults with a maternal history of Alzheimer disease. Neurology 76, 822–829. doi: 10.1212/WNL.0b013e31820e7b74
Honea, R. A., Vidoni, E., Harsha, A., and Burns, J. M. (2009). Impact of APOE on the healthy aging brain: a voxel-based MRI and DTI study. J. Alzheimers Dis. 18, 553–564. doi: 10.3233/JAD-2009-1163
Honea, R. A., Swerdlow, R. H., Vidoni, E. D., Goodwin, J., and Burns, J. M. (2010). Reduced gray matter volume in normal adults with a maternal family history of Alzheimer disease. Neurology 74, 113–120. doi: 10.1212/WNL.0b013e3181c918cb
Hong, Y. J., Kim, C. M., Jang, E. H., Hwang, J., Roh, J. H., and Lee, J. H. (2016). White matter changes may precede gray matter loss in elderly with subjective memory impairment. Dement. Geriatr. Cogn. Disord. 42, 227–235. doi: 10.1159/000450749
Hoy, A. R., Ly, M., Carlsson, C. M., Okonkwo, O. C., Zetterberg, H., Blennow, K., et al. (2017). Microstructural white matter alterations in preclinical Alzheimer’s disease detected using free water elimination diffusion tensor imaging. PLoS One 12:e0173982. doi: 10.1371/journal.pone.0173982
Hua, K., Zhang, J., Wakana, S., Jiang, H., Li, X., Reich, D. S., et al. (2008). Tract probability maps in stereotaxic spaces: analyses of white matter anatomy and tract-specific quantification. NeuroImage 39, 336–347. doi: 10.1016/j.neuroimage.2007.07.053
Iglesias, J. E., Augustinack, J. C., Nguyen, K., Player, C. M., Player, A., Wright, M., et al. (2015). A computational atlas of the hippocampal formation using ex vivo, ultra-high resolution MRI: application to adaptive segmentation of in vivo MRI. NeuroImage 115, 117–137. doi: 10.1016/j.neuroimage.2015.04.042
Jacobs, H. I. L., van Boxtel, M. P. J., Uylings, H. B. M., Gronenschild, E. H. B. M., Verhey, F. R., and Jolles, J. (2011). Atrophy of the parietal lobe in preclinical dementia. Brain Cogn. 75, 154–163. doi: 10.1016/j.bandc.2010.11.003
Kühn, S., Musso, F., Mobascher, A., Warbrick, T., Winterer, G., and Gallinat, J. (2012). Hippocampal subfields predict positive symptoms in schizophrenia: first evidence from brain morphometry. Transl. Psychiatry 2:e127. doi: 10.1038/tp.2012.51
Lang, L., Clifford, A., Wei, L., Zhang, D., Leung, D., Augustine, G., et al. (2017). Prevalence and determinants of undetected dementia in the community: a systematic literature review and a meta-analysis. BMJ Open 7:11146. doi: 10.1136/bmjopen-2016
Lesourd, M., le Gall, D., Baumard, J., Croisile, B., Jarry, C., and Osiurak, F. (2013). Apraxia and Alzheimer’s disease: review and perspectives. Neuropsychol. Rev. 23, 234–256. doi: 10.1007/s11065-013-9235-4
Litke, R., Garcharna, L. C., Jiwani, S., and Neugroschl, J. (2021). Modifiable risk factors in Alzheimer disease and related dementias: a review. Clin. Ther. 43, 953–965. doi: 10.1016/j.clinthera.2021.05.006
Liu, C. C., Liu, C. C., Kanekiyo, T., Xu, H., and Bu, G. (2013). Apolipoprotein E and Alzheimer disease: risk, mechanisms and therapy. Nat. Rev. Neurol. 9, 106–118. doi: 10.1038/nrneurol.2012.263
Livingston, G., Huntley, J., Sommerlad, A., Ames, D., Ballard, C., Banerjee, S., et al. (2020). Dementia prevention, intervention, and care: 2020 report of the lancet commission. Lancet 396, 413–446. doi: 10.1016/S0140-6736(20)30367-6
Lu, K., Nicholas, J. M., Weston, P. S. J., Stout, J. C., O’Regan, A. M., James, S. N., et al. (2021). Visuomotor integration deficits are common to familial and sporadic preclinical Alzheimer’s disease. Brain Commun. 3, 1–12. doi: 10.1093/braincomms/fcab003
Mahley, R. W., and Rall, S. C. (2000). Apolipoprotein E: far more than a lipid transport protein. Annu. Rev. Genomics Hum. Genet. 1, 507–537. doi: 10.1146/annurev.genom.1.1.507
Márquez, F., and Yassa, M. A. (2019). Neuroimaging biomarkers for Alzheimer’s disease. Mol. Neurodegener. 14, 1–14. doi: 10.1186/s13024-019-0325-5
Mathalon, D. H., Sullivan, E. V., Rawles, J. M., and Pfefferbaum, A. (1993). Correction for Head size in brain-imaging measurements. Psychiatry Res. Neuroimaging 50, 121–139. doi: 10.1016/0925-4927(93)90016-b
Mayo, C. D., Garcia-Barrera, M. A., Mazerolle, E. L., Ritchie, L. J., Fisk, J. D., Gawryluk, J. R., et al. (2019). Relationship between DTI metrics and cognitive function in Alzheimer’s disease. Front. Aging Neurosci. 10:436. doi: 10.3389/fnagi.2018.00436
Mintun, M. A., LaRossa, G. N., Sheline, Y. I., Dence, C. S., Lee, S. Y., Mach, R. H., et al. (2006). [11C]PIB in a nondemented population: potential antecedent marker of Alzheimer disease. Neurology 67, 446–452. doi: 10.1212/01.wnl.0000228230.26044.a4
Molloy, C. J., Nugent, S., and Bokde, A. L. W. (2021). Alterations in diffusion measures of white matter integrity associated with healthy aging. J. Gerontol. Biol. Sci. 76, 945–954. doi: 10.1093/gerona/glz289
Mormino, E. C., Kluth, J. T., Madison, C. M., Rabinovici, G. D., Baker, S. L., Miller, B. L., et al. (2009). Episodic memory loss is related to hippocampal-mediated β-amyloid deposition in elderly subjects. Brain 132, 1310–1323. doi: 10.1093/brain/awn320
Morris, J. C. (2005). Early-stage and preclinical Alzheimer disease. Alzheimer Dis. Assoc. Disord. 19, 163–165. doi: 10.1097/01.wad.0000184005.22611.cc
Mosconi, L., Murray, J., Tsui, W. H., Li, Y., Spector, N., Goldowsky, A., et al. (2014). Brain imaging of cognitively normal individuals with 2 parents affected by late-onset AD. Neurology 82, 752–760. doi: 10.1212/WNL.0000000000000181
Mowinckel, A. M., and Vidal-Piñeiro, D. (2020). Visualization of brain statistics with R packages ggseg and ggseg3d. Adv. Methods Pract. Psychol. Sci. 3, 466–483. doi: 10.1177/2515245920928009
Mutha, P. K., Sainburg, R. L., and Haaland, K. Y. (2011). Left parietal regions are critical for adaptive visuomotor control. J. Neurosci. 31, 6972–6981. doi: 10.1523/JNEUROSCI.6432-10.2011
Nestor, P. J., Fryer, T. D., Ikeda, M., and Hodges, J. R. (2003). Retrosplenial cortex (BA 29/30) hypometabolism in mild cognitive impairment (prodromal Alzheimer’s disease). Eur. J. Neurosci. 18, 2663–2667. doi: 10.1046/j.1460-9568.2003.02999.x
O’Brien, L. M., Ziegler, D. A., Deutsch, C. K., Frazier, J. A., Herbert, M. R., and Locascio, J. J. (2011). Statistical adjustments for brain size in volumetric neuroimaging studies: some practical implications in methods. Psychiatry Res. Neuroimaging 193, 113–122. doi: 10.1016/j.pscychresns.2011.01.007
O’Dwyer, L., Lamberton, Franck, Matura, Silke, Tanner, Colby, Scheibe, Monika, Miller, Julia, et al. (2012). ‘Reduced hippocampal volume in healthy young ApoE4 carriers: an MRI study’, PLoS One, 7:e48895. doi: 10.1371/journal.pone.0048895
Operto, G., Cacciaglia, R., Grau-Rivera, O., Falcon, C., Brugulat-Serrat, A., Ródenas, P., et al. (2018). White matter microstructure is altered in cognitively normal middle-aged APOE-ϵ4 homozygotes. Alzheimer's Res. Ther. 10:48. doi: 10.1186/s13195-018-0375-x
Parker, T. D., Cash, D. M., Lane, C. A. S., Lu, K., Malone, I. B., Nicholas, J. M., et al. (2019). Hippocampal subfield volumes and preclinical Alzheimer’s disease in 408 cognitively normal adults born in 1946. PLoS One 14, 1–15. doi: 10.1371/journal.pone.0224030
Parvizi, J., van Hoesen, G., Buckwalter, J., and Damasio, A. (2006). Neural connections of the posteromedial cortex in the macaque. Proc. Natl. Acad. Sci. U. S. A. 103, 1563–1568. doi: 10.1073/pnas.0507729103
Pfefferbaum, A., Sullivan, E. V., Hedehus, M., Lim, K. O., Adalsteinsson, E., and Moseley, M. (2000). Age-related decline in brain white matter anisotropy measured with spatially corrected Echo-planar diffusion tensor imaging. Magn. Reson. Med. 44, 259–268. doi: 10.1002/1522-2594(200008)44:2<259::AID-MRM13>3.0.CO;2-6
Pletnikova, O., Kageyama, Y., Rudow, G., LaClair, K. D., Albert, M., Crain, B. J., et al. (2018). The spectrum of preclinical Alzheimer’s disease pathology and its modulation by ApoE genotype. Neurobiol. Aging 71, 72–80. doi: 10.1016/j.neurobiolaging.2018.07.007
R Core Team (2021) R: A language and environment for statistical computing. Vienna, Austria. Available at: http://www.r-project.org/ (Accessed December 20, 2022).
Rabin, J. S., Perea, R. D., Buckley, R. F., Neal, T. E., Buckner, R. L., Johnson, K. A., et al. (2019). Global white matter diffusion characteristics predict longitudinal cognitive change independently of amyloid status in clinically normal older adults. Cereb. Cortex 29, 1251–1262. doi: 10.1093/cercor/bhy031
Reitz, C., and Mayeux, R. (2014). Alzheimer disease: epidemiology, diagnostic criteria, risk factors and biomarkers. Biochem. Pharmacol. 88, 640–651. doi: 10.1016/j.bcp.2013.12.024
Rockland, K. S., and Van Hoesen, G. W. (1999). Some temporal and parietal cortical connections converge in CA1 of the primate hippocampus. Cereb. Cortex 9, 232–237. doi: 10.1093/cercor/9.3.232
Rodríguez-Herreros, B., Amengual, J. L., Gurtubay-Antolín, A., Richter, L., Jauer, P., Erdmann, C., et al. (2015). Microstructure of the superior longitudinal fasciculus predicts stimulation-induced interference with on-line motor control. NeuroImage 120, 254–265. doi: 10.1016/j.neuroimage.2015.06.070
Rogojin, A., Gorbet, D. J., Hawkins, K. M., and Sergio, L. E. (2019). Cognitive-motor integration performance is affected by sex, APOE status, and family history of dementia. J. Alzheimers Dis. 71, 685–701. doi: 10.3233/JAD-190403
Sabes, P. N. (2000). The planning and control of reaching movements. Curr. Opin. Neurobiol. 10, 740–746. doi: 10.1016/S0959-4388(00)00149-5
Salat, D. H., Tuch, D. S., van der Kouwe, A. J. W., Greve, D. N., Pappu, V., Lee, S. Y., et al. (2010). White matter pathology isolates the hippocampal formation in Alzheimer’s disease. Neurobiol. Aging 31, 244–256. doi: 10.1016/j.neurobiolaging.2008.03.013
Salek, Y., Anderson, N. D., and Sergio, L. (2011). Mild cognitive impairment is associated with impaired visual-motor planning when visual stimuli and actions are incongruent. Eur. Neurol. 66, 283–293. doi: 10.1159/000331049
Schulte, T., and Müller-Oehring, E. M. (2010). Contribution of callosal connections to the interhemispheric integration of visuomotor and cognitive processes. Neuropsychol. Rev. 20, 174–190. doi: 10.1007/s11065-010-9130-1
Scott, M. R., Hampton, O. L., Buckley, R. F., Chhatwal, J. P., Hanseeuw, B. J., Jacobs, H. I. L., et al. (2020). Inferior temporal tau is associated with accelerated prospective cortical thinning in clinically normal older adults. NeuroImage 220:116991. doi: 10.1016/j.neuroimage.2020.116991
Sheline, Y. I., and Raichle, M. E. (2013). Resting state functional connectivity in preclinical Alzheimer’s disease. Biol. Psychiatry 74, 340–347. doi: 10.1016/j.biopsych.2012.11.028
Shine, J. P., Valdés-Herrera, J. P., Hegarty, M., and Wolbers, T. (2016). The human retrosplenial cortex and thalamus code head direction in a global reference frame. J. Neurosci. 36, 6371–6381. doi: 10.1523/JNEUROSCI.1268-15.2016
Singh-Curry, V., and Husain, M. (2009). The functional role of the inferior parietal lobe in the dorsal and ventral stream dichotomy. Neuropsychologia 47, 1434–1448. doi: 10.1016/j.neuropsychologia.2008.11.033
Smits, L. L., Flapper, M., Sistermans, N., Pijnenburg, Y. A. L., Scheltens, P., and van der Flier, W. M. (2014). Apraxia in mild cognitive impairment and Alzheimer’s disease: validity and reliability of the van heugten test for apraxia. Dement. Geriatr. Cogn. Disord. 38, 55–64. doi: 10.1159/000358168
Soares, J. M., Marques, P., Alves, V., and Sousa, N. (2013). A hitchhiker’s guide to diffusion tensor imaging. Front. Neurosci. 7:31. doi: 10.3389/fnins.2013.00031
Song, S. K., Sun, S. W., Ramsbottom, M. J., Chang, C., Russell, J., and Cross, A. H. (2002). Dysmyelination revealed through MRI as increased radial (but unchanged axial) diffusion of water. NeuroImage 17, 1429–1436. doi: 10.1006/nimg.2002.1267
Song, S. K., Sun, S. W., Ju, W. K., Lin, S. J., Cross, A. H., and Neufeld, A. H. (2003). Diffusion tensor imaging detects and differentiates axon and myelin degeneration in mouse optic nerve after retinal ischemia. NeuroImage 20, 1714–1722. doi: 10.1016/j.neuroimage.2003.07.005
Sowell, E. R., Peterson, B. S., Kan, E., Woods, R. P., Yoshii, J., Bansal, R., et al. (2007). Sex differences in cortical thickness mapped in 176 healthy individuals between 7 and 87 years of age. Cereb. Cortex 17, 1550–1560. doi: 10.1093/cercor/bhl066
Sperling, R. A., Dickerson, B. C., Pihlajamaki, M., Vannini, P., LaViolette, P. S., Vitolo, O. V., et al. (2010). Functional alterations in memory networks in early Alzheimer’s disease. NeuroMolecular Med. 12, 27–43. doi: 10.1007/s12017-009-8109-7
Tankus, A., and Fried, I. (2012). Visuomotor coordination and motor representation by human temporal lobe neurons. J. Cogn. Neurosci. 24, 600–610. doi: 10.1162/jocn_a_00160
Thal, D. R., Rüb, U., Orantes, M., and Braak, H. (2002). Phases of Aβ-deposition in the human brain and its relevance for the development of AD. Neurology 58, 1791–1800. doi: 10.1212/WNL.58.12.1791
Tippett, W. J., Krajewski, A., and Sergio, L. E. (2007). Visuomotor integration is compromised in Alzheimer’s disease patients reaching for remembered targets. Eur. Neurol. 58, 1–11. doi: 10.1159/000102160
Tippett, W. J., and Sergio, L. E. (2006). Visuomotor integration is impaired in early stage Alzheimer’s disease. Brain Res. 1102, 92–102. doi: 10.1016/j.brainres.2006.04.049
Tippett, W. J., Sergio, L. E., and Black, S. E. (2012). Compromised visually guided motor control in individuals with Alzheimer’s disease: can reliable distinctions be observed? J. Clin. Neurosci. 19, 655–660. doi: 10.1016/j.jocn.2011.09.013
van Leemput, K., Bakkour, A., Benner, T., Wiggins, G., Wald, L. L., Augustinack, J., et al. (2009). Automated segmentation of hippocampal subfields from ultra-high resolution in vivo MRI. Hippocampus 19, 549–557. doi: 10.1002/hipo.20615
Vann, S. D., Aggleton, J. P., and Maguire, E. A. (2009). What does the retrosplenial cortex do? Nat. Rev. Neurosci. 10, 792–802. doi: 10.1038/nrn2733
Vaz, M., and Silvestre, S. (2020). Alzheimer’s disease: recent treatment strategies. Eur. J. Pharmacol. 887:173554. doi: 10.1016/j.ejphar.2020.173554
Veldsman, M., Nobis, L., Alfaro-Almagro, F., Manohar, S., and Husain, M. (2021). The human hippocampus and its subfield volumes across age, sex and APOE e4 status. Brain Commun. 3:fcaa219. doi: 10.1093/braincomms/fcaa219
Villeneuve, S., Reed, B. R., Wirth, M., Haase, C. M., Madison, C. M., Ayakta, N., et al. (2014). Cortical thickness mediates the effect of β-amyloid on episodic memory. Neurology 82, 761–767. doi: 10.1212/WNL.0000000000000170
Voevodskaya, O. (2014). The effects of intracranial volume adjustment approaches on multiple regional MRI volumes in healthy aging and Alzheimer’s disease. Front. Aging Neurosci. 6:264. doi: 10.3389/fnagi.2014.00264
Wakana, S., Caprihan, A., Panzenboeck, M. M., Fallon, J. H., Perry, M., Gollub, R. L., et al. (2007). Reproducibility of quantitative tractography methods applied to cerebral white matter. NeuroImage 36, 630–644. doi: 10.1016/j.neuroimage.2007.02.049
Waller, R., Dotterer, H. L., Murray, L., Maxwell, A. M., and Hyde, L. W. (2017). White-matter tract abnormalities and antisocial behavior: a systematic review of diffusion tensor imaging studies across development. NeuroImage Clin. 14, 201–215. doi: 10.1016/j.nicl.2017.01.014
Wang, L., Benzinger, T. L., Su, Y., Christensen, J., Friedrichsen, K., Aldea, P., et al. (2016). Evaluation of tau imaging in staging Alzheimer disease and revealing interactions between β-amyloid and tauopathy. JAMA Neurol. 73, 1070–1077. doi: 10.1001/jamaneurol.2016.2078
Westlye, L. T., Reinvang, I., Rootwelt, H., and Espeseth, T. (2012). Effects of APOE on brain white matter microstructure in healthy adults. Neurology 79, 1961–1969. doi: 10.1212/WNL.0b013e3182735c9c
Wise, S. P., di Pellegrino, G., and Boussaoud, D. (1996). The premotor cortex and nonstandard sensorimotor mapping. Can. J. Physiol. Pharmacol. 74, 469–482. doi: 10.1139/cjpp-74-4-469
Wise, S. P., Boussaoud, D., Johnson, P. B., and Caminiti, R. (1997). Premotor and parietal cortex: Corticocortical connectivity and combinatorial computations. Annu. Rev. Neurosci. 20, 25–42. doi: 10.1146/annurev.neuro.20.1.25
Wisse, L. E. M., Chételat, G., Daugherty, A. M., Flores, R., Joie, R., Mueller, S. G., et al. (2021). Hippocampal subfield volumetry from structural isotropic 1 mm3 MRI scans: a note of caution. Hum. Brain Mapp. 42, 539–550. doi: 10.1002/hbm.25234
Wycoco, V., Shroff, M., Sudhakar, S., and Lee, W. (2013). White matter anatomy. What the radiologist needs to know. Neuroimaging Clin. N. Am. 23, 197–216. doi: 10.1016/j.nic.2012.12.002
Xie, L., Wisse, L. E. M., das, S. R., Vergnet, N., Dong, M., Ittyerah, R., et al. (2020). Longitudinal atrophy in early Braak regions in preclinical Alzheimer’s disease. Hum. Brain Mapp. 41, 4704–4717. doi: 10.1002/hbm.25151
Yeatman, J. D., Dougherty, R. F., Myall, N. J., Wandell, B. A., and Feldman, H. M. (2012). Tract profiles of white matter properties: automating fiber-tract quantification. PLoS One 7:49790. doi: 10.1371/journal.pone.0049790
Zhang, Y., du, A. T., Hayasaka, S., Jahng, G. H., Hlavin, J., Zhan, W., et al. (2010). Patterns of age-related water diffusion changes in human brain by concordance and discordance analysis. Neurobiol. Aging 31, 1991–2001. doi: 10.1016/j.neurobiolaging.2008.10.009
Keywords: visuomotor integration, early detection, Alzheimer’s disease, apolipoprotein e4, diffusion tensor imaging, grey matter
Citation: Rogojin A, Gorbet DJ, Hawkins KM and Sergio LE (2023) Differences in structural MRI and diffusion tensor imaging underlie visuomotor performance declines in older adults with an increased risk for Alzheimer’s disease. Front. Aging Neurosci. 14:1054516. doi: 10.3389/fnagi.2022.1054516
Edited by:
Joel Ramirez, University of Toronto, CanadaReviewed by:
Carmen Jiménez-Mesa, University of Granada, SpainGuohao Wang, National Institutes of Health, United States
Copyright © 2023 Rogojin, Gorbet, Hawkins and Sergio. This is an open-access article distributed under the terms of the Creative Commons Attribution License (CC BY). The use, distribution or reproduction in other forums is permitted, provided the original author(s) and the copyright owner(s) are credited and that the original publication in this journal is cited, in accordance with accepted academic practice. No use, distribution or reproduction is permitted which does not comply with these terms.
*Correspondence: Lauren E. Sergio, ✉ lsergio@yorku.ca