Age-Related Decrease in Default-Mode Network Functional Connectivity Is Accelerated in Patients With Major Depressive Disorder
 Shixiong Tang1,2†
  Zhipeng Wu3† Hengyi Cao4,5 Xudong Chen3 Guowei Wu3
  Wenjian Tan3 Dayi Liu3
  Jie Yang3
  Yicheng Long3*
  Zhening Liu3
- 1Department of Radiology, The Second Xiangya Hospital, Central South University, Changsha, China
- 2Clinical Research Center for Medical Imaging in Hunan Province, Changsha, China
- 3National Clinical Research Center for Mental Disorders, and Department of Psychiatry, The Second Xiangya Hospital, Central South University, Changsha, China
- 4Center for Psychiatric Neuroscience, Feinstein Institute for Medical Research, Manhasset, NY, United States
- 5Division of Psychiatry Research, Zucker Hillside Hospital, Glen Oaks, NY, United States
Major depressive disorder (MDD) is a common psychiatric disorder which is associated with an accelerated biological aging. However, little is known whether such process would be reflected by a more rapid aging of the brain function. In this study, we tested the hypothesis that MDD would be characterized by accelerated aging of the brain’s default-mode network (DMN) functions. Resting-state functional magnetic resonance imaging data of 971 MDD patients and 902 healthy controls (HCs) was analyzed, which was drawn from a publicly accessible, multicenter dataset in China. Strength of functional connectivity (FC) and temporal variability of dynamic functional connectivity (dFC) within the DMN were calculated. Age-related effects on FC/dFC were estimated by linear regression models with age, diagnosis, and diagnosis-by-age interaction as variables of interest, controlling for sex, education, site, and head motion effects. The regression models revealed (1) a significant main effect of age in the predictions of both FC strength and dFC variability; and (2) a significant main effect of diagnosis and a significant diagnosis-by-age interaction in the prediction of FC strength, which was driven by stronger negative correlation between age and FC strength in MDD patients. Our results suggest that (1) both healthy participants and MDD patients experience decrease in DMN FC strength and increase in DMN dFC variability along age; and (2) age-related decrease in DMN FC strength may occur at a faster rate in MDD patients than in HCs. However, further longitudinal studies are still needed to understand the causation between MDD and accelerated aging of brain.
Introduction
Major depressive disorder (MDD), one of the most common serious psychiatric disorders worldwide, is associated with increased risks of many biological and physiological pathologies such as dementia/cognitive decline (Byers and Yaffe, 2011; Holmquist et al., 2020), cardiovascular disease (Gan et al., 2014), and osteoporosis (Cizza et al., 2009) which occur in the process of normal aging. Accordingly, there are growing evidences suggesting that MDD leads to an accelerated biological aging as revealed by biochemical (Wolkowitz et al., 2011; Levada and Troyan, 2020), genetic (Simon et al., 2006; Protsenko et al., 2021), and neuroimaging (Sacchet et al., 2017; Cheng et al., 2020; Dunlop et al., 2021) characteristics. For instance, it was found that MDD patients are significantly older (with a median gap of 2 years) than their chronological age based on predictable age-related patterns of DNA methylation (Protsenko et al., 2021). Structural neuroimaging studies have also reported that age-related reductions in the brain cortical thickness (Cheng et al., 2020) and putamen volumes (Sacchet et al., 2017) are accelerated in MDD.
Apart from the above mentioned biochemical, genetic, and brain structural alterations, MDD is characterized by abnormal brain function that can be shown by functional magnetic resonance imaging (fMRI) (Mulders et al., 2015; Zhang K. et al., 2016; Zanatta et al., 2019). In previous fMRI studies, the most prominent and frequently reported findings in MDD are altered resting-state functional connectivity (FC) patterns within the default-mode network (DMN) areas (Mulders et al., 2015; Zhang K. et al., 2016; Zanatta et al., 2019; Shi et al., 2021). Such alterations include both reduced FC strengths (Chen et al., 2015; | Yan et al., 2019; Shi et al., 2020) as well as decreased temporal stability of dynamic functional connectivity (dFC) based on the recent assumption that FC patterns fluctuate over time (Wise et al., 2017; Long et al., 2020a). Interestingly, these alterations have been also associated with the process of normal aging: several previous studies have consistently reported that older age is related to decreased FC strength (Bluhm et al., 2008; Mevel et al., 2013; Vidal-Piñeiro et al., 2014; Park et al., 2017; Staffaroni et al., 2018) and increased dFC variability (Qin et al., 2015; Marusak et al., 2017; Park et al., 2017) within the DMN. Such similarities bring up the possibility that accelerated biological aging in MDD may be reflected by FC strength and dFC variability within the DMN, which has not been well examined to our knowledge. Thus, characterizing the trajectories of age-related changes in FC strength/dFC variability within the DMN may both facilitate the mechanistic understanding of MDD, as well as the development of specific treatment strategies to prevent deteriorated progression in MDD.
In the present study, we therefore investigated whether MDD would be characterized by accelerated aging of brain function in terms of FC/dFC features within the DMN. Specifically, we assessed the MDD diagnosis-by-age interactions on FC strength and dFC variability within the DMN based on the previously mentioned literatures. In order to increase the statistical power and reliability of the results, we used a large, multicenter fMRI dataset of MDD patients and healthy controls (HCs). We hypothesized that (1) age-related decreases in FC strength and increases in temporal variability of dFC within the DMN would be observed in both the MDD and healthy participants; and (2) such processes might be accelerated in MDD as reflected by significant diagnosis-by-age interactions, which are driven by stronger associations between age and FC/dFC measures in patients with MDD.
Materials and Methods
Participants
The final analyzed sample in this study consisted of 971 MDD patients and 902 healthy participants from 20 study centers, which was a part of the REST-meta-MDD Consortium in China.1 All patients were diagnosed as MDD based on the International Statistical Classification of Diseases, 10th Revision (ICD-10) or Diagnostic and Statistical Manual of Mental Disorders-IV (DSM-IV) criteria. Such a sample was drawn from the original 1300 MDD patients and 1128 HCs in the REST-meta-MDD dataset by excluding the subjects who met the following exclusion criteria: (1) <18 years of age; (2) demographic information such as age is incomplete; (3) fMRI scanning repetition time ≠2 s (to reduce biases caused by different temporal resolutions when constructing dynamic brain networks); (4) poor image quality or inaccurate spatial normalization determined by manual checking; (5) excessive head motion with framewise-displacement (FD) >0.2 mm; (6) bad mask coverage with signal loss in any region of interest (ROI). The data was anonymously contributed from studies which were approved by local Institutional Review Boards in each center, and written informed consent were obtained from all participants from the local institutions.
Among the analyzed 971 patients with MDD, there were 364 first-episode and 234 recurrent MDD patients, while the episodicity (first or recurrent) was unavailable for the other 373 patients. The 17-item Hamilton Depression Rating Scale (HAMD) and Hamilton Anxiety Scale (HAMA) scores were available for 813 and 561 patients, respectively. See Tables 1, 2 for sample details. More details of the REST-meta-MDD Consortium can be also found in previous publications (Yan et al., 2019; Liang et al., 2020; Long et al., 2020a; Ding et al., 2021; Liu et al., 2021; Yang et al., 2021).
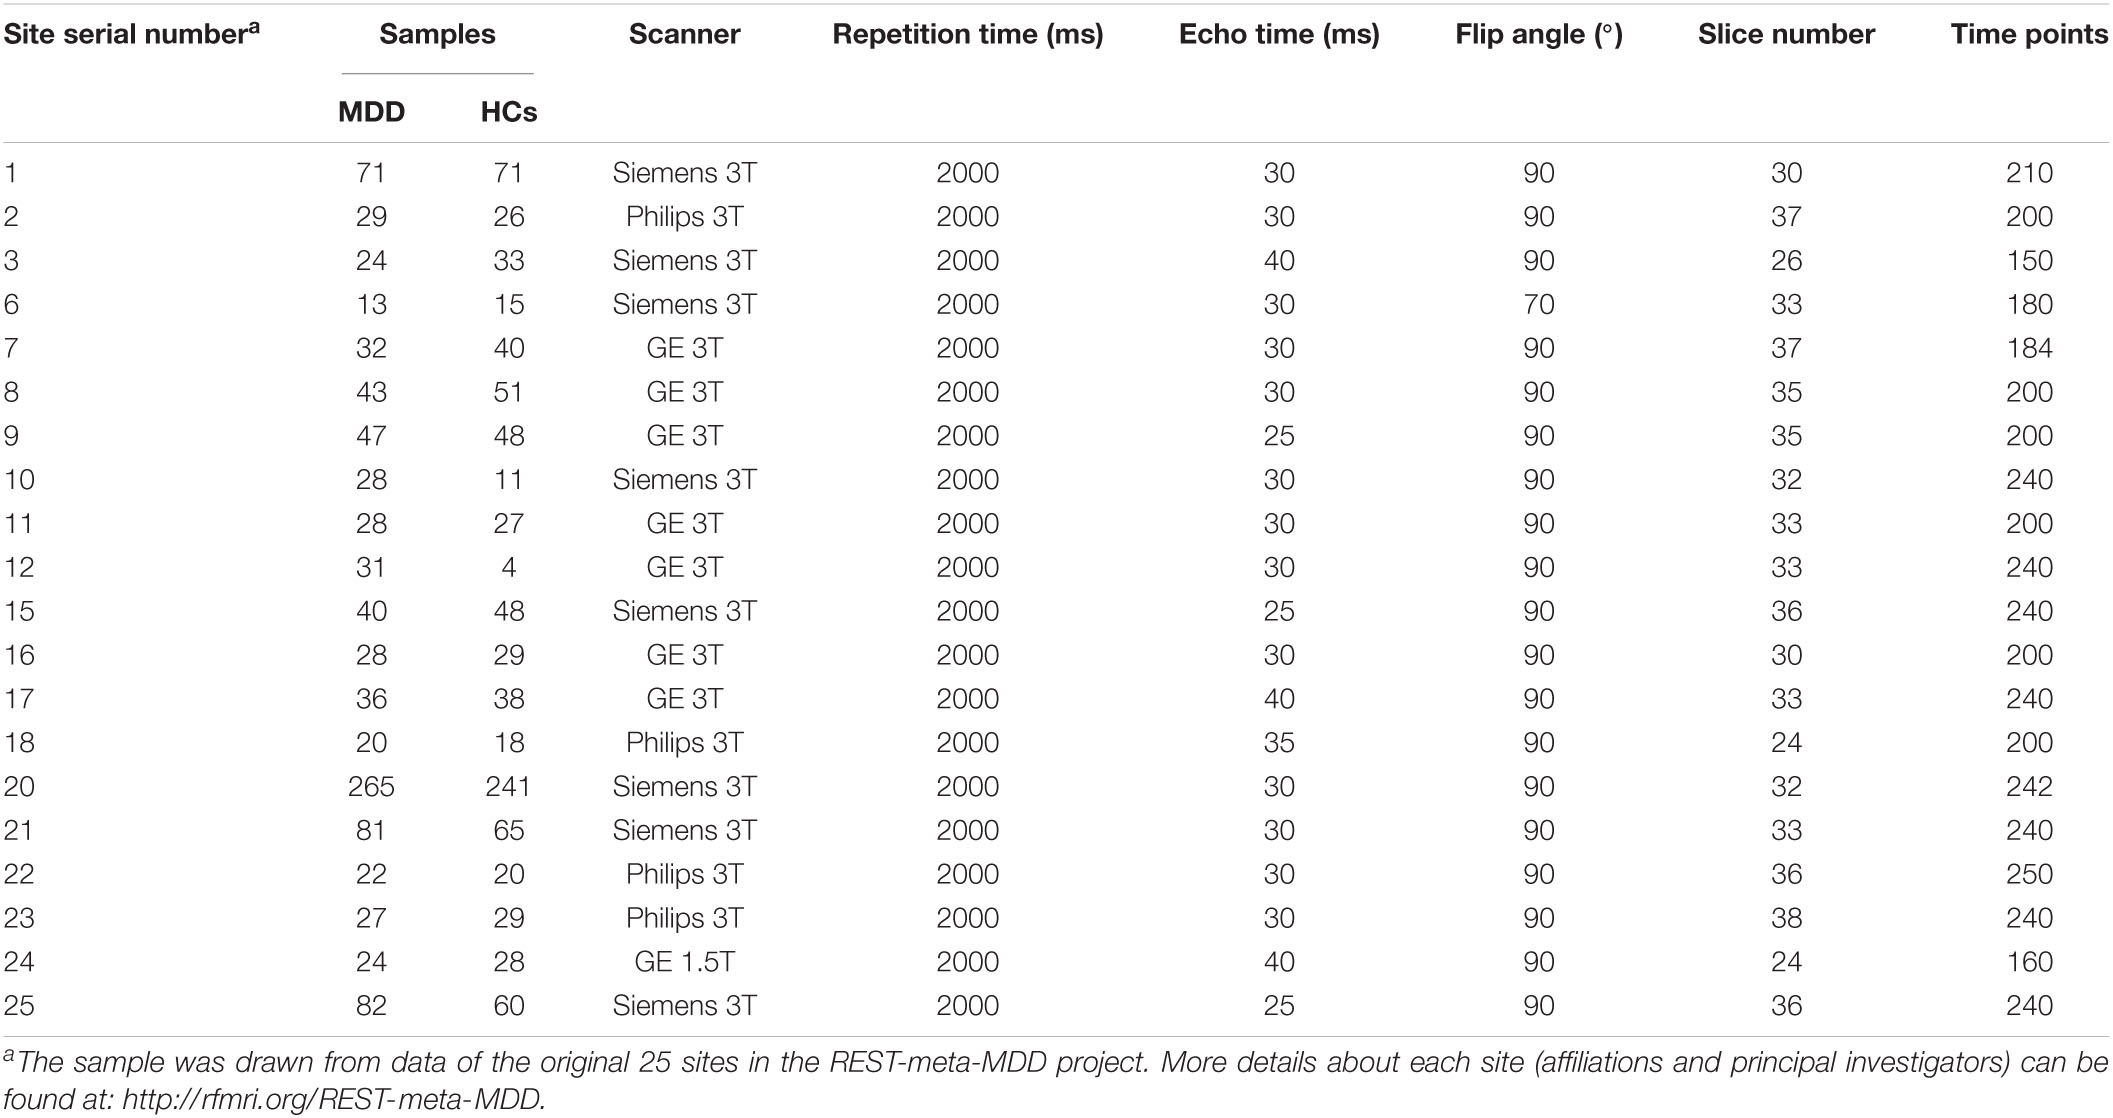
Table 1. The sample size and key data acquisition parameters of each site included in this study.
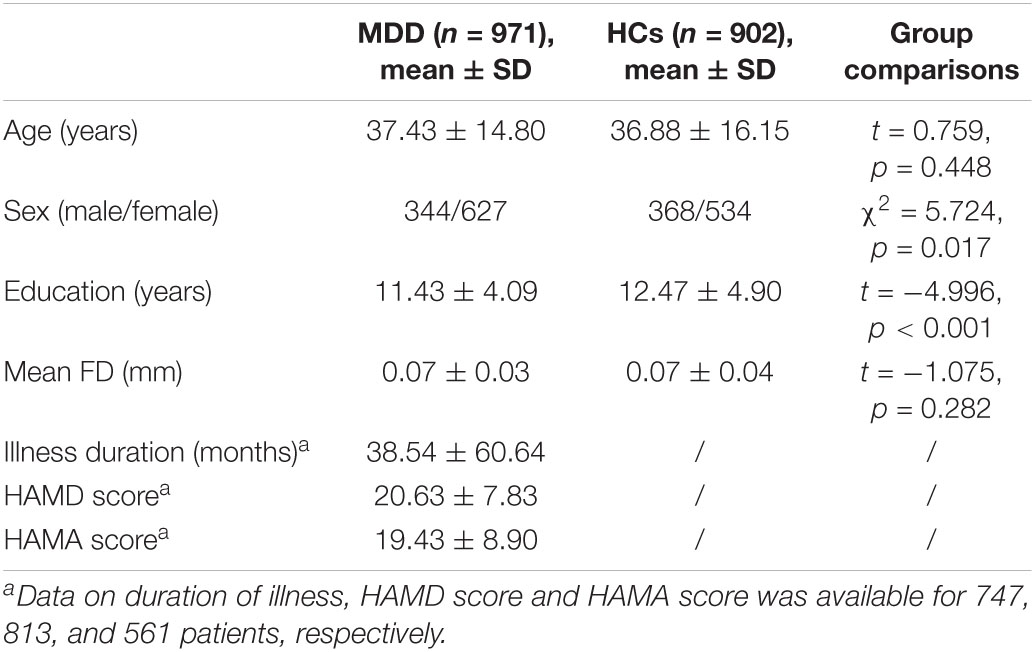
Table 2. Comparisons on demographic/characteristics between the MDD and HC groups.
Imaging Data Acquisition and Preprocessing
All imaging data (including resting-state fMRI and T1-weighted structural images) was required at each center of the REST-meta-MDD Consortium (see Table 1 for key scanning parameters). Data was preprocessed in each center locally with a standardized pipeline to obtain ROI-based fMRI time series. The raw imaging data was not shared to protect participant privacy based on the policy of REST-meta-MDD Consortium (Yan et al., 2019). The preprocessing pipeline was performed using the DPARSF software2 (Chao-Gan and Yu-Feng, 2010; Yan et al., 2016) whose details can be found in previous published studies (Yan et al., 2019; Long et al., 2020a). Briefly, it includes removing the first 10 volumes, slice timing, motion realignment, brain tissue segmentation, spatial normalization, temporal filtering (0.01–0.10 Hz), and nuisance (including white matter, cerebrospinal fluid, and whole brain signals) regression. After preprocessing, the images were manually checked by trained researchers to ensure the quality. Data with unsatisfied quality was excluded based on the criteria above in section “Participants.”
Functional Connectivity Strength and Dynamic Functional Connectivity Variability Within Default-Mode Network
The steps of calculating DMN FC strength and dFC variability are summarized below and also shown in Figure 1. After preprocessing, mean time series were firstly extracted from 58 DMN ROIs defined based on the Power functional atlas (Power et al., 2011; Cole et al., 2013). The ROIs were visualized in Figure 2 using Brainnet viewer (Xia et al., 2013) and their coordinates can be found elsewhere (Long et al., 2019).
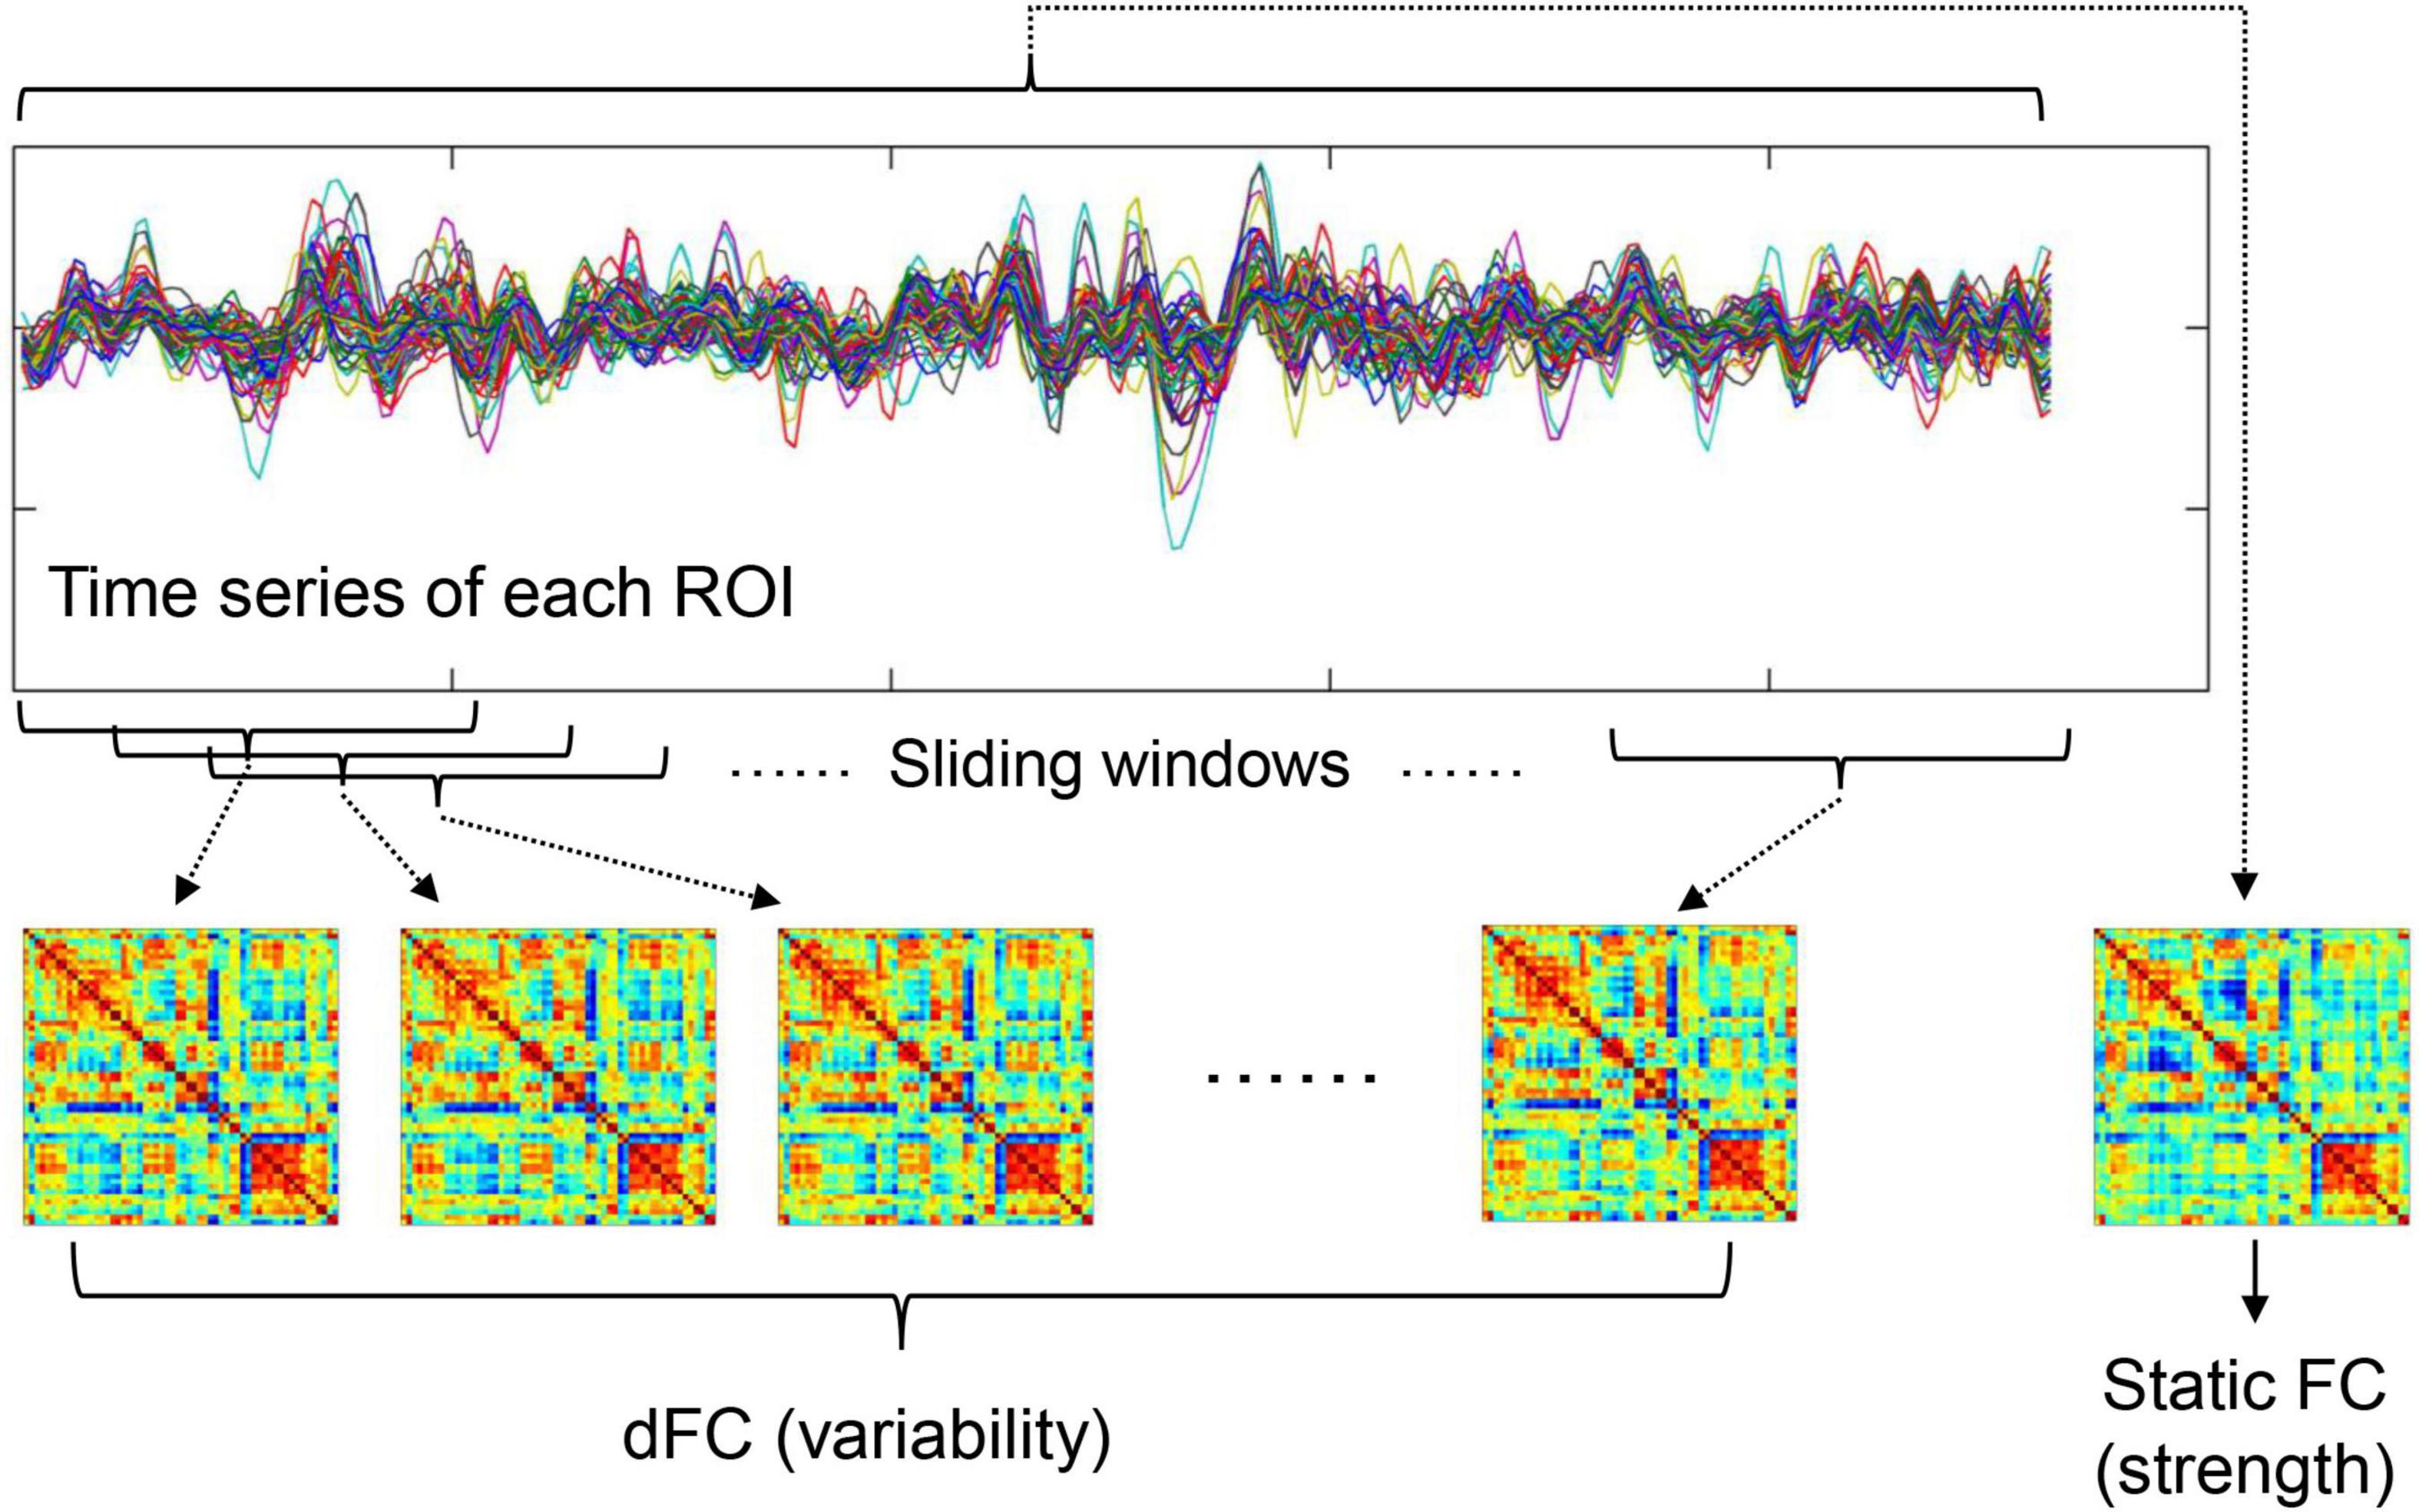
Figure 1. A summary of how to calculate static FC strength and dFC variability (refer to section “Functional Connectivity Strength and Dynamic Functional Connectivity Variability Within Default-Mode Network” for details).
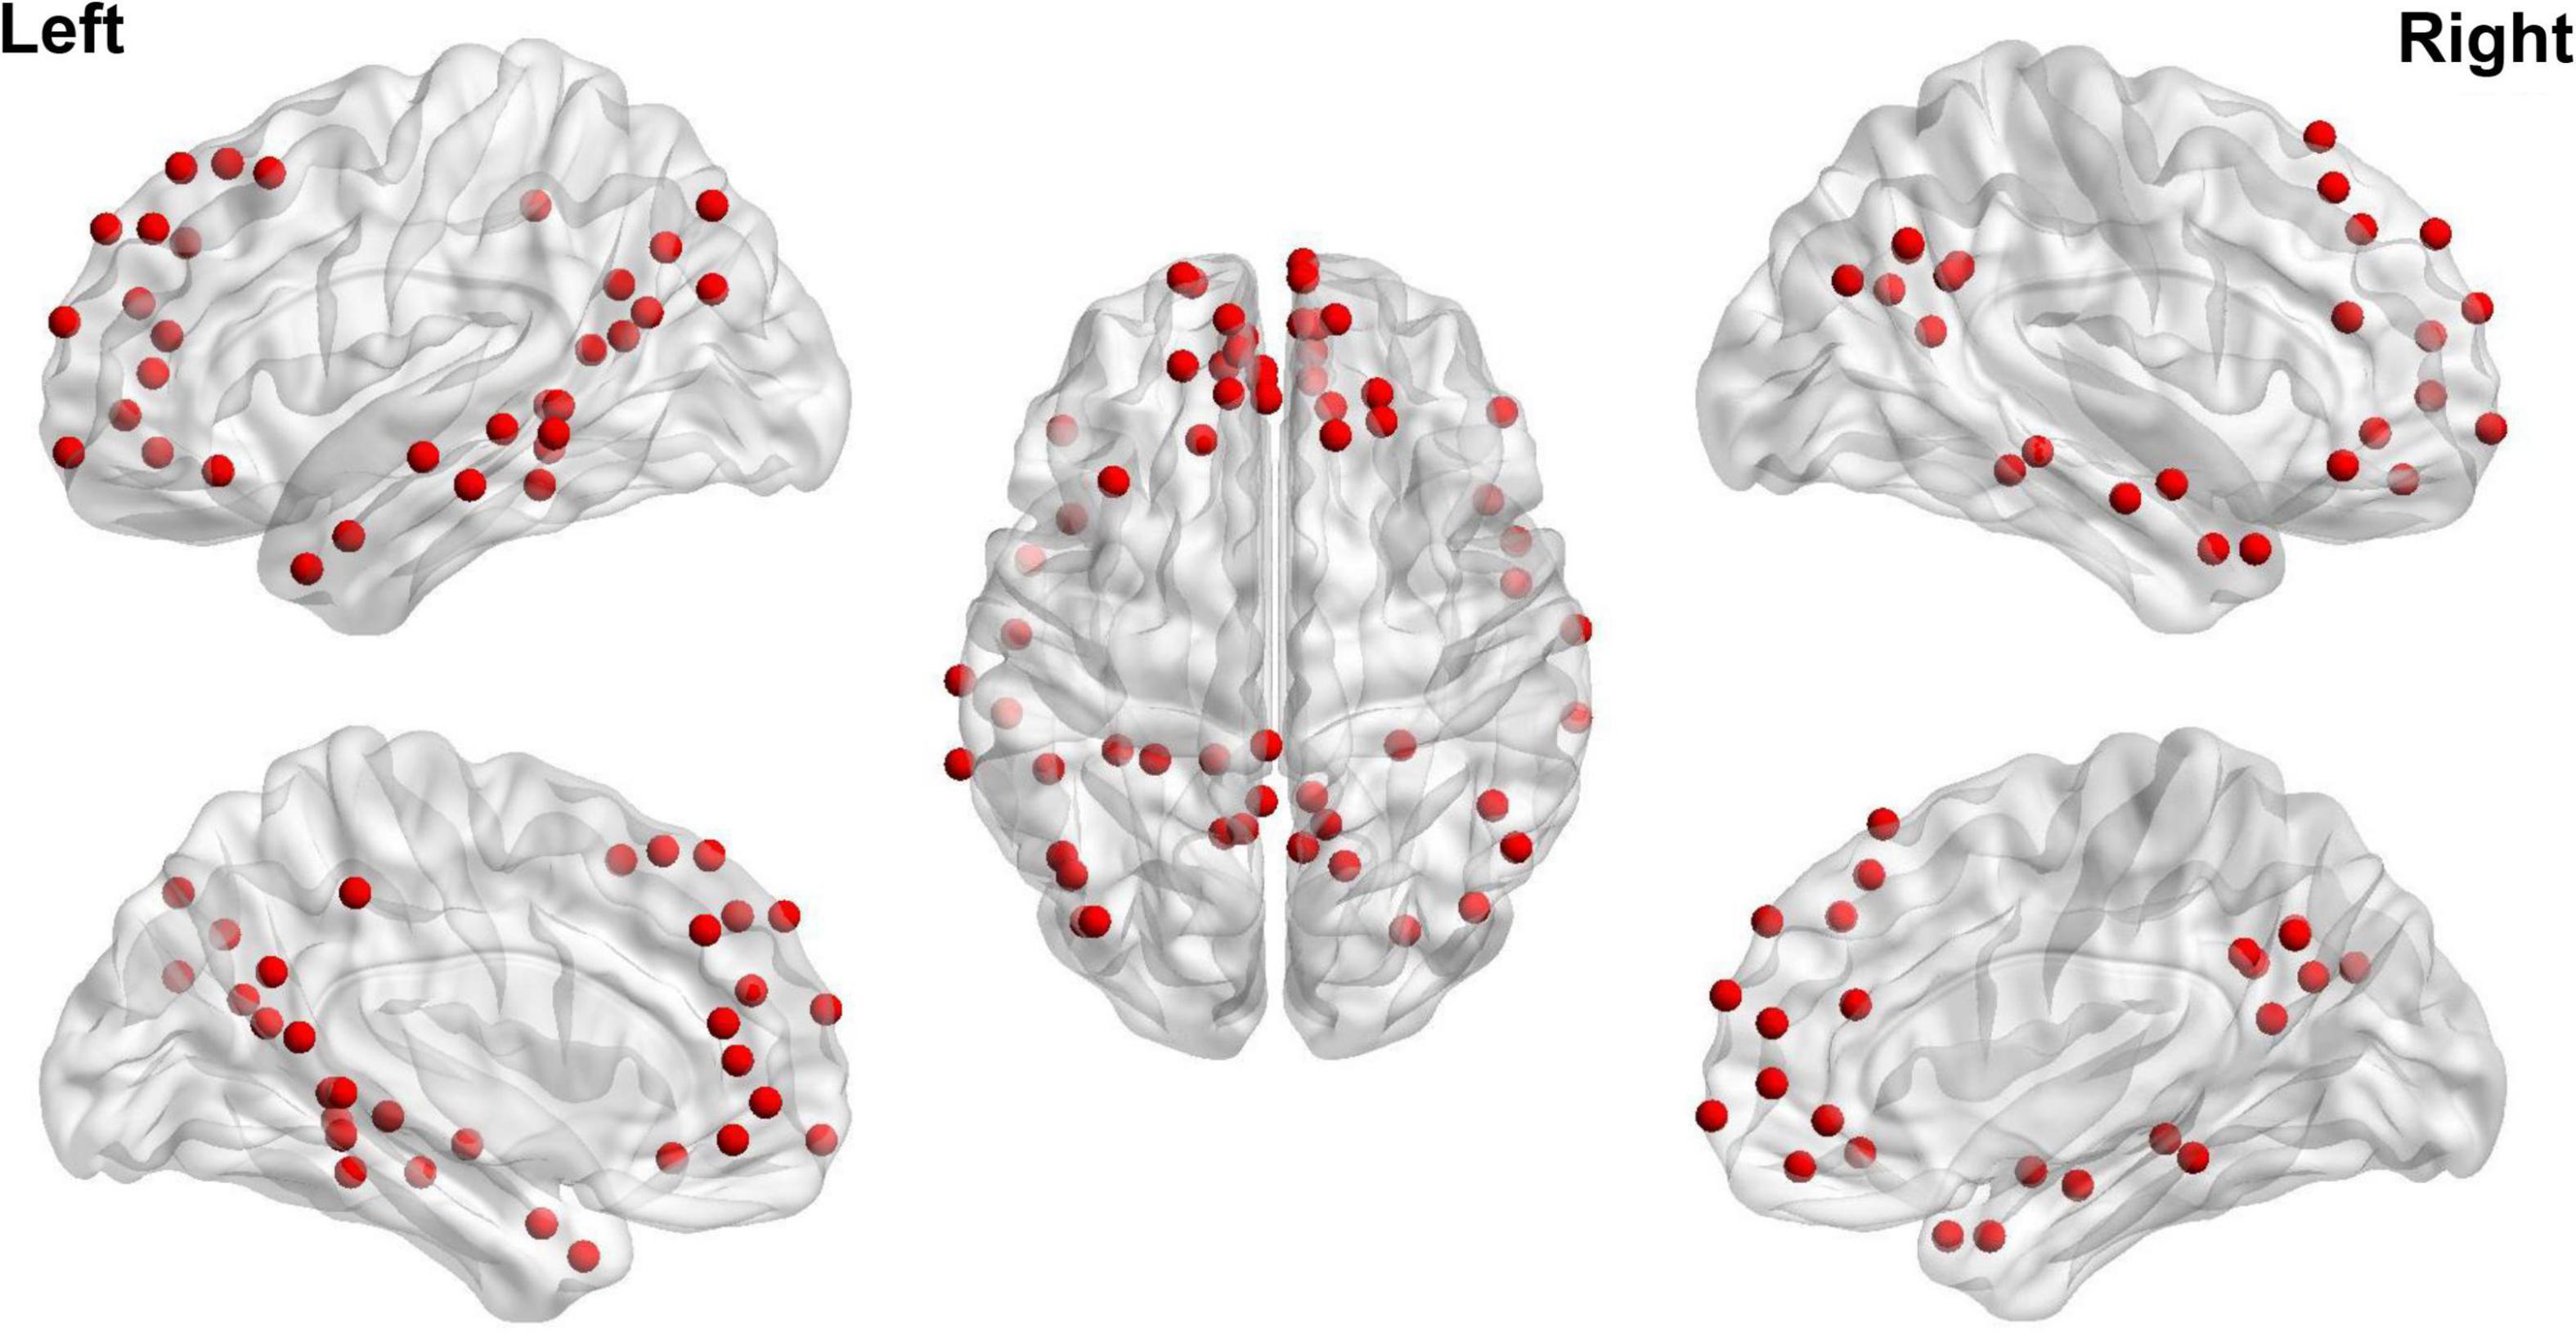
Figure 2. Regions of interest used to define the DMN based on Power et al. (2011).
To calculated FC strength within the DMN, the weighted adjacency FC matrices were computed for each participant. In the matrices, FC strengths between all possible (N = 58 × 57/2 = 1653 here) ROI pairs were estimated by Pearson’s correlation coefficients between fMRI time series. In line with previous work (Yan et al., 2019), the average FC values between all possible ROI pairs within the DMN was then defined as within-DMN FC strength.
To calculate temporal variability of dFC, a widely used sliding-windows approach (Long et al., 2020a; Huang D. et al., 2021; Huang X. et al., 2021) was applied to segment the time series of all ROIs into a number of continuous time windows; in the primary analyses, a window width of 100 s and a step length of 6 s were used according to previous recommendations (Sun et al., 2019; Long et al., 2020a). The same as static FC, weighted adjacency matrices were computed in each time window to represent dFC during different time periods. Average dFC variability within the DMN was estimated by averaging the dissimilarities of dFC profiles across different time windows. Briefly, node-wise temporal variability of dFC for a ROI k (Vk) was firstly computed as
where T is the total number of time windows depending on fMRI scanning length, F(i, k) is the vector characterizing dFC between ROI k and all other DMN ROIs within the ith time window, and “corrcoef” means correlation coefficients. Temporal variability of dFC for the whole DMN (V) was then calculated by averaging Vk of all ROIs within the DMN as
where N is equal to 58 here. More details about such methods can be found in prior studies (Zhang J. et al., 2016; Dong et al., 2019; Long et al., 2020a,b).
Assessing Diagnosis by Age Effects
Referring to a number of published work (Wright et al., 2014; Sheffield et al., 2016; Sacchet et al., 2017; van Velzen et al., 2020), linear regression analyses were performed to assess the MDD diagnosis by age interactions, with diagnosis (MDD = 0 vs. HCs = 1), age, and diagnosis × age interaction as variables of interest in the prediction of FC/dFC measures, as well as sex, education level, site (as dummy variables), and head motion (mean FD) as covariates (~intercept + diagnosis + age + diagnosis × age + sex+education + site + head motion). Note that here, ‘‘site’’ was included as a covariate to exclude potential effects of differences in fMRI scanning parameters and in the proportions of patients/controls enrolled by each site. Associations between age and FC/dFC measures in each group were further estimated by Pearson correlation coefficients and compared between groups using an online tool, cocor3 (Diedenhofen and Musch, 2015), utilizing the function of “comparing correlation coefficients in independent groups” in cocor which is based on procedures provided by Meng et al. (1992) and Zou (2007). All other statistical analyses (except the comparisons between correlation coefficients) were completed in SPSS v22.
Associations With Clinical Characteristics
Several additional analyses were performed to assess the possible associations between DMN FC/dFC and clinical characteristics. First, to investigate possible associations between the DMN FC/dFC and illness duration/HAMD scores/HAMA scores, partial Pearson correlations were calculated between them in patients whose corresponding information are available, after controlling for age, sex, education, site, and head motion. Second, to investigate if DMN FC/dFC patterns would differ by episodicity (first or recurrent), they were compared between the first-episode and recurrent patients using ANCOVA with covariates of age, sex, education, site, and head motion.
Validation Analysis
Several supplementary analyses were performed to validate our results. Firstly, in dFC studies, there remain debates about the optimal window width and step length in constructing dynamic brain networks (Qin et al., 2015; Zhang et al., 2018; Savva et al., 2020). Therefore, we repeated the analyses on DMN dFC using a range of different window widths (80/100/120 s) and step lengths (6/8/10 s) to see if the results would be changed. Secondly, we repeated the analyses with Fisher’s r-to-z transformations on Pearson’s correlation coefficients in all FC/dFC matrices, which were not performed in the main analyses. Thirdly, when dealing with regression analyses, heteroscedasticity is a common problem that may reduce the precision of model (Rosopa et al., 2013). Therefore, we tested the heteroscedasticity of each regression model and when there is a significant heteroscedasticity, we mitigated possible effects of heteroscedasticity by applying a logarithmic transformation to the dependent variable (calculating the natural logarithm) as suggested (Rosopa et al., 2013).
Results
Sample Characteristics
Demographic and clinical characteristics of the MDD and HC groups are summarized in Table 2. There were no significant differences in age and head motion between the MDD and HC groups (both p > 0.05). The MDD group had a higher proportion of females (χ2 = 5.724, p = 0.017) and a significantly lower education level (t = −4.996, p < 0.001) than HCs.
Linear Regression Results
The linear regression model revealed a significant main effect of age (β = −0.182, t = −6.115, p < 0.001) in the prediction of DMN FC strength, suggesting that both MDD patients and HCs experienced a similar reduction in DMN FC with age. Moreover, the model revealed a significant main effect of diagnosis (β = 0.074, t = 3.631, p < 0.001), suggesting a lower DMN FC in MDD patients; and a significant diagnosis × age interaction (β = 0.047, t = 2.334, p = 0.020) which was driven by a significantly stronger negative correlation (z = −2.183, p = 0.029) between age and DMN FC strength in MDD patients than in HCs (Table 3 and Figure 3A). Taken together, although the strength of DMN FC decreased with age in both the MDD and HC groups, such reduction may occurr at a faster rate in MDD patients. Additionally, a significant effect of sex (β = 0.061, t = 3.030, p = 0.002) was found in the model, which suggests a higher DMN FC strength in females than males.

Table 3. Comparisons on the correlation coefficients between groups.

Figure 3. Associations between age and DMN FC strength (A)/dFC variability (B) in each group.
As for DMN dFC, the linear regression model revealed a significant main effect of age (β = 0.086, t = 3.722, p < 0.001) in the prediction of dFC variability, suggesting that both MDD patients and HCs experienced a similar increase in DMN dFC variability with age. However, the model revealed no significant main effect of diagnosis (β = −0.017, t = −1.046, p = 0.296) and no significant diagnosis × age interaction (β = −0.030, t = −1.298, p = 0.054), with no between-group difference in the correlation between age and DMN dFC variability (z = 1.043, p = 0.297) (Table 3 and Figure 3B). Additionally, a significant effect of sex (β = −0.047, t = −2.894, p = 0.003) was found in the model, which suggests a lower DMN dFC variability in females than males.
Associations With Clinical Characteristics
No significant correlations were found between the DMN FC/dFC and illness duration/HAMD scores/HAMA scores (all p > 0.05, Table 4). No significant differences were found between the first-episode and recurrent patients in either the DMN FC strength (F = 0.816, p = 0.367) or dFC variability (F = 1.699, p = 0.193).
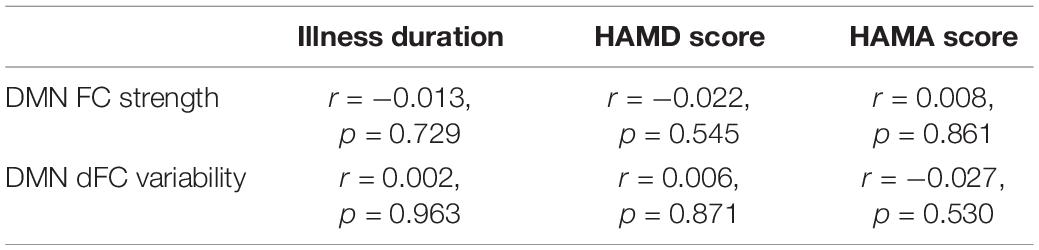
Table 4. Correlations between the DMN FC/dFC and clinical characteristics.
Validation Analysis
When re-calculating the DMN dFC with using a range of different window widths and step lengths, the regression models kept showing a significant main effect of age (p < 0.001, see Table 5) in the prediction of DMN dFC variability, while the main effect of diagnosis and diagnosis-by-age interaction kept being no significant (p > 0.05). The results on FC and dFC were also largely unchanged when repeating the analyses with Fisher’s r-to-z transformations on FC/dFC matrices (Supplementary Table 1). These results, therefore, suggest that the effects of age on FC strength/dFC variability were unlikely to be mainly driven by analyzing strategies.
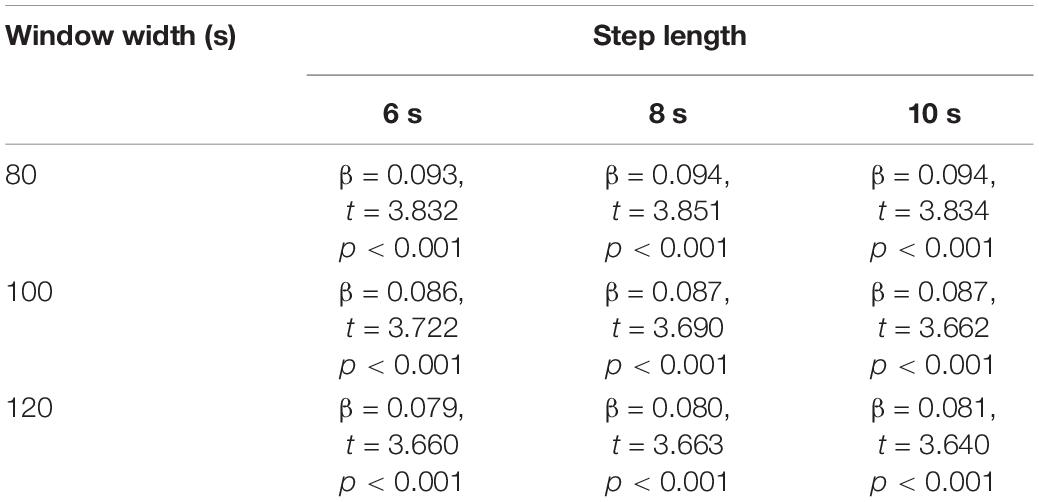
Table 5. Main effect of age in the prediction of DMN dFC variability, when dFC was calculated with different window widths/step lengths.
In regression model on the DMN FC strength, there exists a significant heteroscedasticity as indicated by a significant correlation between age and absolute values of the residuals (Spearman’s rho = −0.051, p = 0.027; shown in Supplementary Figure 1). Nevertheless, effects of such a heteroscedasticity can be corrected by applying a logarithmic transformation to the DMN FC strength (Supplementary Figure 1), while main results were unchanged in the corrected model (Supplementary Table 2). Therefore, the results were unlikely to be affected by the heteroscedasticity in regression models.
Discussion
In this study, we tested the hypothesis that MDD would be characterized by accelerated aging of brain function within the DMN as reflected by significant diagnosis-by-age interactions. Specially, age-related effects on both the strength of static FC and temporal variability of dFC within the DMN were investigated by linear regression models. Our results revealed (1) significant main effects of age in the prediction of both FC strength and dFC variability; and (2) a significant main effect of diagnosis and a significant diagnosis-by-age interaction in the prediction of FC strength within the DMN. These results may facilitate our understanding of both the process of biological aging and neural mechanisms underlying MDD.
The first main finding revealed by regression model in the present study is a significant main effect of age in the prediction of both FC strength and dFC variability within the DMN. Such results indicate that both healthy participants and MDD patients experienced similar decrease in DMN FC strength and increase in DMN dFC variability along age. These results are in line with a number of previous studies, which have consistently reported that older age is associated with lower FC strength (Bluhm et al., 2008; Mevel et al., 2013; Vidal-Piñeiro et al., 2014; Park et al., 2017; Staffaroni et al., 2018) and lower dFC stability (higher variability) (Qin et al., 2015; Marusak et al., 2017; Park et al., 2017) within the DMN. It is noteworthy that compared with most of the above studies, our study has a much larger sample size which means a higher reliability (Cao et al., 2019) achieved by using a large, multicenter dataset. Therefore, our results reinforce previous studies and may further offer solid evidence that normal aging of the brain can be reflected by changed FC/dFC patterns within the DMN.
The regression model also revealed a significant main effect of diagnosis, and a significant diagnosis-by-age interaction in the prediction of FC strength within the DMN. The significant main effect of diagnosis indicates a lower DMN FC strength in MDD patients. The DMN is known to mediate brain’s self-referential and internally directed processing (Whitfield-Gabrieli and Ford, 2012) and although not completely consistent (Scalabrini et al., 2020), its FC has been reported to be reduced in MDD in multiple studies (Chen et al., 2015; Jacob et al., 2020; Shi et al., 2020). Thus, our study further supports this result. The significant diagnosis-by-age interaction, which was driven by stronger negative correlation between age and DMN FC in MDD patients (Table 3 and Figure 3A), suggests that age-related reduction in DMN FC may occur at a faster rate in MDD patients than in HCs. Multiple previous neuroimaging studies have reported accelerated brain aging in MDD patients in terms of brain structures (Sacchet et al., 2017; Cheng et al., 2020; Ballester et al., 2021), but much less is known about it from a functional perspective. Here, to our knowledge, our study provides one of the first evidences of accelerated aging of FC within the DMN. Therefore, this brain subsystem may be an important target for the intervention and treatment of MDD across the lifespan.
We should note that in the regression model, no significant main effect of diagnosis and no significant diagnosis-by-age interaction (both p > 0.05) were found in the prediction of dFC variability. Thus, the present study failed to replicate previously reported MDD-related increase in DMN dFC variability (Wise et al., 2017; Long et al., 2020a). There are two potential reasons for such inconsistency as we proposed. First, in the analyzed sample we included participants with different fMRI scanning lengths, ranging from 300 to 500 s (Table 1). Although site effects have been controlled in the regression model, such diversity along the time dimension might bring bias to the results. Second, besides the reports of increased DMN dFC variability in MDD (Wise et al., 2017; Long et al., 2020a), there was also research reporting opposite results (Demirtaş et al., 2016). It is possible that subtypes with distinct DMN dFC profiles (hyper- and hypo-variability) may exist in MDD, which can be investigated in future studies.
Although we focused on age-related effects in this study, significant effects of sex were also shown in the regression models, indicating higher FC strength and lower dFC variability within the DMN in females than males. Such results are in concert with some earlier studies, which have pointed out potential sex differences in both static and dynamic brain connectome (Jiang et al., 2020; Long et al., 2021). These results might also, therefore, highlight the necessity of controlling sex-related effects in fMRI studies.
Our study has some limitations. Firstly and importantly, the current study was carried out based on cross-sectional rather than longitudinal data, and we cannot directly define the causation between MDD and accelerated aging. We are also unable to answer whether there are genetic or epigenetic deviations which cause both MDD and more rapid aging. Due to such limitations, it should be only one of possible interpretations of the presented data that MDD causes accelerated aging of brain. Secondly, the detailed clinical information for each MDD patient, such as comorbid conditions, number of prior depressive episodes and treatment details, was not fully recorded due to the variations in data management practices across different sites. This issue has limited our power to further analyze the effects of clinical variables on DMN FC/dFC patterns. Thirdly, because raw image data was not shared by the REST-meta-MDD Consortium, we are unable to further perform voxel-wise analyses (Cui et al., 2018) which may provide valuable information. Lastly, we only focused on FC strength and dFC variability within the DMN based on our literature driven hypothesis. However, other brain subsystems [e.g., salience, affective, and cognitive control networks (Zeng et al., 2012; Manoliu et al., 2014)] and other brain network measures [e.g., static and dynamic small-world metrics (Long et al., 2020a; Yang et al., 2021)] may be also relevant to the occurrence and development of MDD with age, which can be explored in further studies.
In summary, this study tested the hypothesis that MDD is characterized by accelerated aging of the brain function in terms of FC strength and dFC variability within the DMN. Diagnosis-by-age interactions on FC/dFC were estimated by linear regression models. The results suggest that both healthy participants and MDD patients experienced similar decrease in DMN FC strength and increase in DMN dFC variability along age; moreover, stronger negative correlations were found between DMN FC strength and age in MDD patients than in HCs, suggesting that age-related decrease in DMN FC may occur at a faster rate in MDD. These findings may further facilitate our understanding of mechanisms underlying the occurrence and development of MDD. However, further longitudinal studies are still needed to understand the causation between MDD and accelerated aging of brain.
Data Availability Statement
The datasets presented in this study can be found in online repositories. The names of the repository/repositories and accession number(s) can be found below: http://rfmri.org/REST-meta-MDD.
Ethics Statement
The studies involving human participants were reviewed and approved by the Ethics Committee of Second Xiangya Hospital, Central South University. The patients/participants provided their written informed consent to participate in this study.
Author Contributions
ST, ZW, and YL designed the study and carried out the analysis. XC, GW, WT, YL, and ZL contributed to the data collection. ST and YL wrote the first draft of manuscript. All authors contributed to the final manuscript and have read and agreed to the published version of the manuscript.
Funding
This work was supported by the Natural Science Foundation of Hunan Province, China (2021JJ40851 to YL and 2020JJ5800 to XC) and the National Natural Science Foundation of China (82071506 to ZL).
Conflict of Interest
The authors declare that the research was conducted in the absence of any commercial or financial relationships that could be construed as a potential conflict of interest.
Publisher’s Note
All claims expressed in this article are solely those of the authors and do not necessarily represent those of their affiliated organizations, or those of the publisher, the editors and the reviewers. Any product that may be evaluated in this article, or claim that may be made by its manufacturer, is not guaranteed or endorsed by the publisher.
Acknowledgments
The data of this study were provided by the members of the REST-meta-MDD Consortium.
Supplementary Material
The Supplementary Material for this article can be found online at: https://www.frontiersin.org/articles/10.3389/fnagi.2021.809853/full#supplementary-material
Footnotes
References
Ballester, P. L., Su, J., Nogovitsyn, N., Hassel, S., Strother, S. C., Arnott, S. R., et al. (2021). Accelerated brain aging in major depressive disorder and antidepressant treatment response: A CAN-BIND report. Neuroimage Clin. 32:102864. doi: 10.1016/j.nicl.2021.102864
Bluhm, R. L., Osuch, E. A., Lanius, R. A., Boksman, K., Neufeld, R. W. J., Théberge, J., et al. (2008). Default mode network connectivity: Effects of age, sex, and analytic approach. Neuroreport 19, 887–891. doi: 10.1097/WNR.0b013e328300ebbf
Byers, A. L., and Yaffe, K. (2011). Depression and risk of developing dementia. Nat. Rev. Neurol. 7, 323–331. doi: 10.1038/nrneurol.2011.60
Cao, H., McEwen, S. C., Forsyth, J. K., Gee, D. G., Bearden, C. E., Addington, J., et al. (2019). Toward leveraging human connectomic data in large consortia: Generalizability of fmri-based brain graphs across sites, sessions, and paradigms. Cereb. Cortex 29, 1263–1279. doi: 10.1093/cercor/bhy032
Chao-Gan, Y., and Yu-Feng, Z. (2010). DPARSF: A MATLAB toolbox for “pipeline” data analysis of resting-state fMRI. Front. Syst. Neurosci. 4:13. doi: 10.3389/fnsys.2010.00013
Chen, Y., Wang, C., Zhu, X., Tan, Y., and Zhong, Y. (2015). Aberrant connectivity within the default mode network in first-episode, treatment-naïve major depressive disorder. J. Affect. Disord. 183, 49–56. doi: 10.1016/j.jad.2015.04.052
Cheng, Y., Xu, J., Dong, C., Shen, Z., Zhou, C., Li, N., et al. (2020). Age-related atrophy of cortical thickness and genetic effect of ANK3 gene in first episode MDD patients. Neuroimage Clin. 28:102384. doi: 10.1016/j.nicl.2020.102384
Cizza, G., Primma, S., and Csako, G. (2009). Depression as a risk factor for osteoporosis. Trends Endocrinol. Metab. 20, 367–373. doi: 10.1016/j.tem.2009.05.003
Cole, M. W., Reynolds, J. R., Power, J. D., Repovs, G., Anticevic, A., and Braver, T. S. (2013). Multi-task connectivity reveals flexible hubs for adaptive task control. Nat. Neurosci. 16, 1348–1355. doi: 10.1038/nn.3470
Cui, X., Liu, F., Chen, J., Xie, G., Wu, R., Zhang, Z., et al. (2018). Voxel-wise brain-wide functional connectivity abnormalities in first-episode, drug-naive patients with major depressive disorder. Am. J. Med. Genet. Part B Neuropsychiatr. Genet. 177, 447–453. doi: 10.1002/ajmg.b.32633
Demirtaş, M., Tornador, C., Falcón, C., López-Solà, M., Hernández-Ribas, R., Pujol, J., et al. (2016). Dynamic functional connectivity reveals altered variability in functional connectivity among patients with major depressive disorder. Hum. Brain Mapp. 37, 2918–2930. doi: 10.1002/hbm.23215
Diedenhofen, B., and Musch, J. (2015). Cocor: A comprehensive solution for the statistical comparison of correlations. PLoS One 10:e0121945. doi: 10.1371/journal.pone.0121945
Ding, Y. D., Yang, R., Yan, C. G., Chen, X., Bai, T. J., Bo, Q. J., et al. (2021). Disrupted hemispheric connectivity specialization in patients with major depressive disorder: Evidence from the REST-meta-MDD Project. J. Affect. Disord. 284, 217–228. doi: 10.1016/j.jad.2021.02.030
Dong, D., Duan, M., Wang, Y., Zhang, X., Jia, X., Li, Y., et al. (2019). Reconfiguration of Dynamic Functional Connectivity in Sensory and Perceptual System in Schizophrenia. Cereb. Cortex 29, 3577–3589. doi: 10.1093/cercor/bhy232
Dunlop, K., Victoria, L. W., Downar, J., Gunning, F. M., and Liston, C. (2021). Accelerated brain aging predicts impulsivity and symptom severity in depression. Neuropsychopharmacology 46, 911–919. doi: 10.1038/s41386-021-00967-x
Gan, Y., Gong, Y., Tong, X., Sun, H., Cong, Y., Dong, X., et al. (2014). Depression and the risk of coronary heart disease: A meta-analysis of prospective cohort studies. BMC Psychiatry 14:371. doi: 10.1186/s12888-014-0371-z
Holmquist, S., Nordström, A., and Nordström, P. (2020). The association of depression with subsequent dementia diagnosis: A Swedish nationwide cohort study from 1964 to 2016. PLoS Med 17:e1003016. doi: 10.1371/JOURNAL.PMED.1003016
Huang, D., Liu, Z., Cao, H., Yang, J., Wu, Z., and Long, Y. (2021). Childhood trauma is linked to decreased temporal stability of functional brain networks in young adults. J. Affect. Disord. 290, 23–30. doi: 10.1016/j.jad.2021.04.061
Huang, X., Wu, Z., Liu, Z., Liu, D., Huang, D., and Long, Y. (2021). Acute Effect of Betel Quid Chewing on Brain Network Dynamics: A Resting-State Functional Magnetic Resonance Imaging Study. Front. Psychiatry 12:701420. doi: 10.3389/fpsyt.2021.701420
Jacob, Y., Morris, L. S., Huang, K. H., Schneider, M., Rutter, S., Verma, G., et al. (2020). Neural correlates of rumination in major depressive disorder: A brain network analysis. Neuroimage Clin. 25:102142. doi: 10.1016/j.nicl.2019.102142
Jiang, R., Calhoun, V. D., Fan, L., Zuo, N., Jung, R., Qi, S., et al. (2020). Gender Differences in Connectome-based Predictions of Individualized Intelligence Quotient and Sub-domain Scores. Cereb. Cortex 30, 888–900. doi: 10.1093/cercor/bhz134
Levada, O. A., and Troyan, A. S. (2020). Major depressive disorder and accelerated aging from a peripheral IGF-1 overexpression perspective. Med. Hypotheses 138:109610. doi: 10.1016/j.mehy.2020.109610
Liang, S., Deng, W., Li, X., Greenshaw, A. J., Wang, Q., Li, M., et al. (2020). Biotypes of major depressive disorder: Neuroimaging evidence from resting-state default mode network patterns. Neuroimage Clin. 28:102514. doi: 10.1016/j.nicl.2020.102514
Liu, P. H., Li, Y., Zhang, A. X., Sun, N., Li, G. Z., Chen, X., et al. (2021). Brain structural alterations in MDD patients with gastrointestinal symptoms: Evidence from the REST-meta-MDD project. Prog. Neuro Psychopharmacol. Biol. Psychiatry 111:110386. doi: 10.1016/j.pnpbp.2021.110386
Long, Y., Cao, H., Yan, C., Chen, X., Li, L., Castellanos, F. X., et al. (2020a). Altered resting-state dynamic functional brain networks in major depressive disorder: Findings from the REST-meta-MDD consortium. Neuroimage Clin. 26:102163. doi: 10.1016/j.nicl.2020.102163
Long, Y., Chen, C., Deng, M., Huang, X., Tan, W., Zhang, L., et al. (2019). Psychological resilience negatively correlates with resting-state brain network flexibility in young healthy adults: a dynamic functional magnetic resonance imaging study. Ann. Transl. Med. 7, 809–809. doi: 10.21037/atm.2019.12.45
Long, Y., Liu, Z., Chan, C. K. Y., Wu, G., Xue, Z., Pan, Y., et al. (2020b). Altered Temporal Variability of Local and Large-Scale Resting-State Brain Functional Connectivity Patterns in Schizophrenia and Bipolar Disorder. Front. Psychiatry 11:422. doi: 10.3389/fpsyt.2020.00422
Long, Y., Yan, C., Wu, Z., Huang, X., and Cao, H. (2021). Evaluating test-retest reliability and sex/age-related effects on temporal clustering coefficient of dynamic functional brain networks. Biorxiv doi: 10.1101/2021.10.21.465376
Manoliu, A., Meng, C., Brandl, F., Doll, A., Tahmasian, M., Scherr, M., et al. (2014). Insular dysfunction within the salience network is associated with severity of symptoms and aberrant inter-network connectivity in major depressive disorder. Front. Hum. Neurosci. 7:930. doi: 10.3389/fnhum.2013.00930
Marusak, H. A., Calhoun, V. D., Brown, S., Crespo, L. M., Sala-Hamrick, K., Gotlib, I. H., et al. (2017). Dynamic functional connectivity of neurocognitive networks in children. Hum. Brain Mapp. 38, 97–108. doi: 10.1002/hbm.23346
Meng, X. L., Rosenthal, R., and Rubin, D. B. (1992). Comparing correlated correlation coefficients. Psychol. Bull. 111, 172–175. doi: 10.1037/0033-2909.111.1.172
Mevel, K., Landeau, B., Fouquet, M., La Joie, R., Villain, N., Mézenge, F., et al. (2013). Age effect on the default mode network, inner thoughts, and cognitive abilities. Neurobiol. Aging 34, 1292–1301. doi: 10.1016/j.neurobiolaging.2012.08.018
Mulders, P. C., van Eijndhoven, P. F., Schene, A. H., Beckmann, C. F., and Tendolkar, I. (2015). Resting-state functional connectivity in major depressive disorder: A review. Neurosci. Biobehav. Rev. 56, 330–344. doi: 10.1016/j.neubiorev.2015.07.014
Park, J. E., Jung, S. C., Ryu, K. H., Oh, J. Y., Kim, H. S., Choi, C. G., et al. (2017). Differences in dynamic and static functional connectivity between young and elderly healthy adults. Neuroradiology 59, 781–789. doi: 10.1007/s00234-017-1875-2
Power, J. D., Cohen, A. L., Nelson, S. M., Wig, G. S., Barnes, K. A., Church, J. A., et al. (2011). Functional Network Organization of the Human Brain. Neuron 72, 665–678. doi: 10.1016/j.neuron.2011.09.006
Protsenko, E., Yang, R., Nier, B., Reus, V., Hammamieh, R., Rampersaud, R., et al. (2021). GrimAge,” an epigenetic predictor of mortality, is accelerated in major depressive disorder. Transl. Psychiatry 11:193. doi: 10.1038/s41398-021-01302-0
Qin, J., Chen, S. G., Hu, D., Zeng, L. L., Fan, Y. M., Chen, X. P., et al. (2015). Predicting individual brain maturity using dynamic functional connectivity. Front. Hum. Neurosci. 9:418. doi: 10.3389/fnhum.2015.00418
Rosopa, P. J., Schaffer, M. M., and Schroeder, A. N. (2013). Managing heteroscedasticity in general linear models. Psychol. Methods 18, 335–351. doi: 10.1037/a0032553
Sacchet, M. D., Camacho, M. C., Livermore, E. E., Thomas, E. A. C., and Gotlib, I. H. (2017). Accelerated aging of the putamen in patients with major depressive disorder. J. Psychiatry Neurosci. 42, 164–171. doi: 10.1503/jpn.160010
Savva, A. D., Kassinopoulos, M., Smyrnis, N., Matsopoulos, G. K., and Mitsis, G. D. (2020). Effects of motion related outliers in dynamic functional connectivity using the sliding window method. J. Neurosci. Methods 330:108519. doi: 10.1016/j.jneumeth.2019.108519
Scalabrini, A., Vai, B., Poletti, S., Damiani, S., Mucci, C., Colombo, C., et al. (2020). All roads lead to the default-mode network—global source of DMN abnormalities in major depressive disorder. Neuropsychopharmacology 45, 2058–2069. doi: 10.1038/s41386-020-0785-x
Sheffield, J. M., Repovs, G., Harms, M. P., Carter, C. S., Gold, J. M., Macdonald, A. W., et al. (2016). Evidence for accelerated decline of functional brain network efficiency in schizophrenia. Schizophr. Bull. 42, 753–761. doi: 10.1093/schbul/sbv148
Shi, Y., Li, J., Feng, Z., Xie, H., Duan, J., Chen, F., et al. (2020). Abnormal functional connectivity strength in first-episode, drug-naïve adult patients with major depressive disorder. Prog. Neuro Psychopharmacol. Biol. Psychiatry 97:109759. doi: 10.1016/j.pnpbp.2019.109759
Shi, Y., Zhang, L., Wang, Z., Lu, X., Wang, T., Zhou, D., et al. (2021). Multivariate Machine Learning Analyses in Identification of Major Depressive Disorder Using Resting-State Functional Connectivity: A Multicentral Study. ACS Chem. Neurosci. 12, 2878–2886. doi: 10.1021/acschemneuro.1c00256
Simon, N. M., Smoller, J. W., McNamara, K. L., Maser, R. S., Zalta, A. K., Pollack, M. H., et al. (2006). Telomere Shortening and Mood Disorders: Preliminary Support for a Chronic Stress Model of Accelerated Aging. Biol. Psychiatry 60, 432–435. doi: 10.1016/j.biopsych.2006.02.004
Staffaroni, A. M., Brown, J. A., Casaletto, K. B., Elahi, F. M., Deng, J., Neuhaus, J., et al. (2018). The longitudinal trajectory of default mode network connectivity in healthy older adults varies as a function of age and is associated with changes in episodic memory and processing speed. J. Neurosci. 38, 2809–2817. doi: 10.1523/JNEUROSCI.3067-17.2018
Sun, Y., Collinson, S. L., Suckling, J., and Sim, K. (2019). Dynamic reorganization of functional connectivity reveals abnormal temporal efficiency in schizophrenia. Schizophr. Bull. 45, 659–669. doi: 10.1093/schbul/sby077
van Velzen, L. S., Kelly, S., Isaev, D., Aleman, A., Aftanas, L. I., Bauer, J., et al. (2020). White matter disturbances in major depressive disorder: a coordinated analysis across 20 international cohorts in the ENIGMA MDD working group. Mol. Psychiatry 25, 1511–1525. doi: 10.1038/s41380-019-0477-2
Vidal-Piñeiro, D., Valls-Pedret, C., Fernandez-Cabello, S., Arenaza-Urquijo, E. M., Sala-Llonch, R., and Solana, E. (2014). Decreased Default Mode Network connectivity correlates with age-associated structural and cognitive changes. Front. Aging Neurosci. 6:256. doi: 10.3389/fnagi.2014.00256
Whitfield-Gabrieli, S., and Ford, J. M. (2012). Default mode network activity and connectivity in psychopathology. Annu. Rev. Clin. Psychol. 8, 49–76. doi: 10.1146/annurev-clinpsy-032511-143049
Wise, T., Marwood, L., Perkins, A. M., Herane-Vives, A., Joules, R., Lythgoe, D. J., et al. (2017). Instability of default mode network connectivity in major depression: A two-sample confirmation study. Transl. Psychiatry 7:e1105. doi: 10.1038/tp.2017.40
Wolkowitz, O. M., Reus, V. I., and Mellon, S. H. (2011). Of sound mind and body: Depression, disease, and accelerated aging. Dialogues Clin. Neurosci. 13, 25–40. doi: 10.31887/dcns.2011.13.1/owolkowitz
Wright, S. N., Kochunov, P., Chiappelli, J., McMahon, R. P., Muellerklein, F., Wijtenburg, S. A., et al. (2014). Accelerated white matter aging in schizophrenia: Role of white matter blood perfusion. Neurobiol. Aging 35, 2411–2418. doi: 10.1016/j.neurobiolaging.2014.02.016
Xia, M., Wang, J., and He, Y. (2013). BrainNet Viewer: A Network Visualization Tool for Human Brain Connectomics. PLoS One 8:e68910. doi: 10.1371/journal.pone.0068910
Yan, C. G., Chen, X., Li, L., Castellanos, F. X., Bai, T. J., Bo, Q. J., et al. (2019). Reduced default mode network functional connectivity in patients with recurrent major depressive disorder. Proc. Natl. Acad. Sci. U. S. A. 116, 9078–9083. doi: 10.1073/pnas.1900390116
Yan, C. G., Di Wang, X, Zuo, X. N., and Zang, Y. F. (2016). DPABI: Data Processing & Analysis for (Resting-State) Brain Imaging. Neuroinformatics 14, 339–351. doi: 10.1007/s12021-016-9299-4
Yang, H., Chen, X., Chen, Z.-B., Li, L., Li, X.-Y., Castellanos, F. X., et al. (2021). Disrupted intrinsic functional brain topology in patients with major depressive disorder. Mol. Psychiatry 3058:15. doi: 10.1038/s41380-021-01247-2
Zanatta, D. P., Rondinoni, C., Salmon, C. E. G., and Del Ben, C. M. (2019). Brain alterations in first episode depressive disorder and resting state fMRI: A systematic review. Psychol. Neurosci. 12, 407–429. doi: 10.1037/pne0000165
Zeng, L. L., Shen, H., Liu, L., Wang, L., Li, B., Fang, P., et al. (2012). Identifying major depression using whole-brain functional connectivity: A multivariate pattern analysis. Brain 135, 1498–1507. doi: 10.1093/brain/aws059
Zhang, C., Baum, S. A., Adduru, V. R., Biswal, B. B., and Michael, A. M. (2018). Test-retest reliability of dynamic functional connectivity in resting state fMRI. Neuroimage 183, 907–918. doi: 10.1016/j.neuroimage.2018.08.021
Zhang, J., Cheng, W., Liu, Z., Zhang, K., Lei, X., Yao, Y., et al. (2016). Neural, electrophysiological and anatomical basis of brain-network variability and its characteristic changes in mental disorders. Brain 139, 2307–2321. doi: 10.1093/brain/aww143
Zhang, K., Zhu, Y., Zhu, Y., Wu, S., Liu, H., Zhang, W., et al. (2016). Molecular, Functional, and Structural Imaging of Major Depressive Disorder. Neurosci. Bull. 32, 273–285. doi: 10.1007/s12264-016-0030-0
Keywords: major depressive disorder, aging, fMRI, functional connectivity, dynamic functional connectivity (dFC), dynamic brain network
Citation: Tang S, Wu Z, Cao H, Chen X, Wu G, Tan W, Liu D, Yang J, Long Y and Liu Z (2022) Age-Related Decrease in Default-Mode Network Functional Connectivity Is Accelerated in Patients With Major Depressive Disorder. Front. Aging Neurosci. 13:809853. doi: 10.3389/fnagi.2021.809853
Received: 05 November 2021; Accepted: 20 December 2021;
Published: 10 January 2022.
Edited by:
Wenjing Zhang, Sichuan University, ChinaReviewed by:
Nicola Filippini, University of Oxford, United KingdomOlga V. Martynova, Institute of Higher Nervous Activity and Neurophysiology, Russian Academy of Sciences (RAS), Russia
Joan Guàrdia-Olmos, University of Barcelona, Spain
Copyright © 2022 Tang, Wu, Cao, Chen, Wu, Tan, Liu, Yang, Long and Liu. This is an open-access article distributed under the terms of the Creative Commons Attribution License (CC BY). The use, distribution or reproduction in other forums is permitted, provided the original author(s) and the copyright owner(s) are credited and that the original publication in this journal is cited, in accordance with accepted academic practice. No use, distribution or reproduction is permitted which does not comply with these terms.
*Correspondence: Yicheng Long, yichenglong@csu.edu.cn
†These authors have contributed equally to this work