Fluorescence based HTS-compatible ligand binding assays for dopamine D3 receptors in baculovirus preparations and live cells
 Maris-Johanna Tahk1†
  Tõnis Laasfeld1,2†
  Elo Meriste1
  Jose Brea3
  Maria Isabel Loza3
  Maria Majellaro4,5
  Marialessandra Contino6
  Eddy Sotelo4
  Ago Rinken1*
- 1Institute of Chemistry, University of Tartu, Tartu, Estonia
- 2Department of Computer Science, University of Tartu, Tartu, Estonia
- 3Centro Singular de Investigación en Medicina Molecular y Enfermedades Crónicas (CiMUS), Universidade de Santiago de Compostela, Santiago, Spain
- 4Centro Singular de Investigación en Química Biolóxica e Materiais Moleculares (CiQUS), Universidade de Santiago de Compostela, Santiago, Spain
- 5Celtarys Research S.L., Santiago, Spain
- 6Dipartimento di Farmacia-Scienze del Farmaco, Università degli Studi di Bari Aldo Moro, Bari, Italy
Dopamine receptors are G-protein-coupled receptors that are connected to severe neurological disorders. The development of new ligands targeting these receptors enables gaining a deeper insight into the receptor functioning, including binding mechanisms, kinetics and oligomerization. Novel fluorescent probes allow the development of more efficient, cheaper, reliable and scalable high-throughput screening systems, which speeds up the drug development process. In this study, we used a novel Cy3B labelled commercially available fluorescent ligand CELT-419 for developing dopamine D3 receptor-ligand binding assays with fluorescence polarization and quantitative live cell epifluorescence microscopy. The fluorescence anisotropy assay using 384-well plates achieved Z’ value of 0.71, which is suitable for high-throughput screening of ligand binding. The assay can also be used to determine the kinetics of both the fluorescent ligand as well as some reference unlabeled ligands. Furthermore, CELT-419 was also used with live HEK293-D3R cells in epifluorescence microscopy imaging for deep-learning-based ligand binding quantification. This makes CELT-419 quite a universal fluorescence probe which has the potential to be also used in more advanced microscopy techniques resulting in more comparable studies.
1 Introduction
Dopamine receptors are G-protein-coupled receptors (GPCRs), which have five subtypes - D1-5. The dysfunction of these receptors has been linked to the development of many serious pathologies, like depression, schizophrenia and Parkinson’s disease (Leggio et al., 2016; Sokoloff and Le Foll, 2017). Therefore, numerous dopamine ligands have been approved as drugs. However, these drugs often have serious side effects and too low or temporary therapeutic effects (Borovac, 2016; Garcia-Borreguero et al., 2016). As dopaminergic signalling is quite complex, there is a need for novel assays to study this system. Ligand binding affinity along with the kinetic properties determine if a ligand is a suitable drug candidate. Although kinetic parameters are difficult to obtain with endpoint assays, several luminescence-based (Borgarelli et al., 2021), but also label-free methods (Rascol et al., 2021), which allow online monitoring of ligand binding, have emerged as promising alternatives.
Even though the first fluorescent ligands for dopamine D1 and D2 receptors were already published in 1989 (Monsma Jr. et al., 1989; Barton et al., 1991), they have not found wide usage in binding assays so far. Since then, several next-generation fluorescent ligands have been developed for different dopamine receptor subtypes, including D3 receptors, which have found use in multiple assays. For example, in 2015, D3 receptor partial agonist BP 897 was labelled with either DY647 or fluorescein and used in a time-resolved fluorescence resonance energy transfer assay to study D1/D3 receptor hetero-oligomers (Hounsou et al., 2015). In 2016 several Cy3B labelled ligands were synthesized to study dopamine receptor dimerization with TIRF microscopy (Tabor et al., 2016). That set of Cy3B labelled fluorescence ligands was very diverse, including agonists based on (S)-5-OH-DPAT and antagonists as well as bivalent ligands both based on 1,4-disubstituted phenylpiperazine. In a more recent study, the indanylamine pharmacophore was labelled with Alexa488, Cy3B, and tetramethylrhodamine dyes (TAMRA) to be used in different assays (Allikalt et al., 2020). All three ligands were tested in the nanoBRET assay, where the affinities obtained were similar to the sub-nanomolar affinities obtained from the radioligand binding assay. Furthermore, to visualize D2 and D3 receptors in TIRF microscopy, the Cy3B-labeled probe was used. Moreover, NAPS-Cy3B was used to develop a quantitative live cell microscopy assay (Allikalt et al., 2021). This assay allows high-content ligand binding studies in live cells by utilizing a machine-learning model for cell contour detection from bright-field microscopy images and fluorescence channel for binding quantification. The most recent development in fluorescence methods to study D3 receptors is the PharmacoSTORM utilizing Sulfo-Cy5-labeled cariprazine to quantify drug-target interaction sites at the nanoscale level within complex tissue preparations (Prokop et al., 2021). The problem with all these ligands is their unavailability, as they all are synthesized in-house for a particular study and are not commercially available for either research or HTS applications. However, commercial alternatives also exist, for example, D1-like receptor ligands from Hello Bio and D2-like receptor ligands from Celtarys Research.
A better understanding of ligand binding kinetics is necessary for a more mechanistic and systematic insight into drug action. Therefore, fluorescence polarization assays and other fluorescence based methods allowing kinetic measurements help reduce this fundamental knowledge gap. Fluorescence anisotropy (FA) assay has been used to study the ligand binding kinetics of many GPCRs - 5-HT1A (Tõntson et al., 2014), melanocortin MC4 (Link et al., 2017), dopamine D1 (Allikalt et al., 2018), neuropeptide Y Y1 (Müller et al., 2022), muscarinic acetylcholine M2 (Grätz et al., 2021) and M4 (Tahk et al., 2022) receptors. FA is based on measuring the change in rotational freedom of the fluorescent label upon receptor binding and, therefore, does not require the physical separation of the bound and free ligand (Rinken et al., 2018). Upon receptor-ligand complex formation, the rotational diffusion time of the bound ligand should be significantly hindered compared to the fluorescence lifetime of the label to obtain a large change in FA. Moreover, due to the ratiometric nature of the assay, the FA signal depends on the concentration of both the free and the receptor-bound fluorescent ligand. Therefore, FA requires sufficient receptor concentration to achieve free achieve depletion of free fluorescent ligand. Budded baculoviruses (BBV) have a high receptor concentration as well as being homogenous in size, which makes them a good receptor source for FA assay. (Rinken et al., 2018). As the kinetic mechanisms of ligand binding can be more complex compared to equilibrium models and ligand depletion requirement of FA assay leads to second-order kinetic conditions it is necessary to apply appropriate data analysis techniques to such data. A suitable solution is provided by global analysis techniques using systems of ordinary differential equations which are typically implemented in systems biology software (Beechem et al., 2002). Global analysis with systems biology software typically allows avoiding multiple problems such as model-imposed restrictions to experimental design, more efficient search and validation of the correct binding mechanism and in this case accurate prediction of kinetic parameters of both labeled and unlabeled ligands.
It must be considered that the BBVs are nanoparticles covered with Sf9 cell membranes that have a different membrane composition compared to mammalian cells (Marheineke et al., 1998) which also may affect receptors’ properties (Harikumar et al., 2005; Mondal et al., 2014). BBVs also lack downstream signalling components like G-proteins and β-arrestins, which modulate the ligand binding affinities and receptor trafficking. The more straightforward system allows for studying ligand binding without additional interference and sources of variability, but it does not allow for the investigation of the full complexity of the system. Therefore, to obtain a more complete picture, it is important to measure ligand binding in a more natural system like live mammalian cells. As mentioned before, quantitative live cell microscopy assay (Allikalt et al., 2021) has been developed for D3 receptors, and further improvements were made with the muscarinic acetylcholine M4 receptor. This method relies on cell segmentation from the bright-field channel while quantifying ligand binding from the fluorescence channel. The advantage of this approach is that no additional fluorescence channels are needed for cell and cell contour detection reducing both photo and chemical toxicity while also allowing for the analysis of different areas of the cell depending on the cell type or the goal of the analysis. The method has been further developed to allow for kinetic measurements and reduced data volumes by employing deep convolutional neural networks, which regularly surpass more classical machine learning models such as random forests (Caicedo et al., 2019; Tahk et al., 2022). Nowadays, many machine learning models can be developed in almost any available high-performance cluster or even on a reasonably powerful PC, but it is also possible to use freely available open-source cloud-based tools for the task. Generally, preferring these open-source community-based tools is likely to lead to better and more robust models even if the user has not received extensive training in computer science as tutorials and explanations are provided which helps to avoid common pitfalls. Some of such tools also provide pre-trained machine learning models which could work for a specific assay without any need for retraining a model. In the present study, the open-source ZeroCostDL4Mic framework was used for developing the deep convolutional neural network cell segmentation model with the corresponding Jupyter notebooks (Kluyver et al., 2016).
To cross-validate the developed assays, we employed three complementary methods – radioligand binding, FA and live-cell microscopy assay to measure the binding affinity of CELT-419 to D3 receptors. The possibility to use CELT-419 in different types of assays allows high flexibility of further assay development towards fully automated high-throughput screening of unlabeled ligands or more advanced live-cell microscopy-based assays.
2 Materials and methods
2.1 Materials
The assay buffer consisted of MilliQ water, 11 mM Na-HEPES (pH = 7.4) (Sigma-Aldrich), 135 mM NaCl (AppliChem), 1 mM CaCl2 (AppliChem), 5 mM KCl (AppliChem), 1 mM MgCl2 (AppliChem), protease inhibitor cocktail (according to the manufacturer’s description, Roche) and 0.1% Pluronic® F-127 (Sigma-Aldrich). Dithiothreitol (DTT) (AppliChem) was added to the assay buffer for experiments with dopamine and apomorphine with an end concentration of 1 mM.
D3 receptor ligands 7-hydroxy-DPAT hydrobromide were purchased from TOCRIS and Spiperone (Sigma S7395), Haloperidol (Sigma H1512), Dopamine, Apomorphine, and Butaclamol were from Sigma-Aldrich. The fluorescent ligand CELT-419, its pharmacophore P-165 and pharmacophore with linker PL-384 were kindly provided by Celtarys Research. Stock solutions of these ligands were prepared in DMSO (Applichem) or Milli-Q water in the case of Dopamine.
2.2 Cell culture
Spodoptera frugiperda Sf9 (Invitrogen) cells were cultured in serum-free Excell420™ (Sigma-Aldrich) and Mimic™ Sf9 Insect Cells were cultured in Excell420™ supplemented with 2% fetal bovine serum (Sigma-Aldrich) at 27 °C as a suspension culture.
Human embryonic kidney cell line HEK293 stably expressing human wild-type dopamine D3 receptors (HEK293-D3R) was generated by Dr Reet Reinart-Okugbeni as described in (Reinart-Okugbeni et al., 2012). The cells were grown as an adherent monolayer on BioLite Petri dishes (Thermo Fisher Scientific) in DMEM high glucose medium (Sigma-Aldrich) supplemented with 9% fetal bovine serum, antibiotic antimycotic solution (100 U/ml penicillin, 0.1 mg/ml streptomycin, 0.25 μg/ml amphotericin B) (Sigma-Aldrich), and 400 μg/ml geneticin (Capricorn Scientific) at 37°C in a humidified incubator with 5% CO2.
The density and viability of cells were determined with the addition of 0.2% trypan blue (Sigma-Aldrich) using an Automated Cell Counter TC20™ (Bio-Rad Laboratories, Sundyberg, Sweden).
2.3 Radioligand binding assay
All dopamine receptor competition binding experiments were carried out in a polypropylene 96-well plate. For D3 receptors in each well was incubated 2 μg of membranes from D3 cell line (Perkin Elmer, ES-173M400UA, protein concentration = 1000 μg/ml), 1 nM [3H]-Spiperone (68 Ci/mmol, 1 mCi/ml, Perkin Elmer NET1187001MC) with compounds studied or a standard. Non-specific binding was determined in the presence of 1 μM Haloperidol (Sigma H1512). The reaction mixture (Vtotal: 250 μL/well) was incubated at 25 °C for 60 min, 200 μL was transferred to GF/C 96-well plate (Millipore, Madrid, Spain) pretreated with 0.5% of PEI and treated with binding buffer (50 mM Tris-HCl, 5 mM MgCl2, pH = 7.4), after which it was filtered and washed four times with 250 μL of wash buffer (50 mM Tris-HCl, pH = 7.4), before measuring in a microplate beta scintillation counter (Microbeta Trilux, PerkinElmer, Madrid, Spain).
For D2 receptors, in each well, 20 μg of membranes from CHO-D2#S20 cell line (Lot: A005/04-06-2020, protein concentration = 4322 μg/ml) were incubated, along with 1.5 nM [3H]-Spiperone (54.3 Ci/mmol, 1 mCi/ml, Perkin Elmer NET1187250UC), the compounds to be studied or the compound used as a standard. Non-specific binding was determined in the presence of 10 μM Sulpiride (S8010, Sigma Aldrich). The reaction mixture (Vtotal: 250 μL/well) was incubated at 25 °C for 120 min. The following step are the same as for D3 receptors.
For Dopamine D4 receptor in each well was incubated 8 μg of membranes from hD4 (Millipore HTS223M) (Lot: SC232632, protein concentration = 1000 μg/ml), 1 nM [3H]-Spiperone (54.2 Ci/mmol, 1 mCi/ml, Perkin Elmer NET1187001MC) with compounds studied and a standard. Non-specific binding was determined in the presence of 25 μM Haloperidol (Sigma H1512). The reaction mixture (Vtotal: 250 μL/well) was incubated at 27 °C for 120 min. The following steps are the same as for D3 receptors.
2.4 Preparation of budded baculovirus particles
The human D3 receptor in pcDNA3.1+ was purchased from the cDNA Resource Center (www.cdna.org). Construction and production of BBV containing D3 receptors were performed as described in (Veiksina et al., 2021) with some modifications. For cloning D3 into the pFastBac vector XhoI and XbaI/NheI sites were used. To transform the bacmid into Sf9 cells, the transfection reagent ExGen 500 (Fermentas) was used according to the manufacturer’s protocol. After the baculovirus preparations were generated and collected, the amount of infectious viral particles per ml (IVP/ml) for all the baculoviruses was determined with the Image-based Cell Size Estimation (ICSE) assay described in (Laasfeld et al., 2017). All the steps were carried out with Sf9 cells, except for the final budded baculovirus particle production which was done with Mimic™ Sf9 Insect cells, without additional FBS.
2.5 Fluorescence anisotropy experiments
FA experiments were carried out on black flat bottom 384 well plates (Corning) with a final volume of 30 µL.
In saturation binding experiments 3 nM and 0.5 nM, a fluorescent ligand was used with two-fold dilutions of BBV. To determine non-specific binding 10 or 50 µM Spiperone was used and to start dissociation 333 µM Spiperone was added.
For competition binding experiments, the concentrations of CELT-419 were kept constant at 0.5 nM and the volume of BBV was also constant at 1 μL (Cfinal ≈ 0.67 nM). The competitive ligand dilutions were done on the measurement plate. Also, a point with no competitive ligand was included and for blank correction, a point with only BBV was included. Measurements were carried out with 5 min intervals for 5 h at 27 °C. In all cases, BBV was added as the last component to initiate the ligand binding process.
In all experiments, the fluorescence intensity values were blank corrected for BBV autofluorescence and light scattering by subtracting the respective parallel or perpendicular fluorescence intensity value of a blank well from the respective measurement well. The blank wells lacked all the ligands and only contained the same concentration of BBVs as the measurement well.
FA measurements were performed with a multi-mode plate reader Synergy NEO (Biotek), which is equipped with a polarizing 530 (25) nm excitation filter and 590 (35) nm emission filter allowing simultaneous parallelly and perpendicularly polarized fluorescence detection. All experiments were carried out in duplicates at least three separate times.
2.6 Live-cell fluorescence microscopy
For fine-tuning the U-Net cell segmentation model for HEK293 cells, the fluorescence ground-truth masks were generated as described in (Tahk et al., 2022). Briefly, HEK293-D3R cells were seeded with a density of 20,000 cells/well into a µ-Plate 96 well Black well plate (Ibidi, Gräfelfing, Germany) and incubated for 2.5 h. One mM DiI (Invitrogen, Eugene, Oregon, United States) in DMSO kept at -20°C was thawed and, to disrupt aggregates, kept in an ultrasound bath for 5 min. To stain the cell membranes, the cell medium was replaced with 200 µL/well of 2 µM DiI in DPBS with Ca2+ and Mg2+. The cells were incubated with the DiI solution for 30 min before the imaging was started. Cytation 5 cell imaging multi-mode plate reader (BioTek) using a 20× LUCPLFLN objective (Olympus) was used for cell imaging from both fluorescence RFP channels, using 531 (40) nm excitation and 593 (40) nm emission filter, and the bright-field channel. Imaging parameters used during image acquisition were for bright-field: LED intensity = 4, integration time = 110 m, camera gain = 24 and for RFP fluorescence channel: LED intensity = 1, integration time = 71 m, camera gain = 24. A total of 196 fields of view were captured.
For live-cell microscopy saturation experiments with CELT-419, HEK293-D3R cells were seeded to µ-Plate 96 well Black well plate with a density of 20,000 cells/well. The cells were incubated for 5 h after which the cell medium was removed, cells were washed once with warm cell culture medium and finally, the ligand solutions in the cell culture media were added. For total saturation binding, two-fold serial dilutions of CELT-419 starting with 4 nM concentration were prepared. Non-specific binding control wells were prepared in the same manner but with the addition of 10 µM unlabeled D3 receptor antagonist Spiperone. Imaging parameters used during image acquisition were for bright-field: LED intensity = 5, integration time = 67 m, camera gain = 24 and for RFP fluorescence channel: LED intensity = 5, integration time = 557 m, camera gain = 22. The cells were imaged in the montage mode (4 locations per well) with Z-stack (10 planes, 4 planes below and 5 planes above focus) to reduce the influence of imaging location-dependent variability.
For live-cell microscopy competition experiments with CELT-419, HEK293-D3R cells were seeded to µ-Plate 96 well Black well plate with a density of 40,000 cells/well if the cells were incubated for 5 h and 20,000 cells/well if the cells were incubated for 24 h. After the incubation the cell medium was replaced with the cell culture media containing ligands. Imaging parameters used during image acquisition were for bright-field: LED intensity = 5, integration time = 85 m, camera gain = 20 and for RFP fluorescence channel: LED intensity = 2, integration time = 557 m, camera gain = 22. The cells were imaged in the montage mode (4 locations per well) with Z-stack (6 planes, 3 planes below and 2 planes above focus) to reduce the influence of imaging location-dependent variability.
2.7 Deep learning model development
The deep convolutional neural network was developed using the ZeroCostDL4Mic framework and Jupyter notebooks. These open-source frameworks are essentially reprogrammable data analysis reports, containing both text and figures but also include the python code used for the report generation. The possibility to document the code with text, figures and graphical user interface components means that using Jupyter notebooks does not necessarily require programming. The ZeroCostDL4Mic framework provides a number of predefined models, a wiki and video tutorials to help any researcher get accustomed to machine learning models and reduce the aforementioned problems with model development. For cell detection from bright-field images and quantification of fluorescence images, the MembraneTools toolbox of Aparecium software (https://www.gpcr.ut.ee/aparecium.html and https://github.com/laasfeld/Aparecium) was used, which is an open-source option for image and experimental data analysis and management software. Aparecium allows to easily analyze, store and document both endpoint and kinetic experiments.
Image analysis was performed as described in (Tahk et al., 2022) with some modifications. For training the final U-Net2D image segmentation model in the ZeroCostDL4Mic (Ronneberger et al., 2015; von Chamier et al., 2021) environment, U-Net2D notebook with minor modifications was used to allow compatibility with Aparecium and Matlab Keras framework model import. The modified Jupyter notebook is freely available at https://github.com/laasfeld/DL-For-HEK293. Model performance evaluation on an image test set gave F1 score of 0.76 and Matthew´s correlation coefficient of 0.75 calculated as described in (Tahk et al., 2022).
2.8 Data analysis
Aparecium 2.0 software (https://www.gpcr.ut.ee/aparecium.html and https://github.com/laasfeld/Aparecium) was used to blank the raw parallel and perpendicular intensity values and calculate the FA values using formula (1) (Jablonski, A, 1960).
where FA(t) is the measured fluorescence anisotropy at time point t and I(t)II and I(t)⊥ are parallel and perpendicular fluorescence intensities respectively at time point t.
To predict the fluorescence anisotropy value at any time point during kinetics experiments based on the instantaneous concentrations of each considered fluorescence ligand state in the systems biology analysis the following equation was used:
Where FA(t) is the predicted fluorescence anisotropy at time point t, {Ligand binding statei}t represents the instantaneous concentration of fluorescence ligand in ith binding state at time point t and FA(Ligand binding statei) is the intrinsic fluorescence anisotropy value of fluorescence ligand in the ith binding state. Binding states of CELT-419 considered during fitting of equilibrium global analysis and systems biology analysis were free CELT-419, D3 receptor bound CELT-419 and non-specifically bound CELT-419.
The affinities (Kd of CELT-419 and Ki values of unlabeled compounds) from a certain timepoint were calculated from FA assays as described in (Veiksina et al., 2014) using GraphPad Prism 5.0 (GraphPad Software) and from radioligand assay using GraphPad Prism 7.00 with four-parameter logistic regression model and Cheng-Prusoff equation (Cheng and Prusoff, 1973).
To model the receptor-ligand binding system more precisely and correctly account for effects such as fluorescence ligand and non-labeled ligand depletion, non-specific binding perform fitting using global modeling a systems biology approach was taken. This allows system modeling with stronger constraints imposed by measurement data and fewer constraints imposed by artificial restrictions from assumptions used to obtain analytical equations. An ordinary differential equation system-based model was chosen where a single differential equation describes the concentration change of a single component. Systems biology analysis was performed for FA saturation binding experiments with BBV volumes lower than 1 µL/well (D3 receptor stock concentration corresponding to 20 ± 5 nM). Fitting was performed at two different CELT-419 concentrations which were measured as described in the saturation binding experiment description. Both the total and non-specific binding curves, as well as both the association and dissociation kinetic phases were used for fitting. For PL-384 association and dissociation kinetics determination, all the concentration points remaining on the slope of the concentration-response curve were used as well as one or two concentration points from both the upper and lower plateaus. Some concentrations from the upper and lower plateau were omitted as the plateau points contain relatively little information about competitive ligand kinetics, and omitting these points gave more weight to slope points to obtain more accurate kon and koff values for PL-384. Similarly, time scaling feature of IQMTools (“2: less timescaling”) was used to give more weight to the measurement points at the start of the measurement with more rapidly changing FA values Mean-squared error of the predicted FA value was used as the loss function. Using a global Nelder-Mead simplex-based simulated annealing algorithm (Nelder and Mead, 1965; Kirkpatrick et al., 1983) with starting temperature of 1000, iterations per temperature of 103 and temperature reduction factor of 0.2, the temperature was reduced until it reached a value of 0.1. In the context of simulated annealing, the temperature refers to a parameter that controls how large parameter search space the algorithm considers and does not refer to any experimental temperature alterations. Each independent experiment was fitted separately. For fit analysis, 25 estimations with 0.5 permutations per type were used. Uncertainty estimates were calculated as the averages of the parameter obtained from each individual experiment. Fitting and fit analysis was performed with a modified version of IQMTools (Schmidt and Jirstrand, 2006) (https://iqmtools.intiquan.com/). All other software parameters not mentioned here were kept at their default values.
The used one-site receptor binding model assumes three possible interactions: the interaction between the receptor (R) and the fluorescence ligand (L), the receptor and the competitive unlabeled ligand (C) and non-specific binding sites from the receptor preparation (NBV) and fluorescent ligand. The corresponding reactions can be described by the following chemical equations:
Where k+x, k-x and Kx respectively correspond to the kon, koff and Kd or Ki of this reaction. The free parameters in the model were kon (CELT-419 receptor binding), Kd (CELT-419 receptor binding), kon (competitor receptor binding), Ki(competitor receptor binding), kon (CELT-419_non-specific binding), FA (Free CELT-419), FA (Receptor bound CELT-419), FA (non-specifically bound CELT-419), Rstock corresponding to the stock concentration of D3R in BBV-s and NBVstock.
For theoretical calculation of the apparent Log(IC50) predicted by the globally fitted model (Theoretical Log(IC50)), the model predictions of FA values at all used competitive ligand concentration points were predicted for each simulation time-point and subsequently fitted with the built-in three-parameter sigmoidal model (“log (inhibitor) vs. response”) in GraphPad Prism 5.04 (GraphPad Software, San Diego, United States).
To fit the Log(IC50) change in time from the competition binding experiments, a single-phase exponential decay equation with a constant corresponding to the equilibrium state was used. The model is described by the equation:
Where t is time, k is the exponential decay kinetic parameter, Log(IC50)t is the predicted Log(IC50) at time point t, Log(IC50)t=0 is the apparent Log(IC50) at time point 0, and Log(IC50)equilibrium is the predicted Log(IC50) at t = ∞.
To determine the assay suitability for HTS applications, Z’ values were calculated according to the formula (Zhang et al., 1999):
Where σ is the standard deviation of either the positive or the negative control respectively and µ is the arithmetic mean of the positive or the negative control respectively. Z’ value of over 0.5 is considered to be an assay suitable for HTS.
All the values calculated are weighted averages and the uncertainties given are weighted standard deviations of three independent experiments if not stated otherwise. Since the uncertainties obtained from global systems biology fit analysis were low, all the global analysis results are just means and the uncertainty is the standard error of the mean.
The octanol-water partition coefficient LogP for compounds was determined computationally using InstantJChem (ChemAxon) software.
3 Results and discussion
3.1 Initial characterization of CELT-419 in radioligand binding assay
To validate that the fluorescent ligand CELT-419 binds to the D3 receptor with sufficient affinity for FA assays and retains subtype selectivity of the pharmacophore, the radioligand binding method was used. This also allows the selection of better initial conditions for fluorescence assay design and optimization. The IC50 ± SEM value for CELT-419 binding to D3 receptor was determined to be 30.1 ± 1.7 nM corresponding to apparent Ki ± SEM = 15.7 ± 0.9 nM according to the Cheng-Prusoff model (Cheng and Prusoff, 1973). However, CELT-419 binds also to the D2 receptor in a similar affinity range (IC50 ± SEM = 78 ± 6 nM; Ki ± SEM = 44 ± 3 nM), while the affinity to D4 receptor is significantly worse (12% displacement at 10 µM). Although FA assay has been shown to work with a concentration of the probe close to 10 nM, in most cases, it is desirable to use subnanomolar affinity probes to achieve a good signal-to-noise ratio as well as reduce the concentrations of assay components for better HTS compatibility. At first glance, it may seem that CELT-419 does not have sufficient affinity for an ideal FA assay as the FA signal window between total and non-specific binding decreases. It must be considered that measured affinities between assays may vary due to differences in assay design and receptor source. The difference may be further amplified if Cheng-Prusoff model assumptions are not fulfilled, for example, if the equilibrium has not been reached. The latter situation can easily happen, as usually a single end-point time is chosen in radioligand screening, but the time required to reach equilibrium depends on the ligand binding kinetics, which is unknown a priori. Considering these factors, CELT-419 is a suitable reporter probe candidate for fluorescence anisotropy assay development.
3.2 Kinetic and equilibrium properties of CELT-419 binding to D3 receptors in BBVs
Due to the homogeneous assay format, several luminescence-based assays allow online monitoring of ligand binding to receptors and dissociation of the receptor-ligand complex. In the case of the FA assay, the ligand must have a suitable fluorescent label to obtain good-quality results. The possibility to monitor the process kinetics is useful from multiple points of view – practically, it can be used to determine the time to reach equilibrium and, more fundamentally, to determine the kinetic parameters of the ligand binding. Taking the readout before reaching the equilibrium state can negatively affect the assay quality, as the affinities of competitive unlabeled ligands can be both over and underestimated depending on the situation, but FA assay allows to avoid this problem (Link et al., 2017). To study D3 receptors using FA assays, CELT-419 was designed based on a high-affinity pharmacophore and Cy3B label. Using the FA method, CELT-419 binding affinity and kinetics were determined using budded baculovirus particles (BBV) that display the D3 receptors on their membrane. Figure 1 shows that CELT-419 binds reversibly to the D3 receptor, and there is a large difference between total and non-specific binding resulting in a high signal-to-noise-ratio and stable signal over several hours. Good stability makes CELT-419 suitable for equilibrium state measurements. The FA of the free ligand is somewhat lower than the FA in the presence of BBVs and a high concentration of unlabeled ligand, indicating a low but measurable level of non-specific binding to BBVs. The model obtained by global analysis of kinetic data suggests that 8 ± 4% of CELT-419 is non-specifically bound.
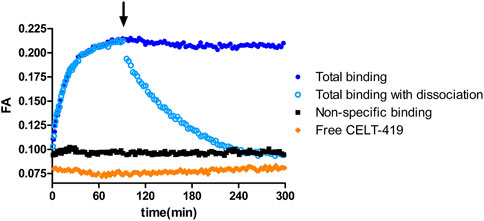
FIGURE 1. Time course of FA change caused by CELT-419 binding to D3 receptor on the BBV particles. The reaction was initiated by the addition of 1 μL D3 receptor displaying BBVs (CD3R = 0.7 nM) to 0.5 nM CELT-419 in the absence (blue circles) or presence (black squares) of 50 μM Spiperone, or solution without BBVs (orange diamonds). After 90 min (indicated with an arrow), the measurement was paused, and dissociation was initiated by the addition of 333 μM Spiperone (open light blue circles). An equivalent volume of assay buffer was added to association controls (filled dark blue circles). A representative experiment of at least three independent experiments is shown.
Saturation binding experiments with high-quality results (Figure 2; Supplementary Figure S2) enabled the calculation of the binding affinity constant Kd ± SEM of 0.42 ± 0.04 nM and receptor concentration in the BBV stock preparation Rstock ± SEM of 20 ± 4 nM. Unlike in the radioligand binding assay, FA assay requires ligand depletion and, therefore, second-order kinetic conditions. Since both the free ligand and free receptor concentrations change substantially during an experiment, it is necessary to know the Rstock to both design optimal experiments as well as to calculate Kd, Ki, kon and koff accurately. As FA assay enables monitoring ligand binding kinetics even during saturation binding experiments, it is alternatively possible to obtain all binding model parameters, including affinities, kinetic parameters and Rstock, in a single step. This can be achieved using global systems biology analysis of a single saturation binding experiment that includes both the association and dissociation phases (Supplementary Figure S1). This analysis revealed Rstock_kinetic ± SEM of 20 ± 5, kon ± SEM of 4.2*10–4 ± 0.7*10–4 1/(s*nM) and koff ± SEM of 2.8*10–4 ± 1.2*10–4 1/s resulting in Kd_kinetic ± SEM of 0.7 ± 0.3 nM which are in good correspondence with the Kd and Rstock values obtained from equilibrium analysis of the saturation binding experiment. The global analysis also revealed the FA ± SEM value of the free CELT-419 to be 0.081 ± 0.009 FA units (n = 6) which is in the expected range for Cy3B based fluorescence ligands. The relatively slow kon of CELT-419 also shows that the initial radioligand screening was performed in a pre-equilibrium state, leading to apparently lower affinity in the radioligand binding assay.
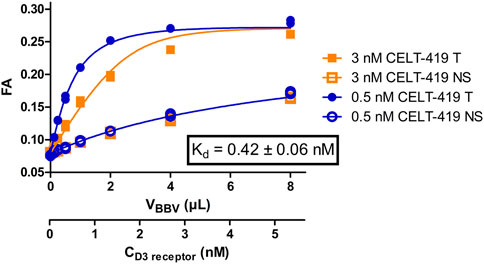
FIGURE 2. Binding curves of CELT-419 binding to D3 receptors in BBVs. FA of 3 nM (orange squares) or 0.5 nM (blue circles) CELT-419 were measured after 2 h incubation with different amounts of D3 receptor displaying BBVs. Non-specific binding (NS, open symbols) was determined in the presence and total binding (T, filled symbols) in absence of 50 μM Spiperone. The displayed fit, the concentration of D3 receptor binding sites and the Kd values were calculated post hoc from the results of these experiments using the model described in (Veiksina et al., 2014). Kd ± SEM is the weighted average of three independent experiments performed in duplicates. Representative experiment performed in duplicates is shown, with both duplicates displayed.
3.3 FA competition binding assay with BBVs
The good affinity, high signal-to-noise ratio and stable FA signal during CELT-419 binding to D3 receptors of BBVs would make it suitable for measuring affinities of unlabeled ligands. For precise determination of unlabeled ligand affinities, it is important to consider the speed of reaching the binding equilibrium. In the case of conventional radioligand binding assay, it is quite a cumbersome task, which may require the measurement of several binding curves with different incubation times. With the FA assay, multiple samples can be monitored parallelly in real-time, thus allowing to observe how the displacement curve changes. This, in turn, allows monitoring IC50 value changes and stabilisation in time. The kinetic parameters of both the probe and the competitive ligand determine whether the Log(IC50) increases or decreases in time and how quickly the Log(IC50) values stabilize. Consequently, it is possible to derive conclusions about these kinetics parameters by observing Log(IC50) value change in time. For all tested classical dopaminergic ligands - Spiperone, Haloperidol, Dopamine, Apomorphine, 7-OH-DPAT and Butaclamol, the Log(IC50) values increased in time. This indicates these ligands bind to the D3 receptor faster than the probe CELT-419. The rate-limiting step to reach equilibrium is either CELT-419 association rate, the competitor´s dissociation rate, or both. As an example, the IC50 stabilisation for Butaclamol binding takes approximately 3 h after initiating the reaction (Figure 3A). However, an inverted behaviour of Log(IC50) values decreasing in time (Figure 3B) was present in the case of PL-384, a pharmacophore-linker moiety used for CELT-419 assembly. The time of stabilization of Log(IC50) values is considerably shorter for PL-384 having a half-life ± SEM of 8 ± 4 min (n = 4) (Figure 3B) compared to 71 ± 4 min for the Butaclamol competition curve (Figure 3A). Usually, faster stabilization time indicates smaller differences between the binding kinetics of the probe and the competitive ligand. Such kinetic information is essential for experimental design and interpretation of results. For example, the monitoring duration can potentially be dynamically shortened or extended, and more accurate affinity values could be obtained by IC50 or Ki extrapolation in time. In this case, the Log(IC50) stabilisation time course revealed that for any used competitive ligand using the 3 h time-point for Log(IC50) collection did not lead to substantial differences compared to later time-points and the resulting uncertainty was insignificant compared to variation between independent experiments.
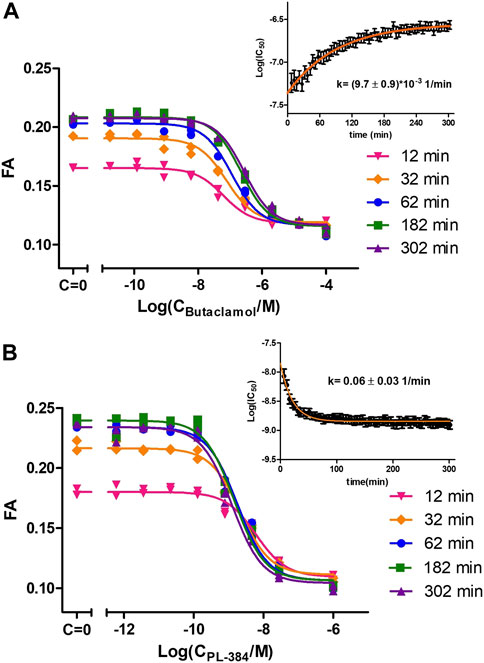
FIGURE 3. Displacement of CELT-419 by different concentrations of Butaclamol (A) and PL-384 (B) at different time points. The final concentration of CELT-419 was 0.5 nM and 1 μL BBV/well (CD3R = 0.7 nM) was used. The insert shows the Log(IC50) ± SE change in time of corresponding displacement curves. Data from a single representative experiment performed in duplicate is shown. The Log(IC50) change in time was fitted with equation 3 and k given is the weighted average from 3 (A) or 4 (B) experiments with weighted SD.
Ultimately, the most common use for FA assays is the indirect determination of interaction characteristics, most often the binding affinity, between a receptor and unlabeled ligands or allosteric modulators. To validate that the developed assay is suitable for measuring the Ki of novel ligands, competition binding measurements were carried out using CELT-419 as a reporter ligand for a set of established dopaminergic ligands (Figure 4). The assay shows a high signal level with ΔFA ±SD between total and non-specific points of 0.12 ± 0.02 (n = 26) anisotropy units. The estimated Z′ of the assay is 0.71, which is sufficient for high throughput screening standards, with an assay with Z’ above 0.5 considered excellent. The Ki values were calculated based on the IC50 values, receptor concentration and Kd of CELT-419 as described in (Veiksina et al., 2014), taking into account the ligand depletion effect during FA assay. Overall the determined affinities agree well with the affinities from previous studies.
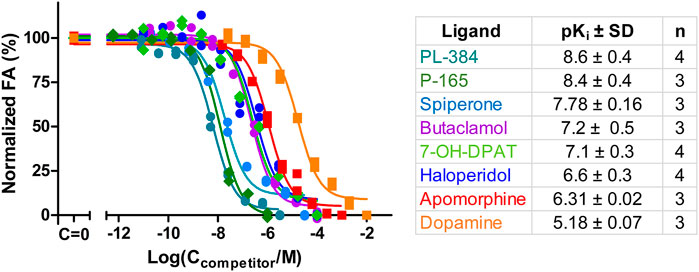
FIGURE 4. Displacement of CELT-419 binding to D3 receptor by different dopaminergic ligands. Change in FA level was measured after incubation of 0.5 nM CELT-419, 1 μL BBV/well (CD3R = 0.7 nM), and different concentrations of corresponding dopaminergic ligands for 180 min. The FA values were normalized by taking the average FA value of C = 0 points as 100% and the average FA value of the highest used concentration points as 0%. Data of a representative experiment from at least three independent experiments, performed in duplicates, is shown with both replicates displayed. pKi values are calculated as described in (Veiksina et al., 2014), and presented as mean ± SD of n independent experiments.
In addition to well-known dopaminergic ligands, the affinities of the P-165 (pharmacophore of CELT-419) and PL-384 (corresponding to the pharmacophore-linker moiety of CELT-419), synthesized and provided by Celtarys, were also determined to establish if and which effects the linker and fluorescent labelling have on the chemical and receptor binding properties of the ligand. The measured affinities of PL-384 and P-165 did not show any substantial differences from the affinity of CELT-419 (Figure 4), indicating that neither the linker nor the fluorescent label have noteworthy detrimental nor beneficial effects on the binding affinities of these compounds. Due to the relatively slow kinetics of PL-384 compared to CELT-419 (Figure 3B), it was possible to determine the kinetic parameters of PL-384 binding to D3 receptors from competition binding experiment data by global systems biology analysis (Figure 5). The model validity is supported by the correct prediction of the direction and kinetics of Log(IC50) values in time for different ligands. The kon ± SEM and koff ± SEM were determined to be 2.0 × 10⁻⁴ ± 0.9×10⁻⁴ 1/(nM*s) and 2.7 × 10⁻⁴ ± 1.6×*10–4 1/s, respectively. Interestingly, the koff values of PL-384 and CELT-419 are very similar, while koff of P-165 is large enough that it cannot be accurately determined with this experimental setup. This suggests that adding a linker to the pharmacophore substantially slows down both association and dissociation kinetics, but further addition of the fluorescent label to the structure does not additionally affect the receptor-ligand complex dissociation kinetics, but the kon of CELT-419 is larger than kon of PL-384, which may be connected with higher hydrophobicity of PL-384 compared to CELT-419. Altogether, these kinetic aspects hint that the linker design and linking strategy may provide options for fine-tuning the fluorescent ligand kinetic properties. Whether this conclusion applies only to this pharmacophore and receptor combination or applies more generally to linker design remains unknown. Furthermore, the theoretically calculated water-octanol partition coefficients of P-165, PL-384 and CELT-419 were 6.14, 2.07 and 2.47, respectively, showing increased hydrophobicity introduced by conjugation with a linker can be reversed by subsequent fluorescent labelling. Higher hydrophilicity also increases ligand solubility and thus may reduce the risk of some common sample preparation and measurement problems, such as non-specific binding to plastic labware or biomembranes and aggregation with other assay components.
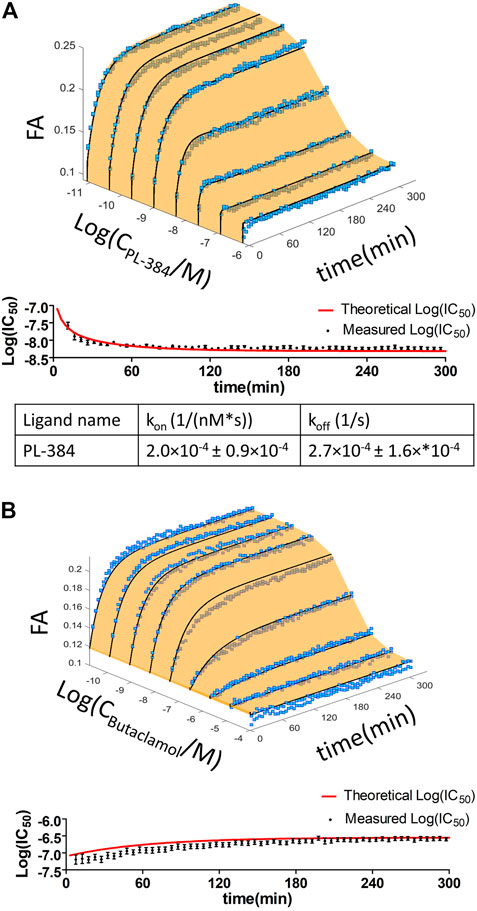
FIGURE 5. Time dependence of the displacement of 1 nM CELT-419 by increasing concentrations of PL-384 (A) and Butaclamol (B) obtained from FA competition binding experiments. Data of representative experiments performed in duplicate are shown. The light orange surface and black curves indicate the global fit of the single binding site model to the data from FA experiments. Log(IC50) ± SE values obtained from three-parameter sigmoidal dose response model of the raw FA measurement data (black circles) and of the global fitted data (red line), calculated at different incubation times, are shown in the lower panel of the respective graphs. kon and koff values shown are given as mean ± SEM of three experiments.
For an assay to be reasonable for HTS applications, it is useful to optimize costs by assay miniaturization. One possibility for that is to use a 384-well plate format for FA assay, which has been successful on some previous occasions but has not received sufficient attention (Vaasa et al., 2009; Huwiler et al., 2010) in terms of achievable Z′ values for in GPCR ligand binding assays. The results indicate that this setup gives a high Z’ value, thus proving that the change does not deteriorate the assay, and there is even a perspective to use the 1536-well format. However, some practical aspects must be considered when using the 384-well plate format. Firstly, pipetting liquid into the small diameter wells can lead to the formation of air bubbles, which substantially interfere with the measurement. Moreover, during more extended kinetic measurements, the liquid volume in the well may decrease substantially due to evaporation, which affects concentrations and may also affect fluorescence intensity values. For the 3–5 h experiments performed in this study, the evaporation did not substantially affect the final results.
3.4 Quantitative live-cell microscopy with CELT-419
New robust fluorescent ligands and sophisticated microscopy systems have opened possibilities to perform more high-quality and automated measurements and, therefore, allows HTS-compatible quantitative ligand binding experiments in live cells. Although both FA and quantitative live-cell microscopy can be used for developing ligand binding assays, there are substantial differences in assay setups and receptor expression systems which must be considered. The obvious difference is the lack of receptor activation and downstream signalling in BBVs, which may further impact ligand binding. It would be a great advantage if the same fluorescent ligand could be used for cross-validation of multiple quantitative ligand binding methods, as has been done recently with M4 muscarinic receptors (Tahk et al., 2022). These two assays also open the possibility of choosing between throughput and spacial or temporal resolution and cost. A previously developed fluorescent ligand for D3 receptors NAPS-Cy3B worked well in a live-cell assay, but it was not directly compared with the FA assay (Allikalt et al., 2021). Therefore, CELT-419, which worked well in FA assays, was also tested with live HEK293-D3R cells. CELT-419 binding to D3 receptors in cells can be clearly visualized with fluorescence imaging. The signal is highly specific as no binding can be seen in the presence of 10 µM Spiperone nor in cells not expressing the D3 receptor (Figure 6). CELT-419 localizes mainly to the cell contour corresponding to receptor-ligand binding in cell membranes. These results indicate that CELT-419 is suitable for live-cell assay with automated microscopy. Furthermore, by employing deep convolutional networks for cell detection from bright-field images and Aparecium software for image and metadata pre-and post-processing, it is possible to develop fully quantitative ligand binding assays based on live-cell microscopy. This allows to vary fluorescence ligand concentration in a more classical saturation binding assay as well as to perform competition binding experiments using unlabeled ligands.
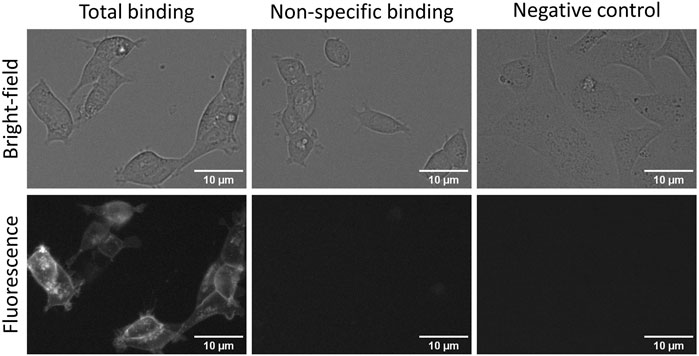
FIGURE 6. Fluorescence and bright-field images of total (left panels) and non-specific binding (central panels) of CELT-419 to live HEK293-D3R cells and to SKOV3 cells without D3 receptors (right panels). HEK293-D3R cells in DMEM medium with added 9% FBS and antibiotic antimycotic solution were incubated with 2 nM CELT-419 in the absence (total binding) or presence (non-specific binding) of 10 μM Spiperone for 2 h in 5% CO2 and at 37 °C. The number of seeded cells per well was 20,000. For negative control, SKOV3 cells without D3 receptors seeded at 30,000 cells per well were used with 2 nM CELT-419. The contrast of fluorescence and bright-field images was enhanced for presentation purposes only, the same lookup table was used for all images of the same imaging mode. The scale bar corresponds to 10 μm.
As the next step, the cells were incubated with different concentrations of CELT-419 to determine its affinity for D3 receptors in a live cell system. For this, the previously proposed image quantification strategy was applied with the MembraneTools toolbox of Aparecium software (Tahk et al., 2022). The analysis uses a dedicated deep learning (DL) model U-Net for cell detection and subsequent quantification of cell intensity on the fluorescence images. As the intensity corresponds to relative amounts of bound fluorescence ligand, the binding affinity of CELT-419 to live HEK293-D3R cells can be determined. The Kd ± SEM of 0.38 ± 0.14 nM determined from the saturation binding curve (Figure 7; Supplementary Figure S3) is in good agreement with the affinity obtained from the FA assay (Figure 2). Furthermore, it is important that all described experiments were carried out in cell culture media with all the supplements, including FBS, to maintain cell growth conditions as close to normal as possible. In this case, a good signal-to-noise ratio could be achieved without the need to use DBPS or a specific live-cell imaging cell culture medium.
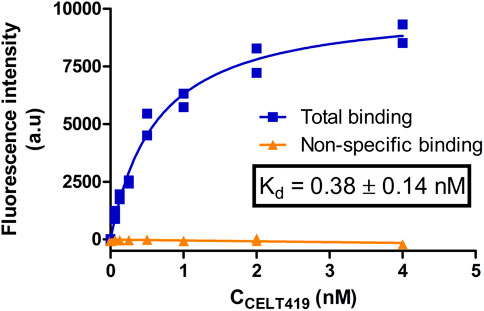
FIGURE 7. Saturation binding of CELT-419 binding to D3 receptors on live HEK293-D3R cells. The HEK293-D3R cells (20,000 cells per well) were incubated with CELT-419 (twofold serial dilutions up to 4 nM) for 4.3 h. Non-specific binding (orange triangles) was measured in the presence of 10 μM Spiperone. The background-corrected fluorescence intensities of cells were determined with the cell detection and image quantification software as described in Materials and methods and are presented as individual replicates from a representative experiment of three independent experiments performed in duplicates. Every point corresponds to the difference between the average pixel intensity of a cell and the average pixel intensity of the background. The average pixel intensities of each point were calculated from four images from different fields of view obtained from a single well. The calculated Kd value is given as mean ± SEM of three independent experiments.
Also, competition experiments were carried out to demonstrate the versatility of this system (Figure 8; Supplementary Figure S4). Dopamine (agonist) as well as Spiperone (antagonist) caused concentration-dependent displacement of CELT-419 to live HEK293-D3R cells. The affinities of these ligands in live cells were higher than in FA assay, but this can be caused by difference in cell membrane composition and downstream signalling systems of the targets. As it is shown before that dopamine receptors ligands can achieve higher affinity if G-proteins are coupled to the receptor (Rinken et al., 2001).
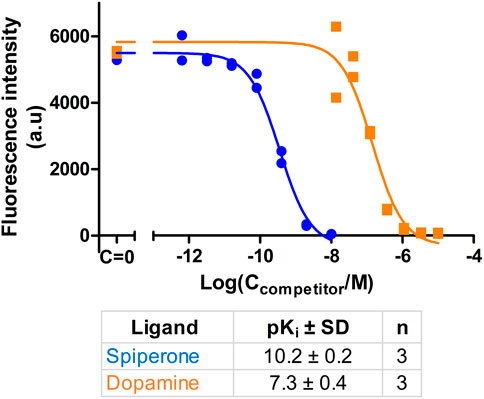
FIGURE 8. Inhibition of CELT-419 binding to live HEK-D3R cells by dopaminergic receptor ligands. The HEK293-D3R cells (40,000 cells/well) were incubated with 1 nM CELT-419 and different concentrations of Dopamine or Spiperone for 180 min as described in Materials and methods. The background-corrected fluorescence intensities of cells were determined with the cell detection and image quantification software as described in Materials and methods and are presented as individual replicates from a representative experiment of three independent experiments performed in duplicates. Every point corresponds to the difference between the average pixel intensity of a cell and the average pixel intensity of the background. The average pixel intensities of each point were calculated from four images from different fields of view obtained from a single well.
3.5 Future perspectives
As can be seen from all the data from this study, CELT-419 is a high-affinity ligand with good kinetic properties, which showed similar results both in FA assay with BBVs and quantitative live-cell fluorescence microscopy. Therefore, both assays can be used for fundamental D3 receptor-ligand binding studies as well as for drug screening purposes. The use of CELT-419 as a fluorescent ligand is not limited by the methods used in this study. Several fluorescence ligands that performed well in either FA or live-cell assays have been confirmed to work well also, for example, in both live-cell and BBV-based TIRF microscopy assays, nanoBRET method and flow cytometry (Grätz et al., 2021; Laasfeld et al., 2021; Müller et al., 2022). In addition, this ligand may be suitable for some super-resolution microscopy methods such as photoactivated localization microscopy (PALM) or other single-molecule localization microscopy (SMLM) techniques (Dempsey et al., 2011; Schueder et al., 2019). However, the Cy3B label of CELT-419, which fits well for FA and live-cell microscopy measurements, is not the best choice for all assays. For example, some assays benefit from using a more red-shifted fluorescent label or a combination of multiple labels in a single study. For example, a Cy5-labelled fluorescent ligand with the same pharmacophore is available from Celtarys Research (CELT-241) which may be more suitable for tissue labelling and imagining due to lower autofluorescence. Altogether, the development of similar probes for other GPCRs and further development of measurement methods can increase the quality and quantity of both fundamental receptor research and high-throughput drug screening.
Data availability statement
The raw data supporting the conclusions of this article will be made available by the authors, without undue reservation.
Author contributions
M-JT: Writing - Original Draft, Investigation, Formal analysis, Visualization; TL: Investigation, Software, Writing - Original Draft, Conceptualization, Formal analysis, Visualization; EM: Investigation, Formal analysis, Visualization; JB: Investigation, ML: Investigation, MC: Investigation, MM: Investigation, Conceptualization, ES: Methodology, Funding acquisition, Supervision, AR: Conceptualization, Funding acquisition, Supervision, Writing - Review and Editing.
Funding
This study was supported by the Estonian Research Council grant (PSG230), by the European Regional Development Fund via the Enterprise Estonia Applied Research Programme 2021, and by the COST action CA 18133 ERNEST. TL was supported by the Ustus Agur stipend by Republic of Estonia Education and Youth Board and Estonian Association of Information Technology and Telecommunications. ES is grateful for the financial support from the Consellería de Cultura, Educación e Ordenación Universitaria of the Galician Government: (grant: ED431B 2020/43), Centro Singular de Investigación de Galicia accreditation 2019-2022 (ED431G 2019/03) and the European Regional Development Fund (ERDF).
Acknowledgments
We would like to thank Kaija Laiduner for cloning the human D3 receptor into pFastBac vector and for the initial production of baculoviruses and Anni Allikalt for further amplifying this virus and COST Action CA18133/European Research Network on Signal Transduction (ERNEST) for support and networking among the different groups involved in this work.
Conflict of interest
MM is the Chief Scientific Officer of Celtarys Research S.L.
The remaining authors declare that the research was conducted in the absence of any commercial or financial relationships that could be construed as a potential conflict of interest.
Publisher’s note
All claims expressed in this article are solely those of the authors and do not necessarily represent those of their affiliated organizations, or those of the publisher, the editors and the reviewers. Any product that may be evaluated in this article, or claim that may be made by its manufacturer, is not guaranteed or endorsed by the publisher.
Supplementary material
The Supplementary Material for this article can be found online at: https://www.frontiersin.org/articles/10.3389/fmolb.2023.1119157/full#supplementary-material
References
Allikalt, A., Kopanchuk, S., and Rinken, A. (2018). Implementation of fluorescence anisotropy-based assay for the characterization of ligand binding to dopamine D1 receptors. Eur. J. Pharmacol. 839, 40–46. doi:10.1016/j.ejphar.2018.09.008
Allikalt, A., Purkayastha, N., Flad, K., Schmidt, M. F., Tabor, A., Gmeiner, P., et al. (2020). Fluorescent ligands for dopamine D2/D3 receptors. Sci. Rep. 10, 21842. doi:10.1038/s41598-020-78827-9
Allikalt, A., Laasfeld, T., Ilisson, M., Kopanchuk, S., and Rinken, A. (2021). Quantitative analysis of fluorescent ligand binding to dopamine D3 receptors using live-cell microscopy. FEBS J. 288, 1514–1532. doi:10.1111/febs.15519
Barton, A. C., Kang, H. C., Rinaudo, M. S., Monsma, F. J., Stewart-Fram, R. M., Macinko, J. A., et al. (1991). Multiple fluorescent ligands for dopamine receptors. I. Pharmacological characterization and receptor selectivity. Brain Res. 547, 199–207. doi:10.1016/0006-8993(91)90963-V
Beechem, J. M., Gratton, E., Ameloot, M., Knutson, J. R., and Brand, L. (2002). “The global analysis of fluorescence intensity and anisotropy decay data: Second-generation theory and programs,” in Topics in fluorescence spectroscopy: Principles. Topics in fluorescence spectroscopy. Editor J. R. Lakowicz (Boston, MA: Springer US), 241–305. doi:10.1007/0-306-47058-6_5
Borgarelli, C., Klingl, Y. E., Escamilla-Ayala, A., Munck, S., Van Den Bosch, L., De Borggraeve, W. M., et al. (2021). Lighting up the plasma membrane: Development and applications of fluorescent ligands for transmembrane proteins. Chem. – Eur. J. 27, 8605–8641. doi:10.1002/chem.202100296
Borovac, J. A. (2016). Side effects of a dopamine agonist therapy for Parkinson’s disease: A mini-review of clinical pharmacology. Yale J. Biol. Med. 89, 37–47.
Caicedo, J. C., Roth, J., Goodman, A., Becker, T., Karhohs, K. W., Broisin, M., et al. (2019). Evaluation of deep learning strategies for nucleus segmentation in fluorescence images. Cytom. A 95, 952–965. doi:10.1002/cyto.a.23863
Cheng, Y.-C., and Prusoff, W. H. (1973). Relationship between the inhibition constant (K1) and the concentration of inhibitor which causes 50 per cent inhibition (I50) of an enzymatic reaction. Biochem. Pharmacol. 22, 3099–3108. doi:10.1016/0006-2952(73)90196-2
Dempsey, G. T., Vaughan, J. C., Chen, K. H., Bates, M., and Zhuang, X. (2011). Evaluation of fluorophores for optimal performance in localization-based super-resolution imaging. Nat. Methods 8, 1027–1036. doi:10.1038/nmeth.1768
Garcia-Borreguero, D., Silber, M. H., Winkelman, J. W., Högl, B., Bainbridge, J., Buchfuhrer, M., et al. (2016). Guidelines for the first-line treatment of restless legs syndrome/willis-ekbom disease, prevention and treatment of dopaminergic augmentation: A combined task force of the IRLSSG, EURLSSG, and the RLS-foundation. Sleep. Med. 21, 1–11. doi:10.1016/j.sleep.2016.01.017
Grätz, L., Laasfeld, T., Allikalt, A., Gruber, C. G., Pegoli, A., Tahk, M.-J., et al. (2021). BRET- and fluorescence anisotropy-based assays for real-time monitoring of ligand binding to M2 muscarinic acetylcholine receptors. Biochim. Biophys. Acta BBA - Mol. Cell Res. 1868, 118930. doi:10.1016/j.bbamcr.2020.118930
Harikumar, K. G., Puri, V., Singh, R. D., Hanada, K., Pagano, R. E., and Miller, L. J. (2005). Differential effects of modification of membrane cholesterol and sphingolipids on the conformation, function, and trafficking of the G protein-coupled cholecystokinin receptor. J. Biol. Chem. 280, 2176–2185. doi:10.1074/jbc.M410385200
Hounsou, C., Margathe, J.-F., Oueslati, N., Belhocine, A., Dupuis, E., Thomas, C., et al. (2015). Time-resolved FRET binding assay to investigate hetero-oligomer binding properties: Proof of concept with dopamine D1/D3 heterodimer. ACS Chem. Biol. 10, 466–474. doi:10.1021/cb5007568
Huwiler, K. G., De Rosier, T., Hanson, B., and Vogel, K. W. (2010). A fluorescence anisotropy assay for the muscarinic M1 G-protein-coupled receptor. Assay. Drug Dev. Technol. 8, 356–366. doi:10.1089/adt.2009.0257
Kirkpatrick, S., Gelatt, C. D., and Vecchi, M. P. (1983). Optimization by simulated annealing. Science 220, 671–680. doi:10.1126/science.220.4598.671
Kluyver, T., Ragan-Kelley, B., Pérez, F., Granger, B., Bussonnier, M., Frederic, J., et al. (2016). “Jupyter notebooks – A publishing format for reproducible computational workflows,” in Positioning and power in academic publishing: Players, agents and agendas. Editors F. Loizides, and B. Schmidt (IOS Press), 87–90.
Laasfeld, T., Kopanchuk, S., and Rinken, A. (2017). Image-based cell-size estimation for baculovirus quantification. BioTechniques 63, 161–168. doi:10.2144/000114595
Laasfeld, T., Ehrminger, R., Tahk, M.-J., Kõlvart, K. R., Veiksina, S., Min, M., et al. (2021). Budded baculoviruses as a receptor display system to quantify ligand binding with TIRF microscopy. Nanoscale 13, 2436–2447. doi:10.1039/D0NR06737G
Leggio, G. M., Bucolo, C., Platania, C. B. M., Salomone, S., and Drago, F. (2016). Current drug treatments targeting dopamine D3 receptor. Pharmacol. Ther. 165, 164–177. doi:10.1016/j.pharmthera.2016.06.007
Link, R., Veiksina, S., Rinken, A., and Kopanchuk, S. (2017). Characterization of ligand binding to melanocortin 4 receptors using fluorescent peptides with improved kinetic properties. Eur. J. Pharmacol. 799, 58–66. doi:10.1016/j.ejphar.2017.01.040
Marheineke, K., Grünewald, S., Christie, W., and Reiländer, H. (1998). Lipid composition of Spodoptera frugiperda (Sf9) and Trichoplusia ni (Tn) insect cells used for baculovirus infection. FEBS Lett. 441, 49–52. doi:10.1016/S0014-5793(98)01523-3
Mondal, S., Khelashvili, G., Johner, N., and Weinstein, H. (2014). How the dynamic properties and functional mechanisms of GPCRs are modulated by their coupling to the membrane environment. Adv. Exp. Med. Biol. 796, 55–74. doi:10.1007/978-94-007-7423-0_4
Monsma, F. J., Barton, A. C., Chol Kang, H., Brassard, D. L., Haugland, R. P., and Sibley, D. R. (1989). Characterization of novel fluorescent ligands with high affinity for D1 and D2 dopaminergic receptors. J. Neurochem. 52, 1641–1644. doi:10.1111/j.1471-4159.1989.tb09220.x
Müller, C., Gleixner, J., Tahk, M.-J., Kopanchuk, S., Laasfeld, T., Weinhart, M., et al. (2022). Structure-based design of high-affinity fluorescent probes for the neuropeptide Y Y1 receptor. J. Med. Chem. 65, 4832–4853. doi:10.1021/acs.jmedchem.1c02033
Nelder, J. A., and Mead, R. (1965). A simplex method for function minimization. Comput. J. 7, 308–313. doi:10.1093/comjnl/7.4.308
Prokop, S., Ábrányi-Balogh, P., Barti, B., Vámosi, M., Zöldi, M., Barna, L., et al. (2021). PharmacoSTORM nanoscale pharmacology reveals cariprazine binding on Islands of Calleja granule cells. Nat. Commun. 12, 6505. doi:10.1038/s41467-021-26757-z
Rascol, E., Villette, S., Harté, E., and Alves, I. D. (2021). Plasmon waveguide resonance: Principles, applications and historical perspectives on instrument development. Molecules 26, 6442. doi:10.3390/molecules26216442
Reinart-Okugbeni, R., Ausmees, K., Kriis, K., Werner, F., Rinken, A., and Kanger, T. (2012). Chemoenzymatic synthesis and evaluation of 3-azabicyclo[3.2.0]heptane derivatives as dopaminergic ligands. Eur. J. Med. Chem. 55, 255–261. doi:10.1016/j.ejmech.2012.07.025
Rinken, A., Terasmaa, A., Raidaru, G., and Fuxe, K. (2001). D2 dopamine receptor-G protein coupling. Cross-regulation of agonist and guanosine nucleotide binding sites. Neurosci. Lett. 302, 5–8. doi:10.1016/S0304-3940(01)01568-3
Rinken, A., Lavogina, D., and Kopanchuk, S. (2018). Assays with detection of fluorescence anisotropy: Challenges and possibilities for characterizing ligand binding to GPCRs. Trends Pharmacol. Sci. 39, 187–199. doi:10.1016/j.tips.2017.10.004
Ronneberger, O., Fischer, P., and Brox, T. (2015). “U-Net: Convolutional networks for biomedical image segmentation,” in Medical image computing and computer-assisted intervention – MICCAI 2015. Editors N. Navab, J. Hornegger, W. M. Wells, and A. F. Frangi (Cham: Springer International Publishing), 234–241.
Schmidt, H., and Jirstrand, M. (2006). Systems biology toolbox for MATLAB: A computational platform for research in systems biology. Bioinformatics 22, 514–515. doi:10.1093/bioinformatics/bti799
Schueder, F., Stein, J., Stehr, F., Auer, A., Sperl, B., Strauss, M. T., et al. (2019). An order of magnitude faster DNA-PAINT imaging by optimized sequence design and buffer conditions. Nat. Methods 16, 1101–1104. doi:10.1038/s41592-019-0584-7
Sokoloff, P., and Le Foll, B. (2017). The dopamine D3 receptor, a quarter century later. Eur. J. Neurosci. 45, 2–19. doi:10.1111/ejn.13390
Tabor, A., Weisenburger, S., Banerjee, A., Purkayastha, N., Kaindl, J. M., Hübner, H., et al. (2016). Visualization and ligand-induced modulation of dopamine receptor dimerization at the single molecule level. Sci. Rep. 6, 33233. doi:10.1038/srep33233
Tahk, M.-J., Torp, J., Ali, M. A. S., Fishman, D., Parts, L., Grätz, L., et al. (2022). Live-cell microscopy or fluorescence anisotropy with budded baculoviruses—Which way to go with measuring ligand binding to M4 muscarinic receptors? Open Biol. 12, 220019. doi:10.1098/rsob.220019
Tõntson, L., Kopanchuk, S., and Rinken, A. (2014). Characterization of 5-HT₁A receptors and their complexes with G-proteins in budded baculovirus particles using fluorescence anisotropy of Bodipy-FL-NAN-190. Neurochem. Int. 67, 32–38. doi:10.1016/j.neuint.2014.01.012
Vaasa, A., Viil, I., Enkvist, E., Viht, K., Raidaru, G., Lavogina, D., et al. (2009). High-affinity bisubstrate probe for fluorescence anisotropy binding/displacement assays with protein kinases PKA and ROCK. Anal. Biochem. 385, 85–93. doi:10.1016/j.ab.2008.10.030
Veiksina, S., Kopanchuk, S., and Rinken, A. (2014). Budded baculoviruses as a tool for a homogeneous fluorescence anisotropy-based assay of ligand binding to G protein-coupled receptors: The case of melanocortin 4 receptors. Biochim. Biophys. Acta BBA - Biomembr. 1838, 372–381. doi:10.1016/j.bbamem.2013.09.015
Veiksina, S., Tahk, M.-J., Laasfeld, T., Link, R., Kopanchuk, S., and Rinken, A. (2021). “Fluorescence anisotropy-based assay for characterization of ligand binding dynamics to GPCRs: The case of Cy3B-labeled ligands binding to MC4 receptors in budded baculoviruses,” in G protein-coupled receptor screening assays: Methods and protocols. Methods in molecular biology. Editors S. A. M. Martins, and D. M. F. Prazeres (New York, NY: Springer US), 119–136. doi:10.1007/978-1-0716-1221-7_8
von Chamier, L., Laine, R. F., Jukkala, J., Spahn, C., Krentzel, D., Nehme, E., et al. (2021). Democratising deep learning for microscopy with ZeroCostDL4Mic. Nat. Commun. 12, 2276. doi:10.1038/s41467-021-22518-0
Keywords: G protein-coupled receptor (GPCR), dopamine D3 receptor (D3R), ligand binding kinetics, fluorescent probe, deep-learning based image analysis, budded baculoviruses, fluorescent microscopy, fluorescence polarization (FP)
Citation: Tahk M-J, Laasfeld T, Meriste E, Brea J, Loza MI, Majellaro M, Contino M, Sotelo E and Rinken A (2023) Fluorescence based HTS-compatible ligand binding assays for dopamine D3 receptors in baculovirus preparations and live cells. Front. Mol. Biosci. 10:1119157. doi: 10.3389/fmolb.2023.1119157
Received: 08 December 2022; Accepted: 28 February 2023;
Published: 16 March 2023.
Edited by:
Arif Md. Rashedul Kabir, Hokkaido University, JapanReviewed by:
Jan Spille, University of Illinois at Chicago, United StatesChiara Bianca Maria Platania, University of Catania, Italy
Copyright © 2023 Tahk, Laasfeld, Meriste, Brea, Loza, Majellaro, Contino, Sotelo and Rinken. This is an open-access article distributed under the terms of the Creative Commons Attribution License (CC BY). The use, distribution or reproduction in other forums is permitted, provided the original author(s) and the copyright owner(s) are credited and that the original publication in this journal is cited, in accordance with accepted academic practice. No use, distribution or reproduction is permitted which does not comply with these terms.
*Correspondence: Ago Rinken, ago.rinken@ut.ee
†These authors have contributed equally to this work and share first authorship