Transferability of radiomic signatures from experimental to human interstitial lung disease
 Hubert S. Gabryś1*
  Janine Gote-Schniering2,3
  Matthias Brunner3
  Marta Bogowicz1
  Christian Blüthgen4
  Thomas Frauenfelder4
  Matthias Guckenberger1
  Britta Maurer3
  Stephanie Tanadini-Lang1*
- 1Department of Radiation Oncology, University Hospital Zurich, Zurich, Switzerland
- 2Comprehensive Pneumology Center, Institute of Lung Health and Immunity, Helmholtz Zentrum München, Member of the German Center for Lung Research (DZL), Munich, Germany
- 3Department of Rheumatology and Immunology, University Hospital Bern, University of Bern, Bern, Switzerland
- 4Institute of Diagnostic and Interventional Radiology, University Hospital Zurich, Zurich, Switzerland
Background: Interstitial lung disease (ILD) defines a group of parenchymal lung disorders, characterized by fibrosis as their common final pathophysiological stage. To improve diagnosis and treatment of ILD, there is a need for repetitive non-invasive characterization of lung tissue by quantitative parameters. In this study, we investigated whether CT image patterns found in mice with bleomycin induced lung fibrosis can be translated as prognostic factors to human patients diagnosed with ILD.
Methods: Bleomycin was used to induce lung fibrosis in mice (n_control = 36, n_experimental = 55). The patient cohort consisted of 98 systemic sclerosis (SSc) patients (n_ILD = 65). Radiomic features (n_histogram = 17, n_texture = 137) were extracted from microCT (mice) and HRCT (patients) images. Predictive performance of the models was evaluated with the area under the receiver-operating characteristic curve (AUC). First, predictive performance of individual features was examined and compared between murine and patient data sets. Second, multivariate models predicting ILD were trained on murine data and tested on patient data. Additionally, the models were reoptimized on patient data to reduce the influence of the domain shift on the performance scores.
Results: Predictive power of individual features in terms of AUC was highly correlated between mice and patients (r = 0.86). A model based only on mean image intensity in the lung scored AUC = 0.921 ± 0.048 in mice and AUC = 0.774 (CI95% 0.677-0.859) in patients. The best radiomic model based on three radiomic features scored AUC = 0.994 ± 0.013 in mice and validated with AUC = 0.832 (CI95% 0.745-0.907) in patients. However, reoptimization of the model weights in the patient cohort allowed to increase the model’s performance to AUC = 0.912 ± 0.058.
Conclusion: Radiomic signatures of experimental ILD derived from microCT scans translated to HRCT of humans with SSc-ILD. We showed that the experimental model of BLM-induced ILD is a promising system to test radiomic models for later application and validation in human cohorts.
Introduction
Interstitial lung disease (ILD) defines a group of chronic, etiologically different parenchymal lung disorders, characterized by fibrosis as their common final pathophysiological stage. The prognosis of the most prevalent and severe subtypes, idiopathic pulmonary fibrosis (IPF) and ILD associated with the autoimmune disease systemic sclerosis (SSc), is as poor as that of untreated oncologic diseases (1, 2). Globally, non-malignant lung diseases including ILD rank third on the mortality scale (3).
Experimental models of fibrosing ILD are paramount for the identification of cellular and molecular key drivers of disease and as preclinical test systems for novel targeted drugs (4). The preferred and best characterized preclinical model of ILD is the murine model of bleomycin-induced lung fibrosis, which reflects important features of human ILD such as apoptosis of epithelial cells, influx of inflammatory cells into the interstitium, followed by activation of fibroblasts with increased deposition of extracellular matrix (ECM) proteins (5, 6).
Conventional endpoint measures of lung fibrosis involve histological and biochemical analyses, which, however, have certain disadvantages. To recapitulate the dynamic process of fibrosing ILD at multiple time points and to account for the high interindividual variability, large numbers of animals are required to reach significant statistical power (7). Additionally, lung biopsies are only rarely performed in human ILD (8, 9) and biopsy may not be representative for the whole lung pathology. Upcoming alternative outcome measures for translational ILD research include imaging methodologies. An integral part of the routine clinical management is medical imaging, particularly high-resolution computed tomography (HRCT), which allows non-invasive, highly sensitive, time- and spatially resolved visualization of the entire lung changes (10) and a correlative estimation of lung function (11). Similarly, in preclinical models of ILD, small animal microCT is increasingly recognized as a valuable assessment tool (4, 7). In the model of bleomycin-induced experimental ILD, the relative comparability of both imaging and molecular changes with human ILD (5, 12–15) support its suitability for translational ILD research.
The need for innovative, directly transferable, and readily applicable readouts in ILD have prompted the herein presented translational study on the potential value of the model of bleomycin-induced lung fibrosis as experimental “radiomic toolbox” for human ILD. Radiomics is a powerful strategy for in-depth analysis of pathologic tissue phenotypes by computational extraction of quantitative imaging features from medical images (16, 17). Radiomic features provide objective information on tissue shape, intensity, and texture on a molecular scale as demonstrated by studies on tumor biology showing correlation with tissue-based genomics and proteomics data (18–21). As image-derived tissue surrogates, their potential use as virtual biopsies could make radiomics analyzes an ideal tool for clinical decision support in ILD especially since radiomic features have also been shown to predict disease outcome and response to therapy (18, 19, 22–25). However, compared with oncology (18, 20–22), research into the potential of radiomics in non-malignant lung diseases is limited (26–30).
Nevertheless, the available literature on human lung pathologies, including chronic obstructive pulmonary disease, radiation-induced pneumonitis and connective tissue disease-related ILD showed that texture-based analysis of CT images can be superior compared to the visual or histogram-based measures for diagnosis (28, 31, 32). Few studies investigated the use of radiomics in experimental settings. Eresen et al. used MRI radiomics for prediction of response to vaccine therapy in a mouse model of pancreatic ductal adenocarcinoma (33, 34). Nunez et al. analyzed suitability of MRI radiomics for diagnosis of preclinical GL261 glioblastoma (35). Other researchers focused on radiomic-based prediction of liver metastases or liver fibrosis in mice (36, 37).
To date no study has shown the value of animal models in radiomics research. We are not aware of any studies reporting transferability of radiomic patterns from experimental model to clinical setting. Establishing a link between preclinical and clinical radiomic patterns could enormously facilitate testing a vast range of hypotheses in an experimental setting. Such a link is currently missing. In this analysis, we evaluate if radiomic features and models can be translated from experimental to human ILD.
Materials and methods
Study design and data sets
Details of the study design and data sets are shown in Figure 1. In short, we investigated whether radiomic patterns indicative of ILD in mice were also present in human disease.
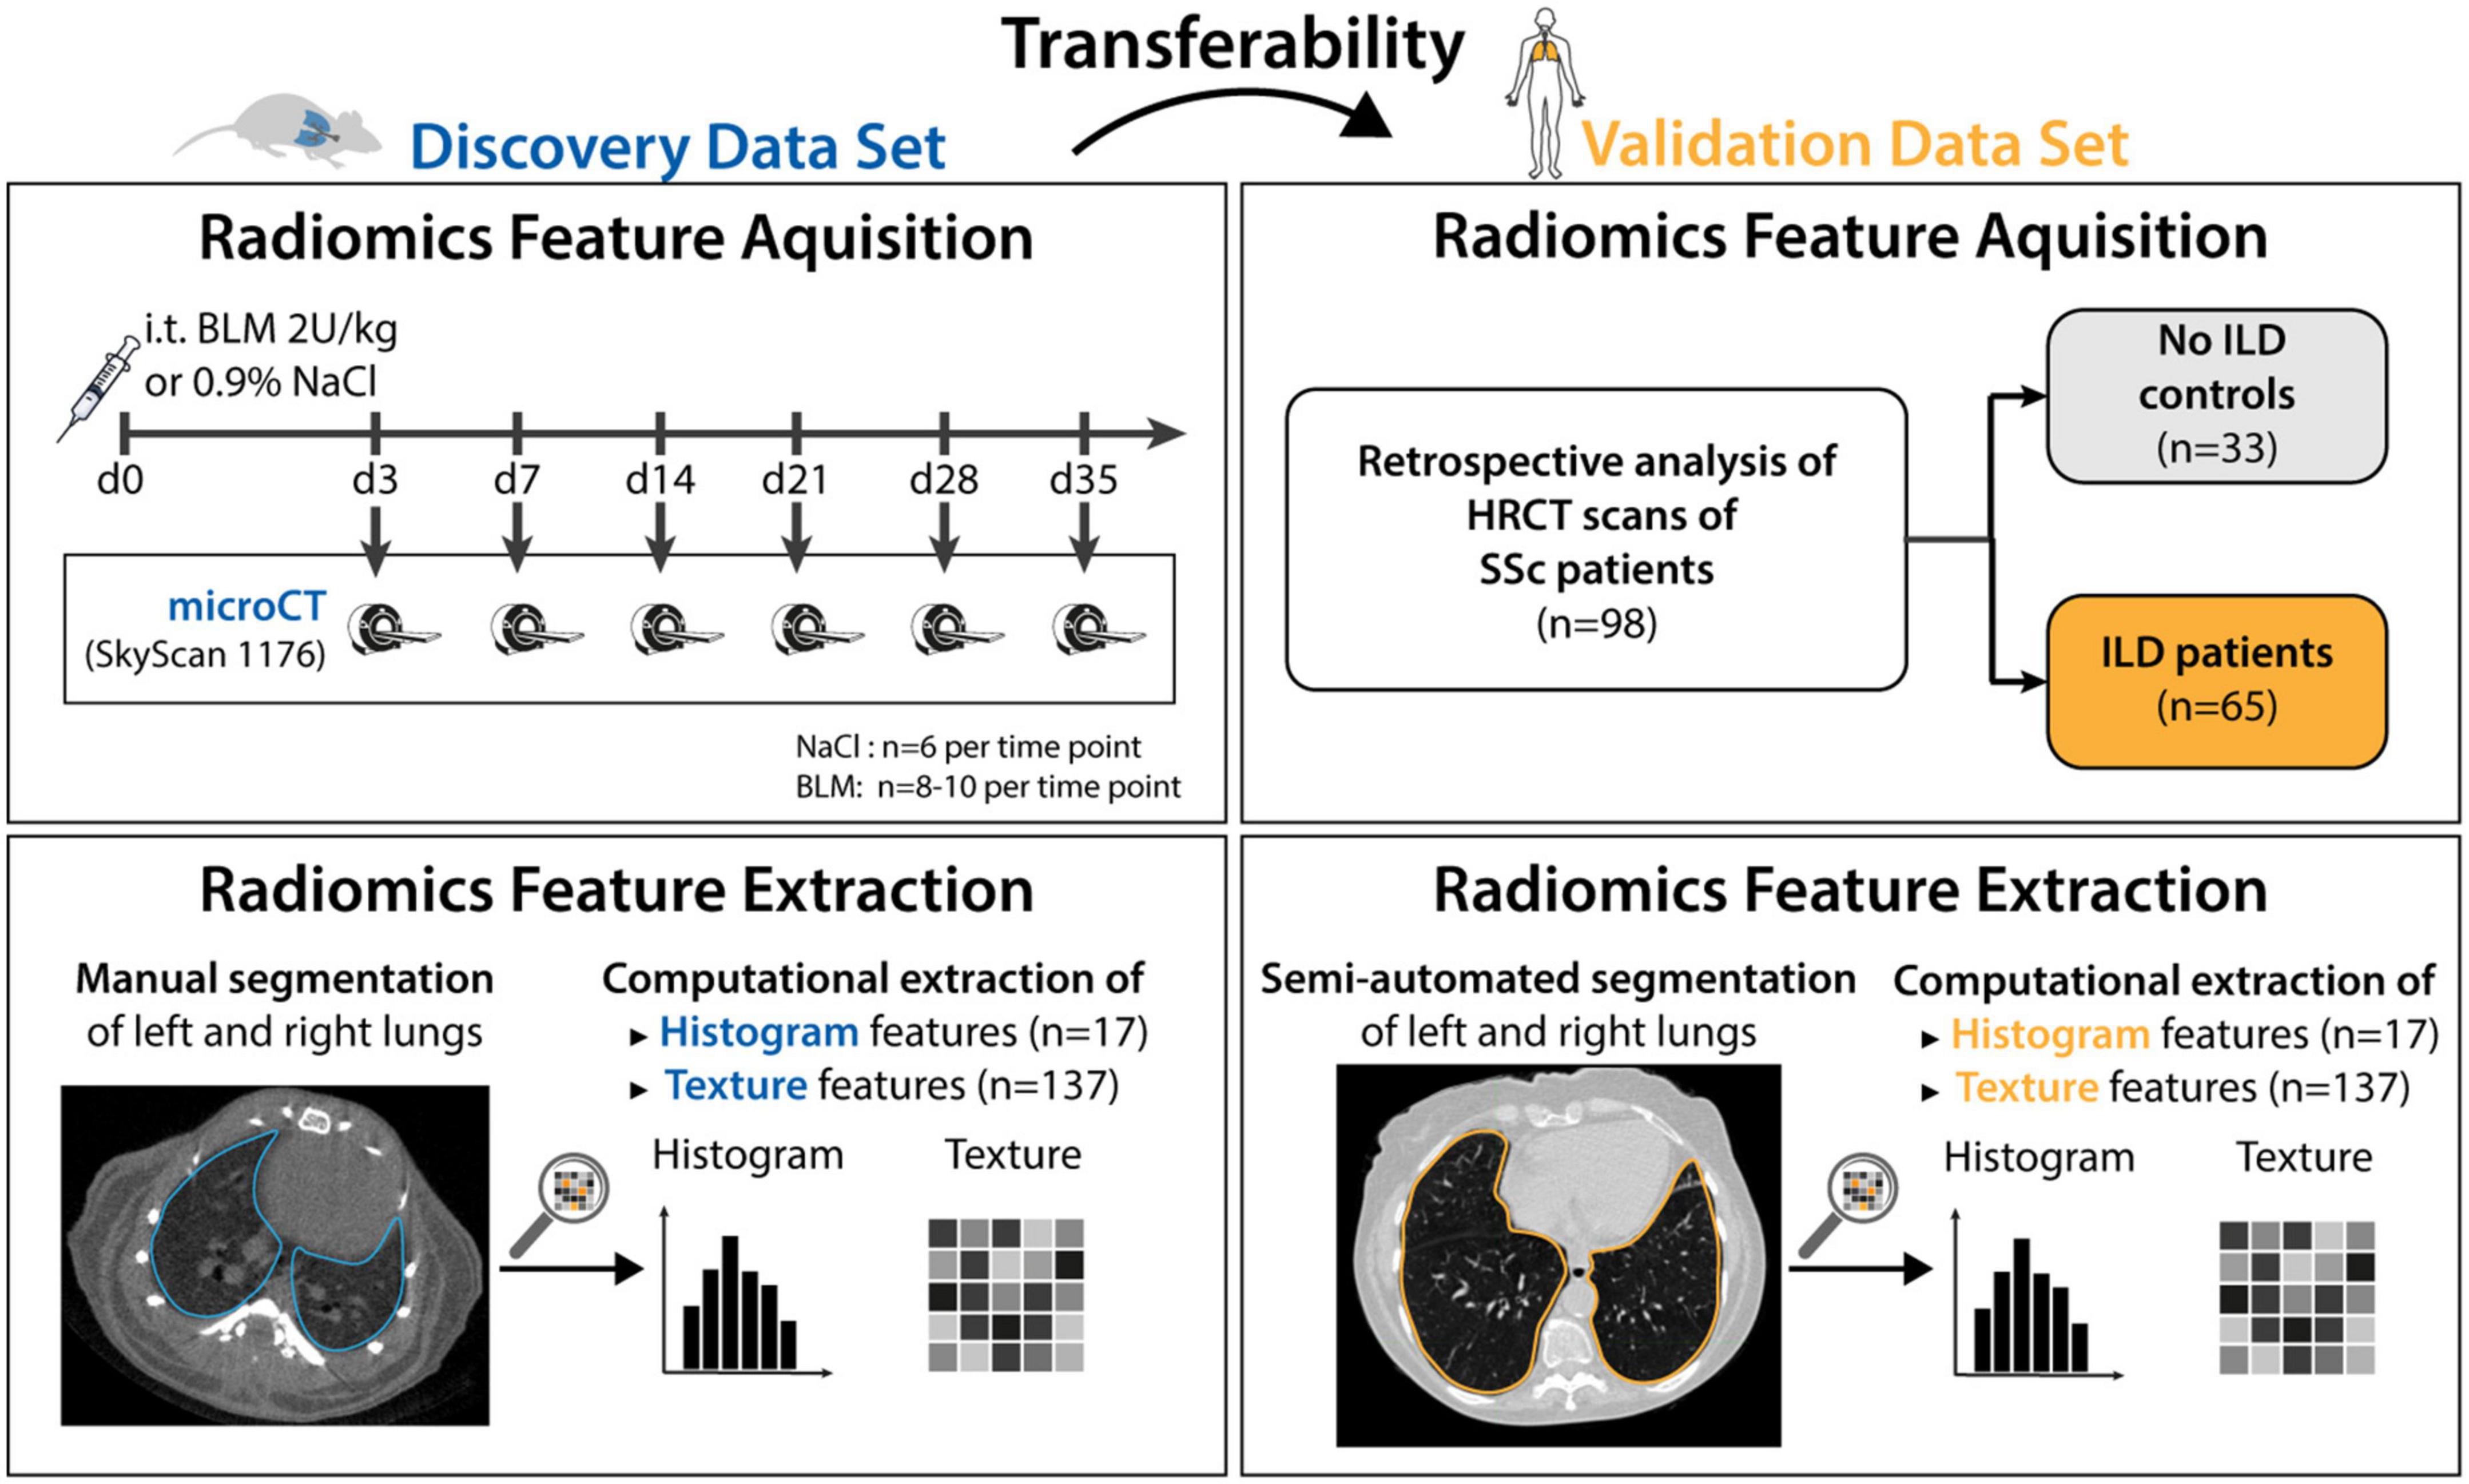
Figure 1. Study design. The mice data set (n = 91) was used to discover radiomic patterns predictive of ILD. The discovered patterns were tested in the human validation data set (n = 98). 55 mice were given Bleomycin to induce ILD, whereas 36 mice were given NaCl and served as the control group. The mice were euthanized at day 3, 7, 14, 21, 28, and 35 and scanned with a microCT scanner. Afterward, classification models were trained to predict occurrence of ILD based on images acquired from the scanner. The 98 patients from the validation data set were retrospectively collected. All patients were scanned with HRCT and graded according to the Goh scale of pulmonary fibrosis. The radiomic models built using mice data were tested in patients.
The preclinical model of bleomycin (BLM)-induced lung fibrosis was used to mimic human ILD. The experimental cohort consisted of 91 8-week-old female mice (C57BL/6J-rj, Janvier Labs). ILD was induced in 55 mice via intratracheal instillation of bleomycin (2 U/kg; Baxter 15,000 I.U.) as described in (6, 14, 38). The 36 control animals received equivalent volumes of 0.9% NaCl solution. Mice were randomized into the different experimental groups and instillation was performed blinded. Pulmonary micoCT scans were performed at different days (days 3, 7, 14, 21, 28, and 35) after bleomycin instillation to reflect different disease stages. Different mice were scanned at every time point as the animals were euthanized after image acquisition. Scanning mice at different time points after fibrosis induction did not serve a particular purpose in this work. Such design was chosen because this experimental data was also used in other studies which examined temporal aspect of fibrotic development.
A cohort of 98 SSc patients being followed at the Department of Rheumatology, University Hospital Zurich represented the validation data set. All included patients met the following criteria: diagnosis of SSc according to the Very Early Diagnosis of Systemic Sclerosis (VEDOSS) (39) or the 2013 American College of Rheumatology//European League against Rheumatism (ACR/EULAR) classification criteria (40), and availability of an HRCT scan. Patient characteristics are provided in Table 1.
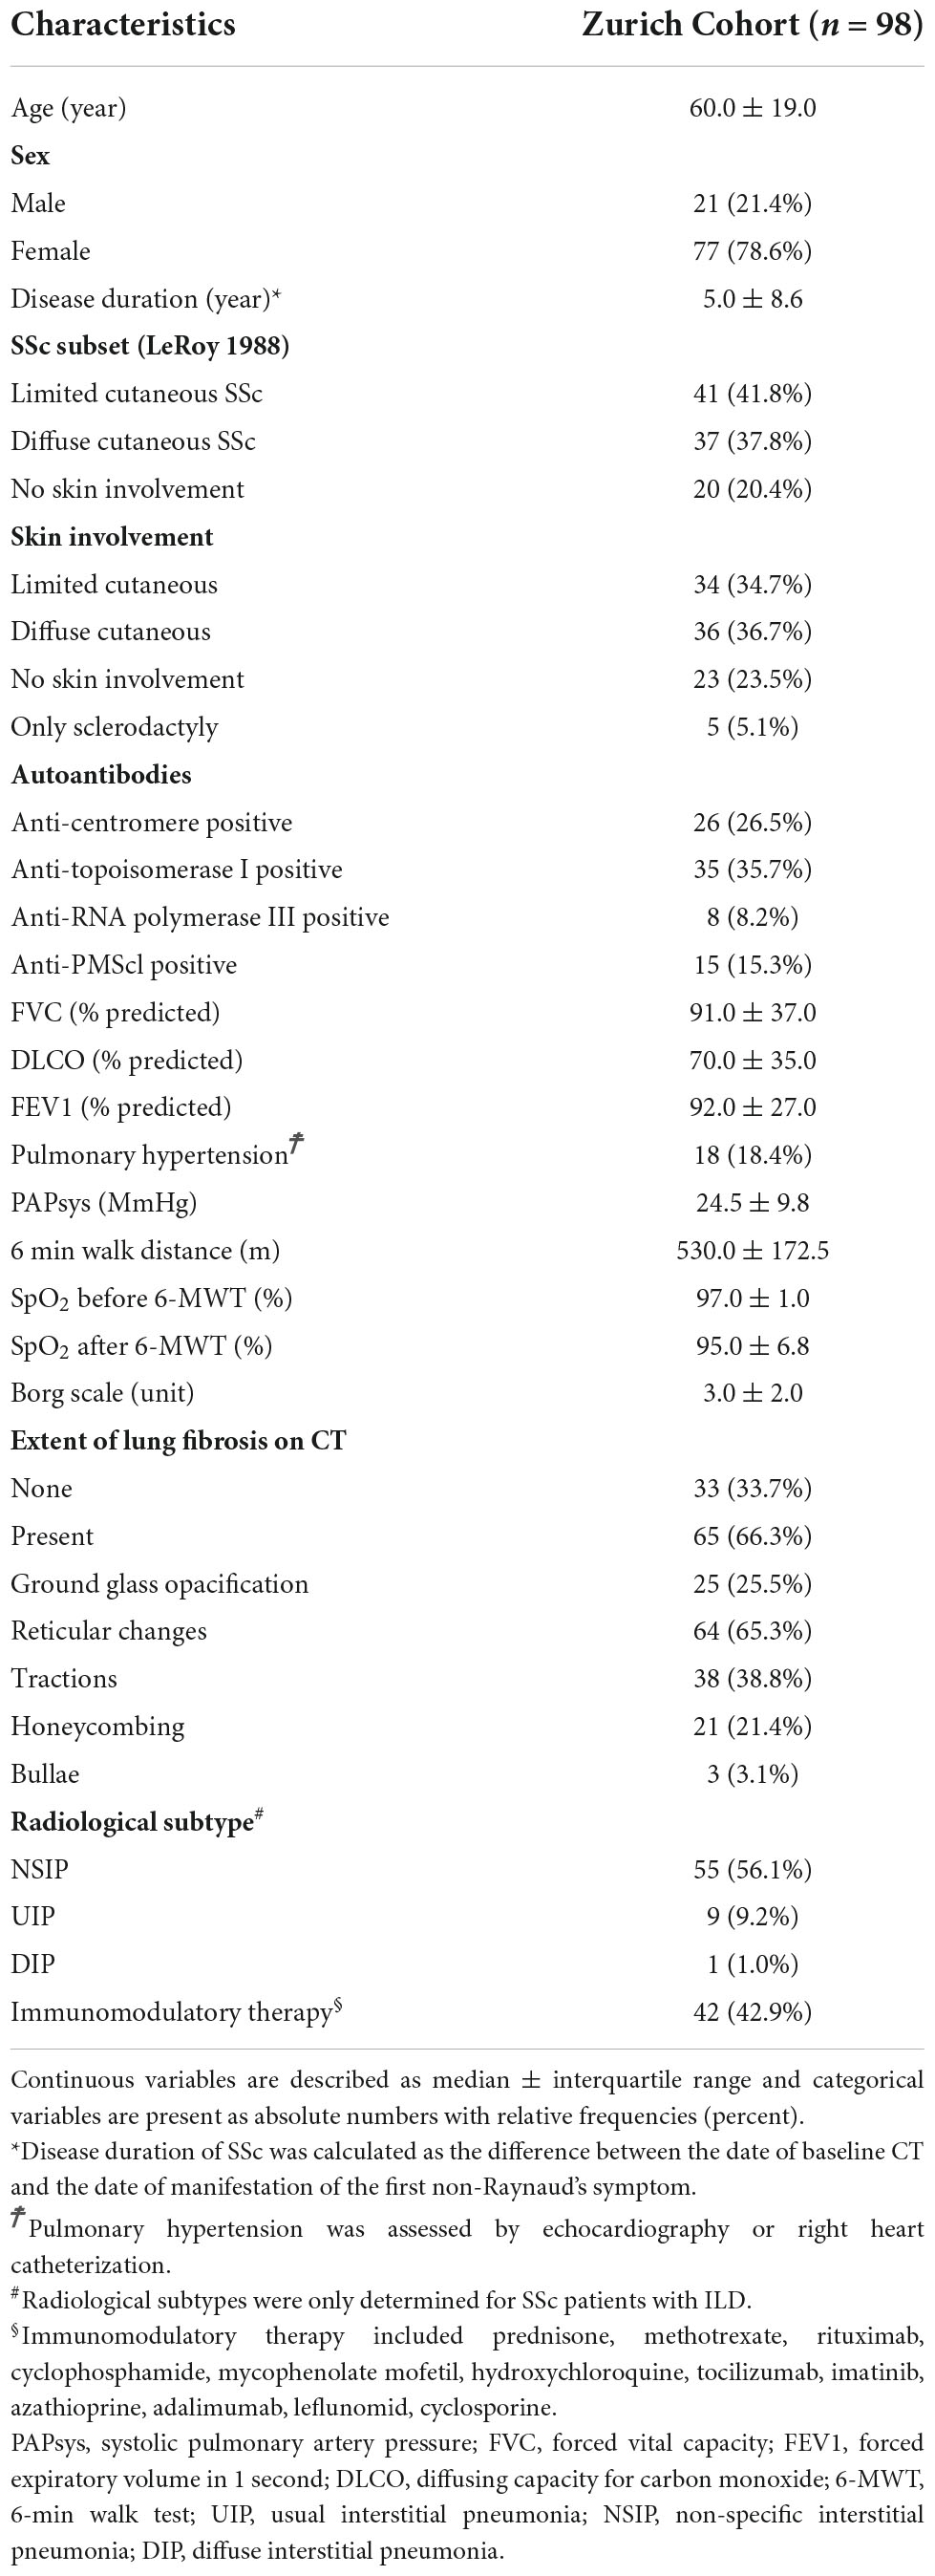
Table 1. Summary of patient’s demographics and clinical baseline characteristics.
The extent of lung fibrosis was defined as presence of reticular changes or honeycombing within whole lung volume (Figure 2). All visual analyses were performed by a senior radiologist (TF) using a standard picture archiving and communication system workstation (Impax, Version 6.5.5.1033; Agfa-Gevaert) and a high-definition liquid crystal display monitor (BARCO; Medical Imaging Systems).
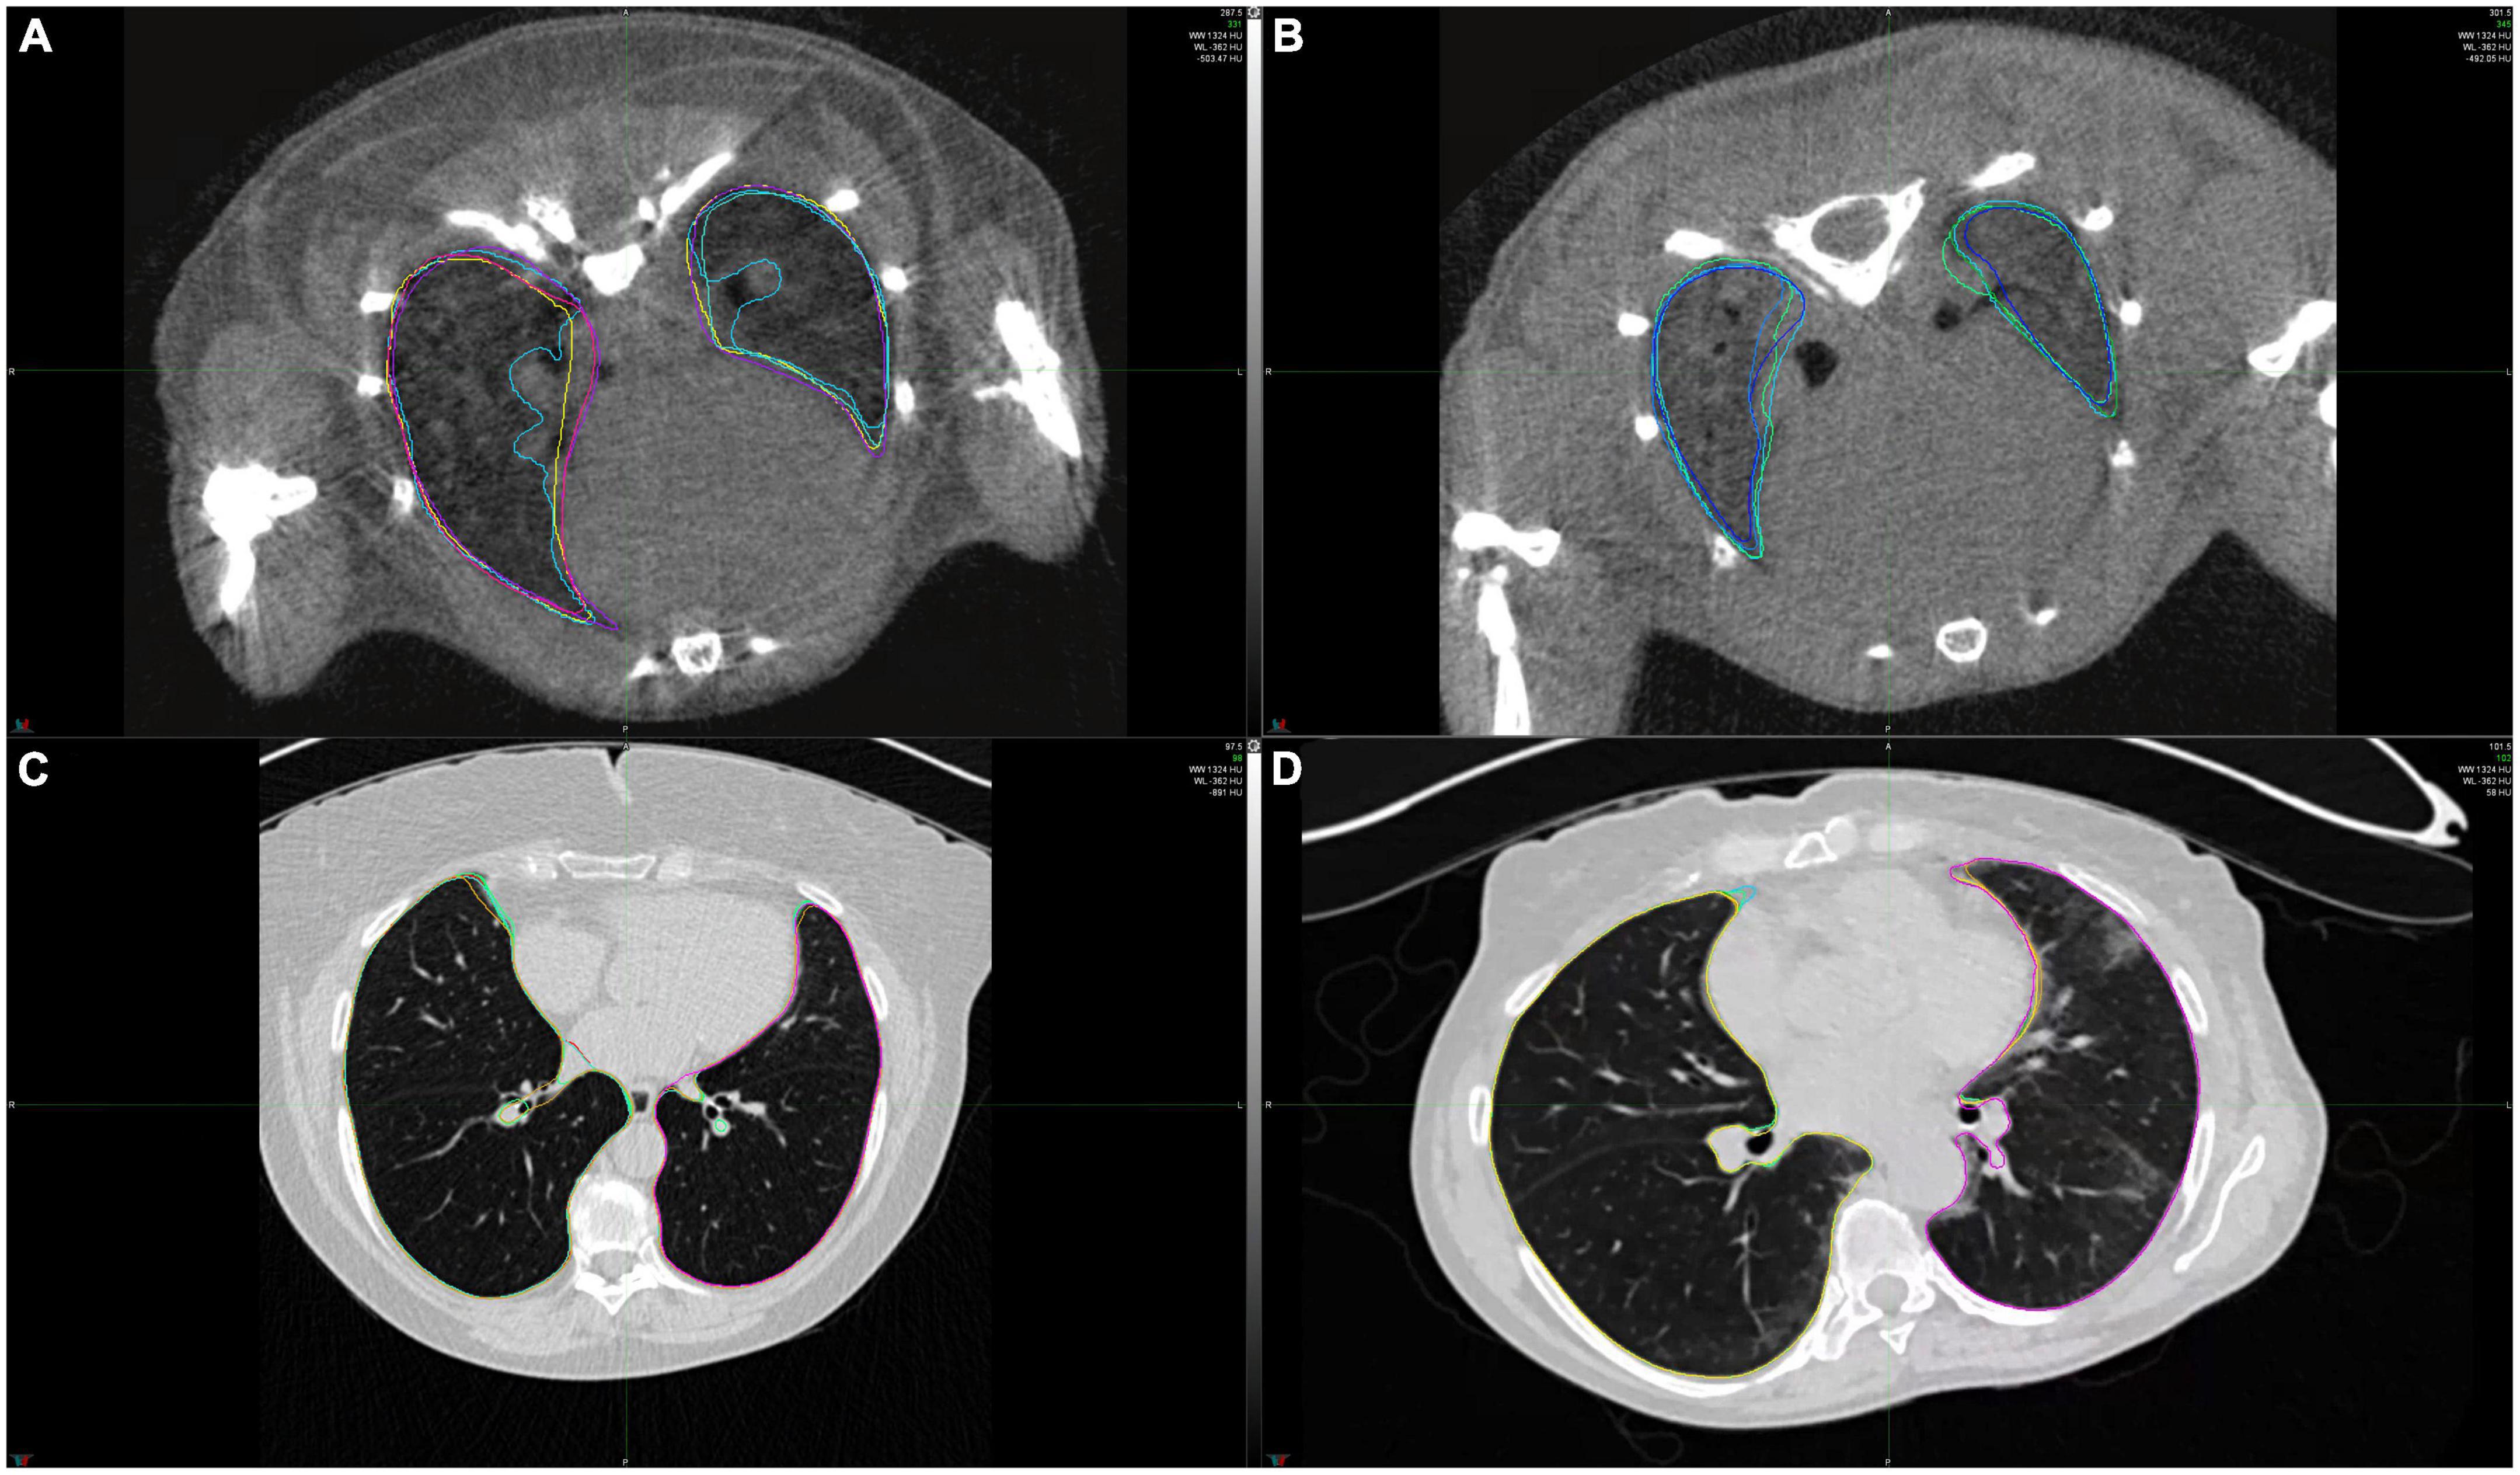
Figure 2. Example CT scans of healthy lungs and lungs affected with lung fibrosis. (A) microCT image of a healthy mice lung, (B) microCT image of a mice lung with lung fibrosis, (C) HRCT image of a healthy human lung, (D) HRCT image of a human lung with lung fibrosis. Lung contours marked in different colors show the extent of intra- and interobserver variability in lung segmentations for these two cases.
Imaging and extraction of radiomic features
Pulmonary microCT scans were acquired in free-breathing mice with prospective respiratory gating using Bruker SkyScan 1176. The following scan parameters were used: tube voltage 50 kV, tube current 500 μA, filter Al 0.5 mm, averaging (frames) 3, rotation step 0.7 degrees, sync with event 50 ms, X-ray tube rotation 360 degrees, resolution 35 μm, and slice thickness 35 μm. Images were reconstructed with NRecon reconstruction software (v.1.7.4.6; Bruker) using the built-in filtered back projection Feldkamp algorithm and applying misalignment compensation, ring artifact reduction, and a beam hardening correction of 10% to the images.
HRCT scans were acquired using Siemens scanners (SOMATOM Definition AS, SOMATOM Definition Flash, SOMATOM Force, SOMATOM Sensation 64, SOMATOM Sensation 16, Biograph 64, LightSpeed Pro 16, LightSpeed VCT). The scans were acquired in an inspiration (breath hold) mode. The median slice thickness was 1 mm (range 0.6-2 mm) and the median tube voltage was 120 kVp (range 80-150 kVp). The reconstruction kernels included B60f, B70f, and Bl64.
The contouring of whole lungs was performed manually in mice and semi-automatically in patients (region growing algorithm followed by manual correction) by two experienced examiners (JS and MB). Left and right lungs were contoured independently and then both contours were merged to generate a single contour including both lungs.
Feature extraction from CT images was performed with Z-Rad, an IBSI-compliant (41), in-house developed Python software. CT scans of mice and patients were interpolated to an isotropic resolution of 0.15 mm and 2.75 mm, respectively. The interpolation resolutions were chosen to achieve similar ratio of voxel size to average lung volume in mice and patients. The region of interest (ROI) for feature extraction was defined as the right and the left lung considered as a single organ. Only intensity values within the range from −1,000 HU to 200 HU were considered. We used a fixed bin size of 50 HU. The radiomic features describing image intensity (histogram, n = 17) and texture (n = 137) were extracted for each mouse and patient. The texture features were based on gray level co-occurrence matrix (GLCM, n = 26), gray level run length matrix (GLRLM, n = 16), gray level distance zone matrix (GLDZM, n = 16), gray level size zone matrix (GLSZM, n = 16), neighboring gray level dependence matrix (NGLDM, n = 16), and neighborhood gray tone difference matrix (NGTDM, n = 5) to capture wide variety of intensity patterns. Additionally, GLCM and GLRLM features were extracted with two different feature aggregation methods - with and without merging. In total, 154 features were extracted. The list of radiomic features is provided in the supplement.
Statistical analysis
For every radiomic feature, robustness against intra- and interobserver variability was examined. This was realized with estimation of the corresponding intraclass correlation coefficients (ICC). Specifically, we used consistency of ICC (1, 3) according to the Shorut and Fleiss naming convention (42). Features with ICC ≥0.75 for intra- and interobserver settings in both mice and humans were considered stable and were retained. The rest of the features were excluded from further analysis.
Univariate predictive power of the radiomic features was evaluated by estimation of the area under the receiver operating characteristic curve (AUC). To facilitate comparison of the AUC values between mice and patient data sets, we adopted a convention that AUC is equal to the probability that a radiomic feature value of a randomly chosen patient from the positive group is greater than the value of a randomly chosen patient from the negative group. This allowed us to distinguish between features that were characterized by comparable predictive power but a different direction of the effect, for example, AUC = 0.3 in mice and AUC = 0.7 in patients. The linear association of the AUC scores between mice and patient groups has been evaluated with Pearson correlation coefficient.
Three model architectures were considered for evaluation of model transferability from mice to patients: (1) a model based on mean image intensity (MEAN), (2) a model based on first four moments of intensity distribution (mean, standard deviation, skewness, and kurtosis; MSSK), and (3) a machine learning model based on logistic regression (ML). While the first two models are based on predefined radiomic features, the machine learning model employed embedded feature selection methods. All models were built on the mice data and were validated in the patient data.
Feature selection and model tuning was realized within 4-times repeated 5-fold cross-validation. The first step of the feature selection procedure was dimensionality reduction by removing features that were highly linearly correlated (Pearson’s r). The correlation threshold was one of tunable hyperparameters. The second step of feature selection was fitting a model and selection of most important features from this model which were then fed to the final classifier. In the case of a logistic regression model, the feature selection was realized with another logistic regression. In the case of, extra-trees model, most important features were extracted from a gradient tree-boosting model. The number of extracted features in both cases was one of tunable hyperparameters. For model tuning, we used 500 randomized hyperparameter samples. The optimized models were validated in patients. Additionally, the models were re-optimized in patients to evaluate transferability and predictive power of the discovered radiomic signatures rather than the models themselves. Furthermore, this allowed to reduce the influence of covariate shift between the data sets.
For visualization, statistical analysis, model building, and model testing, the following open-source Python packages were used: Matplotlib (43), NumPy & SciPy (44), Pandas (45), and scikit-learn (46).
Results
Influence of intra- and interobserver delineation variability on radiomic features
Intra- and interobserver delineation variability were evaluated separately in mice and patient data sets using 15 randomly selected cases per data set. Intraobserver variability was assessed based on delineations done by JS. Interobserver variability was assessed based on delineations provided by JS, CB, and MBr. Figure 3 shows the proportion of the unstable features per feature class. In mice, 7 features from the initial set of 154 were considered unstable (ICC < 0.75) and were excluded from the further analysis. In patients, all features were stable (ICC ≥ 0.75) so no further features were excluded.
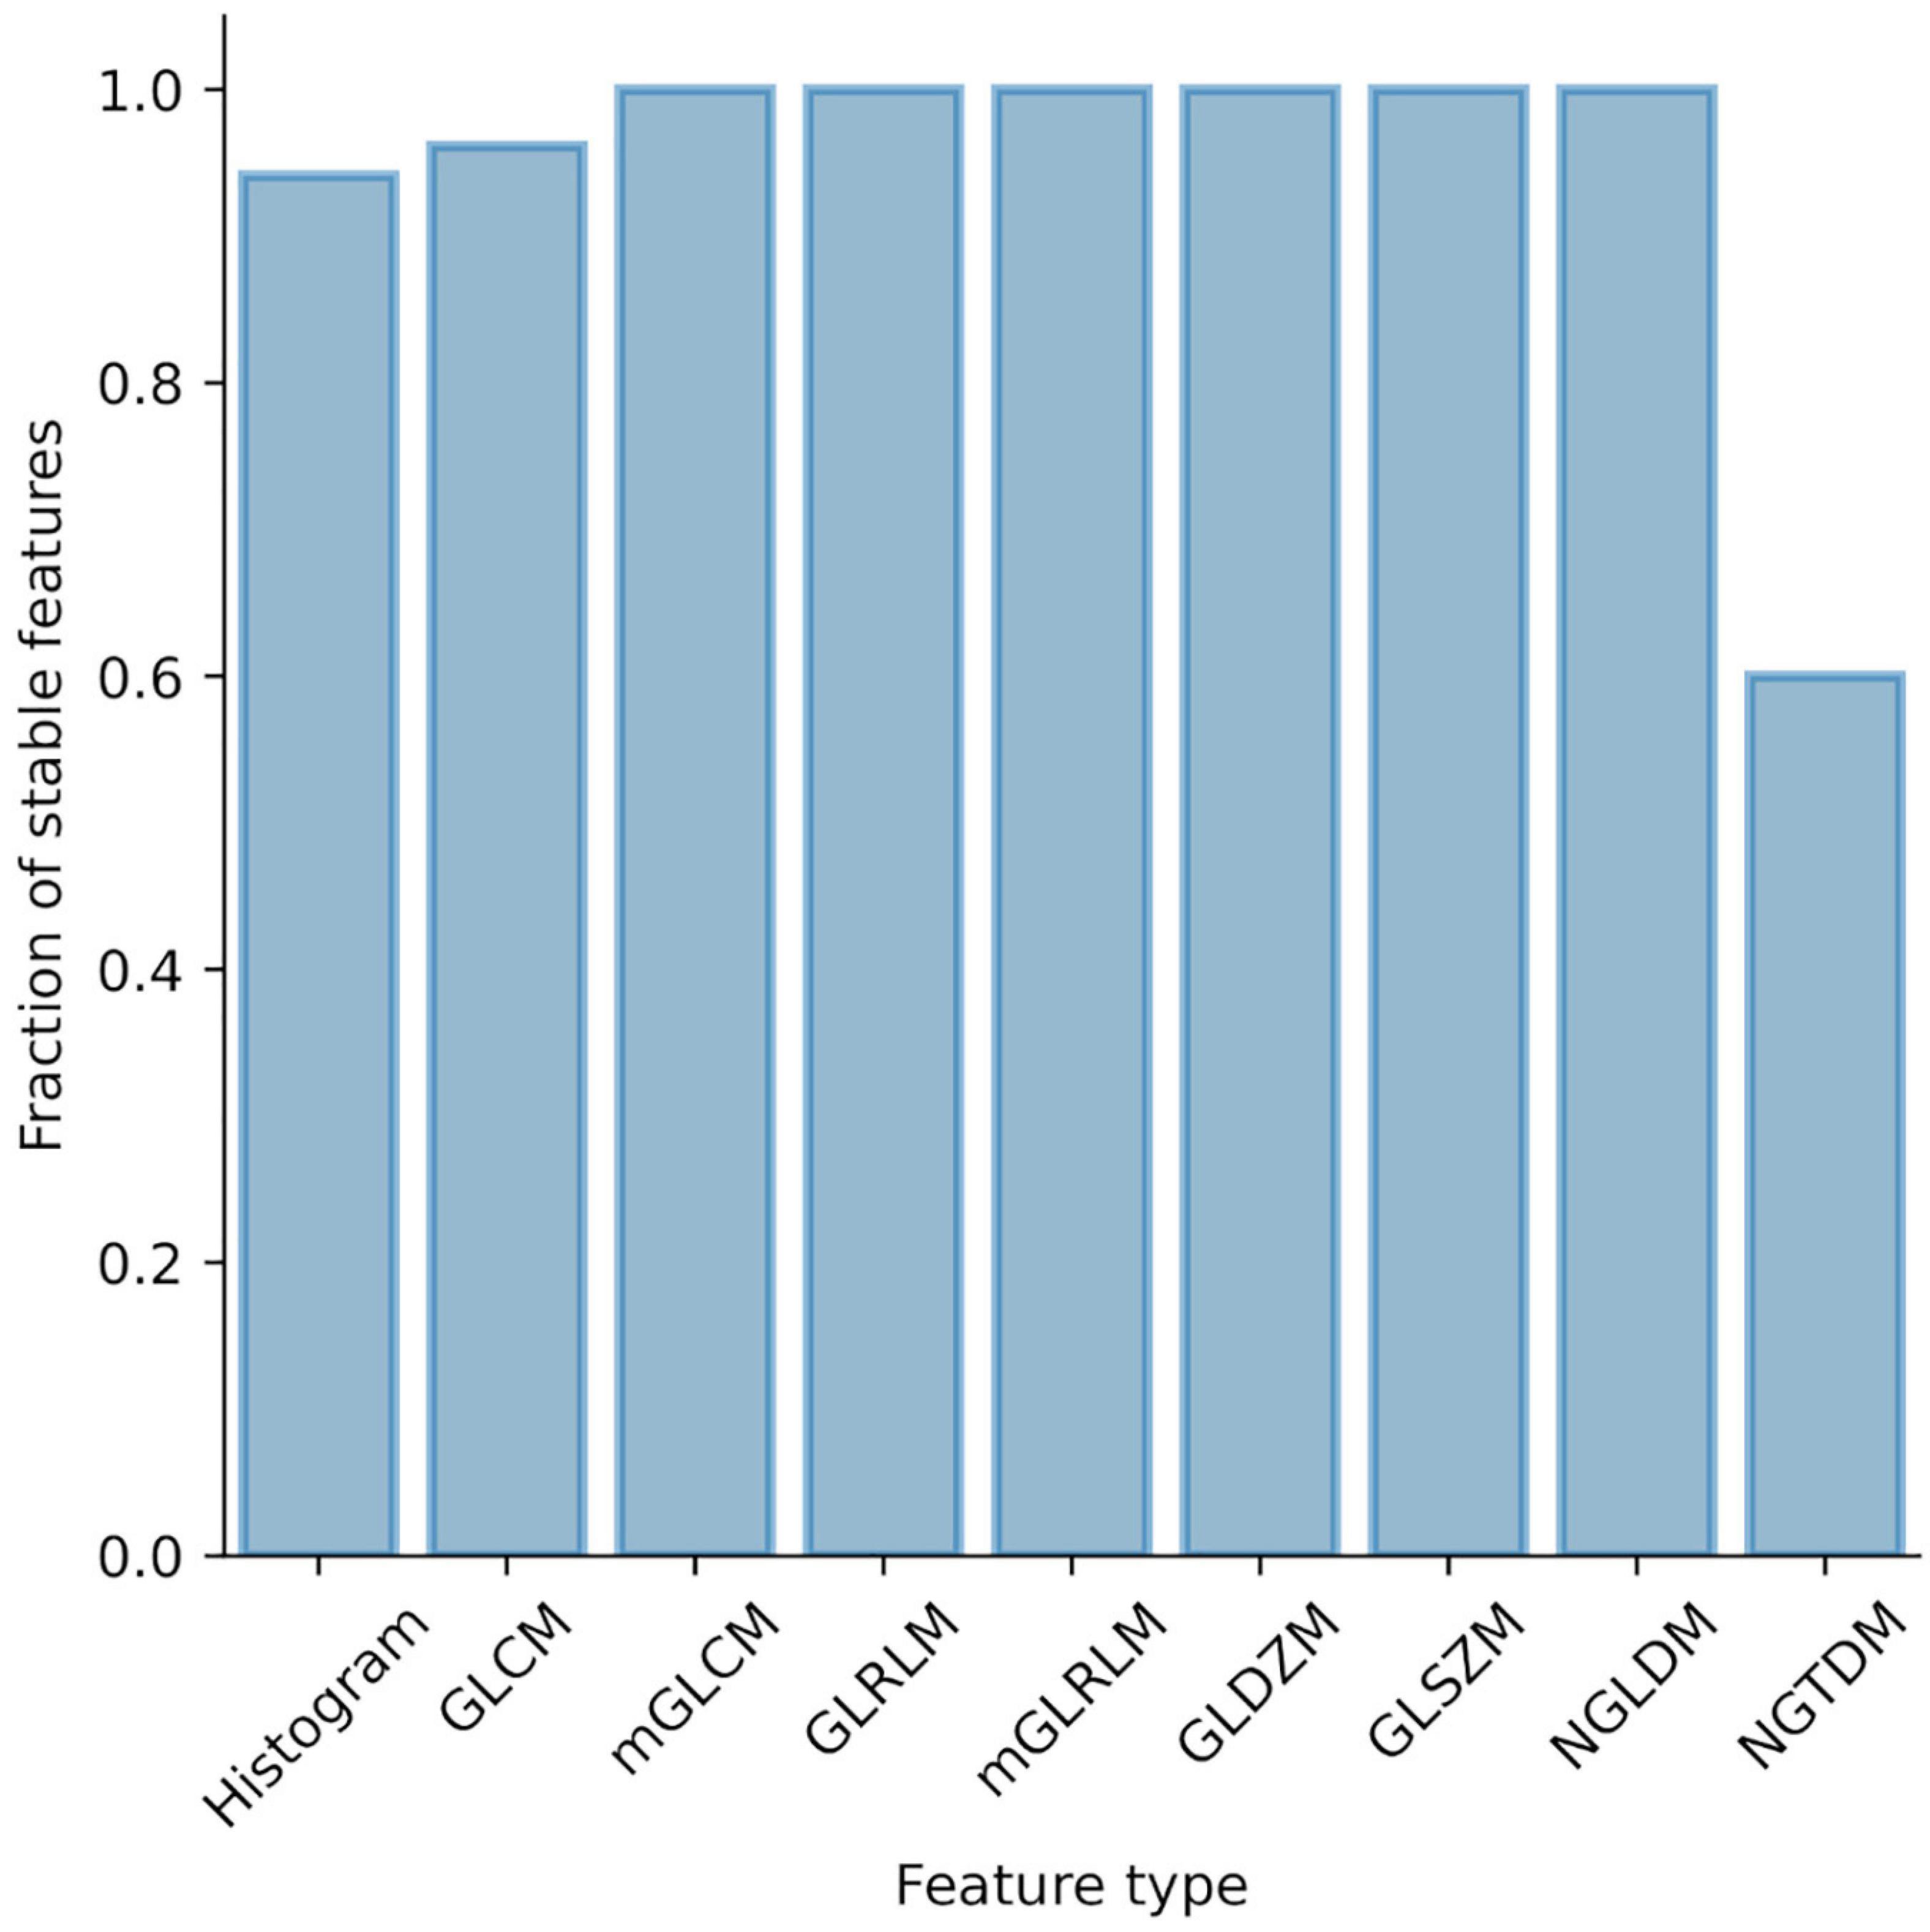
Figure 3. Influence of intra- and interobserver delineation variability on radiomic features stability. Proportion of unstable features stratified by feature type.
Discriminative power of radiomic features is highly correlated between mice and patient data
The next steps in our analysis were the investigation of univariate discriminative power of radiomic features and the correlation of AUC scores between mice and patients. ICC analysis was performed to compare two feature aggregation methods of GLCM and GLRLM features. As both feature aggregation methods rendered highly correlated results (ICCGLCM = 0.99, ICCGLRLM = 0.83), only one feature aggregation per feature class method was kept for further analysis to reduce feature redundancy.
Univariate predictive power of radiomic features in terms of AUC is presented in Figure 4A. On average, features describing image intensity tended to perform better than texture-based features. Radiomic features were on average more predictive in mice than in patients. Most predictive features in mice achieved AUC = 0.988, whereas in patients AUC = 0.896. The complete list of feature predictive performance is provided in the supplement.
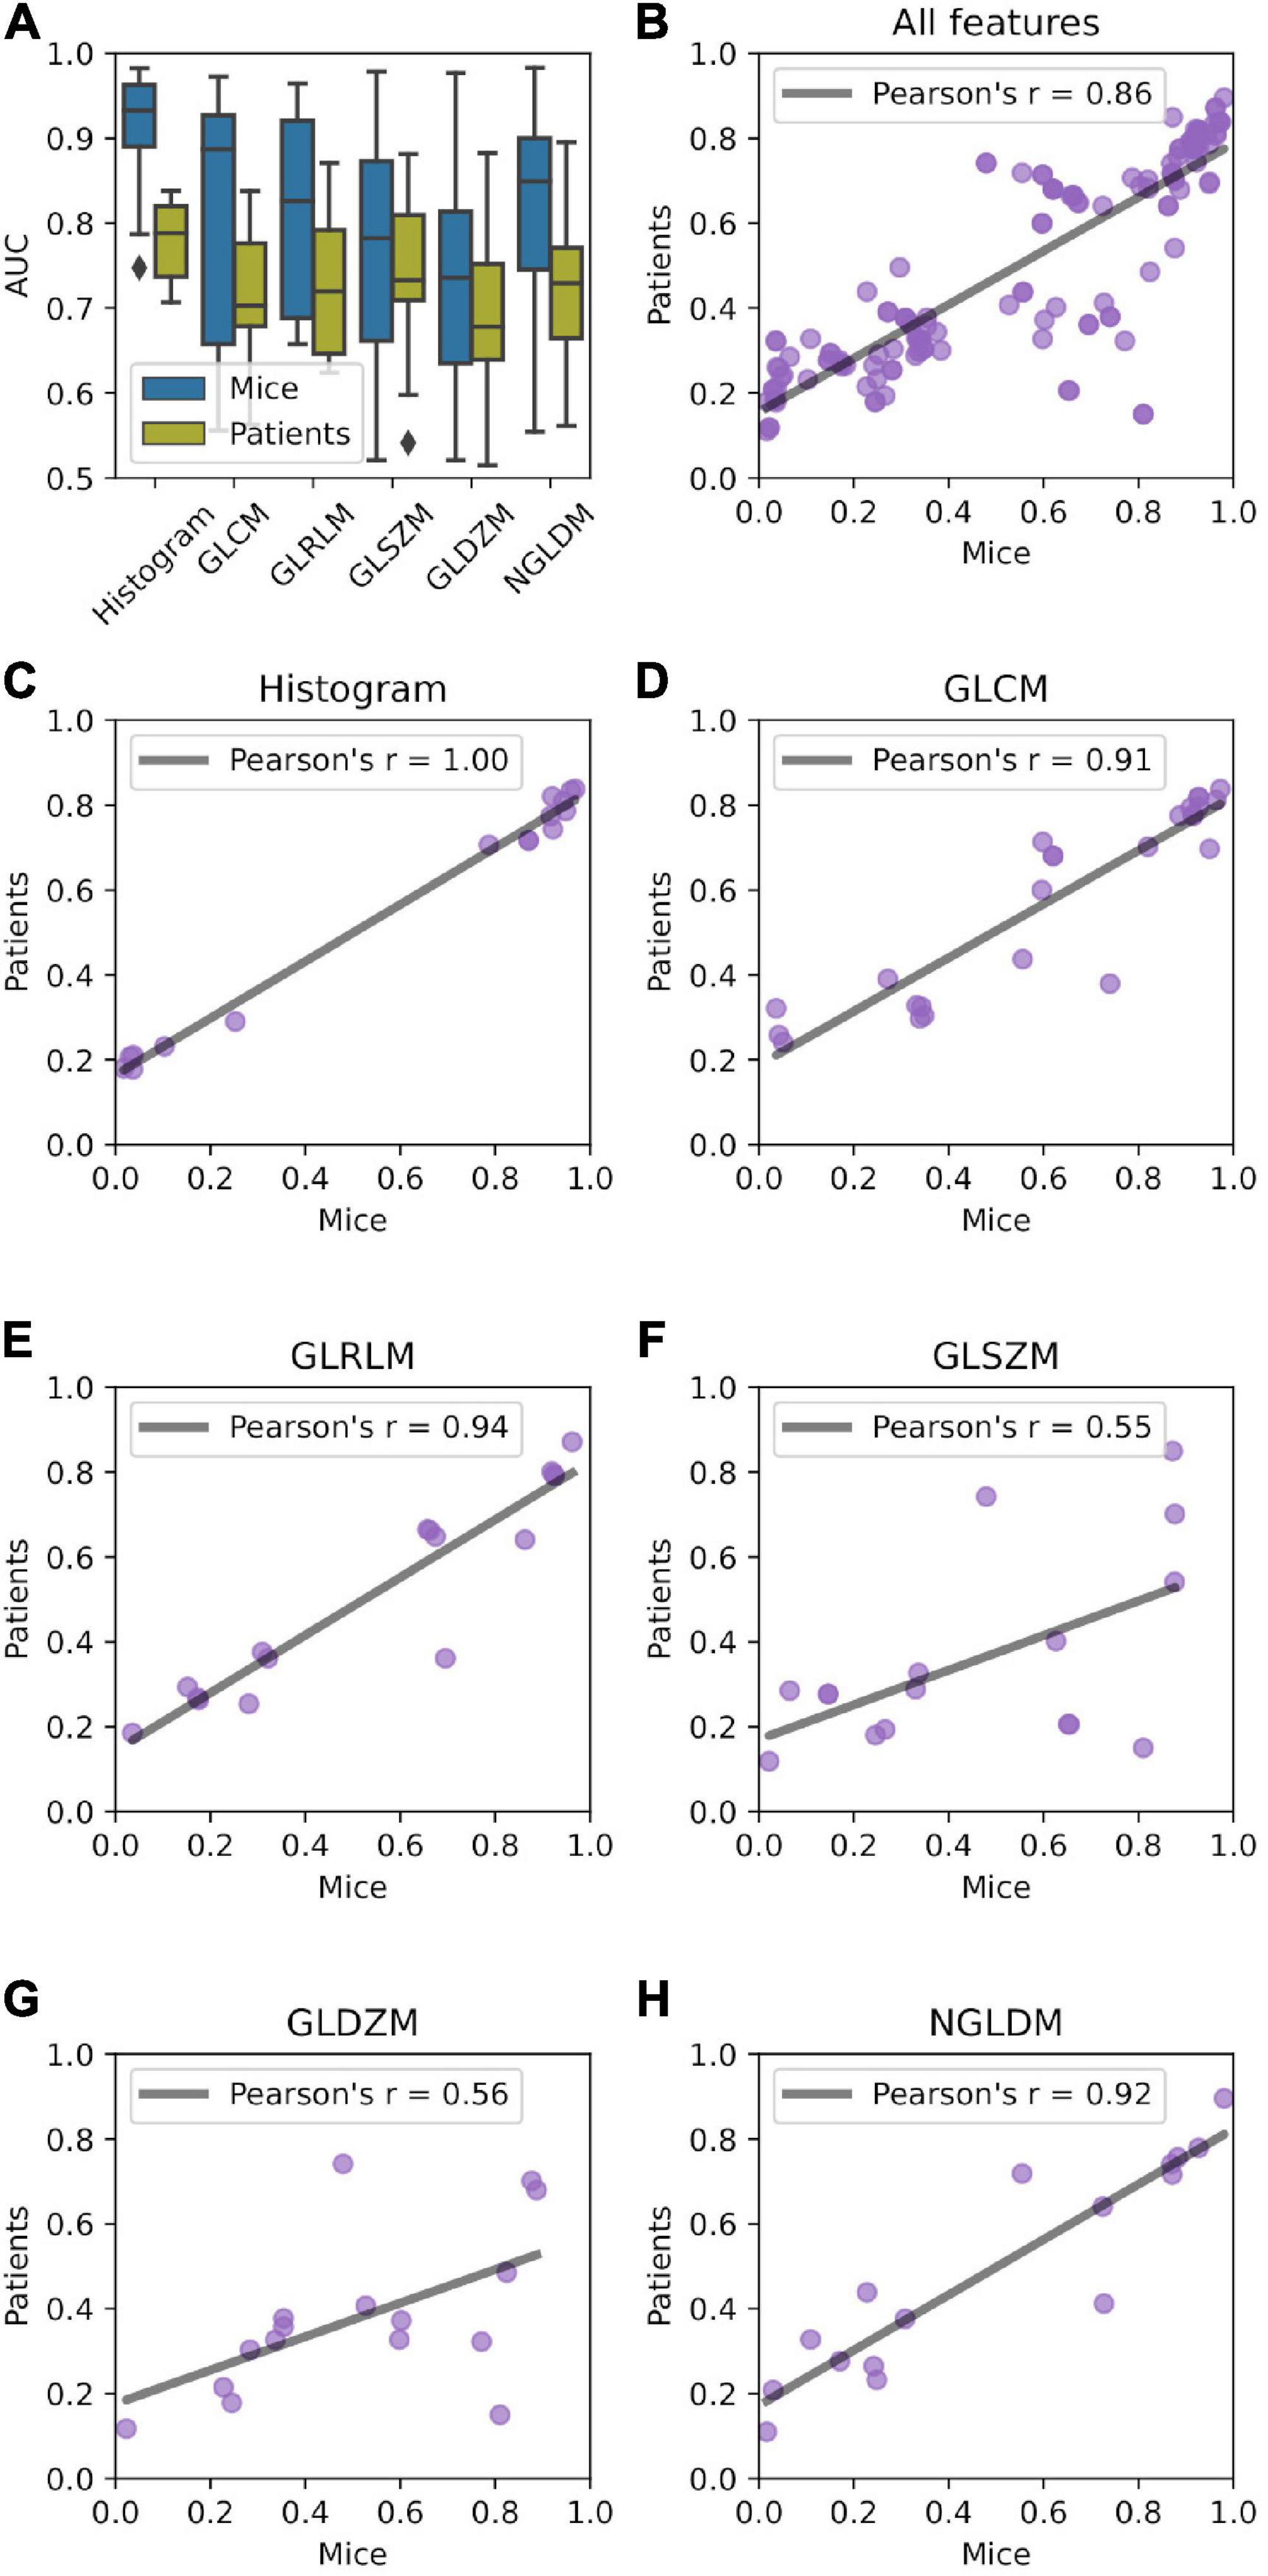
Figure 4. Relationship between predictive power of radiomic features in mice and patient data sets. (A) AUC distribution stratified by feature type (histogram, gray level co-occurrence matrix (GLCM, n = 26), gray level run length matrix (GLRLM, n = 16), gray level distance zone matrix (GLDZM, n = 16), gray level size zone matrix (GLSZM, n = 16), and neighboring gray level dependence matrix (NGLDM, n = 16). (B–H) Correlation of the AUC between mice and patient groups.
Univariate predictive power of the features was highly correlated between murine and patient groups (Figure 4B) with Pearson’s r = 0.86. Very high correlation was observed for histogram-, GLCM-, GLRLM-, and NGLDM-based features (Figures 4C–E,H). GLSZM- and GLDZM-based features exhibited more variability (Pearson’s r < 0.6; Figures 4F,G).
Radiomic patterns predictive of interstitial lung disease translate from experimental interstitial lung disease to patients
To analyze transferability of radiomic patterns and models from mice to patients we built and validated four classes of models: (1) a model based on mean image intensity (MEAN), (2) a model based on first four moments of intensity distribution (mean, standard deviation, skewness, and kurtosis; MSSK), and (3) a machine learning model based on logistic regression (ML). The models were trained on mice data and tested in patients. Additionally, the models were reoptimized in patients, that is, retrained using the features from the mouse models. The results and comparison of model performance is shown in Table 2.
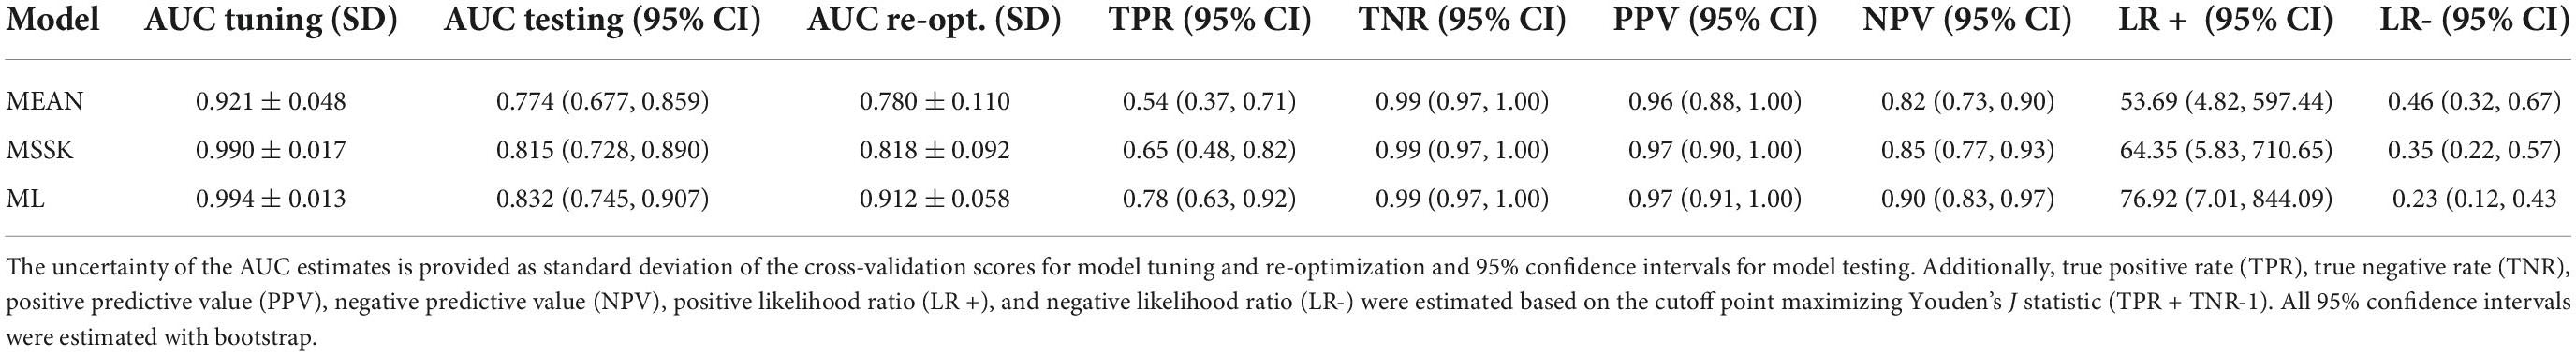
Table 2. Predictive performance in model tuning, testing, and re-optimization.
All models achieved high diagnostic performance in mice. The baseline MEAN model scored AUC = 0.921 which left little room for improvement. Nevertheless, the MSSK and the ML models exceeded AUC = 0.990 resulting in almost perfect classification performance. Testing model performance in patients resulted in AUC scores varying from 0.754 (MEAN) to 0.832 (ML). Model re-optimization in patients allowed to improve the predictive performance of all models. ROC curves associated with model tuning, testing, and re-optimization together with the underlying features are presented in Figure 5. ROC curves show that re-optimization gave little improvement for the MEAN and the MSSK models as testing and re-optimization curves followed similar characteristics. On the other hand, machine learning models improved significantly in this process. The corresponding re-optimization ROC curves detached from the testing curves to position between tuning and testing curves.
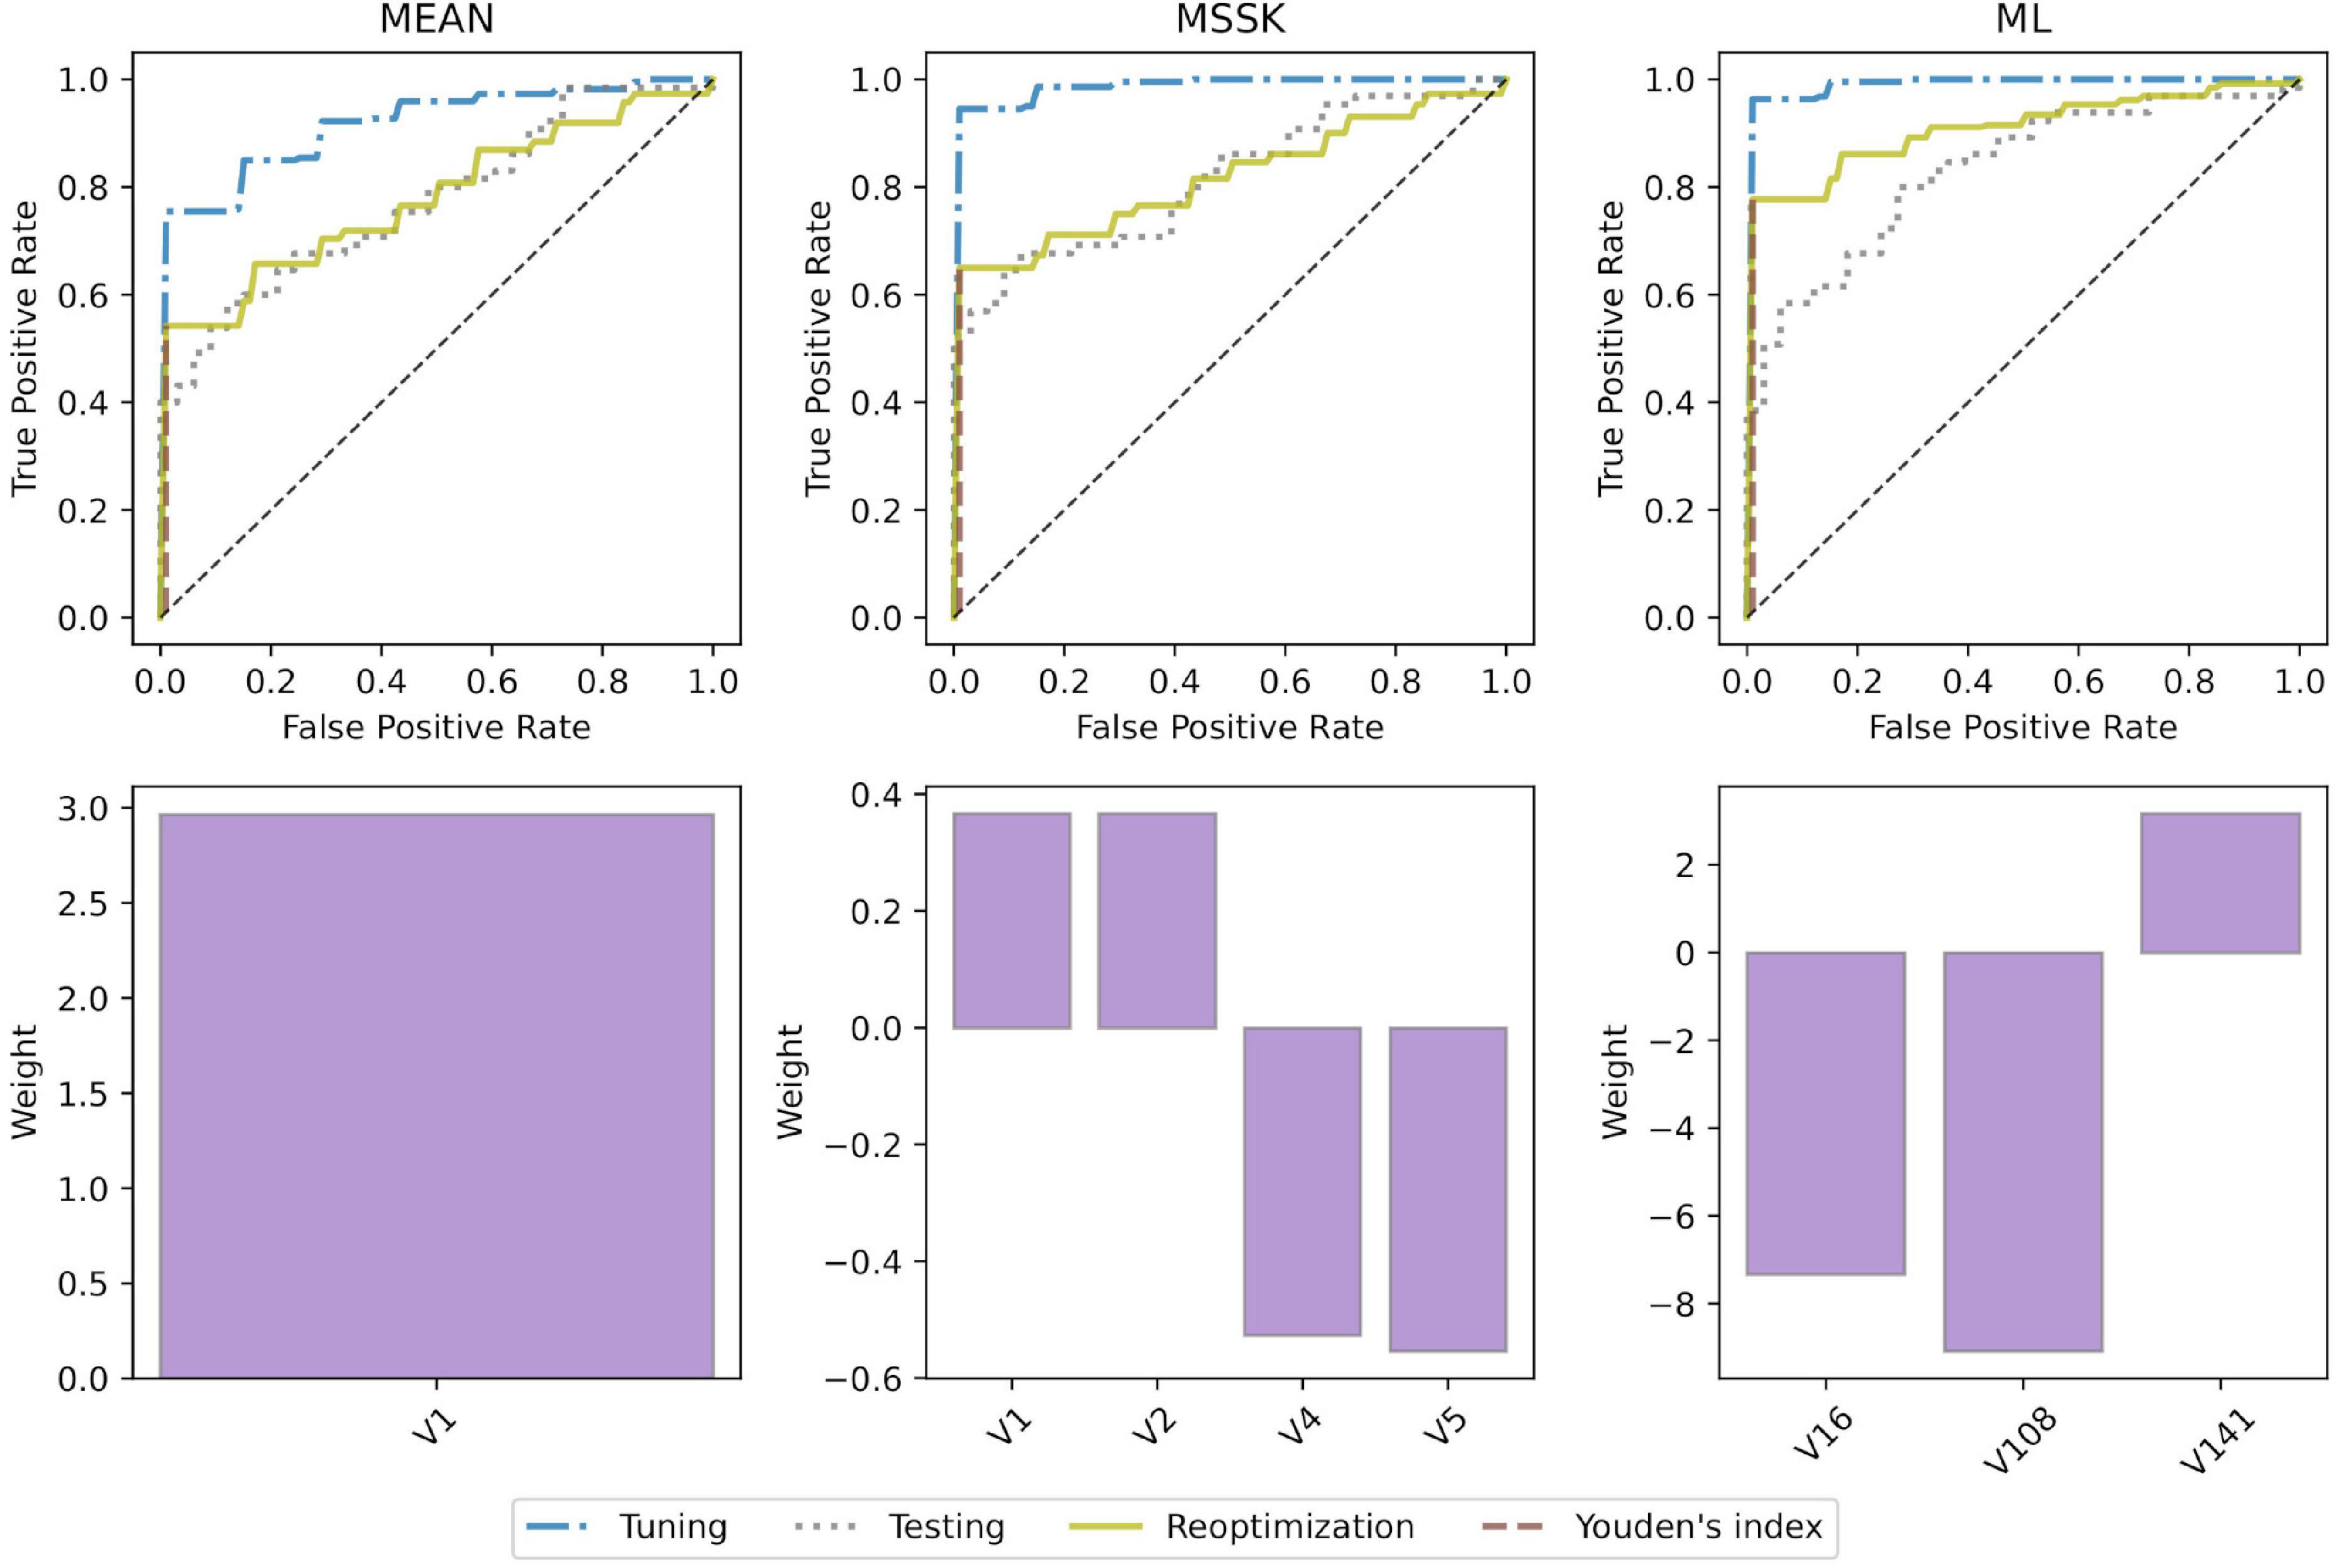
Figure 5. Model performance and underlying radiomic features. ROC curves and bar plots of the underlying features. V1 - mean (histogram), V2 - standard deviation (histogram), V4 - skewness (histogram), V5 - kurtosis (histogram), V16 - root mean square (histogram), V108 - gray level non-uniformity normalized (GLSZM), V141 - dependence count non-uniformity (NGLDM).
Substantial differences in distribution of radiomic features included in the models in terms of location and dispersion are presented in Figure 6. Most of the features exhibit patterns of the same direction in both mice and patient data sets, that is, either rising or falling trend from healthy to ILD.
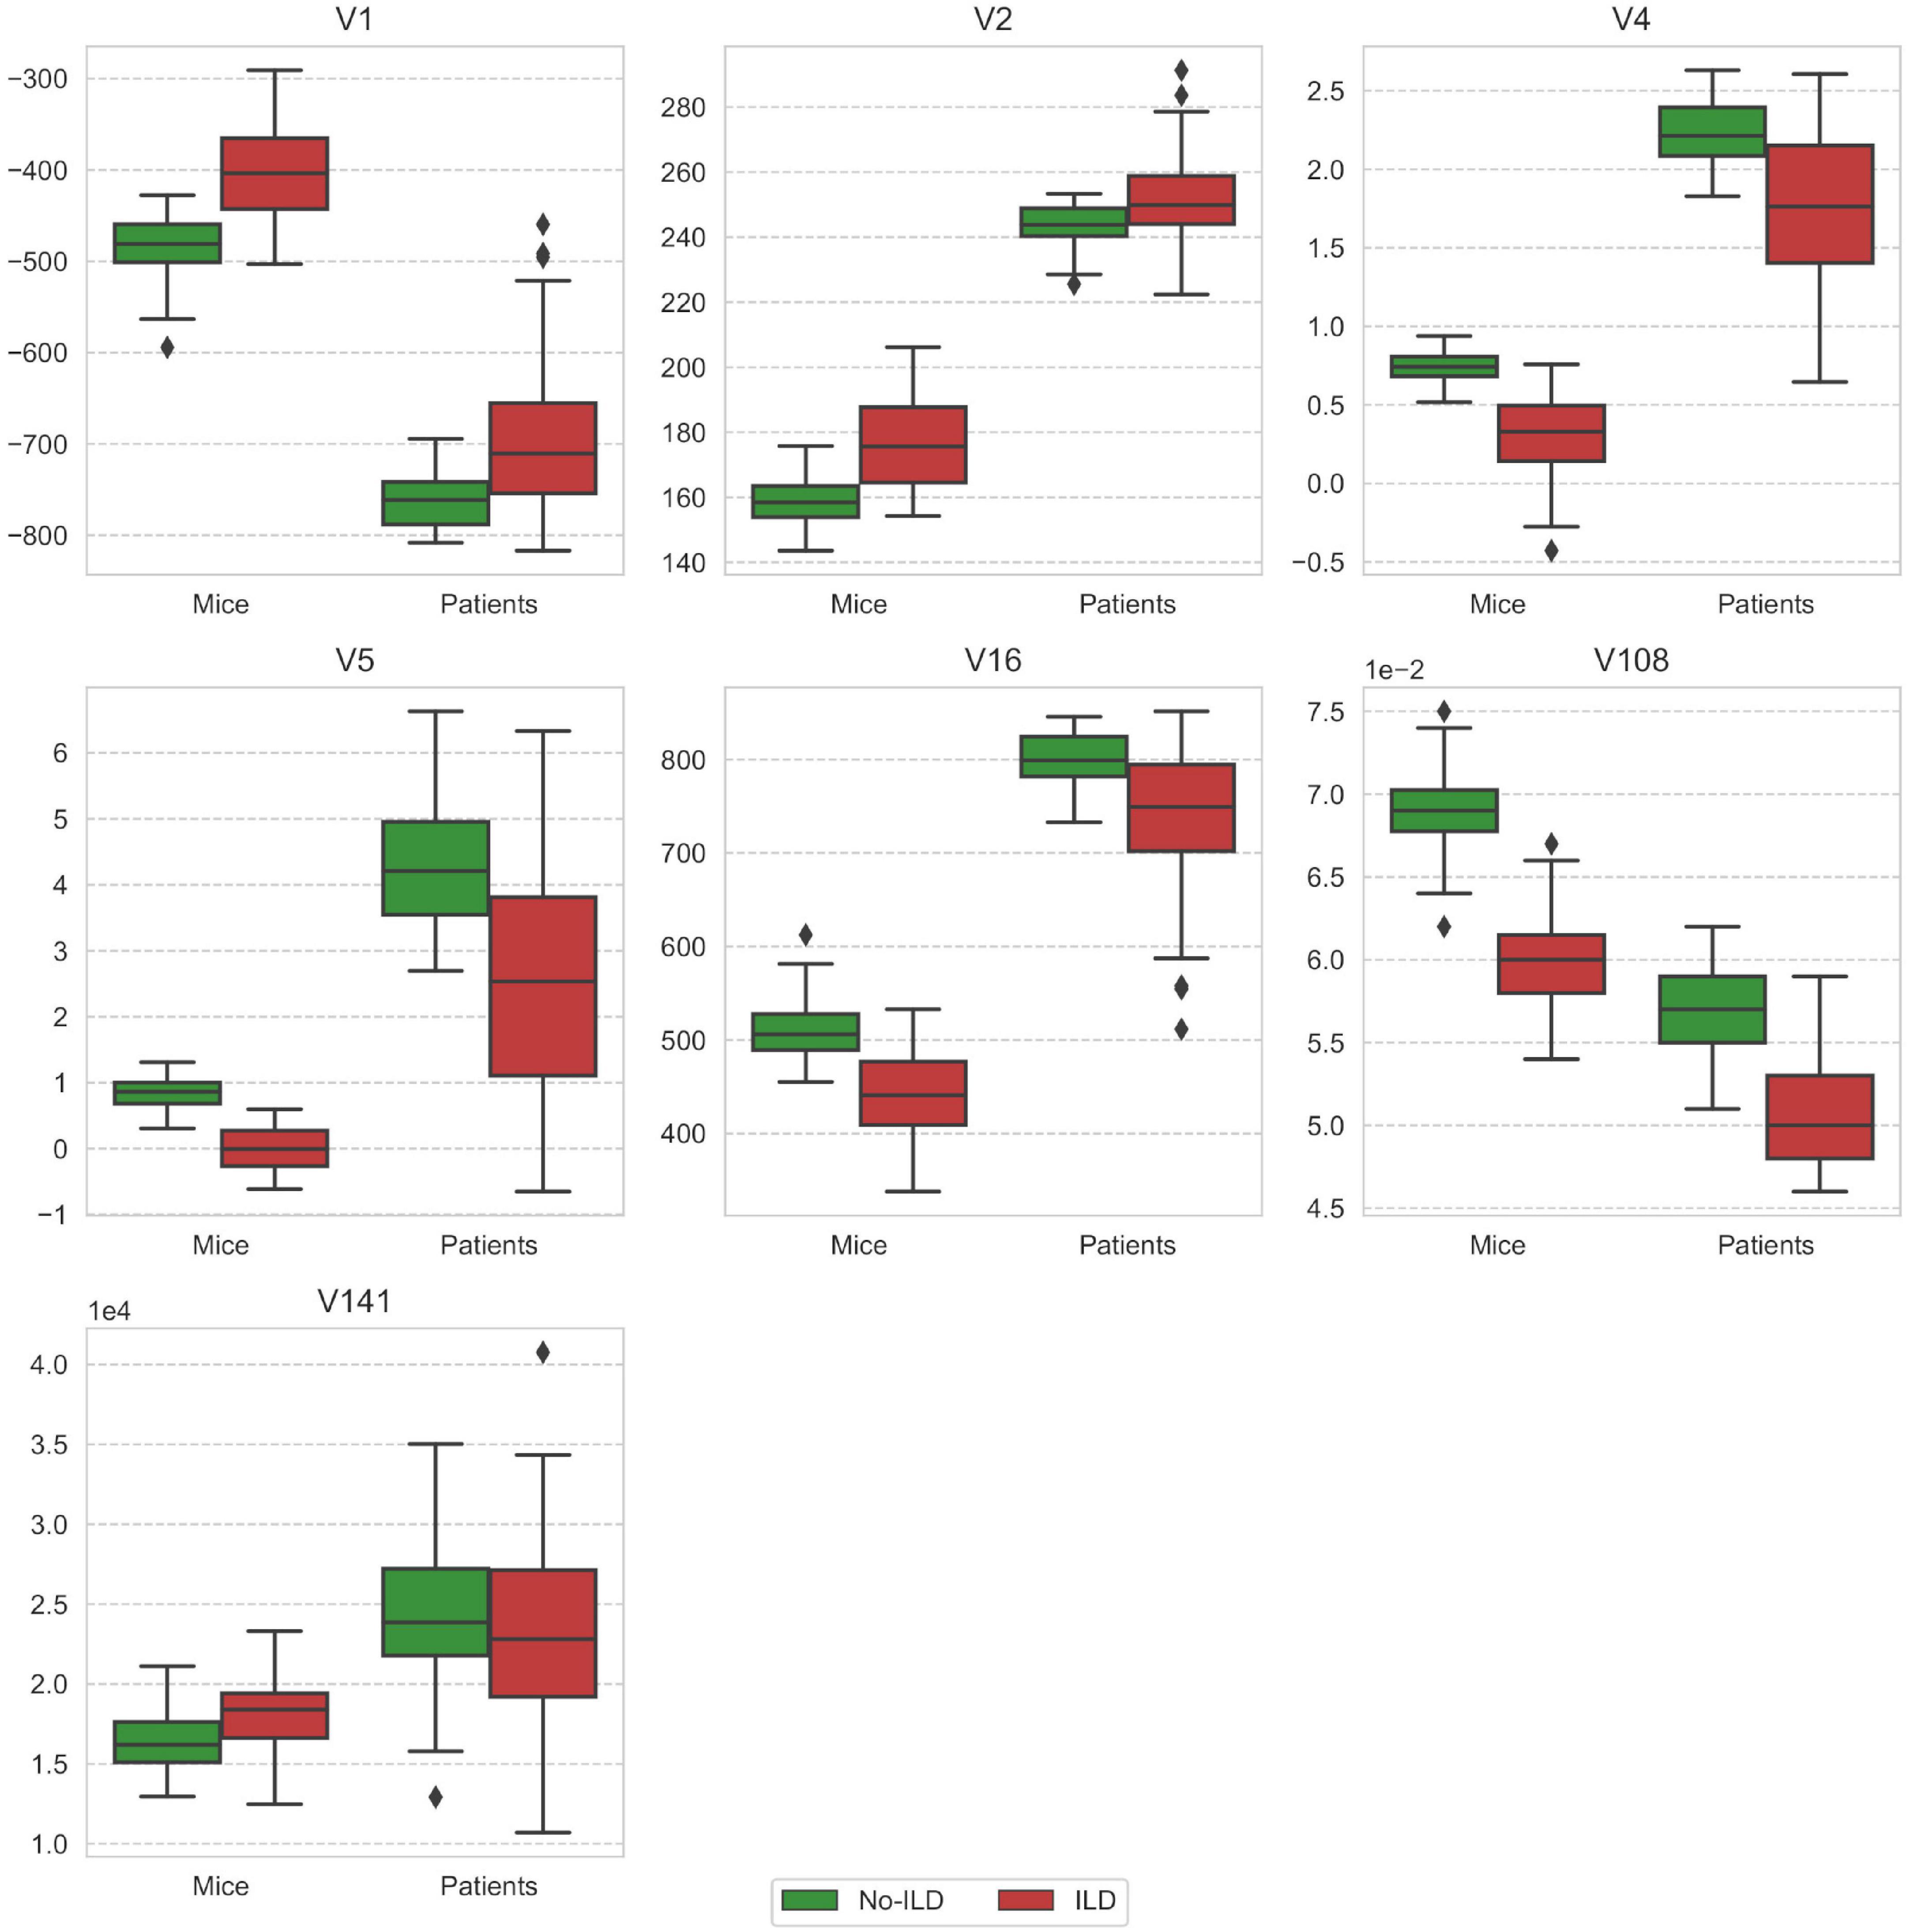
Figure 6. Comparison of feature distribution between mice and patient groups stratified by the ILD stage. V1 - mean (histogram), V2 - standard deviation (histogram), V4 - skewness (histogram), V5 - kurtosis (histogram), V16 - root mean square (histogram), V108 - gray level non-uniformity normalized (GLSZM), V141 - dependence count non-uniformity (NGLDM).
Discussion
In this analysis, we report that radiomic features and models can be translated from experimental to human ILD. Collectively, our data suggest that well characterized and representative animal models could represent valuable systems for defined hypothesis testing in radiomics research, particularly for evaluating links with pathophysiology or studying responses to targeted therapies in rare diseases with low number of patients and limited access to tissue samples.
Radiomic features proved to be highly indicative of experimental- and SSc-ILD. Furthermore, we observed strong linear correlation in terms of discriminative power between features extracted from mice microCT scans and patient HRCT. We also showed that multivariate models of ILD translated well from mice to patient data sets. Nevertheless, we observed the differences between the data sets in terms of feature classes that were predictive. In mice, most of the feature groups contained features that reached similar maximum AUC scores. On the other hand, in patients we observed that even though histogram-based features achieved high discriminative power, some texture features were more predictive. This difference could be caused by inferior quality of microCT compared to HRCT. For this reason, the assessment of microCT done by our radiologist might have also been mainly led by first order characteristics rather than texture. Furthermore, the ILD manifestations can differ depending on the etiology. As a result, the observed differences may be caused by the limitation of the bleomycin-induced ILD being an imperfect model of SSc-ILD. In any case, our results are in line with the available literature on human lung pathologies including chronic obstructive pulmonary disease, radiation-induced pneumonitis or connective tissue disease-related ILD, which showed that texture-based analysis of CT data can be superior compared to the visual or histogram-based measures for diagnosis (28, 31, 32).
Analysis of feature weights in the MEAN and the MSSK models showed that higher values of the mean and standard deviation of the image intensity and lower values of skewness and kurtosis correspond to larger risk of ILD. Effectively, this means that presence of ILD shifts the intensity distribution from a typical “healthy” positively skewed intensity distribution toward higher intensity values with a more symmetric distribution and thin tails. The best performing model (ML) relied on three radiomic features: the root mean square (histogram), gray level non-uniformity normalized (GLSZM), and dependence count non-uniformity (NGLDM). Significant improvement of machine learning models by re-optimization may suggest the existence of similar predictive radiomic patterns in training (mice) and test (patients) data sets in presence of domain shift between both groups.
The presented study has a few limitations. First, the differences in scanning parameters between microCT and HRCT cause a significant domain shift between experimental and patient data sets. Although, we were able to recover the predictive power of the analyzed multivariate models by re-optimization in the patient cohort, and by that confirm transferability of the underlying radiomic signatures, better calibration of the microCT scanner and selection of scanning parameters could potentially improve the transferability. Second, our study focused on CT-derived radiomics approaches, since HRCT scans are part of the routine work-up of ILD patients. Other imaging modalities such as nuclear imaging or MRI, although currently rarely performed in ILD (10), could be evaluated for radiomic analyses to assess whether they might provide additional or complementary information.
Conclusion
Radiomic signatures of experimental ILD derived from microCT scans translated as prognostic factors to HRCT of SSc-ILD. By this we showed that the well-established experimental model of BLM-induced ILD is a valuable system to test defined hypotheses in radiomics research for later validation in human cohorts.
Data availability statement
The raw data supporting the conclusions of this article will be made available by the authors, without undue reservation.
Ethics statement
The studies involving human participants were reviewed and approved by the local ethics committees (approval numbers: pre-BASEC-EK-839 (KEK-no.-2016-01515), KEK-ZH-no. 2010-158/5, BASEC-no. 2018-02165, and BASEC-no. 2018-01873). The patients/participants provided their written informed consent to participate in this study. This animal study was reviewed and approved by the cantonal authorities and performed in compliance with the Swiss law of animal protection (ZH235-2018).
Author contributions
HG, JG-S, MG, BM, and ST-L contributed to the conception and design of the study. HG, JG-S, MBr, CB, and TF contributed to the acquisition and analysis of the data. HG, JG-S, BM, and ST-L contributed to the interpretation of data. HG and MBo contributed to the creation of software used in the study. All authors have drafted the work or substantively revised it.
Funding
This work was supported by the Forschungskredit PostDoc from University of Zurich (FK-19-046 to JG-S) and Swiss National Fund (SNF 310030_170159 to HG).
Conflict of interest
The authors declare that the research was conducted in the absence of any commercial or financial relationships that could be construed as a potential conflict of interest.
Publisher’s note
All claims expressed in this article are solely those of the authors and do not necessarily represent those of their affiliated organizations, or those of the publisher, the editors and the reviewers. Any product that may be evaluated in this article, or claim that may be made by its manufacturer, is not guaranteed or endorsed by the publisher.
Supplementary material
The Supplementary Material for this article can be found online at: https://www.frontiersin.org/articles/10.3389/fmed.2022.988927/full#supplementary-material
References
1. Hutchinson JP, McKeever TM, Fogarty AW, Navaratnam V, Hubbard RB. Increasing global mortality from idiopathic pulmonary fibrosis in the twenty-first century. Ann Am Thorac Soc. (2014) 11:1176–85. doi: 10.1513/AnnalsATS.201404-145OC
2. Wallace B, Vummidi D, Khanna D. Management of connective tissue diseases associated interstitial lung disease: a review of the published literature. Curr Opin Rheumatol. (2016) 28:236–45.
3. John Gibson G, Loddenkemper R, Sibille Y, Lundbäck B. The European Lung White Book: Respiratory Health and Disease in Europe. Lausanne: European Respiratory Society (2013).
4. Carrington R, Jordan S, Pitchford SC, Page CP. Use of animal models in IPF research. Pulm Pharmacol Ther. (2018) 51:73–8.
5. Tashiro J, Rubio GA, Limper AH, Williams K, Elliot SJ, Ninou I, et al. Exploring animal models that resemble idiopathic pulmonary fibrosis. Front Med. (2017) 4:118. doi: 10.3389/fmed.2017.00118
6. Schniering J, Guo L, Brunner M, Schibli R, Ye S, Distler O, et al. Evaluation of Tc-rhAnnexin V-128 SPECT/CT as a diagnostic tool for early stages of interstitial lung disease associated with systemic sclerosis. Arthritis Res Ther. (2018) 20:183. doi: 10.1186/s13075-018-1681-1
7. Zhou Y, Chen H, Ambalavanan N, Liu G, Antony VB, Ding Q, et al. Noninvasive imaging of experimental lung fibrosis. Am J Respir Cell Mol Biol. (2015) 53:8–13.
8. Silver KC, Silver RM. Management of systemic-sclerosis-associated interstitial lung disease. Rheum Dis Clin North Am. (2015) 41:439–57.
9. Collins BF, Raghu G Idiopathic pulmonary fibrosis: How should a confident diagnosis be made? In: Thillai M, Moller DR, Meyer KC editors. Clinical Handbook of Interstitial Lung Disease. (Boca Raton, FL: CRC Press) (2017). p. 135–48.
10. Hansell DM, Goldin JG, King TE, Lynch DA, Richeldi L, Wells AU. CT staging and monitoring of fibrotic interstitial lung diseases in clinical practice and treatment trials: a position paper from the fleischner society. Lancet Respirat Med. (2015) 3:483–96. doi: 10.1016/S2213-2600(15)00096-X
11. Wells AU, Desai SR, Rubens MB, Goh NSL, Cramer D, Nicholson AG, et al. Idiopathic pulmonary fibrosis: a composite physiologic index derived from disease extent observed by computed tomography. Am J Respir Crit Care Med. (2003) 167:962–9. doi: 10.1164/rccm.2111053
12. Aichler M, Kunzke T, Buck A, Sun N, Ackermann M, Jonigk D, et al. Molecular similarities and differences from human pulmonary fibrosis and corresponding mouse model: MALDI imaging mass spectrometry in comparative medicine. Lab Invest. (2018) 98:141–9. doi: 10.1038/labinvest.2017.110
13. Schniering J, Benešová M, Brunner M, Haller S, Cohrs S, Frauenfelder T, et al. F-AzaFol for detection of folate receptor-β positive macrophages in experimental interstitial lung disease-a proof-of-concept study. Front Immunol. (2019) 10:2724. doi: 10.3389/fimmu.2019.02724
14. Schniering J, Benešová M, Brunner M, Haller S, Cohrs S, Frauenfelder T, et al. Visualisation of interstitial lung disease by molecular imaging of integrin αvβ3 and somatostatin receptor 2. Ann Rheum Dis. (2019) 78:218–27.
15. Schniering J, Gabrys H, Brunner M, Distler O, Guckenberger M, Bogowicz M, et al. Computed-tomography-based radiomics features for staging of interstitial lung disease – transferability from experimental to human lung fibrosis - a proof-of-concept studyImaging. Eur Respir Soc. (2019) 54:PA4806. doi: 10.1183/13993003.congress-2019.pa4806
16. Lambin P, Rios-Velazquez E, Leijenaar R, Carvalho S, van Stiphout RGPM, Granton P, et al. Radiomics: extracting more information from medical images using advanced feature analysis. Eur J Cancer. (2012) 48:441–6.
17. Lambin P, Leijenaar RTH, Deist TM, Peerlings J, de Jong EEC, van Timmeren J, et al. Radiomics: the bridge between medical imaging and personalized medicine. Nat Rev Clin Oncol. (2017) 14:749–62. doi: 10.1038/nrclinonc.2017.141
18. Aerts HJWL, Velazquez ER, Leijenaar RTH, Parmar C, Grossmann P, Carvalho S, et al. Decoding tumour phenotype by noninvasive imaging using a quantitative radiomics approach. Nat Commun. (2014) 5:4006.
19. Lu H, Arshad M, Thornton A, Avesani G, Cunnea P, Curry E, et al. A mathematical-descriptor of tumor-mesoscopic-structure from computed-tomography images annotates prognostic- and molecular-phenotypes of epithelial ovarian cancer. Nat Commun. (2019) 10:764. doi: 10.1038/s41467-019-08718-9
20. Wu W, Parmar C, Grossmann P, Quackenbush J, Lambin P, Bussink J, et al. Exploratory study to identify radiomics classifiers for lung cancer histology. Front Oncol. (2016) 6:71. doi: 10.3389/fonc.2016.00071
21. Grossmann P, Stringfield O, El-Hachem N, Bui MM, Rios Velazquez E, Parmar C, et al. Defining the biological basis of radiomic phenotypes in lung cancer. Elife. (2017) 6:e23421. doi: 10.7554/eLife.23421
22. Parmar C, Leijenaar RTH, Grossmann P, Rios Velazquez E, Bussink J, Rietveld D, et al. Radiomic feature clusters and prognostic signatures specific for lung and head & neck cancer. Sci Rep. (2015) 5:11044. doi: 10.1038/srep11044
23. Leijenaar RT, Bogowicz M, Jochems A, Hoebers FJ, Wesseling FW, Huang SH, et al. Development and validation of a radiomic signature to predict HPV (p16) status from standard CT imaging: a multicenter study. Br J Radiol. (2018) 91:20170498. doi: 10.1259/bjr.20170498
24. Aerts HJWL, Grossmann P, Tan Y, Oxnard GR, Rizvi N, Schwartz LH, et al. Defining a Radiomic response phenotype: a pilot study using targeted therapy in NSCLC. Sci Rep. (2016) 6:33860.
25. Schniering J, Maciukiewicz M, Gabrys HS, Brunner M, Blüthgen C, Meier C, et al. Computed tomography-based radiomics decodes prognostic and molecular differences in interstitial lung disease related to systemic sclerosis. Eur Respir J. (2021) 59:2004503. doi: 10.1183/13993003.04503-2020
26. Walsh SLF, Calandriello L, Silva M, Sverzellati N. Deep learning for classifying fibrotic lung disease on high-resolution computed tomography: a case-cohort study. Lancet Respir Med. (2018) 6:837–45. doi: 10.1016/S2213-2600(18)30286-8
27. Humphries SM, Yagihashi K, Huckleberry J, Rho B-H, Schroeder JD, Strand M, et al. Idiopathic pulmonary fibrosis: data-driven textural analysis of extent of fibrosis at baseline and 15-month follow-up. Radiology. (2017) 285:270–8. doi: 10.1148/radiol.2017161177
28. Kloth C, Blum AC, Thaiss WM, Preibsch H, Ditt H, Grimmer R, et al. Differences in texture analysis parameters between active alveolitis and lung fibrosis in chest CT of patients with systemic sclerosis: a feasibility study. Acad Radiol. (2017) 24:1596–603. doi: 10.1016/j.acra.2017.07.002
29. Kloth C, Henes J, Xenitidis T, Thaiss WM, Blum AC, Fritz J, et al. Chest CT texture analysis for response assessment in systemic sclerosis. Eur J Radiol. (2018) 101:50–8. doi: 10.1016/j.ejrad.2018.01.024
30. Lee SM, Seo JB, Oh SY, Kim TH, Song JW, Lee SM, et al. Prediction of survival by texture-based automated quantitative assessment of regional disease patterns on CT in idiopathic pulmonary fibrosis. Eur Radiol. (2018) 28:1293–300.
31. Sorensen L, Nielsen M, Lo P, Ashraf H, Pedersen JH, de Bruijne M. Texture-based analysis of COPD: a data-driven approach. IEEE Trans Med Imaging. (2012) 31:70–8. doi: 10.1109/TMI.2011.2164931
32. Cunliffe AR, Armato SG III, Straus C, Malik R, Al-Hallaq HA. Lung texture in serial thoracic CT scans: correlation with radiologist-defined severity of acute changes following radiation therapy. Phys Med Biol. (2014) 59:5387–98. doi: 10.1088/0031-9155/59/18/5387
33. Eresen A, Yang J, Shangguan J, Li Y, Hu S, Sun C, et al. MRI radiomics for early prediction of response to vaccine therapy in a transgenic mouse model of pancreatic ductal adenocarcinoma. J Transl Med. (2020) 18:61.
34. Eresen A, Yang J, Shangguan J, Benson AB, Yaghmai V, Zhang Z. Detection of immunotherapeutic response in a transgenic mouse model of pancreatic ductal adenocarcinoma using multiparametric MRI radiomics: a preliminary investigation. Acad Radiol. (2021) 28:e147–54. doi: 10.1016/j.acra.2020.04.026
35. Núñez LM, Romero E, Julià-Sapé M, Ledesma-Carbayo MJ, Santos A, Arús C, et al. Unraveling response to temozolomide in preclinical GL261 glioblastoma with MRI/MRSI using radiomics and signal source extraction. Sci Rep. (2020) 10:19699.
36. Becker AS, Schneider MA, Wurnig MC, Wagner M, Clavien PA, Boss A. Radiomics of liver MRI predict metastases in mice. Eur Radiol Exp. (2018) 2:11. doi: 10.1186/s41747-018-0044-7
37. Ni M, Wang L, Yu H, Wen X, Yang Y, Liu G, et al. Radiomics approaches for predicting liver fibrosis with nonenhanced T1 -weighted imaging: comparison of different radiomics models. J Magn Reson Imaging. (2021) 53:1080–9.
38. Schniering J, Borgna F, Siwowska K, Benešová M, Cohrs S, Hasler R, et al. In vivo labeling of plasma proteins for imaging of enhanced vascular permeability in the lungs. Mol Pharm. (2018) 15:4995–5004.
39. Minier T, Guiducci S, Bellando-Randone S, Bruni C, Lepri G, Czirják L, et al. EUSTAR co-workers, Preliminary analysis of the very early diagnosis of systemic sclerosis (VEDOSS) EUSTAR multicentre study: evidence for puffy fingers as a pivotal sign for suspicion of systemic sclerosis. Ann Rheum Dis. (2014) 73:2087–93.
40. van den Hoogen F, Khanna D, Fransen J, Johnson SR, Baron M, Tyndall A, et al. 2013 classification criteria for systemic sclerosis: an American college of rheumatology/European league against rheumatism collaborative initiative. Arthritis Rheum. (2013) 65:2737–47.
41. Zwanenburg A, Leger S, Vallières M, Löck S. Image biomarker standardisation initiative. arXiv [Preprint] (2016). arXiv:1612.07003 [cs.CV].
42. Shrout PE, Fleiss JL. Intraclass correlations: uses in assessing rater reliability. Psychol Bull. (1979) 86:420–8.
44. Van Der Walt S, Colbert SC, Varoquaux G The NumPy array: A structure for efficient numerical computation. Comput Sci Eng. (2011) 13:22–30.
45. McKinney W Data structures for statistical computing in python. In: Proceedings of the 9th Python in Science Conference. Austin, TX (2010). p. 51–6.
Keywords: radiomics, preclinical imaging, interstitial lung disease, lung fibrosis, systemic sclerosis, bleomycin
Citation: Gabryś HS, Gote-Schniering J, Brunner M, Bogowicz M, Blüthgen C, Frauenfelder T, Guckenberger M, Maurer B and Tanadini-Lang S (2022) Transferability of radiomic signatures from experimental to human interstitial lung disease. Front. Med. 9:988927. doi: 10.3389/fmed.2022.988927
Received: 07 July 2022; Accepted: 31 October 2022;
Published: 17 November 2022.
Edited by:
Victoria Bunik, Lomonosov Moscow State University, RussiaReviewed by:
Mark O. Wielpütz, Heidelberg University, GermanyAlexander Pfeil, University Hospital Jena, Germany
Copyright © 2022 Gabryś, Gote-Schniering, Brunner, Bogowicz, Blüthgen, Frauenfelder, Guckenberger, Maurer and Tanadini-Lang. This is an open-access article distributed under the terms of the Creative Commons Attribution License (CC BY). The use, distribution or reproduction in other forums is permitted, provided the original author(s) and the copyright owner(s) are credited and that the original publication in this journal is cited, in accordance with accepted academic practice. No use, distribution or reproduction is permitted which does not comply with these terms.
*Correspondence: Hubert S. Gabryś, hubert.gabrys@usz.ch; Stephanie Tanadini-Lang, stephanie.tanadini-lang@usz.ch