Big Data, Data Science, and Causal Inference: A Primer for Clinicians
 Yoshihiko Raita
 Carlos A. Camargo Jr.1,2,3
  Liming Liang
 Kohei Hasegawa
- 1Department of Emergency Medicine, Harvard Medical School, Massachusetts General Hospital, Boston, MA, United States
- 2Division of Rheumatology, Allergy, and Immunology, Department of Medicine, Harvard Medical School, Massachusetts General Hospital, Boston, MA, United States
- 3Department of Epidemiology, Harvard T.H. Chan School of Public Health, Boston, MA, United States
- 4Department of Biostatistics, Harvard T.H. Chan School of Public Health, Boston, MA, United States
Clinicians handle a growing amount of clinical, biometric, and biomarker data. In this “big data” era, there is an emerging faith that the answer to all clinical and scientific questions reside in “big data” and that data will transform medicine into precision medicine. However, data by themselves are useless. It is the algorithms encoding causal reasoning and domain (e.g., clinical and biological) knowledge that prove transformative. The recent introduction of (health) data science presents an opportunity to re-think this data-centric view. For example, while precision medicine seeks to provide the right prevention and treatment strategy to the right patients at the right time, its realization cannot be achieved by algorithms that operate exclusively in data-driven prediction modes, as do most machine learning algorithms. Better understanding of data science and its tasks is vital to interpret findings and translate new discoveries into clinical practice. In this review, we first discuss the principles and major tasks of data science by organizing it into three defining tasks: (1) association and prediction, (2) intervention, and (3) counterfactual causal inference. Second, we review commonly-used data science tools with examples in the medical literature. Lastly, we outline current challenges and future directions in the fields of medicine, elaborating on how data science can enhance clinical effectiveness and inform medical practice. As machine learning algorithms become ubiquitous tools to handle quantitatively “big data,” their integration with causal reasoning and domain knowledge is instrumental to qualitatively transform medicine, which will, in turn, improve health outcomes of patients.
Introduction
Can “Big Data” Transform Medicine?
By now, it is increasingly recognized that “big data will transform medicine into precision medicine.” However, data by themselves are useless (1). Data alone are insufficient to achieve precision medicine, let alone to address its defining cause-and-effect questions—i.e., identifying the optimal prevention or treatment strategy, the subgroup of patients who would benefit, and when they would benefit most (2). To become useful, data should be queried, analyzed, and acted upon. It is causal reasoning, knowledge, and algorithms—not data—that prove transformative.
Modern Statistics and Causal Inference in the Past Century
In the recent history of science, statistics have occupied a privileged position in learning from data and epistemically justifying inductive reasoning (3). However, in the 1920s, the founders of modern statistical science—such as Ronald A. Fisher—declared that statistics could study causes and effects (i.e., causal inference) by using data from randomized experiments, but not from observational studies (4). Nevertheless, clinicians and researchers continued to leverage observational data in order to tackle complex causal questions—e.g., the effect of prenatal factors on bronchiolitis (5), lifestyle factors on asthma (6), and environmental exposures on lung function (7)—particularly when randomized experiments were unethical or otherwise infeasible. Despite these efforts, until recently, mainstream statistics has provided clinicians and researchers with few approaches to explicitly articulate, let alone to answer, causal questions (1, 8). Consequently, every student has learnt that “correlation is not causation” (with good intention) and causal vocabulary in observational research has been virtually prohibited in some major journals (9, 10). These have classified an entire category of questions (i.e., cause-and-effect questions) in the medical science as not amenable to formal quantitative inference.
Data Science in the Twenty-First Century
In the current “big data” era, there exists a rapidly-increasing volume, variety, and velocity of health information [e.g., clinical, electronic health record, and biometric (from wearable devices) data]. In parallel, the recent emergence of “data scientists”—most of whom are not formally-trained in traditional statistical science—has brought a neutral mindset that does not a priori preclude them from answering causal questions in observational studies (11). These scientists coined a term, “data science” or “health data science” as a component of medicine (see Glossary in Table 1), to refer to their realm, which is widely embraced by both of the industry and academia (11). The availability of “big data” and the influx of data scientists—alongside of the advent in epidemiological and statistical methods—present opportunities to unleash the wealth of “big data” to address the fundamental causal questions in precision medicine.
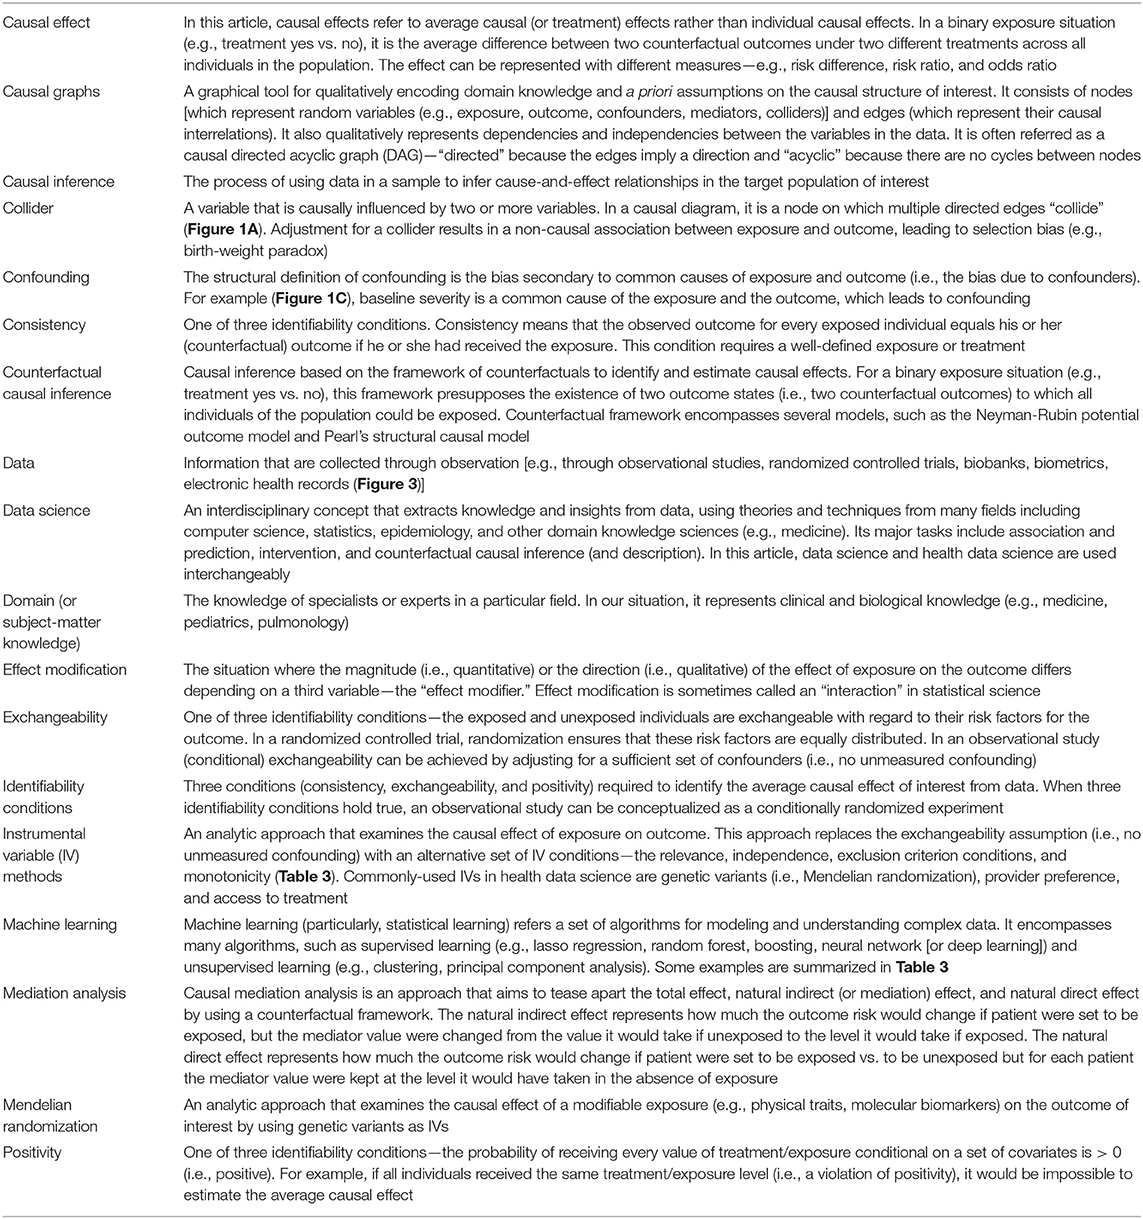
Table 1. Glossary.
Goals of the Primer
In this primer, we (1) discuss the principles of data science and its major tasks based on the “ladder of causation” classification, (2) introduce the commonly-used data science tools, with a focus on causal inference, and (3) outline current challenges and future directions in the field of medicine. We also elaborate on how data science can pave the way toward the development of precision medicine, with common medical conditions as examples.
Goals of Data Science and the Ladder of Causation
It is key to understand what data science is (and is not). Although data science is often characterized by its tools (e.g., machine learning), scientific disciplines are primarily defined by their questions and tasks. For example, we define astrophysics as the discipline that studies the behavior and physical properties of the universe, not as the discipline that uses telescopes. Accordingly, we organize questions and tasks of data science into three defining classes, according to the “ladder of causation” proposed by a computer scientist, Judea Pear: (1, 8) (1) association and prediction, (2) intervention, and (3) counterfactual causal inference. Table 2 summarizes the 3-level classification, together with corresponding scientific questions, assumptions, and tools. A similar classification scheme has also been developed in the field of epidemiology (11).
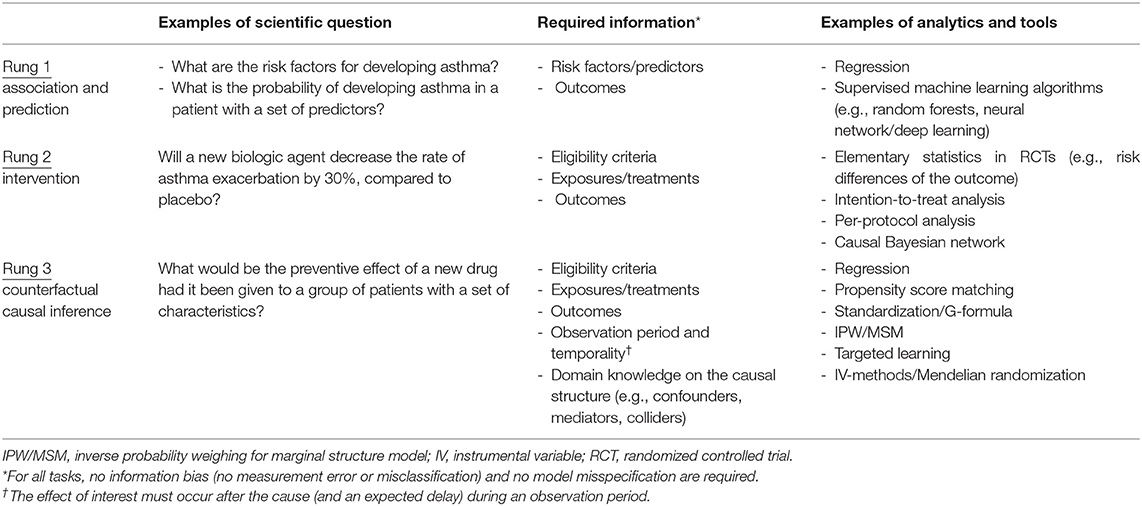
Table 2. Scientific questions, required information, and analytical methods of data science according to the ladder of causation.
Association and Prediction
The first task of data science is data-driven—association and prediction, which constitutes the first rung of the causal ladder. Association invokes exclusively probabilistic relationships between the variables within observed data. For example, in a cohort study, we say that recurrent wheezing in early childhood is associated with the development of asthma, when the probability of observing one variable depends on that of the other (or vice versa).
Prediction maps the derived probabilistic association to future data in order to forecast the conditional probability of outcome. It encompasses both relatively simple tasks [e.g., developing clinical risk scores, such as the Asthma Predictive Index (12)] and more complex ones [e.g., a polygenic risk score using millions of genetic markers to predict which patients are at higher risk of asthma (13)]. Analytical tools range from basic computations (e.g., correlation coefficients in multivariable regression models), to Bayesian networks, to supervised machine learning algorithms [e.g., random forests, neural network (or deep learning)] (Tables 2, 3).
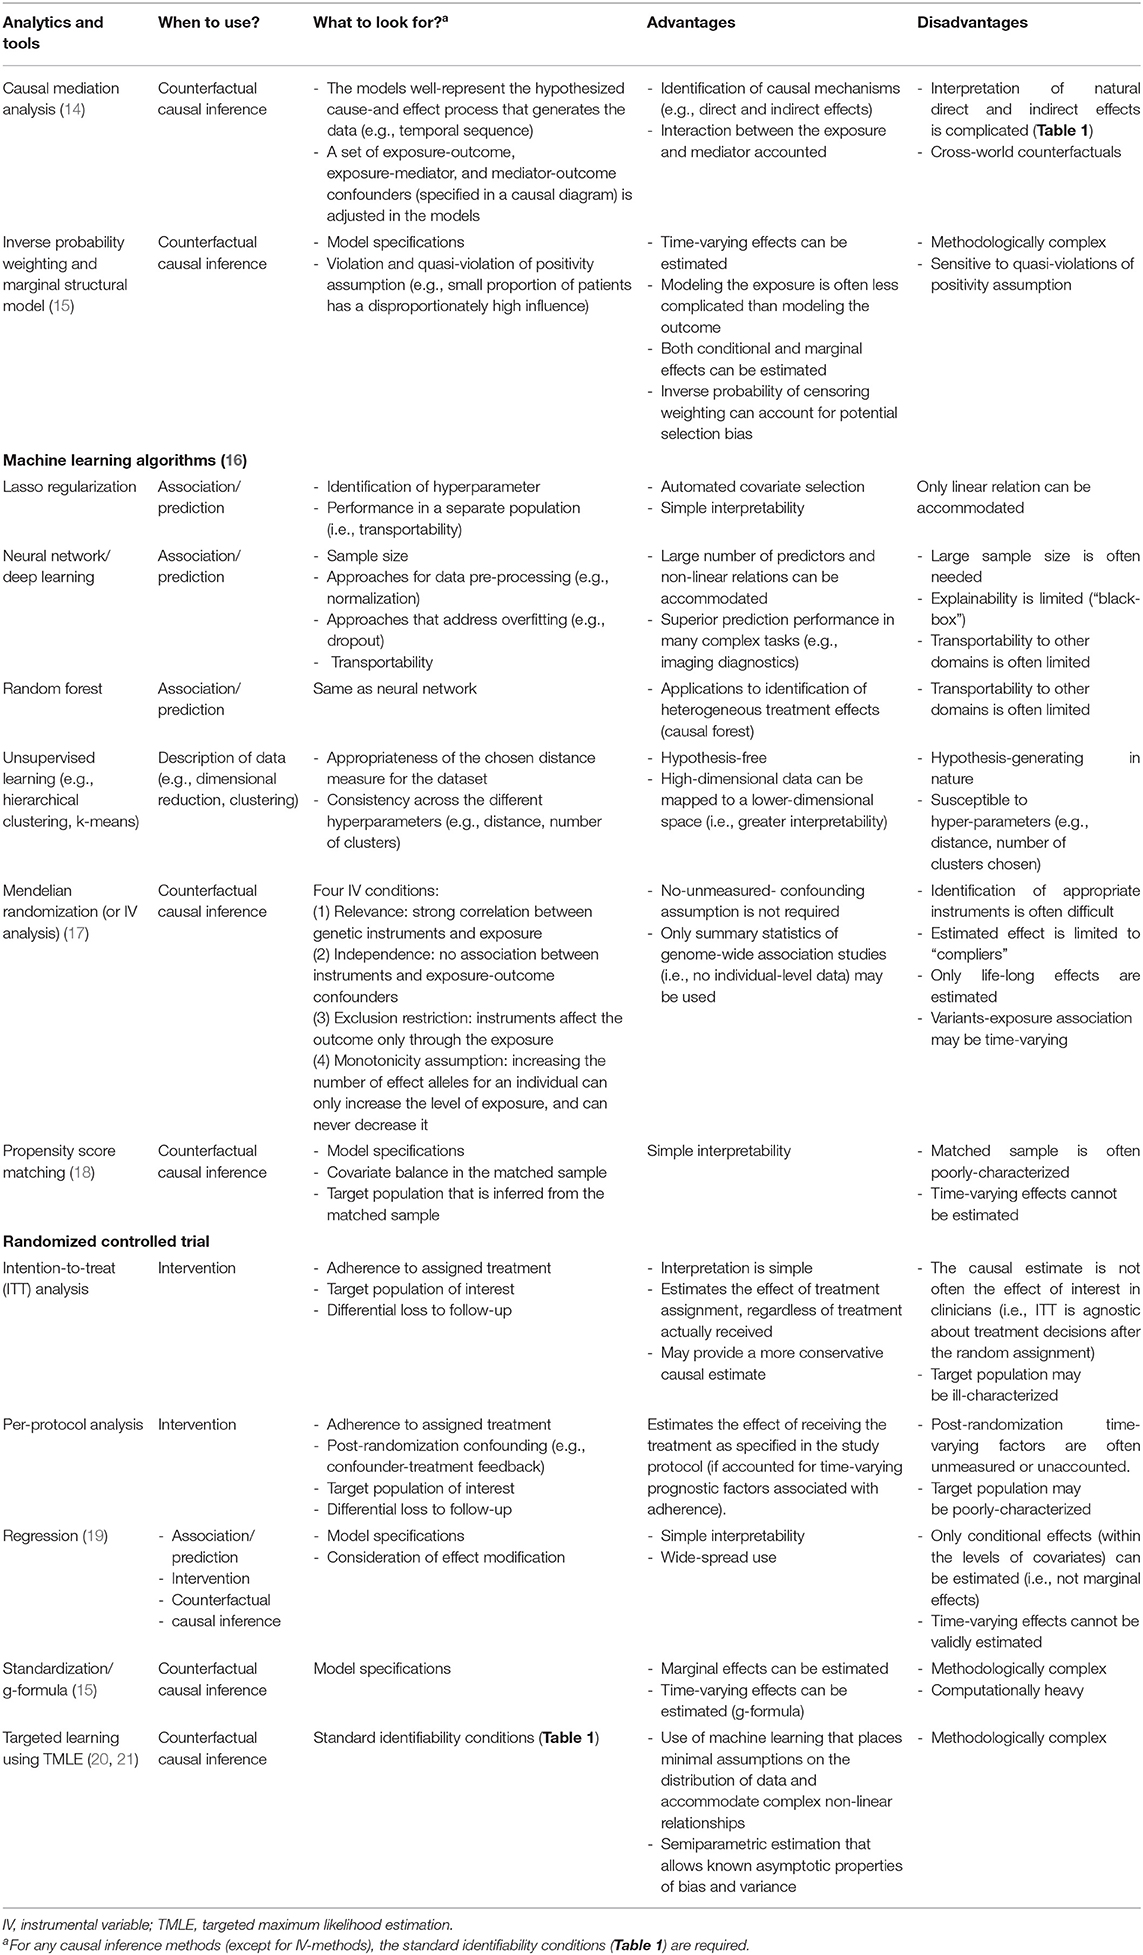
Table 3. Major analytical tools used in data science.
Machine learning algorithms excel in the association and prediction tasks. For example, this is what Alpha Go (a computer program that plays the board game Go) does when its deep learning algorithms learn the existent and simulated data of millions of Go games to determine which move is associated with the highest probability of winning (22). However, these algorithms have ongoing challenges, such as explainability (or “black-box” algorithms) (23), transportability (to different questions, populations, and settings), and particularly the lack of causal reasoning. Accordingly, association and prediction, along with the tools employed, are placed at the first rung of the progressively more sophisticated rungs of the ladder (1, 8).
Intervention
The second task of data science is intervention. It constitutes the second rung of the causal ladder because it involves not only observing the data but also changing what we observe, according to our causal belief (or causal hypothesis). For example, suppose we are interested in a causal hypothesis that treatment with a biologic agent would decrease the frequency of severe asthma exacerbation. A very direct way to estimate the effect of treatment is to perform an experiment under carefully-controlled conditions, such as randomized controlled trials (RCTs). Under a set of major assumptions specific to interventions—e.g., perfect adherence to assigned intervention, no selection bias due to a differential loss to follow-up, and no post-randomization confounding [i.e., sequential exchangeability (24) (Table 1)], an RCT would yield a consistent estimate for the causal effect of interest. Besides, the stable unit treatment values assumption (SUTVA)—(1) no interference and (2) no multiple versions of treatment—is also vital for consistently estimating the causal effect of interest. For example, in a simple RCT to investigate a vaccine efficacy, SUTVA would be violated due to herd immunity (a spillover effect). Tools used for intervention tasks range from basic computations (e.g., risk differences by an intention-to-treat analysis) to more-complex analytical methods [e.g., causal Bayesian networks (25)] (Table 2).
Ideal RCTs that meet the assumptions above have been considered the “gold standard” for establishing causal inference (26). Why not conclude this review article here? Unlike A/B tests performed by information technology companies, RCTs in clinical research are often impossible to conduct for a number of logistical, practical, and ethical reasons (e.g., examining the causal effect of prenatal smoking exposures on health outcomes of the offspring). Most importantly, in precision medicine, we seek to make inferences from the existent data of a set of patients who are similar—in as many characteristics as possible—to the patients of interest. However, any interventional experiment cannot tackle “what if?” or retrospective questions (e.g., “what if this patient had received treatment X at time t?”) using the existent data that cohorts and consortiums possess. No experiment can remove medications from already treated individuals and measure their outcomes. For that reason, we must deploy a new set of tools to tackle these important questions.
Counterfactual Causal Inference
The third task of data science—the final rung of the ladder—is counterfactual causal inference (Table 1). In the long history of human efforts to understand the meaning of “causality,” stretching back to the time of Aristotle (27), the origin of counterfactuals—a mode of causal reasoning—goes back to the philosopher David Hume in the 1700s. Hume defined causality to be: “if the first object had not been, the second never had existed” in his An Enquiry Concerning Human Understanding (28). By the beginning of the twenty-first century, a unified framework of quantitative causal inference (i.e., counterfactual outcome framework) was developed (15, 25, 29).
Counterfactuals are how humans naturally reason causal effects. We instinctively apply a possible-world semantics, and compare two outcomes: (1) the outcome—say, anaphylaxis (yes/no)—that would have been observed with a hypothetical treatment/exposure—say, new drug (yes/no)—vs. (2) the outcome that would have been observed without one. These two outcomes are referred to as counterfactual (or potential) outcomes because they represent world(s) that may not exist—i.e., counter-to-the-fact worlds (15). Then, the counterfactual definition of individual causal effect is the following: the treatment/exposure has a causal effect on the outcome if these counterfactual outcomes differ for the individual. Note that only one of these outcomes is observed for each individual (the outcome that corresponds to the treatment/exposure actually occurred in the individual), while the other outcomes cannot be observed. Because of the missingness, individual causal effects—as a general rule—cannot be identified. Instead, an aggregated causal effect—the average causal effect in a population—is used (Table 1) (15). Its definition is the following: a contrast of the proportions of outcome (e.g., anaphylaxis) that would have been observed (1) if all individuals had been treated/exposed (e.g., new drug) vs. (2) if all individuals had not been treated/exposed in the population of interest.
The counterfactual causal inference framework enables us to formulate causal questions, encode them in algorithms, and to identify average causal effects from data—even data from observational studies—under the identifiability conditions (Table 1). Its tools range from a relatively-simple ones (e.g., multivariable regression models adjusting for confounders) to more-advanced methodologies [e.g., inverse-probability weighting for time-varying treatments (15), targeted learning leveraging machine learning algorithms (20, 21); Tables 2, 3].
The primary difference between the first task (association and prediction) and third task (counterfactual causal inference) of data science is the role of domain knowledge, which in our situation is clinical and biological knowledge. Note that the former task invokes only the probabilities between the variables within data, the latter task cannot be completely defined by the probabilities in the factual world. Causal inference calls for domain knowledge not only to define counterfactual causal effects but to specify the causal structure of interest—e.g., the relationship between the treatment, outcome, confounders, mediators, and colliders (15) (Table 1).
For example, consider the effect of maternal smoking on infant mortality. Data-driven algorithms—which do not encode domain knowledge on the causal structure—will learn from data and fit a curve (very well) by using variables that are strongly associated with maternal smoking and mortality (e.g., infant's birth-weight). However, this automated adjustment for (or stratification by) birth-weight—a potential collider (Figure 1A)—results in a spurious correlation. Specifically, among infants with a low birth-weight, the adjusted risk of mortality is lower for those born to smokers [“the birth-weight paradox” (30)]. Alternatively, it is also possible that birth-weight serves as a mediator in the causal path. Adjustment for birth-weight could inappropriately block the causal path, thereby leading to biased inference. Causal effects cannot be quantified by systems that operate exclusively in data-driven association modes, as do most machine learning algorithms today (1). That is, we cannot answer causal questions with the data alone, no matter how big the data are and how deep the neural network is.
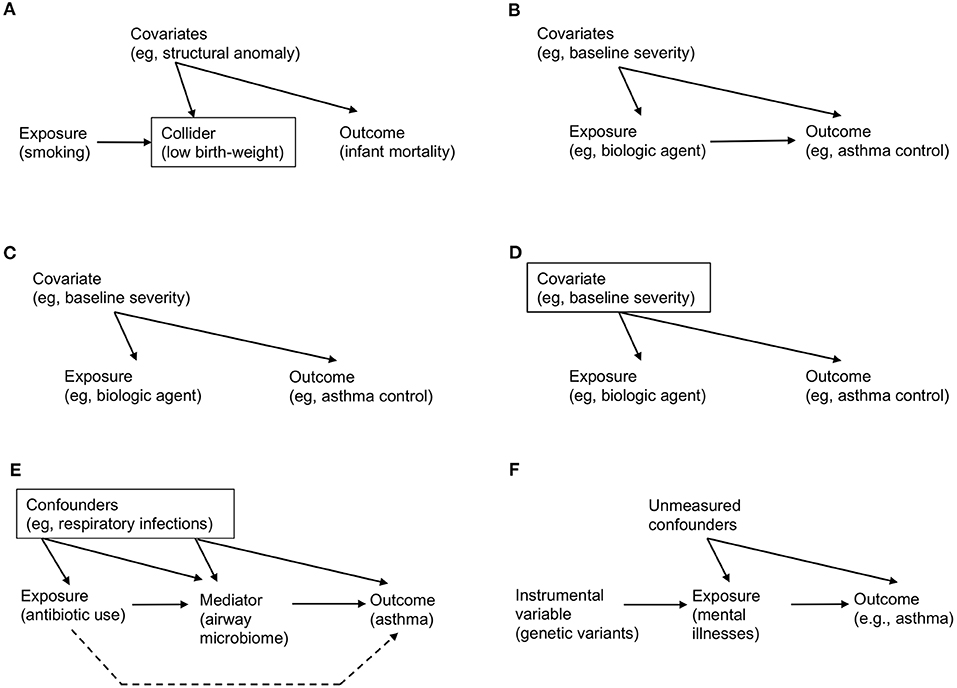
Figure 1. Examples of causal directed acyclic graph that encodes a priori domain knowledge and causal structural hypothesis. (A) Birth-weight paradox. There is no direct arrow from maternal smoking (exposure) to infant mortality (outcome), representing no causal effect. However, association/prediction-mode machine learning algorithm would automatically adjust for variables that are associated both with smoking and mortality (e.g., low birth-weight). Graphically, a rectangle placed around the low-birth weight variable represents adjustment. However, this adjustment for the collider (a node on which two directed arrows “collide”; Table 1) opens the flow of association from exposure → collider → covariates (e.g., structural anomaly) → outcome, which leads to a spurious (non-causal) association. (B) Simple example of causal diagram, consisting of exposure (biologic agent), outcome (asthma control), and covariates (e.g., baseline severity of illness). The presence of edge from a variable to another represents our knowledge on the presence of a direct effect. (C) Example of confounding. While there is no causal effect (i.e., no direct arrow from exposure to outcome), there is an association between these variables through the paths involving a common-cause covariate (i.e., a confounder), leading to a non-causal association between the exposure and outcome (i.e., confounding; Table 1). (D) Example of de-confounding. This confounding can be addressed by adjusting for the confounder by blocking the back-door path. Graphically, a rectangle placed around the confounder blocks the association flow through the back-door path. (E) Example of mediation. The causal relation between the exposure (systemic antibiotic use), mediator (airway microbiome), and outcome (asthma development). The confounders (e.g., acute respiratory infections) between the exposure, mediator, and outcome should be adjusted. The indirect (or mediation) effect is represented by the path which passes through the mediator. The direct effect is represented by the path which does not pass (the broken line; Table 1). (F) Example of mendelian randomization. Genetic variants that are strongly associated with the exposure of interest (mental illnesses) function as the instrument variable. Note that there is no association (or path) between the genetic variants and unmeasured confounders (i.e., independent condition) and that the genetic variants affect the outcome only through their effect on the exposure (i.e., exclusion restriction condition; Table 3).
Major Causal Inference Tools
Building on the counterfactual framework, epidemiologists, statisticians, and data scientists have developed methods to quantify causal effects from observational data. Table 3 summarizes the major tools, their assumptions (i.e., what to look for), advantages, and disadvantages. These tools enable us to explicitly express causal questions, transparently encode our causal knowledge, and leverage data to consistently estimate the causal effect of interest. Here, we introduce several relevant examples in simplified scenarios.
Causal Diagram: Codifying Causal Assumptions and De-confounding
Causal diagram is an intuitive graphical tool for qualitatively encoding our domain knowledge and a priori assumptions on the causal structure of interest (Tables 1, 3) (15). In other words, it qualitatively models how the cause-effect forces operate and generate data. Stemming from the graph theory developed by the 1700s mathematician Leonhard Euler, its modern tools for causal inference originate from the disciplines of computer science and artificial intelligence.
Consider the following hypothesized causal structure of treatment (a biologic agent), outcome (asthma control), and covariates (the baseline severity of illness) in a causal directed acyclic graph (causal DAG; Figure 1B). It consists of three nodes and three edges. The presence of “edge” from a variable (e.g., biologic agent) to another (e.g., asthma control) means that we know that there exists a direct effect. In contrast, its absence indicates that we know that the biologic agent has no direct effect on asthma control for any individual in the population. In addition to the expressed knowledge, these causal diagrams also encode information on the expected associations (more precisely, their absence) between the variables. Unlike causation, an association is a symmetric relationship between two variables. Therefore, an association flows the path between the variables, regardless of the direction of edge. For example, in Figure 1C, even if there is no causal treatment effect (i.e., no direct edge from biologic agent to asthma control), there is an association between these variables through the path involving the severity covariate [i.e., “back-door path” (15)]. The advancement of causal graphs has enabled us (and machines) not only to encode these assumptions and statistical dependencies/independencies, but also to test whether these are compatible with the data.
Confounding—the bias due to common causes of exposure and outcome—has long been considered the major hurdle in causal inference (15). The term “confounding” originates from Latin confundere meaning “blending.” The reason why this word was chosen is apparent from the causal diagram. In Figure 1C, the (null) effect of a biologic agent on asthma control is “blended” by the confounder (baseline severity of illness). This is because patients with greater baseline severity may be more likely to receive treatment but have worse control anyway. The apparent spurious correlation is introduced by the open back-door path (i.e., the path through severity). However, this confounding can be “de-confounded” by blocking the back-door path (Figure 1D, in which a rectangle placed around the confounder blocks the association flow through the path) (15). For example, we fit a regression model “adjusting for the confounder” to estimate the causal effect of treatment in every severity group separately [i.e., outcome regression method (Table 3)]. Then, we can take an average of the effects, weighting each severity group according to its probability, to estimate the average causal effect in the population of interest [i.e., standardization for fixed treatments, g-formula for time-varying treatments (15) (Table 3)].
Causal Mediation: Search for Mechanism
Another major goal of data science is to better understand the connection (or mechanism) between a known cause and effect. Causal mediation analysis aims to tease apart total effects, mediation or indirect effects (which pass through a mediator) and direct effects (which do not) (Tables 1, 3). Counterfactual causal inference needs to be involved to quantify such intermediate mechanisms (14).
For example, there had been uncertainty about the mediating mechanism(s) through which systemic antibiotic exposures in the early life are linked to subsequent asthma development (31, 32). Recently, a team of clinicians, epidemiologists, and data scientists tested a hypothesis—the effect of antibiotic use on asthma is mediated by the changes in airway microbiome [a highly-functional community of microbes (33)] in a population-based cohort (Figure 1E) (34). Statistical estimation of these effects was not trivial given that the number of data dimensions is large (e.g., the complexity of the microbiome) and the causal structure is complex. However, by combining unsupervised machine learning approaches to overcome “the curse of dimensionality” (16) and causal inference methods to carefully account for various confounders, the researchers identified that part of the antibiotic effect on asthma development was mediated by the change in airway microbiome—a modifiable factor. As presented in this example, causal mediation analyses not only provide better understanding on the disease mechanisms but also present opportunities for the development of new therapeutics targeting modifiable mediators (e.g., modulation of microbiome for asthma prevention).
Mendelian Randomization: Instrument of Nature
Most causal inference methods require a key unverifiable condition—no unmeasured confounding (Table 1). For example, identifying the effect of mental illnesses on asthma development is a difficult question because of many fixed and time-varying confounders (e.g., genetics, socioeconomic status, treatments) (35). To avoid the effect of bias, social scientists have long been using an alternative method—called instrumental variable estimation, which validly yields causal estimates by replacing the condition above with an alternative set of assumptions (Table 3).
In recent years, the increased availability of large-scale genome-wide association study (GWAS) data from biobanks and large consortiums (13, 35, 36) has accelerated the development of an instrumental variable approach—Mendelian randomization (Tables 1, 3). This approach is based on the random assortment of genotypes transferred from parents to offspring at conception. This Mendel's “law of the independent assortment” enables a study relating the genetic variants for modifiable exposures (e.g., mental illnesses) with health outcomes (e.g., asthma) to mitigate the risk of confounding (17). Accordingly, Mendelian randomization is conceptually analogous to an RCT, of which a random assignment of treatment/exposure is equivalent to a randomly-assorted genotype strongly associated with the exposure (Figure 1F). For example, in a study leveraging GWAS datasets of childhood- and adult-onset asthma, the use of Mendelian randomization demonstrated causal effects of depression on asthma (35). Recently, there has been the rise of publicly-available data that relate genetic variants to many modifiable exposures, ranging from physical conditions to biomarkers (e.g., proteins, metabolites) (37, 38). This availability of expanded data sources has informed the search for new targeted therapeutics.
Heterogeneous Treatment Effects: Differentiating Apples From Oranges
RCTs, which have been considered the “gold standard” for causal inference, often attempt to estimate the average treatment effect in the target population and generate a uniform recommendation (26). However, it is rare for a treatment effect to be perfectly homogeneous (39). Rather, there often exist effect modifications—either quantitative (i.e., different magnitudes of effects between subgroups) or qualitative (i.e., subgroup[s] having an effect in the opposite direction or no effect) (Table 1) (40). Indeed, growing evidence have shown that various medical disorders are heterogenous [e.g., asthma (13), autism spectrum disorder (41), sepsis (42)] with potentially different underlying mechanisms that lead to differential treatment effects. For example, in preschool children with viral-induced wheezing, most studies have shown no significant average effects of systemic corticosteroids on symptom severity or hospitalization rate (43–45). Yet, the question of whether this treatment strategy is beneficial in distinct subgroups of children [e.g., atopic children with rhinovirus-induced wheezing (46)] remains unclear. Recently, machine learning approaches [e.g., random forest (47) (Table 3, Figure 2)] have been applied to health data to (1) identify subgroups with different treatment effects, and (2) estimate individual (heterogeneous) treatment effects for subgroups in various disease conditions (e.g., diabetes) (48, 49). An integration of these algorithms, careful interpretation (e.g., covariate balance between the derived subgroups, false discoveries) and prospective validation will help precision medicine realize preventive and treatment strategies tailored to patients with a unique set of clinical characteristics.
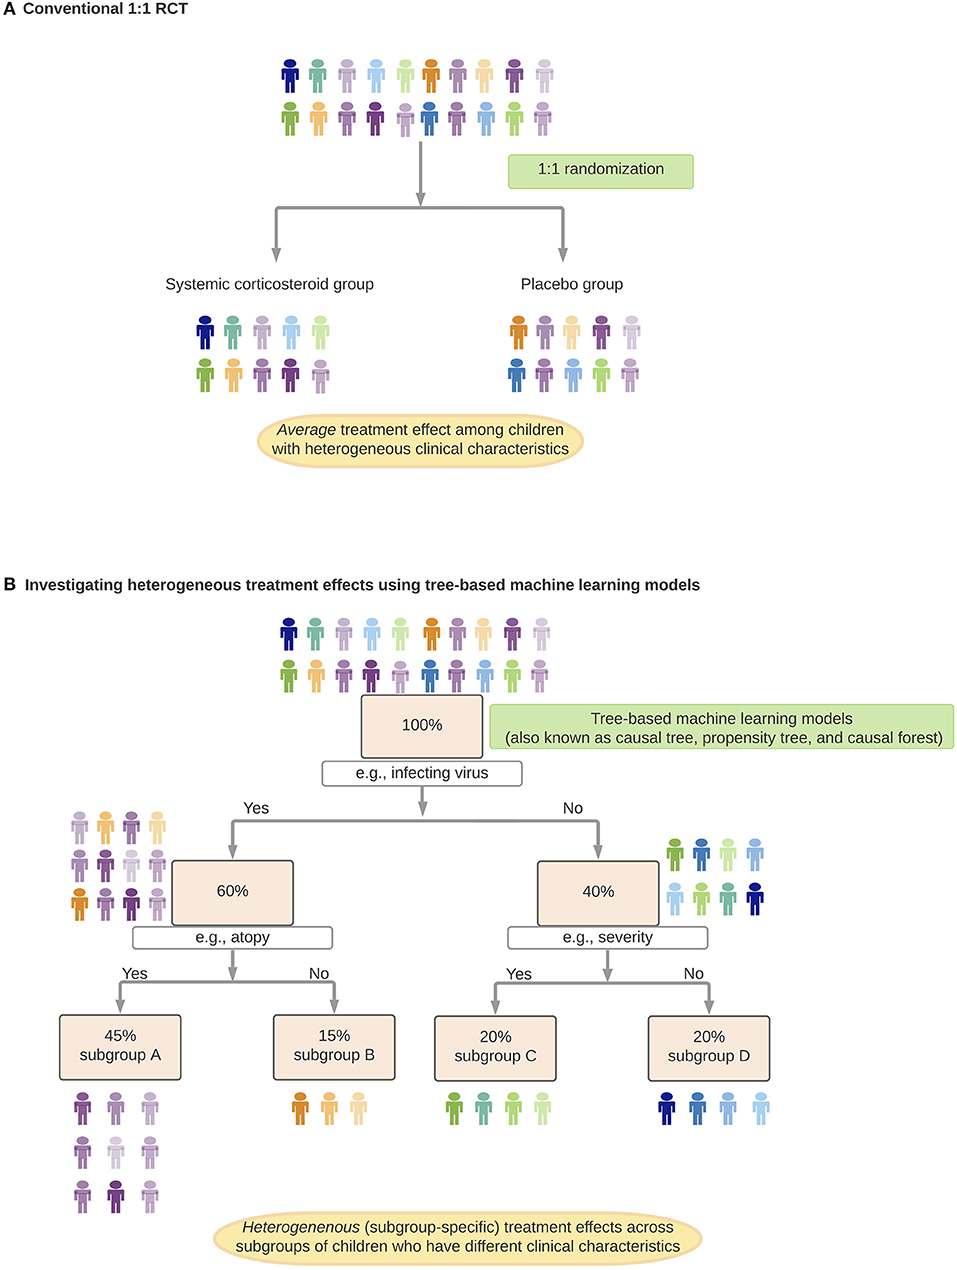
Figure 2. Identification and estimation of heterogenous treatment effects. In this hypothetical example, suppose, we investigate treatment effects of systemic corticosteroids on hospitalization rates among preschool children with virus-induced wheezing. (A) Randomized control trial (RCT) to investigate the average treatment effect of systemic corticosteroids (conventional 1:1 RCT). (B) Investigating heterogeneous treatment effects using tree-based machine learning models. In each of the branches (e.g., subgroup A children have specific virus infection and a history of atopy), children have a comparable predicted probability of receiving systemic corticosteroids. Children within each subgroup function as if they came from an RCT with eligibility criteria stratified by clinical characteristics.
The Way Forward
Toward Better Decision-Making and Precision Medicine
A major objective of data science is to assist clinicians and researchers in making better decisions. While its capability is often judged by its success on prediction tasks (11), the proposition that predictive algorithms improve decisions is uncertain. It is important to remember that a data-driven algorithm may excel at predicting, for example, which patients with asthma will be re-hospitalized for asthma exacerbation in the subsequent year, but is agnostic about the reason and possible measures to have prevented it. The algorithm may identify a past emergency department visit for asthma exacerbation as a strong predictor for rehospitalization. However, no clinicians would interpret the emergency department visit as the cause or instruct patients not to present to the emergency department. Identifying patients with a worse prognosis (through prediction) is a different question from identifying the optimal prevention and treatment strategies for a specific group of patients—the defining question of precision medicine (through causal inference). In other words, data-driven prediction algorithms can only point out decisions to be made, whereas causal inference can assist in decision making.
Note that these contrasts between association/prediction and causal inference tasks would become less sharp when the domain knowledge and counterfactual reasoning are codified in algorithms. Within a simple system with known deterministic rules and complete information [e.g., chess and Go games (22)], such algorithm is possible to predict outcomes under any hypothetical intervention (or any hypothetical move). By contrast, clinicians and researchers in the medical fields regularly deal with complex systems governed by non-deterministic rules with uncertainties about available data. Suppose we are interested in the causal effect of a new drug on infants with severe bronchiolitis. We only have incomplete knowledge on the causal structure through which the respiratory viruses, host genetic and immune factors, and environments jointly regulate and/or mediate the effect in this heterogeneous disease condition (50). Accordingly, most clinical researchers and epidemiologists had tended to answer carefully-developed but relatively-narrow causal questions (e.g., the average treatment effect of bronchodilators in infants with bronchiolitis) rather than to elucidate the global structure of system which could enable clinicians to make broadly optimal decisions (e.g., heterogeneous treatment effects between different bronchiolitis subgroups with distinct mechanisms).
In the past decade, the integration of “big data” with data science approaches (i.e., machine learning and causal inference equipped with domain knowledge) has begun to challenge conventional views. An example is the recent development of targeted treatment for asthma. There has been a growing consensus that asthma consists of different subtypes (13). Collective evidence from data science, experiments, and RCTs have already enabled clinicians to identify patients with a specific subtype of asthma (e.g., allergic asthma, eosinophilic asthma) by effective biomarkers (e.g., IgE, fractional exhaled nitric oxide, eosinophil quantification) and to provide targeted treatments (e.g., anti-IgE, anti-IL-5 therapies) (51, 52).
Another example is infant bronchiolitis, which is not only the leading cause of infant hospitalization in the U.S. (53) but also one of the strongest risk factors for asthma development (54). While bronchiolitis has been considered a single disease entity with similar clinical characteristics and mechanisms (55), emerging evidence indicates substantial heterogeneity (56–63). Indeed, recent studies applying data science approaches to large bronchiolitis cohorts have identified (62) and validated (63) the presence of different subtypes of bronchiolitis that have a higher risk of developing recurrent wheezing (e.g., atopic infants with rhinovirus infection who present with wheezing, compared to “classic” RSV bronchiolitis). Further, a recent study has also identified biologically-distinct subtypes of bronchiolitis that have higher risks of developing asthma (e.g., infants with type 2 airway inflammation with a dominance by specific virus and bacteria) (58). These efforts driven jointly by data scientists, clinical and laboratory researchers, and clinicians have potential to offer new avenues for developing prevention (e.g., early identification of high-risk children before disease inception) and treatment (subtype-specific treatment at a critical period of organ development) strategies in various disease conditions in children.
Future Challenges
For the successful development and implementation of data science approaches in clinical practice, several challenges and limitations need to be addressed. First, there are methodological challenges—e.g., how to fulfill standard causal inference assumptions (e.g., consistency when there are non-homogeneous exposures), how to model multiple molecular mediators at multiple levels, and how to handle time-varying feedbacks in a complex system. These are active areas of research. Second, evidence derived from these data science by itself is not confirmatory. We note that its promise lies in their symbiosis with, not replacement of, conventional experimental studies and RCTs. The derivation of novel and well-calibrated hypotheses based on robust data science still require stringent validations and experiments. Each approach can benefit from the other, which will, in turn, advance medical sciences and clinical practice. Lastly, milestones needed for data science-assisted medicine to become a reality go beyond methodological advents. The healthcare structure ought to adapt to operate with inter-disciplinary teams (e.g., clinicians, data scientists, epidemiologists, informatics specialists). Additionally, with the growing gap between the amount of data and clinical expertise, the realization of precision medicine warrants continued education for clinicians who interpret data and translate findings into clinical practice. For clinicians who wish to learn more, Table 4 summarizes educational resources.
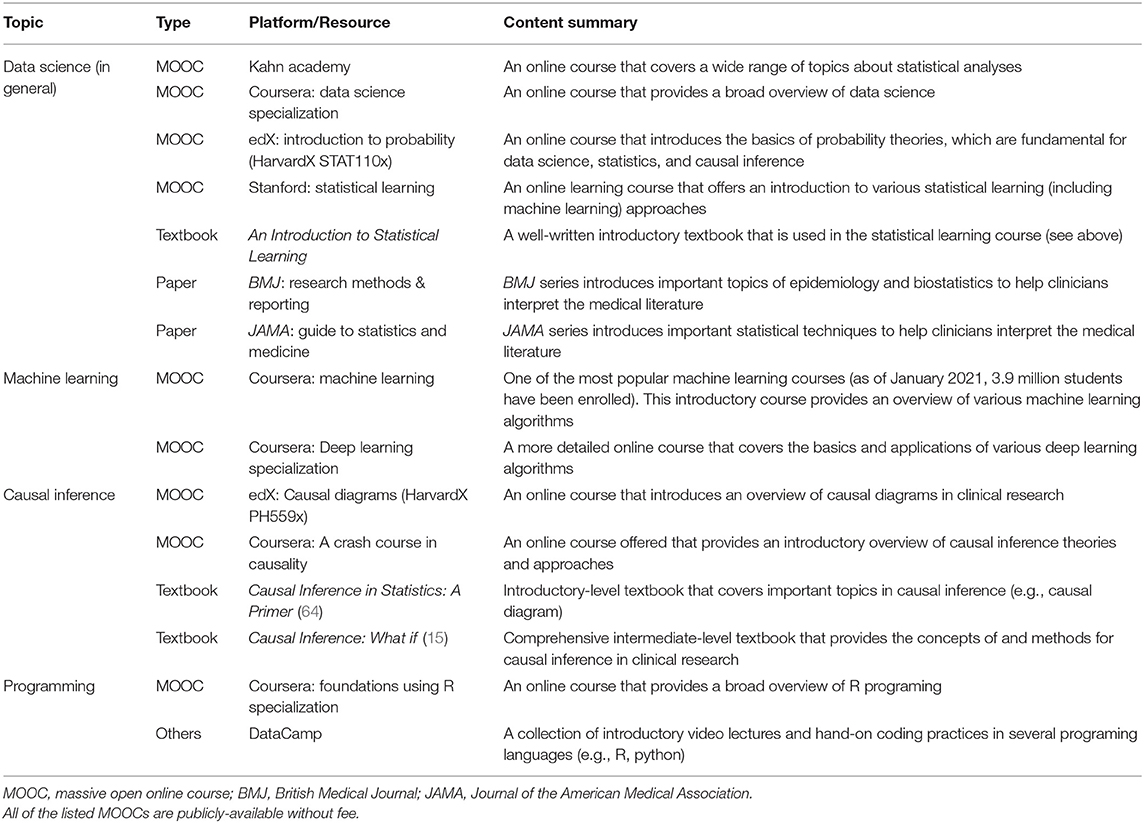
Table 4. Twelve major resources for clinicians who wish to learn about data science.
Summary
In this review, we summarize the goals, tasks, and tools of data science. Data science is a component of scientific disciplines, including epidemiology and medicine. Thus, the tasks of data science are the tasks of those disciplines—i.e., association/prediction, intervention, and counterfactual causal inference.
In this “big data” era, clinical practice and research have called for clinicians and researchers to handle a growing amount of data—e.g., clinical, biometric, and biomarker data. While machine learning algorithms become ubiquitous tools to handle quantitatively “big data,” their integration with domain knowledge and causal reasoning is critical to understand how complex systems behave (Figure 3). This integration in data science is key to qualitatively transform medicine. Patients—whose lives shape data, knowledge, and algorithms—will benefit the most as this new scientific discipline advances precision medicine.
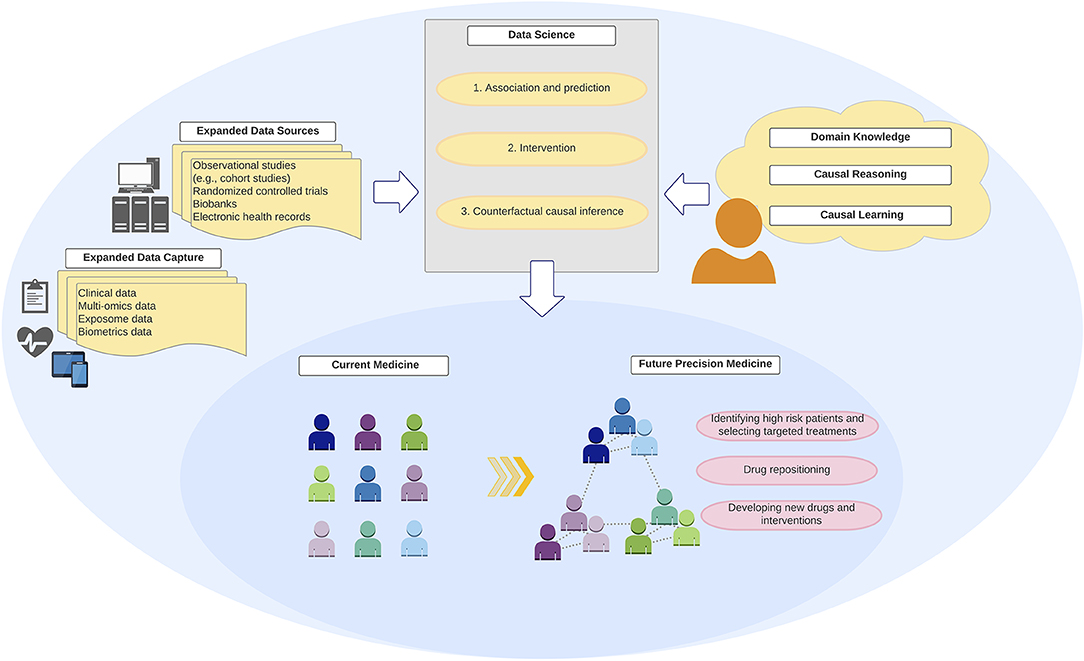
Figure 3. Integration of “big data,” data science, and domain knowledge toward precision medicine. Development of precision medicine requires an integration of “big data” from expanded data sources and capture with robust data science methodologies and analytics that encode domain causal knowledge and counterfactual causal reasoning.
Author Contributions
YR and KH conceptualized and developed the primer, drafted the initial manuscript, and reviewed and revised the manuscript. LL and CC conceptualized and supervised the development of the primer, and reviewed and revised the manuscript. All authors approved the final manuscript as submitted and agree to be accountable for all aspects of the work.
Funding
This work was supported by grants (R01 AI-127507, R01 AI-134940, R01 AI-137091, R01 AI-148338, and UG3/UH3 OD-023253) from the National Institutes of Health (Bethesda, MD). The funding organization was not involved in the conception, preparation or approval of the manuscript, or decision to submit the manuscript for publication.
Disclaimer
The content of this manuscript is solely the responsibility of the authors and does not necessarily represent the official views of the National Institutes of Health.
Conflict of Interest
The authors declare that the research was conducted in the absence of any commercial or financial relationships that could be construed as a potential conflict of interest.
Acknowledgments
We thank Michimasa Fujiogi, MD and Makiko Nanishi, MD (both Massachusetts GeneralHospital, Boston, MA, USA) as well as Tadahiro Goto, MD, Ph.D. (University of Tokyo, Tokyo, Japan) for critical revision of the manuscript.
Abbreviations
ED, emergency department; GWAS, genome-wide association study; RCT, randomized controlled trials.
References
1. Pearl J. The seven tools of causal inference, with reflections on machine learning. Commun ACM. (2019) 62:54–60. doi: 10.1145/3241036
3. Donoho D. 50 Years of data science. J Comput Graph Stat. (2017) 26:745–66. doi: 10.1080/10618600.2017.1384734
5. Mcconnochie KM, Roghmann KJ. Parental smoking, presence of older siblings, and family history of asthma increase risk of bronchiolitis. Am J Dis Child. (1986) 140:806–12. doi: 10.1001/archpedi.1986.02140220088039
6. Camargo CA, Weiss ST, Zhang S, Willett WC, Speizer FE. Prospective study of body mass index, weight change, and risk of adult- onset asthma in women. Arch Intern Med. (1999) 159:2582–8. doi: 10.1001/archinte.159.21.2582
7. Gauderman WJ, Urman R, Avol E, Berhane K, McConnell R, Rappaport E, et al. Association of improved air quality with lung development in children. N Engl J Med. (2015) 372:905–13. doi: 10.1056/NEJMoa1414123
8. Pearl J, Mackenzie D. The Book of Why: The New Science of Cause and Effect. New York, NY: Basic Books (2018).
9. Instructions for Authors. JAMA. JAMA Network. Available online at: https://jamanetwork.com/journals/jama/pages/instructions-for-authors (accessed March 8, 2021).
10. Hernán MA. The C-word: scientific euphemisms do not improve causal inference from observational data. Am J Public Health. (2018) 108:616–9. doi: 10.2105/AJPH.2018.304337
11. Hernán MA, Hsu J, Healy B. A second chance to get causal inference right: a classification of data science tasks. Chance. (2019) 32:42–9. doi: 10.1080/09332480.2019.1579578
12. Castro-Rodriguez JA. The asthma predictive index: a very useful tool for predicting asthma in young children. J Allergy Clin Immunol. (2010) 126:212–6. doi: 10.1016/j.jaci.2010.06.032
13. Zhu Z, Hasegawa K, Camargo CA, Liang L. Investigating asthma heterogeneity through shared and distinct genetics: insights from genome-wide cross-trait analysis. J Allergy Clin Immunol. (2020) 147:796–807. doi: 10.1016/j.jaci.2020.07.004
14. VanderWeele TJ. Mediation analysis: a practitioner's guide. Annu Rev Public Health. (2016) 37:17–32. doi: 10.1146/annurev-publhealth-032315-021402
16. James G, Witten D, Hastie T, Tibshirani R. An Introduction to Statistical Learning. New York, NY: Springer (2017).
17. Davies NM, Holmes MV, Davey Smith G. Reading mendelian randomisation studies: a guide, glossary, and checklist for clinicians. BMJ. (2018) 362:k601. doi: 10.1136/bmj.k601
18. Joffe MM, Rosenbaum PR. Invited commentary: propensity scores. Am J Epidemiol. (1999) 150:327–33. doi: 10.1093/oxfordjournals.aje.a010011
19. Kleinbaum DG, Kupper LL, Nizam A, Muller KE. Applied Regression Analysis And Other Multivariable Methods. Stanford: Cengage Learning (2013).
20. Schuler MS, Rose S. Targeted maximum likelihood estimation for causal inference in observational studies. Am J Epidemiol. (2017) 185:65–73. doi: 10.1093/aje/kww165
21. Van Der Laan MJ, Polley EC, Hubbard AE. Super learner. Stat Appl Genet Mol Biol. (2007) 6:25. doi: 10.2202/1544-6115.1309
22. Silver D, Huang A, Maddison CJ, Guez A, Sifre L, Van Den Driessche G, et al. Mastering the game of go with deep neural networks and tree search. Nature. (2016) 529:484–9. doi: 10.1038/nature16961
23. Topol EJ. High-performance medicine: the convergence of human and artificial intelligence. Nat Med. (2019) 25:44–56. doi: 10.1038/s41591-018-0300-7
24. Hernán MA, Hernández-Diáz S, Robins JM. Randomized trials analyzed as observational studies. Ann Intern Med. (2013) 159:560–2. doi: 10.7326/0003-4819-159-8-201310150-00709
25. Pearl J. Causality: Models, Reasoning, and Inference. 2nd ed. Cambridge: Cambridge University Press (2011).
26. Junod SW, Beaver WT. FDA and Clinical Drug Trials: A Short History. Available online at: www.fda.gov (accessed March 8, 2021).
27. Hankinson RJ. Cause and Explanation in Ancient Greek Thought. Oxford: Oxford University Press (2003).
28. Hume D. An Enquiry Concerning Human Understanding: A Critical Edition, Vol 3. Oxford: Oxford University Press (2000).
29. Imbens GW, Rubin DB. Causal Inference: For Statistics, Social, and Biomedical Sciences an Introduction. Cambridge: Cambridge University Press (2015) doi: 10.1017/CBO9781139025751
30. Hernández-Díaz S, Schisterman EF, Hernán MA. The birth weight “paradox” uncovered? Am J Epidemiol. (2006) 164:1115–20. doi: 10.1093/aje/kwj275
31. Marra F, Marra CA, Richardson K, Lynd LD, Kozyrskyj A, Patrick DM, et al. Antibiotic use in children is associated with increased risk of asthma. Pediatrics. (2009) 123:1003–10. doi: 10.1542/peds.2008-1146
32. Donovan BM, Abreo A, Ding T, Gebretsadik T, Turi KN, Yu C, et al. Dose, timing, and type of infant antibiotic use and the risk of childhood asthma. Clin Infect Dis. (2020) 70:1658–65. doi: 10.1093/cid/ciz448
33. Toivonen L, Karppinen S, Schuez-Havupalo L, Waris M, He Q, Hoffman KL, et al. Longitudinal changes in early nasal microbiota and the risk of childhood asthma. Pediatrics. (2020) 146:e20200421. doi: 10.1542/peds.2020-0421
34. Toivonen L, Schuez-Havupalo L, Karppinen S, Waris M, Hoffman KL, Camargo CA, et al. Antibiotic treatments during infancy, changes in nasal microbiota, and asthma development: population-based cohort study. Clin Infect Dis. (2020) 72:1546–54. doi: 10.1093/cid/ciaa262
35. Zhu Z, Zhu X, Liu CL, Shi H, Shen S, Yang Y, et al. Shared genetics of asthma and mental health disorders: a large-scale genome-wide cross-trait analysis. Eur Respir J. (2019) 54:1901507. doi: 10.1183/13993003.01507-2019
36. Zhu Z, Guo Y, Shi H, Liu CL, Panganiban RA, Chung W, et al. Shared genetic and experimental links between obesity-related traits and asthma subtypes in UK Biobank. J Allergy Clin Immunol. (2020) 145:537–49. doi: 10.1016/j.jaci.2019.09.035
37. Sun BB, Maranville JC, Peters JE, Stacey D, Staley JR, Blackshaw J, et al. Genomic atlas of the human plasma proteome. Nature. (2018) 558:73–9. doi: 10.1038/s41586-018-0175-2
38. Folkersen L, Gustafsson S, Wang Q, Hansen DH, Hedman ÅK, Schork A, et al. Genomic and drug target evaluation of 90 cardiovascular proteins in 30,931 individuals. Nat Metab. (2020) 2:1135–48. doi: 10.1038/s42255-020-00287-2
39. Goldstein BA, Rigdon J. Using machine learning to identify heterogeneous effects in randomized clinical trials-moving beyond the forest plot and into the forest. JAMA Netw open. (2019) 2:e190004. doi: 10.1001/jamanetworkopen.2019.0004
40. Gail M, Simon R. Testing for qualitative interactions between treatment effects and patient subsets. Biometrics. (1985) 41:361. doi: 10.2307/2530862
41. Doshi-Velez F, Ge Y, Kohane I. Comorbidity clusters in autism spectrum disorders: an electronic health record time-series analysis. Pediatrics. (2014) 133:e54–63. doi: 10.1542/peds.2013-0819
42. Atreya MR, Wong HR. Precision medicine in pediatric sepsis. Curr Opin Pediatr. (2019) 31:322–27. doi: 10.1097/MOP.0000000000000753
43. Vuillermin P, South M, Robertson C. Parent-initiated oral corticosteroid therapy for intermittent wheezing illnesses in children. Cochrane Database Syst Rev. (2006) CD005311. doi: 10.1002/14651858.CD005311.pub2
44. Panickar J, Lakhanpaul M, Lambert PC, Kenia P, Stephenson T, Smyth A, et al. Oral prednisolone for preschool children with acute virus-induced wheezing. N Engl J Med. (2009) 360:329–38. doi: 10.1056/NEJMoa0804897
45. Oommen A, Lambert PC, Grigg J. Efficacy of a short course of parent-initiated oral prednisolone for viral wheeze in children aged 1-5 years: randomised controlled trial. Lancet. (2003) 362:1433–8. doi: 10.1016/S0140-6736(03)14685-5
46. Jartti T, Lehtinen P, Vanto T, Vuorinen T, Hartiala J, Hiekkanen H, et al. Efficacy of prednisolone in children hospitalized for recurrent wheezing. Pediatr Allergy Immunol. (2007) 18:326–34. doi: 10.1111/j.1399-3038.2007.00512.x
47. Wager S, Athey S. Estimation and inference of heterogeneous treatment effects using random forests. J Am Stat Assoc. (2018) 113:1228–42. doi: 10.1080/01621459.2017.1319839
48. Scarpa J, Bruzelius E, Doupe P, Le M, Faghmous J, Baum A. Assessment of risk of harm associated with intensive blood pressure management among patients with hypertension who smoke: a secondary analysis of the systolic blood pressure intervention trial. JAMA Netw open. (2019) 2:e190005. doi: 10.1001/jamanetworkopen.2019.0005
49. Baum A, Scarpa J, Bruzelius E, Tamler R, Basu S, Faghmous J. Targeting weight loss interventions to reduce cardiovascular complications of type 2 diabetes: a machine learning-based post-hoc analysis of heterogeneous treatment effects in the look AHEAD trial. Lancet Diabetes Endocrinol. (2017) 5:808–15. doi: 10.1016/S2213-8587(17)30176-6
50. Hasegawa K, Dumas O, Hartert T V, Camargo CA. Advancing our understanding of infant bronchiolitis through phenotyping and endotyping: clinical and molecular approaches. Expert Rev Respir Med. (2016) 10:891–9. doi: 10.1080/17476348.2016.1190647
51. GINA Main Report. Global Initiative for Asthma. GINA. Available online at: https://ginasthma.org/gina-reports/ (accessed March 8, 2021).
52. Cloutier MM, Baptist AP, Blake KV, Brooks EG, Bryant-Stephens T, DiMango E, et al. 2020 focused updates to the asthma management guidelines: a report from the national asthma education and prevention program coordinating committee expert panel working group. J Allergy Clin Immunol. (2020) 146:1217–70. doi: 10.1016/j.jaci.2020.10.003
53. Fujiogi M, Goto T, Yasunaga H, Fujishiro J, Mansbach JM, Camargo CA, et al. Trends in bronchiolitis hospitalizations in the United States: 2000-2016. Pediatrics. (2019) 144:e20192614. doi: 10.1542/peds.2019-2614
54. Hasegawa K, Mansbach JM, Camargo CA. Infectious pathogens and bronchiolitis outcomes. Expert Rev Anti Infect Ther. (2014) 12:817–28. doi: 10.1586/14787210.2014.906901
55. Ralston SL, Lieberthal AS, Meissner HC, Alverson BK, Baley JE, Gadomski AM, et al. Clinical practice guideline: the diagnosis, management, and prevention of bronchiolitis. Pediatrics. (2014) 134:e1474–502. doi: 10.1542/peds.2014-2742
56. De Steenhuijsen Piters WAA, Heinonen S, Hasrat R, Bunsow E, Smith B, Suarez-Arrabal MC, et al. Nasopharyngeal microbiota, host transcriptome, and disease severity in children with respiratory syncytial virus infection. Am J Respir Crit Care Med. (2016) 194:1104–15. doi: 10.1164/rccm.201602-0220OC
57. Turi KN, Shankar J, Anderson LJ, Rajan D, Gaston K, Gebretsadik T, et al. Infant viral respiratory infection nasal immune-response patterns and their association with subsequent childhood recurrent wheeze. Am J Respir Crit Care Med. (2018) 198:1064–73. doi: 10.1164/rccm.201711-2348OC
58. Raita Y, Camargo CA, Bochkov YA, Celedón JC, Gern JE, Mansbach JM, et al. Integrated-omics endotyping of infants with rhinovirus bronchiolitis and risk of childhood asthma. J Allergy Clin Immunol. (2021) 147:2108–17. doi: 10.1016/j.jaci.2020.11.002
59. Stewart CJ, Hasegawa K, Wong MC, Ajami NJ, Petrosino JF, Piedra PA, et al. Respiratory syncytial virus and rhinovirus bronchiolitis are associated with distinct metabolic pathways. J Infect Dis. (2018) 217:1160–9. doi: 10.1093/infdis/jix680
60. Stewart CJ, Mansbach JM, Piedra PA, Toivonen L, Camargo CA, Hasegawa K. Association of respiratory viruses with serum metabolome in infants with severe bronchiolitis. Pediatr Allergy Immunol. (2019) 30:848–51. doi: 10.1111/pai.13101
61. Toivonen L, Camargo CA, Gern JE, Bochkov YA, Mansbach JM, Piedra PA, et al. Association between rhinovirus species and nasopharyngeal microbiota in infants with severe bronchiolitis. J Allergy Clin Immunol. (2019) 143:1925–8.e7. doi: 10.1016/j.jaci.2018.12.1004
62. Dumas O, Mansbach JM, Jartti T, Hasegawa K, Sullivan AF, Piedra PA, et al. A clustering approach to identify severe bronchiolitis profiles in children. Thorax. (2016) 71:712–8. doi: 10.1136/thoraxjnl-2016-208535
63. Dumas O, Hasegawa K, Mansbach JM, Sullivan AF, Piedra PA, Camargo CA. Severe bronchiolitis profiles and risk of recurrent wheeze by age 3 years. J Allergy Clin Immunol. (2019) 143:1371–9.e7. doi: 10.1016/j.jaci.2018.08.043
Keywords: big data, data science, causal inference, the ladder of causation, machine learning
Citation: Raita Y, Camargo CA Jr, Liang L and Hasegawa K (2021) Big Data, Data Science, and Causal Inference: A Primer for Clinicians. Front. Med. 8:678047. doi: 10.3389/fmed.2021.678047
Received: 08 March 2021; Accepted: 07 June 2021;
Published: 06 July 2021.
Edited by:
Jose R. Jardim, Federal University of São Paulo, BrazilReviewed by:
Gunnar N. Hillerdal, Karolinska University Hospital, SwedenYusuke Okubo, University of California, Los Angeles, United States
Copyright © 2021 Raita, Camargo, Liang and Hasegawa. This is an open-access article distributed under the terms of the Creative Commons Attribution License (CC BY). The use, distribution or reproduction in other forums is permitted, provided the original author(s) and the copyright owner(s) are credited and that the original publication in this journal is cited, in accordance with accepted academic practice. No use, distribution or reproduction is permitted which does not comply with these terms.
*Correspondence: Yoshihiko Raita, yraita1@mgh.harvard.edu