Ragone Relations for Thermal Energy Storage Technologies
 Kazuaki Yazawa
 Patrick J. Shamberger
 Timothy S. Fisher
- 1Birck Nanotechnology Center, Purdue University, West Lafayette, IN, United States
- 2Department of Materials Science and Engineering, Texas A&M University, College Station, TX, United States
- 3Department of Mechanical and Aerospace Engineering, UCLA, Los Angeles, CA, United States
The Ragone relation is a facile approach to assess and compare electro-chemical battery performance in terms of two critical performance parameters: power density and energy density. This power and energy nexus is equally relevant for thermal energy storage materials for thermal management applications that require a balance between energy storage capacity and on-demand cooling or heating rates. Here, thermal energy storage is evaluated for sensible heating and for phase-change materials (PCMs). We propose an analytic expression using a lumped mass model for thermal storage through an analogy with heat diffusion that allows for intuitive mapping of materials and components in power-energy space. In addition, a previously proposed figure-of-merit, ηq, describing the intrinsic capability of PCMs to rapidly absorb or discharge heat is placed in the context of the thermal Ragone (power-energy) relation. This figure of merit serves as a proxy for the cooling power of PCMs and single-phase materials to store thermal energy. Thus, ηq plotted against energy density can serve graphically to illustrate performance tradeoffs between different thermal storage materials, as well as composites composed of different materials.
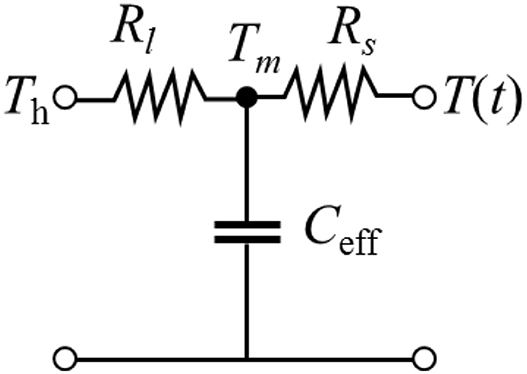
Graphical Abstract. Lumped thermal capacitance is placed in the middle of thermal conduction in order to effectively match the time constant in dynamic thermal response.
Introduction
A half century ago, Ragone published an overview of electro-chemical and fuel-cell batteries (Ragone, 1968) to compare power and energy performance of batteries in electrical automotive applications, prior to the emergence of plug-in electric vehicle (EVs) (Rotering and Ilic, 2011). This graphical comparison, later termed a “Ragone plot,” visibly and quantitatively represents how different battery technologies compare relative to these two performance metrics for EVs. Automotive applications are particularly demanding for batteries because of the need for both range and acceleration (Kroeze and Krein, 2008). Matching of batteries to high-current motors is particularly challenging because of the former's slow response time and intrinsic direct-current output.
Thereafter, the Ragone plot has become an essential mapping method to compare different electrochemical energy storage technologies. For example, Christen and Carlen (Christen and Carlen, 2000) modeled the performance of energy storage devices with physical fundamentals, and later Christen and Ohler proposed optimized energy storage devices based on the Ragone plot (Christen and Ohler, 2002). Simon and Gogotsi (Simon and Gogotsi, 2008) considered electrochemical capacitors to motivate material research directed toward high power and energy applications. Etacheri et al. invoked a Ragone plot (Etacheri et al., 2011) to assess leading research on lithium (Li)-ion batteries. Winter and Brodd (Winter and Brodd, 2004) used the approach to review battery and other storage technologies including fuel cells.
Here, we focus on thermal energy storage for potential use in a variety of time-dependent thermal energy and thermal management systems in which heat must be efficiently stored and transferred. Conventional thermal energy storage has been studied as an inexpensive alternative to electro-chemical batteries as a form of energy storage and sometimes as a provider of larger energy capacity, e.g., geothermal energy (Lund and Freeston, 2001) and other thermal energy storage technologies (Guo and Goumba, 2018). As with supercapacitors in power electronics, an emerging class of problems involving pulsed forms of power requires high thermal power density over short time periods. Inevitably, approaches to increase the power density of thermal energy storage (use of larger volume fraction of heat spreaders, inclusion of high thermal conductivity particles or fibers, or the use of low-melting point alloy PCMs) tend to increase power density at the cost of energy storage density. In such cases, the balance between energy and power becomes critical, particularly for space- or weight-constrained systems. We therefore provide here a thermal Ragone analysis to identify the important attributes for material research and system development.
This article first considers the close analogy between thermal and electrical systems, and provides a comparison and discussion of their similarities and differences (Thornton et al., 1986; Ikeda et al., 2010). The paper then presents metrics for thermal storage based on conventional solid materials, followed by consideration of phase-change materials (PCMs) (Cabeza, 2015) specifically used in time-dependent thermal management. A figure of merit (ηq) based on the analytical solution to the Neumann-Stefan phase-change problem developed in prior work (Shamberger, 2016) is placed in the Ragone context to consider single-phase materials along with PCMs on an equivalent basis.
Modeling of Dynamic Characteristics
Electro-Thermal Analogy
The concept of energy storage capacity is common to both thermal and electrical regimes. For either conducting or insulating materials, the analogy described herein is generally applicable for solids or fluids at rest (i.e., no convection or advection), as there is no equivalent to convective processes in the electrical regime. Consequently, some electrical circuit analysis methods are generally applicable for transient and steady-state energy analysis of thermal problems (e.g., Robertson and Gross, 1958). In practice, thermal problems generally depend on the three-dimensional geometry of the substance. Hence, here we assume lumped thermal properties to better connect with the electrical analogy. Table 1 identifies equivalent terms in this analogy, including related SI units. Thermal (electrical) parameters use temperature (voltage) as the potential, where a thermal (electrical) current is driven by a spatial gradient in those potential terms. Capacitance and resistance terms refer to accumulation of heat (charge), or resistance to a thermal (electrical) current, respectively. In general, electrical parameters contain an extra potential term in the denominator that derives from the fact that the electrical terms involve the flow of charge instead of energy.
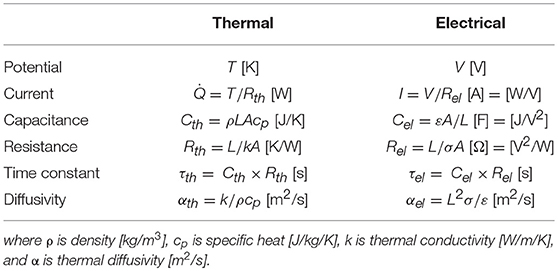
Table 1. Properties and characteristics in the thermal and electrical analogy based on an energy flow in a rectangular solid with length L [m] and cross-sectional area A [m2].
In thermal management of electronics, for example, the heat flow quantity allowed for conduction path in limited dimensions is an important factor of technology. This applies to thermal storage where the thermal current behaves similar to electrical current in electrochemical batteries. Trade-off between heat power and energy capacities is qualitatively equivalent to that of electrochemical batteries for EVs.
Lumped Thermal Model
To clarify the nature of dynamic thermal storage, we first analyze a case of a lumped single-phase thermal mass, applying the equivalent circuit approach drawn from the electrical analog. We consider a volume consisting of a rectangular block with a geometry of length L [m] along the heat flow direction, and cross-sectional area A [m2] perpendicular to the flow direction, and with adiabatic lateral and terminal boundaries. The initial temperature of the block is uniform at T0. The heat contact face is defined with a Dirichlet boundary condition, where the temperature is given as a constant for t > 0 for sufficiently long times. The opposite side is considered to experience a Neuman boundary condition, where the temperature gradient is always zero (dT/dx = 0). In energy charging mode, a temperature reservoir at Th contacts at time zero and is thereafter maintained. The temperature response at the other end, as well as the energy storage and rate of energy storage is of primary interest. At steady state (t → ∞), the temperature approaches T(L, t) → Th, representing full charging capacity. For the case of cold reservoir contact (Tc < Th), the approach is similar but with heat extraction until thermal equilibrium is achieved. Figure 1 shows a conceptual schematic of the physical representations.
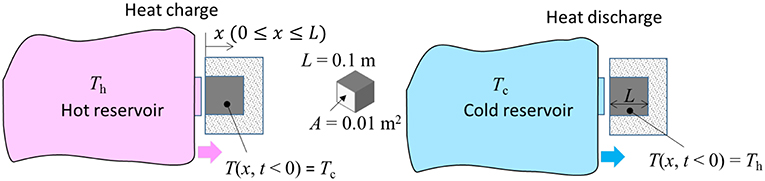
Figure 1. Schematics of the physical representations of the cases of contacting a hot (Left) or cold (Right) reservoir. For both cases, temperature reservoir initially contacts the object block at t = 0.
A simple thermal circuit diagram can be developed in an analog to electrical circuits. In this first-order model, a lumped capacitance exists within the total thermal resistance (R = R1 + R2) across the object. The lumped thermal mass should not be either at the contact or the opposite end, as shown in the circuit diagram of Figure 2.
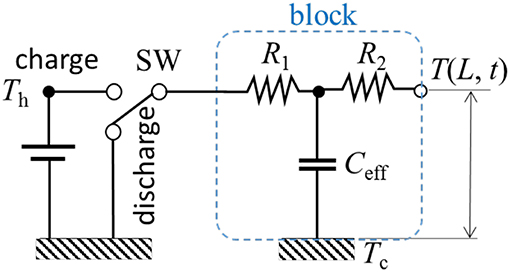
Figure 2. Thermal network diagram of a lumped mass thermal model. Depending on contacting to the hot or cold, the energy flow direction is changed by the switch (SW).
By utilizing the Thermal Quadrupoles method (Maillet et al., 2000), both resistances R1 and R2, as well as the capacitance Ceff, can be cast in terms of impedances via a Laplace transform, with Z1, Z2, and Z3 described by:
where, , and p is the Laplace transform parameter. After a long time period, with dimensionless time α t/L2 → ∞ and its equivalent in Laplace space (γL)2 = L2p/α → 0, Z1 and Z2 asymptotically converge to the pure resistances of a half-length (L/2) of the solid. Similarly, Z3 converges to the pure heat capacity in Laplace space since sinh(x)|x → 0 ≈ x. More generic analytical modeling methods are found in literature using Green's functions (Cole et al., 2011) and Bessel functions (Ozisik, 1993). These are extensively used for determining the details of temperature profile at specific time. In our objectives, however, knowing time constant is rather important for further analyses rather than the time series data. The analytic model is later verified by comparing to a discrete model and validating with numerical calculations with a couple of finite element method. The thermal resistances and capacitance of the circuit in Figure 2 can be expressed as,
where the effective capacitance is lumped to the mid point of total thermal resistance. The block of the lumped system is symbolized in Graphical Abstract.
The time constant of the transient thermal response of a single-phase volume is determined as,
The effective resistance contribution to the transient response is assumed to be one half (mean point). This assumption is verified in subsequently with a distributed thermal mass model. The time-dependent temperature T (L, t) and heat flow rate (t) at the contact are of most interest here. Defining the temperature excess at the contact as , this quantity is expressed as,
The time-dependent stored specific energy in the solid per unit temperature rise E(t) is found as E(t) = cpθ(t). As t → ∞ the specific heat energy stored per unit temperature rise E* [J/kg/K] in this lumped system converges to the total specific energy filling the capacitance; hence it becomes the traditional definition of specific heat,
The specific power (per thermal storage mass and temperature rise) [W/kg/K] flows through the contact (x = 0) and can be expressed as,
This function only decreases as time increases. Hence the specific power is maximum at t → 0 when contact is made and decreases to zero as t → ∞. The maximum specific power is,
The specific power consists of a ratio of two elemental material properties k / ρ, and the specific energy is essentially the same as classical definition of specific heat cp of the material. These are the metrics of the thermal power-energy relation in the simple heat diffusion regime. This relation can be called the thermal Ragone relation by analogy to electro-chemical batteries. The thermal Ragone plot shows the maximum specific power for a particular geometry following (Equation 8) as a function of the maximum specific energy following (Equation 6). Figure 3 contains a thermal Ragone plot for the selection of single-phase materials in Table 2.
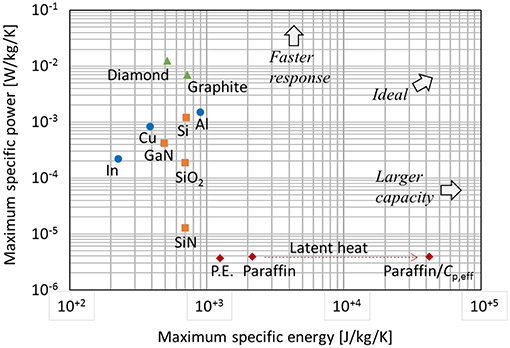
Figure 3. Thermal Ragone plot for single phase materials (Table 2). Impact of involving latent heat for paraffin wax (section Modeling of Phase-Change Material) is included. The values are specific to a cubic geometry with length of 0.1 m surrounded by adiabatic boundaries except the heat flow face. In the calculation, initial temperature of 40°C, contact temperature of 60°C, and melting temperature (paraffin) of 50°C are used.
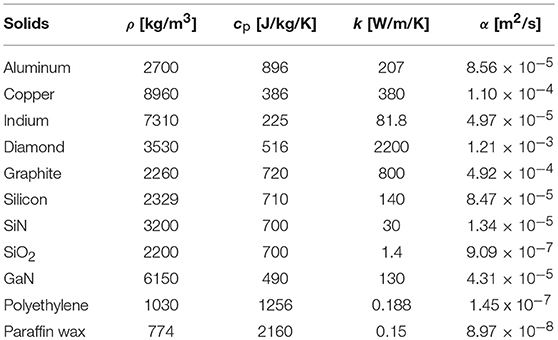
Table 2. Material properties of selected solids.
Distributed Thermal Mass Model
A distributed thermal mass model has been demonstrated previously (Jackson and Fisher, 2016) with a numerical time-dependent analysis for a single-phase material. This approach assesses the previously discussed lumped mass model's ability to capture the dynamics of the thermal process. The boundary conditions and dimensions are exactly the same as the lumped model. The dimensionless temperature responses of both models are compared in Figure 4. The i represents the element number from the contact face (0 ≤ i ≤ n), and Δx is the length of an element such that L = nΔx. We compare the normalized temperature rise found from lumped model and this numerical model. The figure clearly shows the consistency of the time constants (at x = L), when the normalized temperatures achieve 63.2% of steady-state. The difference that the lumped model does not capture is the slower temperature rise near x = L in the early stages and faster convergence to steady state for times beyond the time constant.
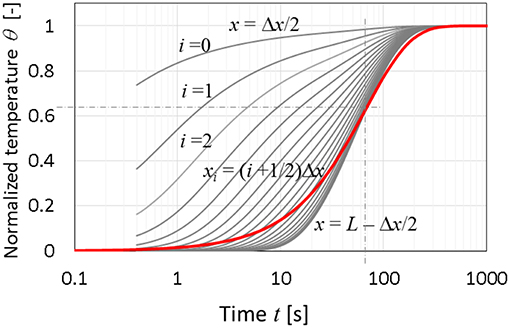
Figure 4. Normalized temperature responses of the discrete model (n = 20). Lumped-mass model in a bold line for solid silicon with a time constant of 67.5 s.
Modeling of Phase-Change Material
Lumped Mass Model
Utilization of latent heat enhances the thermal energy capacity per mass [J/kg] for energy storage applications. A lumped mass dynamic model with an effective heat capacity is developed here to include phase-change with a latent heat contribution. Two sets of properties must be considered for the liquid and solid phases, for which suffixes l and s are used, respectively. In a phase transition, changes in volume are neglected for convenience, and hence the geometry remains a rigid container. Using an approach similar to the enthalpy method (Jackson and Fisher, 2015), an effective specific heat cp, eff is introduced. We consider a temperature window around the true melting point in which the lower side temperature Tm1 and the higher side temperature Tm2 are critical.
where H is the heat of fusion. The melt front moves as heat flows, and the location corresponding to the mean melting temperature, Tm = (Tm1 + Tm2)/2, is tracked. Hence, the thermal capacitance originating from the combined effects of sensible heat in the liquid and solid together with the latent heat are lumped at the melting front with distance from the source x (0 ≤ x ≤ L). Due to these dynamics, the split point location, x, depends on the progression of the melting front, causing the thermal resistances and , to be functions of time. The effective capacitance is then determined as,
Therefore, the three elements (Rl, Rs, and Ceff) in the dynamic thermal circuit in analogy can be established as shown in Figure 5. As a special case of H = 0 and if the properties for both liquid and solid phases are exactly the same, the lumped point of the mass becomes L / 2 and hence, the time constant is the same as discussed previously. Here we define an effective time constant τeff at a point where the normalized temperature reached to 63.2%.
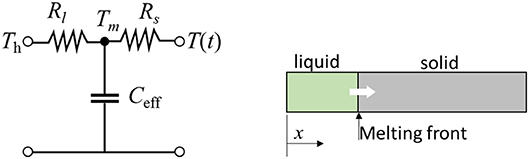
Figure 5. Lumped mass model for a phase-change material (PCM). The equivalent analytic thermal circuit (Left) represents 1-D dynamic thermal storage (Right).
The temperature response is found by a single lumped thermal mass model based on (Equation 5) but with the foregoing expression for Ceff. A numerical calculation has also been conducted by applying this Ceff into the model derived in section Distributed Thermal Mass Model.
Analytical Model
To validate the approximate dynamic models described above, we compare these results against the exact analytical solution for a semi-infinite medium with constant temperature boundary condition. The analytical solution of the two-region Neumann-Stefan problem in 1-D is:
In the ideal limit of a small temperature difference across the phase transition region (x = xm), Tm1 Tm and Tm2 Tm, both left side terms converge to unity. The location of the phase transition xm(t) is found by co-solving the foregoing equations, where λ2 is a solution of the transcendental equation:
The parameter λ2 is much greater than unity when the material is single-phase. In the case of a hot contact for instance, the Stefan number St is defined as:
where Tm is the melting temperature. For Stl < 1, . Through the foregoing methodology, the location of the melting front xm(t) and the end wall temperature T (L, t) are solved. Here, the normalized temperature of melting point θm is defined as,
Figure 6 summarizes the temperature response, which includes the lumped models (single exponential and numerical) based on Ceff and the analytical model. Due to the progression of the lumped mass location (see Figure 2), the Ceff based models show slower response than the analytic model in early stages and then somewhat overpredict the response speed after crossing near the time constant of lumped models. The cross point for the case θm = 0.0 is quite close closed to the time constant, which is 3.2 × 10⁴ s, while the effective time constant for the case θm = 5.0 is 2.6 × 10⁴ s. Larger θm (higher melting temperature) tends to show a quicker temperature rise.
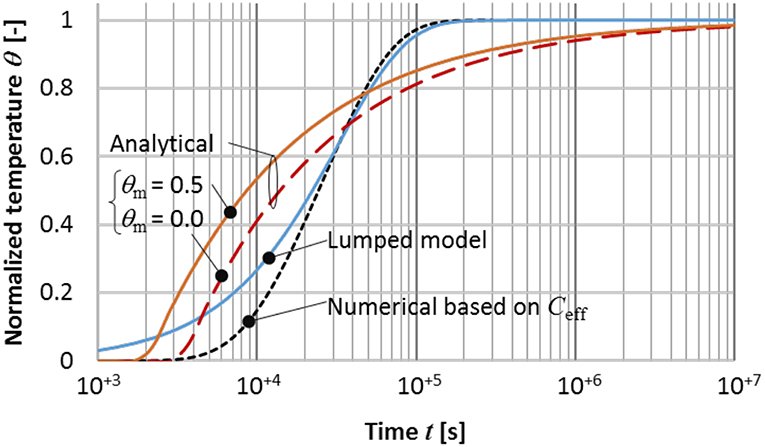
Figure 6. Normalized end wall temperature θ(x = L, t) to steady state for different models, with L = 0.01 m. Material properties are typical for paraffin wax (Table 1) with a heat of fusion H = 2.44 × 10⁵ [J/kg]. The lumped (single exponential function) and numerical models use Ceff determined by Equations (9–11). For this example, the normalized true melting temperature range is 0.1. Analytical models are the cases of normalized melting points θm = 0.5 and 0.0.
Here, the thermal Ragone relation can be extended by utilizing Ceff as a proxy for general phase-change materials (PCMs). A larger Ceff due to latent heat drastically increases the maximum specific energy (see Equation 6). In contrast, the maximum specific power changes only moderately with other thermophysical properties (thermal conductivity and density). The impact of phase change on effective specific power is observed in Figure 6 as the analytic model from the exact solution of the Neumann-Stefan problem shows faster initial response compared to the lumped Ceff model and then goes slower after passing the effective time constant.
Figure of Merit for Thermal Storage Materials
The previous sections provide a means to analyze relative trade-offs in cooling power and thermal energy storage by analyzing a particular test geometry. However, practical thermal storage problems consist of unique geometries and boundary conditions that may complicate comparisons among different PCMs, and are time-dependent. Following a parallel approach, Shamberger introduced a cooling power figure-of-merit (ηq) (Shamberger, 2016) for thermal management materials that is derived from the analytical solution to the Neumann-Stefan problem (Carslaw and Jaeger, 1959), and can be applied to both single-phase and phase-change materials:
where, λ2 is the parameter found by solving (Equation 14) as discussed in the previous section, and implicitly requires a working temperature range, ΔT to be defined. This figure-of-merit is directly proportional to heat flux for the case of melting of a semi-infinite medium, assuming constant temperature boundary conditions and small values for the Sts, Stl < 0.5. Furthermore, ηq is also proportional to the temperature rise of the surface under constant cooling power boundary conditions, suggesting the generality of this term in conductive heat transfer of the phase change problem. The principal advantage of this figure of merit is that it allows facile comparison between different classes of materials (e.g., paraffins, low melting point alloys, inorganic salts, salt hydrates) whose thermophysical properties differ widely, separate from the extrinsic role of boundary conditions in determining the heat flux at a given point in time.
Here, we adopt ηq as a proxy for cooling power for PCMs and use this figure-of-merit as an alternative approach to generate a thermal Ragone plot for PCMs (Figure 7). Some sets of materials are amenable to Pareto optimization, which refers to a convex space defined by cooling capability, figure-of-merit ηq, and the specific effective storage enthalpy, ΔHeff = H + cpΔT [J/g]. Inside this convex space, sub-optimal materials can always be out-performed by Pareto-optimal materials or combinations of thereof for both metrics. These metrics relate directly to the principal function of thermal energy storage materials: how much heat the can store, and how quickly they can store/discharge heat.
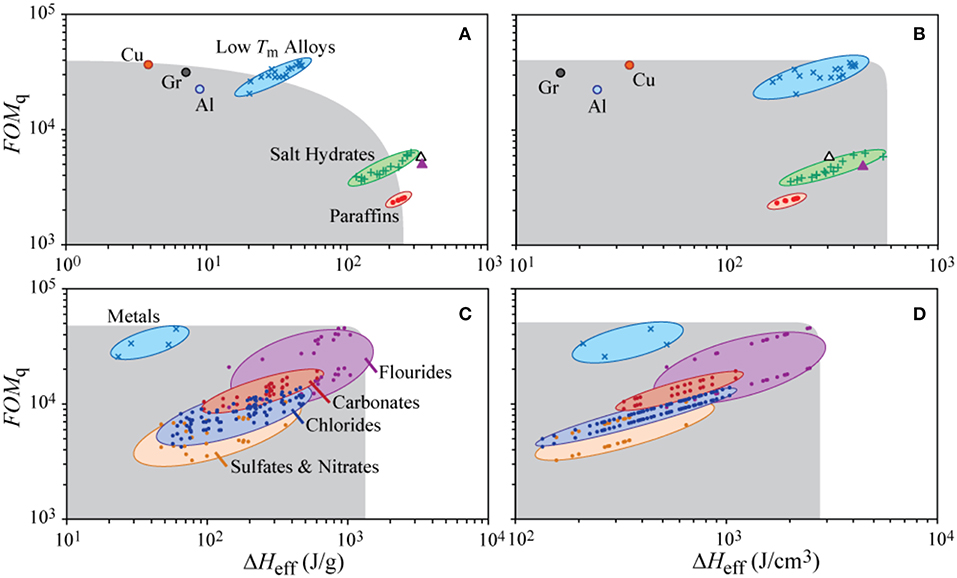
Figure 7. Thermal Ragone plot of (A,B) low-temperature PCMs (Tm < 300°C) (Chase et al., 1998; Solder Alloy Directory, 2008; Lide, 2010; Shamberger et al., 2017), along with three potential high-k materials: copper (Cu), graphitized carbon fiber (Gr), and aluminum (Al), and (C,D) high-temperature PCMs (Tm > 300°C) (Janz et al., 1978, 1979; Chase et al., 1998; Solder Alloy Directory, 2008; Kenisarin, 2010; Lide, 2010; Shamberger et al., 2017), illustrating the cooling power figure or merit ηq calculated for ΔT = 10°C, as a function of the specific effective storage enthalpy (A,C), and the volumetric effective storage enthalpy (B,D). PCMs are clustered by materials class as labeled. Properties of water (empty triangle) and erythritol (filled triangle) are also illustrated. Shaded gray region represents sub-optimal Pareto space.
Because thermophysical parameters of materials including the effective enthalpy of fusion, H, scale with the melting temperature of a material, Tm, it is instructive to separate PCMs into low-Tm (Tm < 300°C) and high-Tm (Tm > 300°C) groups for different technological applications. Common low-Tm PCMs include water, salt hydrates (Lorsch et al., 1975; Abhat, 1983; Zalba et al., 2003; Sharma et al., 2009; Shamberger and Reid, 2012, 2013), paraffins (Domalski and Hearing, 1996; Lemmon and Goodwin, 2000; Lide, 2010), low-Tm alloys (Chase et al., 1998; Solder Alloy Directory, 2008; Lide, 2010; Shamberger et al., 2017), and other organic compounds (e.g., erythritol; Domalski and Hearing, 1996; Lemmon and Goodwin, 2000; Lide, 2010). These five example materials generally represent a Pareto-optimal front when compared on the basis of energy storage per unit mass (see following figure). Of these materials, low-Tm alloys have the highest capacity for cooling power, due primarily to their large thermal conductivities, whereas salt hydrates and paraffins can each store significantly more thermal energy per unit mass than low-Tm alloys due to the high density of the latter materials. While paraffins may be slightly sub-optimal with respect to a few select salt hydrates, they still find common use because of their ease of handling, and easily tunable melting temperatures. When energy storage density is considered on a volumetric basis, nearly all other low-Tm PCMs are sub-optimal compared against low-Tm alloys and salt hydrates, see b) of the following figure. PCMs that melt in a higher temperature range tend to have significantly larger enthalpies of fusion, which tend to dramatically affect their energy storage density while only affecting ηq in a relatively minor way (see following figure). High-Tm PCMs primarily consist of inorganic salts (sulfates, nitrates, chlorides, carbonates, and fluorides) (Janz et al., 1978, 1979; Chase et al., 1998; Kenisarin, 2010; Lide, 2010), as well as some metals and alloys (Chase et al., 1998; Solder Alloy Directory, 2008; Lide, 2010; Shamberger et al., 2017).
In summary, metallic phases tend to have the highest ηq, due largely to their large thermal conductivities, whereas inorganic salts can each store significantly more thermal energy per unit mass and volume than metals due to the high density of the latter materials. Within inorganic salts, most of the variation observed between different classes of salts can be attributable to (1) different masses of the anionic species, (2) different intrinsic thermal conductivities of different salt species, and (3) different ranges of Tm in different salts, which indirectly affects the energy storage density.
Conclusions
The Ragone relationships for thermal storage materials designed for thermal management were explored, based on an electro-thermal analogy. The dynamic thermal response can be derived by temporal energy balance equations in a continuous medium. We demonstrated that a lumped thermal mass model worked well to determine the time constant along with the quick positioning of heat power-energy space, which is Ragone relation from the property information. Latent heat of fusion provides a significant increase in heat capacitance per given physical mass or volume, which drastically extends the energy capacity in the Ragone relation. The analysis for phase-change materials (PCMs) were also conducted by introducing enthalpy method. The lumped model for PCMs observes a discrepancy from the exact model but still the prediction is useful for first order estimate in thermal power and energy space. As a metric specifically for material selection for thermal storage, we utilize ηq as a proxy for a material's capability to absorb or release heat (cooling/heating power density). This approach results in a thermal Ragone diagram which schematically illustrates the thermal energy and power capacities of a certain class of PCMs.
Author Contributions
TF conceived the structure of the paper and made substantial contributions to each of many drafts. PS contributed the discussion on modeling and the figure-of-merit of phase change materials. KY contributed to the development of an effective capacitance model and carried out numerical simulations.
Conflict of Interest Statement
The authors declare that the research was conducted in the absence of any commercial or financial relationships that could be construed as a potential conflict of interest.
Acknowledgments
This material is based on research sponsored by Air Force Research Laboratory under agreement number FA8650-14-2-2419. The U.S. Government is authorized to reproduce and distribute reprints for Governmental purposes not withstanding any copyright notation thereon.
The authors thank the following individuals for helpful discussions and suggestions: Peter Bermel and Galen R. Jackson. The authors also acknowledge the helpful advice and support from the consortium members of the Center for Integrated Thermal Management of Aerospace Vehicles (CITMAV), including AFRL, Boeing, Honeywell, Lockheed Martin, Northrop Grumman, Raytheon, and Rolls-Royce.
References
Abhat, A. (1983). Low temperature latent heat thermal energy storage: heat storage materials. Solar Energy 30, 313–332. doi: 10.1016/0038-092X(83)90186-X
Cabeza, L. F. (ed.). (2015). “Advances in thermal energy storage systems methods and applications,” in A Volume in Woodhead Publishing Series in Energy (Cambridge: Elsevier), 1–28.
Carslaw, H. S., and Jaeger, J. C. (1959). Conduction of Heat in Solids 2nd edn. Oxford: Clarendon Press.
Chase, M. (1998). NIST-JANAF Thermochemical Tables, 4th Edn. Parts I and II. J. Phys. Chem. Ref. Data Monograph. 9, 1952 pp. Washington, DC: American Chemical Society.
Christen, T., and Carlen, M. W. (2000). Theory of ragone plots. J. Power Sources 91, 210–216. doi: 10.1016/S0378-7753(00)00474-2
Christen, T., and Ohler, C. (2002). Optimizing energy storage devices using Ragone plots. J. Power Sources 110, 107–116. doi: 10.1016/S0378-7753(02)00228-8
Cole, K. D., Haji-Sheikh, A., Beck, J. V., and Litkouhi, B. (2011). Heat Conduction Using Green's Functions, 2nd Edn. Boca Raton, FL: CRC Press, 181–236.
Domalski, E. S., and Hearing, E. D. (1996). Heat capacities and entropies of organic compounds in the condensed phase. J. Phys. Chem. Refer. Data 25, 1–525. doi: 10.1063/1.555985
Etacheri, V., Marom, R., Elazari, R., Salitra, G., and Aurbach, D. (2011). Challenges in the development of advanced Li-ion batteries: a review. Energy Environ. Sci. 4:3243. doi: 10.1039/c1ee01598b
Guo, X., and Goumba, A. P. (2018). Process intensification principles applied to thermal energy storage systems—a brief review. Front. Energy Res. 6:17. doi: 10.3389/fenrg.2018.00017
Ikeda, N., Niiyama, Y., Kambayashi, H., Sato, Y., Nomura, T., Kato, S., et al. (2010). GaN power transistors on Si substrates for switching applications. Proceed. IEEE 98, 1151–1161. doi: 10.1109/JPROC.2009.2034397
Jackson, G. R., and Fisher, T. S. (2015). Modeling thermal storage in wax-impregnated foams with a pore-scale submodel. J. Thermophys. Heat Transfer. 29, 812–819. doi: 10.2514/1.T4523
Jackson, G. R., and Fisher, T. S. (2016). Response of Phase-Change-material-filled porous foams under transient heating conditions. Thermophysics, J. Heat Transfer. 30, 880–889. doi: 10.2514/1.T4866
Janz, G. J., Allen, C. B., Bansal, N., Murphy, R., and Tomkins, R. (1979). Physical Properties Data Compilations Relevant to Energy Storage. II. Molten Salts: Data on Single and Multi-Component Systems, NSRDS-NBS 61. Washington, DC: Government Printing Office, 420. doi: 10.6028/NBS.NSRDS.61p1
Janz, G. J., Allen, C. B., Downey, J. R. Jr, and Tomkins, R. (1978). Physical Properties Data Compilations Relevant to Energy Storage II. Molten Salts: Eutectic Data, NSRDS-NBS 61. Washington, DC: Government Printing Office, 244. doi: 10.6028/NBS.NSRDS.61p2
Kenisarin, M. M. (2010). High-temperature phase change materials for thermal energy storage. Renew. Sustain. Energy Rev. 14, 955–970. doi: 10.1016/j.rser.2009.11.011
Kroeze, R. C., and Krein, P. T. (2008). “Electrical battery model for use in dynamic electric vehicle simulations,” in Proceedings of 2008 IEEE Power Electronics Specialists Conference, 1336–1342. doi: 10.1109/PESC.2008.4592119
Lemmon, E. W., and Goodwin, A. (2000). Critical properties and vapor pressure equation for alkanes C N H 2n+ 2: normal alkanes with N ≤ 36 and isomers for N = 4 through N = 9. J. Phys. Chem. Refer. Data 29, 1–39. doi: 10.1063/1.556054
Lorsch, H. G., Kauffman, K. W., and Denton, J. C. (1975). Thermal energy storage for solar heating and off-peak air conditioning. Energy Conver. 15, 1–8. doi: 10.1016/0013-7480(75)90002-9
Lund, J. W., and Freeston, D. H. (2001). World-wide direct uses of geothermal energy 2000. Geothermics 30, 29–68. doi: 10.1016/S0375-6505(00)00044-4
Maillet, D., Andre, S., Batsale, J. C., Degiovanni, A., and Moyne, C. (2000). Section 3 On-Dimensional Quadrupole, Thermal Quadrupole. Willey.
Ragone, D. V. (1968). “Review of battery systems for electrically powered vehicles,” in SAE Technical Paper 680453 (New York, NY: SAE), 1–9. doi: 10.4271/680453 (accessed May 22, 2019).
Robertson, A. F., and Gross, D. (1958). An electrical-analog method for transient heat-flow analysis. J. Res. Natl. Bur. Stand. 61:105. doi: 10.6028/jres.061.016
Rotering, N., and Ilic, M. (2011). Optimal charge control of plug-in hybrid electric vehicles in deregulated electricity markets. IEEE Trans. Power Syst. 26, 1021–1029. doi: 10.1109/TPWRS.2010.2086083
Shamberger, P. J. (2016). cooling capacity figure of merit for phase change materials. Heat Transfer. J. 138:024502. doi: 10.1115/1.4031252
Shamberger, P. J., Mizuno, Y., and Talapatra, A. A. (2017). Mixing and electronic entropy contributions to thermal energy storage in low melting point alloys. J. Appl. Phys. 122:025105. doi: 10.1063/1.4990984
Shamberger, P. J., and Reid, T. (2012). Thermophysical properties of lithium nitrate trihydrate from (253 to 353) K. J. Chem. Eng. Data 57, 1404–1411. doi: 10.1021/je3000469
Shamberger, P. J., and Reid, T. (2013). Thermophysical properties of potassium fluoride tetrahydrate from (243 to 348) K. J. Chem. Eng. Data 58, 294–300. doi: 10.1021/je300854w
Sharma, A., Tyagi, V. V., Chen, C., and Buddhi, D. (2009). Review on thermal energy storage with phase change materials and applications. Renew. Sustain. Energy Rev. 13, 318–345. doi: 10.1016/j.rser.2007.10.005
Simon, P., and Gogotsi, Y. (2008). Materials for electrochemical capacitors. Nat. Mater. 7, 845–854. doi: 10.1038/nmat2297
Solder Alloy Directory (2008). Solder Alloy Directory, Report No. 97720 (A4) R3. Clinton, NY: Indium Corporation, 15.
Thornton, T. J., Pepper, M., Ahmed, H., Andrews, D., and Davies, G. J. (1986). One-dimensional conduction in the 2D electron gas of a GaAs-AlGaAs heterojunction. Phys. Rev. Lett. 56:1198. doi: 10.1103/PhysRevLett.56.1198
Winter, M., and Brodd, R. J. (2004). What are batteries, fuel cells, and supercapacitors? Chem. Rev. 104, 4245–4270. doi: 10.1021/cr020730k
Zalba, J. M., Marín Cabeza, L. F., and Mehling, H. (2003). Review on thermal energy storage with phase change: materials, heat transfer analysis and applications. Appl. Therm. Eng. 23, 251–283. doi: 10.1016/S1359-4311(02)00192-8
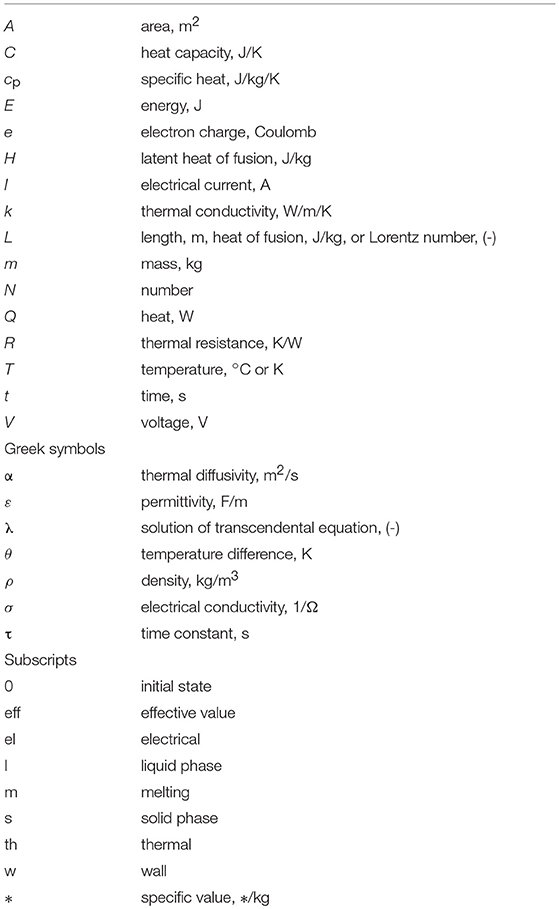
Nomenclature
Keywords: thermal energy storage (TES), phase change material (PCM), composite thermal energy storage materials, thermal network analysis, Ragone plot
Citation: Yazawa K, Shamberger PJ and Fisher TS (2019) Ragone Relations for Thermal Energy Storage Technologies. Front. Mech. Eng. 5:29. doi: 10.3389/fmech.2019.00029
Received: 01 January 2019; Accepted: 15 May 2019;
Published: 04 June 2019.
Edited by:
Nesrin Ozalp, University of Minnesota Duluth, United StatesReviewed by:
Gongnan Xie, Northwestern Polytechnical University, ChinaXiaofeng Guo, ESIEE Paris, France
Patrick Oosthuizen, Queen's University, Canada
Copyright © 2019 Yazawa, Shamberger and Fisher. This is an open-access article distributed under the terms of the Creative Commons Attribution License (CC BY). The use, distribution or reproduction in other forums is permitted, provided the original author(s) and the copyright owner(s) are credited and that the original publication in this journal is cited, in accordance with accepted academic practice. No use, distribution or reproduction is permitted which does not comply with these terms.
*Correspondence: Timothy S. Fisher, tsfisher@ucla.edu