Degradation of Sol-Gel Acrylic Coatings Based on Si and Zr Investigated Using Electrochemical Impedance, Infrared and X-Ray Photoelectron Spectroscopies
 Peter Rodič
 Sandrine Zanna
 Ingrid Milošev
 Philippe Marcus2
- 1Department of Physical and Organic Chemistry, Jožef Stefan Institute, Ljubljana, Slovenia
- 2Chimie ParisTech-CNRS, Institut de Recherche de Chimie Paris, Research Group Physical Chemistry of Surfaces, PSL Research University, Paris, France
This study aimed to synthesise and characterise two types of sol-gel acrylic coatings: one based on Si and the other based on Si and Zr. These coatings, which served as a barrier for corrosion protection of aluminium, were synthesised by sol-gel methodology using silicon precursors tetraethyl orthosilicate and organically modified silicon precursor 3-methacryloxypropyltrimethoxysilane, without and with the addition of zirconium(IV) n-propoxide chelated with methacrylic acid. The synthesis process was followed using real-time Fourier transform infrared spectroscopy, which confirmed the condensation reactions of Si–O–Si and Si–O–Zr networks, depending on the sol type. This was reflected in the composition of the coating as well, as shown by X-ray photoelectron spectroscopy. The coating topography, thickness and morphology were analysed using focused ion beam scanning electron microscopy. X-ray photoelectron spectroscopy was employed to follow the degradation of acrylic coatings upon immersion in sodium chloride solution. Corrosion properties, evaluated using electrochemical impedance spectroscopy in 0.1 M NaCl, confirmed high barrier protection of coated aluminium with acrylic coatings based on Si and even better for coating based on Si with Zr. The more durable corrosion protection of the latter was also confirmed by salt spray testing.
Introduction
Pure aluminium (>99.0%) is a lightweight material, widely used for multiple applications in transportation, construction and various household appliances. Aluminium spontaneously forms a natural thin aluminium oxide layer, which protects its surface against corrosion under atmospheric conditions (Davis, 1999). However, this layer’s protective efficiency is highly reduced in polluted and marine environments (Féron, 2007) due to the presence of corrosive species such as chloride ions (Rodič and Milošev, 2016). Therefore, the aluminium surface usually requires additional corrosion protection. In the past, corrosion protection of aluminium was mainly based on chromate conversion pre-treatment, which forms insoluble chromium conversion coating on the metal surface (Hagans and Haas, 1994). Due to its negative effect on human health and the environment, the use of chromate [hexavalent Cr(VI)] and other compounds containing chromium have been limited in many countries worldwide (Gharbi et al., 2018). The use of these toxic chemical substances is also prohibited by REACH (Registration, Evaluation, Authorisation and Restriction of Chemicals) (ECHA European Chemicals Agency, 2016) and European Directive RoHS (Restriction of Hazardous Substances) (RoHS Directive, 2021).
In the last decade, new technologies have been developed to enhance the corrosion protection of aluminium and its alloys. Industrially attractive and environmentally acceptable are chemical conversion systems (trivalent chromium, cerium or zirconium conversion coatings) (Hinton et al., 1986; Qi et al., 2015; Milošev and Frankel, 2018), anodic oxidation (eloxation) and different combinations with sealings and/or organic layers (painting) (Henley, 2013; Costenaro et al., 2017; del Olmo et al., 2021). Among novel protective industrial chemical surface treatments, hybrid sol-gel coatings were also developed in the last decades (Osborne, 2001; Abdolah et al., 2013; Figueira, 2020). The sol-gel process allows the introduction of organic molecules into an inorganic network, forming hybrid organic-inorganic coatings, the so-called ORMOSILS (organically modified silica), also known as silanes. The combination of ORMOSIL with other non-silane precursors such as zirconium-based additives the organically modified ceramics, the so-called ORMOCER, has initiated a novel trend in hybrid sol-gel coating’s corrosion protective system (Brinker and Scherer, 1990; Figueira, 2020). Zirconium-based alkoxides have much higher reactivity compared to silane coupling agents and thus react vigorously with water (air moisture). Therefore various chemical additives, among them methacrylic acid being the most suitable, are employed to reduce the reactivity and control hydrolysis and condensation reactions to form a stable sol (Rodič et al., 2014a; Rodič et al., 2014b). Other chemicals were employed for that purpose as well (Varma et al., 2009; Yu et al., 2016). The presence of zirconium also affects the coating composition, mechanical (Bae et al., 2011; Gorin et al., 2011) and corrosion properties (Oubaha et al., 2014; Rodič et al., 2014a; Rodič et al., 2014b; Rodič and Milošev, 2015; Rodič et al., 2018a; Rodič et al., 2018b; Varma et al., 2010a; Varma et al., 2010b). In previous work, the coatings were synthesised using silicon precursors tetraethyl orthosilicate (TEOS), organically modified silicon precursor 3-methacryloxypropyltrimethoxysilane (MAPTMS), without or with the addition of zirconium(IV) n-propoxide (ZTP) chelated with methacrylic acid (MAA) (Cullen et al., 2017; Cullen et al., 2018; Cullen et al., 2021; Rodič et al., 2014a; Rodič et al., 2014b; Rodič and Milošev, 2015; Rodič et al., 2018b). The hydrolysis and condensation reactions were characterised using real-time Fourier transform infrared spectroscopy (FTIR) to postulate the mechanism of final sol formation and curing in the form of coating (Rodič et al., 2014a; Rodič et al., 2014b). Briefly, the first step of the reaction is the hydrolysis of one of the alkoxy groups on MAPTMS after adding acidified water. This leads to a decreased reactivity of this precursor for further hydrolysis. The product reacts with TEOS through condensation reactions between the Si−OH and Si−OR groups. When ZTP, incorporated in MAA, is added to this hydrolysed sol, Zr initiates a condensation reaction with the formation of Si−O−Si and Si−O−Zr bonds that results in a network.
It is crucial to optimise the reactions during synthesis to achieve the maximum barrier efficiency of the coating deposited on the metal surface. It has been shown that the establishment of Si–O–Si, and especially Si–O–Zr bonds gave excellent corrosion protection (Rodič et al., 2014a; Rodič et al., 2018a). The barrier properties were hitherto studied with potentiodynamic polarisation curves and electrochemical impedance spectroscopy (EIS) measurements at different immersion times (Rodič and Milošev, 2015; Rodič et al., 2018a). EIS, as a useful and reliable in situ nondestructive method, enabled the determination of the charge and potential distribution at the metal/coating and coating/electrolyte interfaces (Rodič et al., 2018a). However, this technique does not provide direct information about the chemical changes in the coating structure (i.e., degradation) during immersion. Usually, the chemical composition is studied before immersion to corrosive media (Zheludkevich et al., 2006; Oubaha et al., 2014; Rodič et al., 2018a), but the approach to use the chemical analyses following the coating degradation in chloride solution is much more scarce.
The idea of the present work is to evaluate the degradation of coatings in the corrosive medium of 0.1 M NaCl after selected immersion time using in situ EIS and ex situ X-ray photoelectron spectroscopy (XPS). Such a comprehensive combination of two techniques should provide additional data on the mechanism of the coating’s barrier properties. Two acrylic coatings were studied: 1) TM coating formed whit MAPTMS and TEOS based on Si, and 2) TMZ coating formed with MAPTMS, TEOS and ZTP with MAA based on Si and Zr. The synthesis process of preparation was followed after each step using real-time FTIR. The prepared sols were applied on the ground aluminium surface using a spin-coater, followed by thermal curing of the coating. The coating’s topography and composition were further evaluated by focused ion beam scanning electron microscopy (FIB-SEM). Additionally, the coatings were exposed in the salt spray chamber according to standard ASTM B117.
Materials and Methods
Substrate Material
Aluminium >99.0% 1.0 mm thick flat discs with a diameter of 14 mm, distributed by GoodFellow, England, were used as substrate. The sample’s surface was water-ground with 2,400 and 4,000 grit SiC emery papers to obtain a smooth surface with no visible tracks of grinding. The samples were rinsed with deionised water and gently wiped with a soft cloth. Then they were placed into a beaker filled with absolute ethanol for final cleaning using an ultrasonic cleaner for 10 min to remove all the grinding residues. Finally, the surface of the samples was dried with a stream of compressed nitrogen.
Chemicals for Sol-Gel Synthesis
The sol-gel precursors were tetraethyl orthosilicate [TEOS: Si(OC2H5)4, 99.9%, Aldrich], 3-methacryloxypropyltrimethoxysilane [MAPTMS: H2C=C(CH3)CO2(CH2)3Si(OCH3)3, ≥ 98%, Sigma)] zirconium(IV) n-propoxide solution, [ZTP: Zr(OPr)4, 70 wt%, in 1-propanol, Aldrich] and methacrylic acid [MAA: H2C=C(CH3)COOH, 99.0% Aldrich]. The hydrolysis was initiated by adding distilled water containing hydrochloric acid (HCl: > 37%, AppliChem).
Sol-Gel Synthesis and Coating Preparation
Hybrid sol-gels were synthesised by mixing two separately prepared solutions from silicon and zirconium precursors. The preparation procedure steps have been described in detail previously (Rodič et al., 2014a; Rodič and Milošev, 2015; Rodič et al., 2018b). Two types of sol-gels were synthesised, Figure 1: TM sol contained the reagents in molar ratios: TEOS : MAPTMS = 0.18 : 1 and TMZ sol contained the reagents in molar ratio TEOS : MAPTMS : ZTP : MAA = 0.18 : 1 : 0.12 : 0.12. No other solvent or polymerization initiator were added during the synthesis. The syntheses were performed in a small laboratory reactor at atmospheric pressure open to the air. The temperature of the reactor jacket was kept constant at 25 ± 0.1°C. Sols were prepared and characterised only as a fresh sol [1 h after ZTP chelated with MAA (Sol 2) was added to hydrolysed sol of TEOS+MAPTMS (Sol 1)].
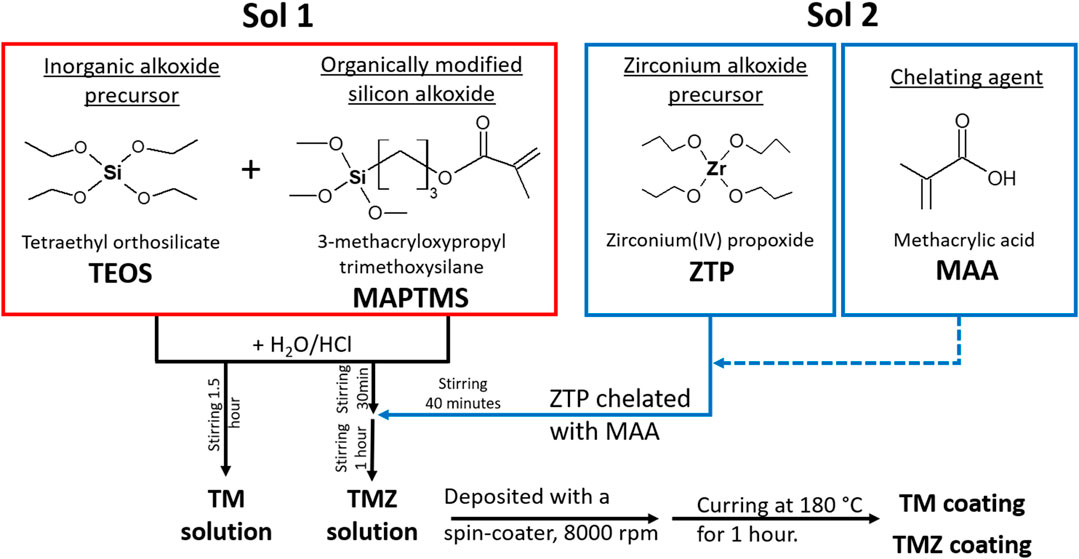
FIGURE 1. Flow chart of the sol-gel solution preparation of TM sol (Sol 1) and TMZ sol (Sol 1 + Sol 2) and coating deposition on the aluminium substrate.
The sol-gel coatings were applied to the aluminium substrate using a spin coater (Laurell−WS-650-23NPP/LITE/IND). A typical process involved depositing a small pool of fluid onto the centre to cover the entire surface (1–2 ml) and then spinning the substrate. The rotation speed was set to 8,000 rpm for 30 s. The coated samples were kept in ambient conditions for 10 min and then cured on a preheated hot plate at 180°C for 1 h in the presence of daylight. This procedure provided the complete curing of the coatings (Rodič and Milošev, 2014; Rodič et al., 2014a; Rodič et al., 2014b). Deposited coatings are denoted as TM and TMZ.
Sol-Gel Characterisation
Real-Time FTIR Spectroscopy
Synthesis reactions were optimised by recording ATR-FTIR spectra real-time at intervals of 1 min in the range of 600–2,800 cm−1. The spectra were measured with a ReactIR™ 45 spectrometer with a resolution of 4 cm−1, averaging 256 scans. An EasyMax 102 controller was used to control conditions during the reaction: stirring and reactor temperature. The closed atmosphere of the reactor prevented the evaporation of the solvent. The instruments were controlled by iControl EasyMax V4.2 and iC IR 7.1 software. The spectra are presented in the range between 700 and 1800 cm−1. The intensities of spectra are shown as log (absorbance) in absorbance units (A. U.).
Coating Characterisation
Scanning Electron Microscopy
Coating surface appearance and coating thickness were evaluated by focused ion beam/scanning electron microscopy (FEI Helios NanoLab 600 Dual-beam). Imaging was performed by SEM using secondary electron imaging (SEI) mode at 2 kV voltage. The cross-section of selected regions on the samples was obtained after deposition of the thin layer of platinum on the surface (the first layer, 0.2 μm thick, was deposited using electron beam at 2 kV and 0.4 nA, the second layer, 1 μm thick, was deposited using Ga FIB beam at 30 kV and 0.24 nA), followed by cutting the coating using Ga FIB beam at 30 kV and 9.4 nA. In the last step, the surface was polished with a Ga beam at 30 kV and 0.4 nA. Imaging along the cross-section was performed by SEM using SEI mode at 2 kV voltage.
Electrochemical Corrosion Measurements
The corrosion performance of uncoated aluminium and aluminium coated with sol-gel coatings was tested under immersion in 0.1 M NaCl solutions. Solutions were prepared using Milli-Q Direct water with a resistivity of 18.2 MΩ⋅cm at 25°C (Millipore, Billerica, MA). Electrochemical measurements were performed in a three-electrode standard corrosion cell at 25 ± 2°C. The surface area of aluminium exposed to the corroding solution was 1 cm2 and served as a working electrode. As the reference electrode, a silver/silver chloride (Ag/AgCl, sat. KCl, E = 0.197 V vs. saturated hydrogen electrode) was used. The carbon rod served as a counter electrode. All potentials in the text refer to the Ag/AgCl scale. Electrochemical experiments were carried out with an Autolab PGSTAT204M (Metrohm Autolab, Utrecht, The Netherlands) potentiostat/galvanostat and controlled by Nova 2.1 software. EIS measurements were acquired in the frequency range from 100 kHz to 10 mHz with a 10 mV amplitude (rms) signal. Before measurement, the open circuit potential (OCP) was measured for 10 min. The EIS measurements were performed first after 1-day immersion and then after selected intervals (4 and 6 days). EIS measurements were repeated at least twice and the representative measurement (at least two similar repetitions) was chosen to be presented in figures. EIS spectra were fitted using Nova 2.1 software. The quality of the fits characterized using χ2 values was usually less than 0.03.
X-Ray Photoelectron Spectroscopy
The surface characterisation of elemental composition and chemical state of the elements for as prepared TM and TMZ coatings and after selected immersion times (after 1, 4, and 6 days) was performed by X-ray photoelectron spectroscopy (XPS) using Thermo Electron Escalab 250 spectrometer, with a monochromated Al Kα X-ray source
Salt Spray Testing
An accelerated corrosion test for non-coated and coated samples was performed using salt spray testing. The tests were performed on 4 cm long and 2 cm wide ground aluminium and aluminium coated with TM and TMZ. Before testing, the coated samples were cross-scribed to evaluate the progression of the corrosion process at the substrate/coating interface. The edges of the samples were protected using water-resistant Scotch tape (Vinyl Plastic Tape MMM190RD) and placed in a holder so that the surface was tilted at an angle of 30° during testing.
The salt spray chamber ASCOTT, Staffs, Great Britain with 0.17 m3 capacity was operated according to the standard ASTM B117. The pH of NaCl solution (50 ± 1% g/L) was set between 6.0 and 6.5 at room temperature to give values of pH between 6.5 and 7.2 after heating the solution to 35°C. The pH was adjusted with 0.1 M NaOH or HCl solutions. The temperature in the salt spray chamber was set to 35°C ± 2°C. During testing, the samples were taken from the chamber after 6 h and then after the selected times when the difference in the coating appearance was seen (150 and 500 h). The samples were thoroughly rinsed with distilled water, dried with compressed nitrogen and photographed using a digital camera.
Results
Sol-Gel Characterisation
Real-Time Fourier Transform Infrared Spectroscopy
The coating corrosion properties are strongly related to hydrolysis and condensation reactions during synthesis, therefore the sols were studied in detail using real-time FTIR spectroscopy. The flow chart of sol-gel solution preparation is presented in Figure 1. First, the initial precursors (TEOS and MAPTMS) were mixed in the reactor, and then the drop-wise addition of H2O/HCl under vigorous stirring was performed to obtain Sol 1. After 2 h of stirring, synthesis was completed and the final sol was denoted as TM. On the other hand, after 1 h of stirring Sol 1, the separately prepared ZTP/MAA (Sol 2) was added drop-wise to obtain the final sol (Sol 1 + Sol 2). After 1 h of stirring, the synthesis was completed, and the final sol was denoted as TMZ.
Figure 2 shows the most characteristic bands in the 3-D FTIR spectra, between 700 and 1,150 cm−1, during the preparation of Sol 1. The bands at 1,081, 815, and 790 cm−1 represent characteristic Si–O–R bonds of TEOS and MAPTMS precursors (Rodič et al., 2014a). The only change in the TEOS spectra during the addition of the MAPTMS was a small difference in the intensity of the bands (i.e., the band at 815 cm−1) as a result of dilution or the sum of bands of initial precursors present in the mixture (i.e., the band at 1,081 cm−1), Figures 2A,C. Indeed, during the mixing of both precursors, no reactions occurred between precursors.
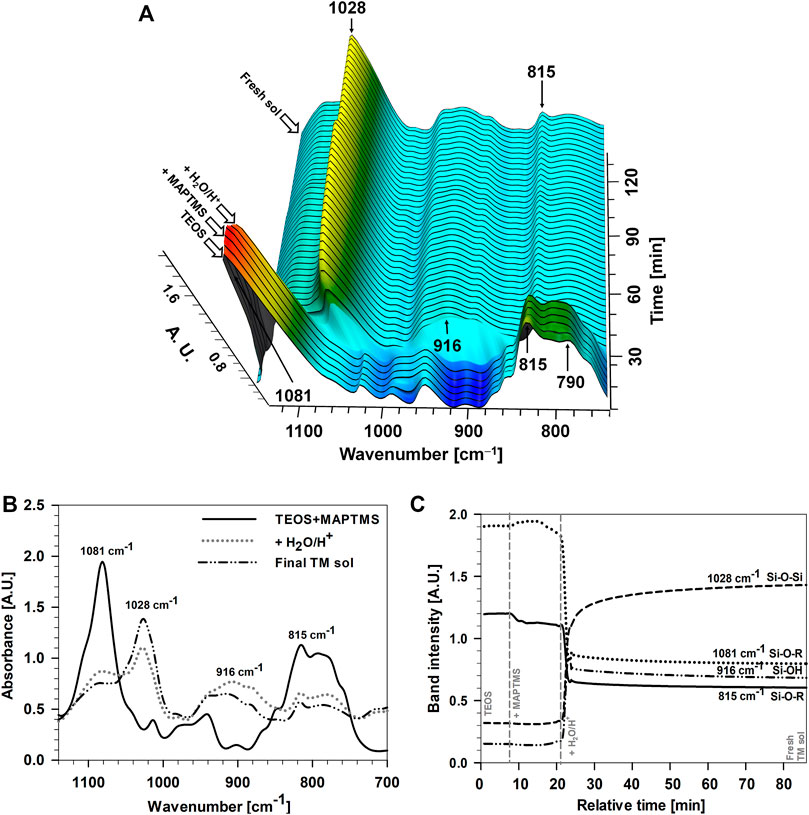
FIGURE 2. (A) 3-D FTIR spectra (increment 3 min) (B) individual FTIR spectra and (C) band intensity recorded during the addition of H2O/H+ to TEOS + MAPTMS (Sol 1) as a function of reaction time. Arrows in Panel 2A and dashed horizontal lines in Panel 2C marked the points when MAPTMS and H2O/H+ were added to the initial TEOS to obtain the final TM sol. Note that the curves in Panel 2C are given for the period up to 80 min, and not for the whole period up to 150 min, as given in Panel 2A. No further changes were observed at prolonged times.
The main difference in the 3D FTIR spectra occurred after the addition of H2O/HCl, Figure 2. The changed intensities and positions of the main characteristic bands between 700 and 1,150 cm−1 confirmed the hydrolysis and condensation reactions of both precursors. The bands of initial Si–O–R bonds (at 1,081, 815, and 790 cm−1) decreased rapidly after adding H2O/HCl (within minutes), Figure 2. Meanwhile, the bands between 850 and 960 cm−1 increased due to the formation of a new silanol (Si–OH) group at 916 cm−1 and siloxane (Si–O–Si) group at 1,028 cm−1, Figures 2A,B. The side product of reactions was ethanol with a related band at 880 cm−1. The most important bands in FTIR spectra of final sols are presented in Table 1 (Rodič et al., 2014a; Rodič et al., 2014b; Rodič et al., 2016).
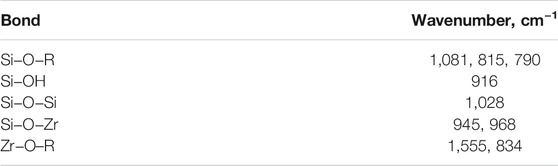
TABLE 1. Most characteristic bands in the FTIR spectra for bonds in TM and TMZ sols (Rodič et al., 2014a, Rodič et al., 2014b, Rodič et al., 2016, Rodič et al., 2018b).
The intensities of the characteristic bands were followed with time, Figures 2A,C. The bands of initial Si–O–R bonds first decreased rapidly after adding H2O/HCl, and then, after a few minutes, slowly during prolonged solution mixing (Figures 2B,C). This confirms that the hydrolysis and condensation reactions were faster at the beginning of the addition H2O/HCl, but they were not completed even for prolonged mixing (approx. 1 h). Similar behaviour was noticed for the Si–OH band at 916 cm–1. The band intensity decreased slowly with time due to slow condensation reactions between two Si–OH groups. This indicates that the condensation process was not completed even after 1 h of mixing (when we obtain fresh sol) because the Si–O–Si band at 1,028 cm–1 still slightly increased and that of Si–OH at 916 cm–1 had not disappeared.
Sol 2 was a mixture of ZTP, dissolved in 1-propanol, and MAA. A detailed description of the course of preparation of Sol 2 and related real-time FTIR spectra are presented in Supplemental Material, Supplementary Figure S1. After the drop-wise addition of MAA to ZTP, the chelating reaction occurred spontaneously and took a few minutes (Rodič et al., 2014a). The spectrum of final Sol 2 combined the spectral characteristics of both substances, ZTP and MAA, Supplementary Figure S1B. In addition to bands related to the initial reagents, ZTP and MAA, two new bands appeared at 1,555 and 834 cm–1 (Table 1, Supplementary Figure S1B). These new bands are presumably related to the bonding of Zr–O with the carbonyl group of MAA. The ZTP was chelated with MAA to reduce the reactivity for hydrolysis and condensation of ZTP. The chelating reaction between the different ratios of ZTP and MAA had been described in detail in the previous publications (Rodič et al., 2014a; Rodič and Milošev, 2015).
FTIR spectra of hydrolysed MAPTMS and TEOS (Sol 1) after the addition of ZTP chelated with MAA (Sol 2) is shown in Figure 3. After the addition of Sol 2 (ZTP chelated with MAA) to Sol 1 (hydrolysed TEOS + MAPTMS), a marked decrease of the characteristic bands between 780 and 940 cm–1 (bands for Si–OR and Si–OH) was noticed as a result of dilution of solution (Sol 1 with Sol 2) and induced condensation reactions in sol. Moreover, a notable decrease of the bands for non-hydrolysed Si–O–R at 1,081 cm–1 and Si–O–Si at 1,028 cm–1 occurred. The most important change in the spectra was a significant decrease of a broad Si–OH band at 916 cm–1. These changes reflect the formation of a more complex network between Si–OH and ZTP (Zr–O–R bonds) with two new wide intense bands at 945 and 968 cm–1, Figures 3A,C. After 1 h of mixing, the intensity of the Si–OH band further decreased and that of the Si–O–Si band slight increased, Figure 3C. The slight change in the intensity of bands related to Si–O–Zr was due to changes in the structure during reactions. During stirring the sol at room temperature, TMZ sol was not fully stabilised. The comparison between Figure 2 and Figure 3 confirms that the major difference in adding ZTP into siloxane solution is in the condensation reactions.

FIGURE 3. (A) 3-D FTIR spectra (increment 3 min) (B) individual FTIR spectra and (C) band intensity recorded during the addition of H2O/H+ to TEOS + MAPTMS (Sol 1) as a function of reaction time. Arrows in Figure 2A and dashed horizontal lines in Figure 2C marked the points when MAPTMS, H2O/H+ and ZTP/MAA (Sol 2) were added to the initial TEOS to obtain the final TMZ sol.
To sum up, the addition of ZTP/MAA into Sol 1 had a crucial effect on hydrolysis and condensation reactions. In addition to Si–O–Si network in TM sols, zirconium formed a condensed Si–O–Zr network in TMZ sols. The TM and TMZ sol-gel networks are expected to affect the coating properties. Schematic presentation of the TM and TMZ network in the form of coating deposited on Al substrate is depicted in Figure 4. During the coating curing, the condensation reactions between Si–OH groups of hydrolysed TEOS and MAPTMS occurred. Additionally, the Si–OH groups (hydrolysed TEOS and MAPTMS) present in the TM coating react with Al–OH groups on the aluminium surface and form Si–O–Al covalent bond (Rodič et al., 2020). This accounts for good adhesion on the aluminium surface (Rodič and Milošev, 2014). Meanwhile, also the copolymerisation between acrylates groups in MAPTMS and acrylate groups between MAPTMS and MAA occurred. A similar mechanism of condensation and polymerisation is valid for TMZ coating as well. The main difference is the possible reaction between Si–OH, Al–OH and hydrolysed zirconium precursor (Zr–OH). The formed Al–O–Zr bond can enhance the adhesion of hybrid sol-gel coating on the aluminium surface (Liu et al., 2006). Note that the exact distance between silica and silica-zirconia clusters and length of polymeric chains are not known and could not be determined using the methodology in the present study unlike in (Harb et al., 2020).
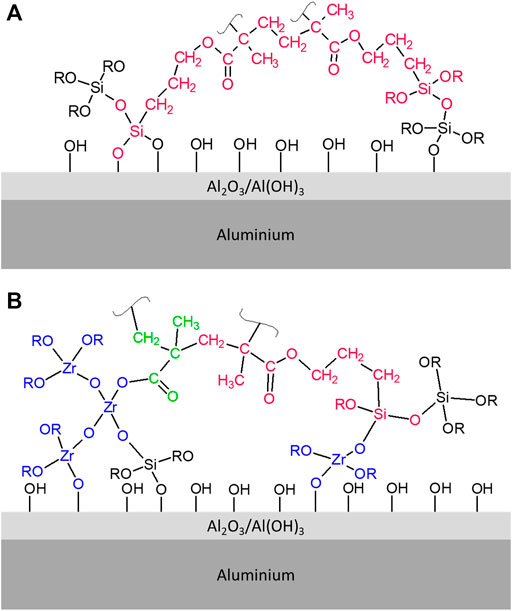
FIGURE 4. Schematic presentation of the sol-gel network in (A) TM and (B) TMZ coatings deposited on the aluminium surface.
Coating Characterisation
Focused Ion Beam Scanning Electron Microscopy
The aluminium surface coated with TM and TMZ coating was characterised using scanning electron microscopy. The top-view SEM images (Figures 5A,B) show that the aluminium surfaces coated with both coatings were without any defects and micro-cracks that would be visible at these high microscopic magnifications (see insets). However, the notable difference is in the coating’s topography because the TM coating applied on aluminium shows a corrugated surface, probably related to the lower condensation degree between initial precursors in the TM sol. On the other hand, TMZ coating is entirely uniform, which stems from the more viscous sol due to incorporating zirconium into the sol-gel network (Rodič et al., 2014a).
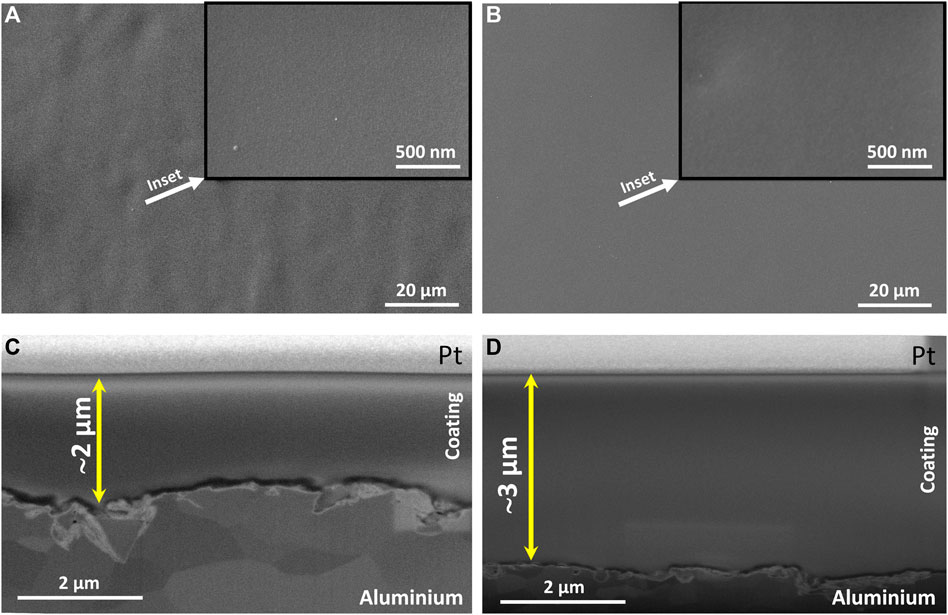
FIGURE 5. (A) and (B) top-view SEM images of TM and TMZ coating at different magnifications (insets) deposited on the aluminium substrate. (C) and (D) SEM images of the cross-sections between TM and TMZ coatings and aluminium substrate. Cross-sections were prepared by FIB. SEM images were collected in SEI mode.
The coatings composition along the performed cross-section was additionally characterised by FIB/SEM, Figures 5C,D. The TM and TMZ coatings show a compact structure without any visible pores or defects. The zirconium was fully integrated into the TMZ coating structure because no difference between the structures of TM and TMZ coatings was noticed. Both coatings are entirely homogeneous and uniformly cover the aluminium surface, also indicating good adhesion to the substrate. The coating thickness, estimated based on SEM images of the coating’s cross-sections, was ∼2 µm for TM and about ∼3 µm for TMZ, Figures 5C,D. The larger thickness of the TMZ coating is probably related to the higher condensation degree of the sol during preparation (confirmed with real-time FTIR, Figure 3).
Electrochemical Impedance Spectroscopy
The electrochemical properties of uncoated and coated aluminium with TM and TMZ coatings during immersion in 0.1 M NaCl solution were investigated using EIS. The phase angle associated with the impedance gives valuable information on the film properties, such as barrier performance and interfacial activity.
The EIS results in the form of Bode plots (magnitudes of the impedance, |Z|, and the phase angle, ϕ, as a function of the frequency, f) for uncoated aluminium at selected immersion times (1, 4, and 6 days) are shown in Figure 6A. Bode plots reflect that the spontaneously formed aluminium oxide layer offers a certain degree of protection. For example, after 1 day the impedance magnitude at low frequency (|Z|0.01 mHz) was 32 kΩ cm2. The medium frequency behaviour was due to the diffusion through the surface oxide film, and hence implies a barrier effect against corrosive species (chloride ions). The maximum ϕ of around −60° extended in the middle range frequency. With prolonged immersion (4 and 6 days), the Bode plots were not changed significantly: |Z|0.01 mHz and ϕmax slightly increased, which may be related to the gradual formation of a corrosion product, i.e., oxide layer, during immersion, which offered a certain degree of protection.
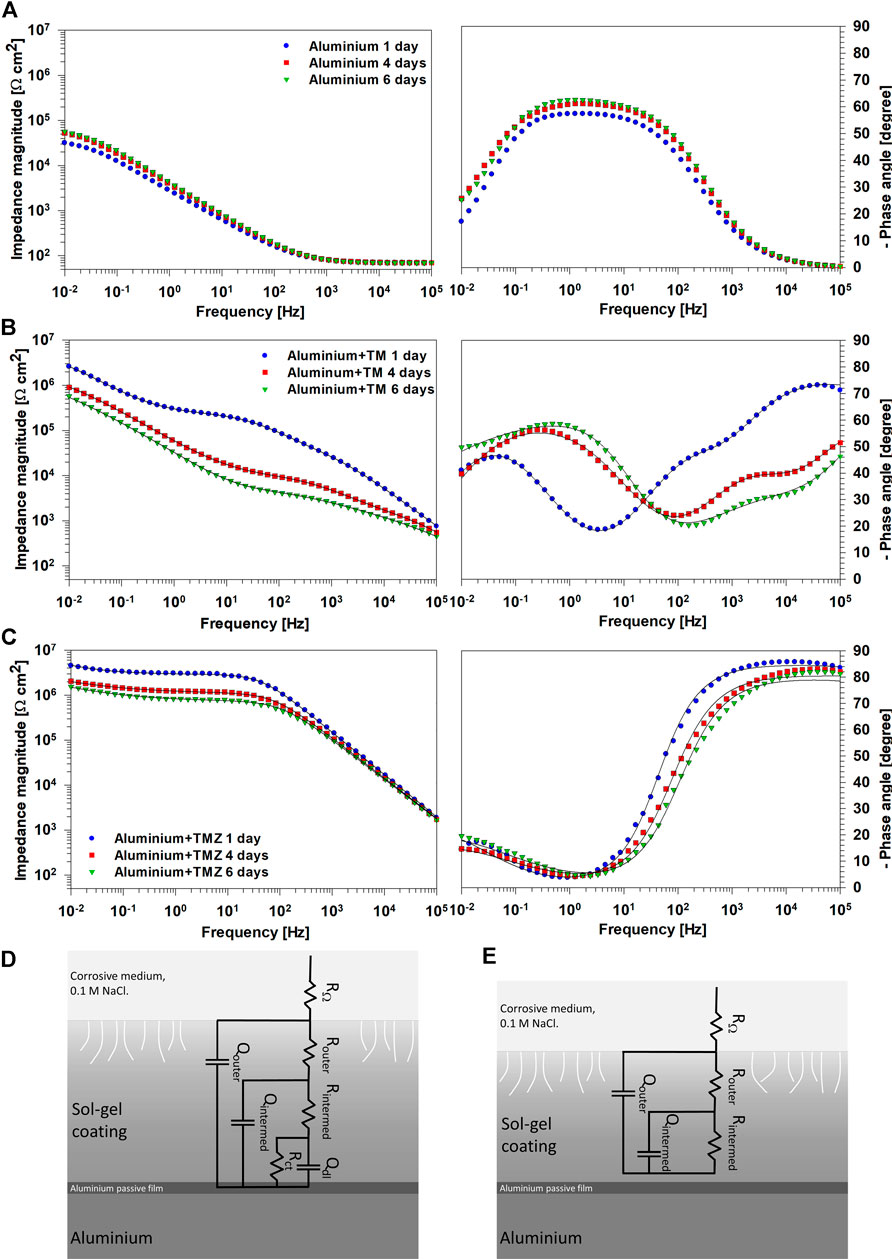
FIGURE 6. EIS spectra presented as Bode plots of (left) impedance magnitude and (right) phase angle for (A) uncoated ground aluminium and coated with (B) TM and (C) TMZ coatings recorded at selected immersion times (1, 4, and 6 days) in 0.1 M NaCl solution. (B,C) Symbols represent experimental data and lines the fitted curves. The electrical equivalent circuits (EECs) used to fit EIS data are presented: (D) TM coating and (E) TMZ coating.
Aluminium coated with TM and TMZ coatings showed different Bode plots from the uncoated aluminium substrate, Figures 6B,C. In the Bode plots for TM coating, three distinct regions are observed: the high-frequency range is related to the outer part of the coating at the coating/electrolyte interface, the intermediate frequency range is related to the inner part of the coating and the intermediate oxide-based layer formed between Al substrate and sol-gel coating (natural aluminium oxide layer with Al−O−Al and Al−O−Si bonds at the substrate coating interface, Figure 4), and the low-frequency range is related to corrosion process at the defects of the inner metal sol-gel coating interface. Up to 1 day of immersion, TM coating acted as a barrier, as evidenced by increased |Z|0.01 mHz for over one order of magnitude compared to uncoated aluminium. After 4 and 6 days of immersion, the impedance magnitude decreased in the whole frequency range. Despite a stable and dense interface, some pores and pathways were formed in the coating enabling the electrolyte to ingress to the substrate. This process was also reflected in the shape of the middle-frequency part. In the ϕ vs. f plot, signs of corrosion at the inner substrate/coating interface (low frequency) were visible at the same time (Figure 6B). On the high-frequency side, reflecting the coating capacitance, the value of ϕ also decreased, indicating deterioration of the TM coating that progressed at longer immersion times.
In contrast to TM coating, the EIS response of TMZ coating shows improved corrosion protection expressed by a more extended plateau of constant impedance modulus in the low- and middle-frequency part, Figure 6C. After 1 day of immersion, the |Z|0.01 mHz of TMZ coating is not significantly greater than that of TM coating (4.3 MΩ cm2 compared to 2.6 MΩ cm2, respectively), but the plateau of constant impedance was extended up to 102 Hz frequencies. At higher frequencies, it decreased linearly, indicating the high capacitive character of the coating. This is also reflected in the Bode ϕ vs. f plot where values close to −90° were obtained, stretching over a high-frequency range and indicating the coating’s highly capacitive character. The |Z|0.01 mHz slightly decreased in the course of immersion (to 1.5 MΩ cm2 after 6 days), and the phase angle values shifted to higher frequencies. However, the extent of the impedance plateau remained unchanged, indicating that the degradation processes did not significantly affect the coating’s structure and, in turn, the corrosion rate of the underlying Al substrate. This confirmed that the Si/Zr-based hybrid sol-gel TMZ coating imparts good corrosion protection and represents an effective corrosion barrier for the underlying Al substrate in the tested medium. Such behaviour was related to greater condensation of the sol-gel solution containing Zr, which had been confirmed with real-time FTIR, Figure 3.
The impedance data for TM and TMZ coatings were fitted using the conventional approach for sol-gel coatings (Harb et al., 2020; dos Santos et al., 2021), used also in our previous study (Rodič et al., 2018a). Electrical equivalent circuit (EECs) with three-time constants was used for TM coating and with two-time constants for TMZ coatings, following different shapes of experimental EIS spectra (Figures 6D,E). The RΩ is the electrolyte resistance. Router and Qouter represent the coating resistance and the pseudo-capacitance of the outer part of the sol-gel coating, closer to the electrolyte interface. Rintermed and Qintermed represent the coating resistance and the pseudo-capacitance of the intermediate part of the coating. Rct and Qdl represent the inner layer of the coating, close to the interface between aluminium oxide layer and aluminium substrate. It reflects the charge transfer resistance and the double layer interfacial capacitance describing the faradaic reaction at the metal/electrolyte interface (Rodič et al., 2018a). Rct occurs as a result of electrolyte penetration through the pores or defects in the sol-gel coating during immersion in NaCl solution. For TM coating, the EEC includes three elements, (R and Q)coat, (R and Q)intermed and (Rct and Qdl) since the progressive deterioration of the layer was observed during immersion in NaCl solution (Figures 6B,D). In contrast, TMZ coating was described using the EEC with two elements (R and Q)outer and (R and Q)intermed, Figures 6C,E, since the progressive deterioration of the layer was not observed during immersion, or it was much less compared to that of TM coating (Figure 6B). The sum of Rintermed and Rct equals polarization resistance (Rp) (Scully, 2000). Supplementary Table S1 depicts the impedance parameters obtained by fitting. For TM coating, the resistance values increased from the outer towards the inner parts of the coating, reflecting the presence of pore and defects in the outer part which serve as pathways for electrolyte penetration. The inner part of the coating, ranging in MΩ cm2, is responsible for the resistance of the coating since that of the outer part is in the range of kΩ cm2. For the TMZ coating also the outer part of the coating exhibits resistance ranging in MΩ cm2. This is due to the presence of Zr in addition to that of Si in the coating structure and higher degree of condensation, as shown by FTIR results (Figures 2, 3). Consequently, Rp values of TM coatings decreased from 6.46 to 1.98 MΩ cm2 during immersion, and those of TMZ coating from 8.35 to 4.82 MΩ⋅cm2 (Supplementary Table S1). Therefore, after 6 days of immersion in 0.1 M NaCl, TMZ coating exhibited more than doubled the value of polarization resistance compared to that of TM coating.
X-Ray Photoelectron Spectroscopy
XPS was used to provide information about the elemental composition and chemical state of the TM and TMZ coating surface before and after selected immersion times in 0.1 M NaCl (1, 4, and 6 days), Figures 7–10. Figure 7 shows the high energy resolution XPS Si 2p, C 1s and O 1s spectra of TM coating for the main constituting elements silicon, carbon and oxygen. The C 1s and Si 2p spectra were convoluted according to the procedure published in our previous paper (Hamulić et al., 2020) and in the literature (Hammer et al., 2012; Harb et al., 2020). First, we consider the spectra before immersion, i.e., of as-prepared coating. The Si 2p peak is considered a non-resolved doublet peak due to a small difference between the binding energies of the 2p3/2 and 2p1/2 peaks. The centre of the Si 2p peak is located at 102.3 eV. For siloxane coatings, the position of the centre of the Si 2p peak is dependent on the number of oxygen atoms bonded to the silicon atom: 101.5 eV for R3−Si−O1, 102.1 eV for R2−Si−O2, 102.8 eV for R1−Si−O3, and 103.4 eV for SiO4, where R is an organic group of the siloxane (Alexander et al., 1999; O’Hare et al., 2004). Estimating from the position of the peak centre, the chemical composition of the coatings refers to R3−Si−O1 and/or R2−Si−O2, which is aligned with results from FTIR spectra, Figure 4. The Si 2p spectra were deconvoluted using two single peaks, at 101.4 eV associated with chemical environment R3−Si−O1 and 102.1 eV associated with R2−Si−O2 chemical environment. The R2−Si−O2 peak predominates. The centre of the O 1s peak is located at 531.7 eV. Its position is also dependent on the composition and shifts to higher binding energies with the increasing number of oxygen atoms bound to silicon, e.g., at 532.0 eV for R3−Si−O1, 532.1 eV for R2−Si−O2, 532.5 eV for R1−Si−O3, and 532.6 eV for SiO4 (O’Hare et al., 2004). The position of the peak is aligned with the formation of R1−Si−O3. The C 1s spectrum is dominated by the peak centred at 285 eV and a smaller peak at higher binding energy. Three components can be distinguished: C–C/C–H (285.0 eV), C–O (286.6 eV) and C=O (288.2 eV). The C–O and C=O peaks correspond to the acrylate group in the MAPTMS initial monomer, whereas C–C/C–H is related to adventitious carbon and aliphatic carbon in the sol-gel network. No peaks related to aluminium were detected, proving that the substrate was fully coated with TM coating, which is much thicker than the depth of the XPS analysis.
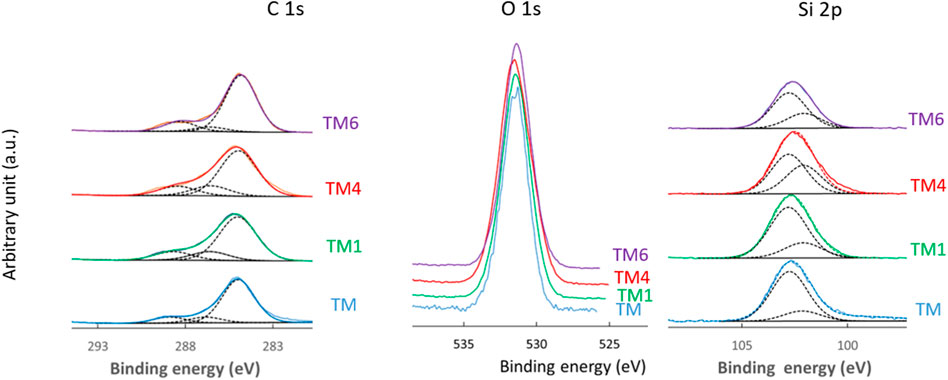
FIGURE 7. High-resolution XPS C 1s, O 1s and Si 2p spectra of aluminium coated with TM coatings before immersion and after selected immersion times in 0.1 M NaCl (TM1 after 1 day, TM4 after 4 days and TM6 after 6 days). The C 1s and Si 2p spectra were deconvoluted using component peaks as described in the text: C−C/C−H, C−O and C=O, and R3−Si−O1 (101.4 eV) and R2−Si−O2 (102.1 eV) chemical environment, respectively.
The coating contains 54 at % of C, 35.3 at % of O and 10.7 at % of Si, Table 2. In Table 3 the atomic ratios determined from experimental XPS spectra are compared to stoichiometric atomic ratios determined from chemical formulae of sol-gel precursors TEOS and MAPTMS. The experimental ratios for TM coating are lower than the stoichiometric ratios in TEOS and MAPTMS, indicating that the network formed is the combination of both precursors and has a complex structure.
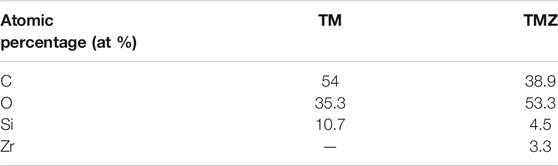
TABLE 2. Composition of TM and TMZ coatings given in atomic percentage (at%) determined from high energy resolution XPS spectra before immersion in corrosive medium (as-prepared condition).
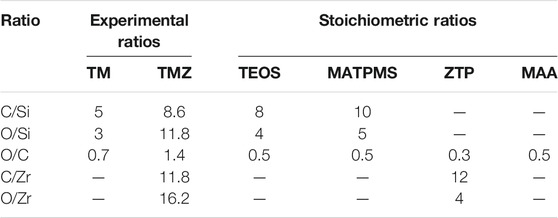
TABLE 3. Experimental atomic ratios of TM and TMZ coatings determined from high energy resolution XPS spectra before immersion in corrosive medium and stoichiometric ratios determined from chemical formulae of sol-gel precursors TEOS, MAPTMS, ZTP and MAA.
XPS analysis was further carried out on samples after immersion in 0.1 M NaCl for up to 6 days. The Si 2p, O 1s and C 1s spectra are similar before and after the selected immersion times, confirming no major changes in the coating composition during immersion, Figure 7. Characteristic atomic ratios deducted from XPS data at different immersion times are presented in Supplementary Table S2. The C/Si and O/Si ratios do not change markedly with immersion. However, interesting changes are observed in minor peaks, Cl 2p, Na 1s and Al 2p, Figure 8. The spectra of the as-prepared coating did not show any peak for Cl, Na, and Al, Table 4, whereas after immersion, characteristic peaks for Cl 2p, Na 1s and Al 2p are detected. Two peaks can be distinguished in Cl 2p spectra: a peak at 201.7 eV related to the formation of oxychloride and a peak at 198.8 eV related to the formation of salt, respectively. The intensity of Cl 2p and Na 1s peaks, and, consequently, the content of these species on the surface, increases with time, from only 0.1 at % after 1 day up to 0.3 after 6 days of immersion, Table 4. The same trend is observed for the intensity of the Al 2p peak. Figure 8 indicates that the coated surface was no longer fully covered or that the coating was deteriorated, allowing the passage of dissolved Al ions from the substrate through the coating. The formation of corrosion products at the coating surface agreed with EIS data, Figure 6. The most likely explanation is that the corrosion products originate from aluminium, progressing from the interior through the coating up to its surface. This confirms the limited barrier properties of TM coating. The concentration of corrosion products is probably the highest at the metal/coating interface, which, however, could not be reached using the XPS due to the micrometre range of coating thickness.
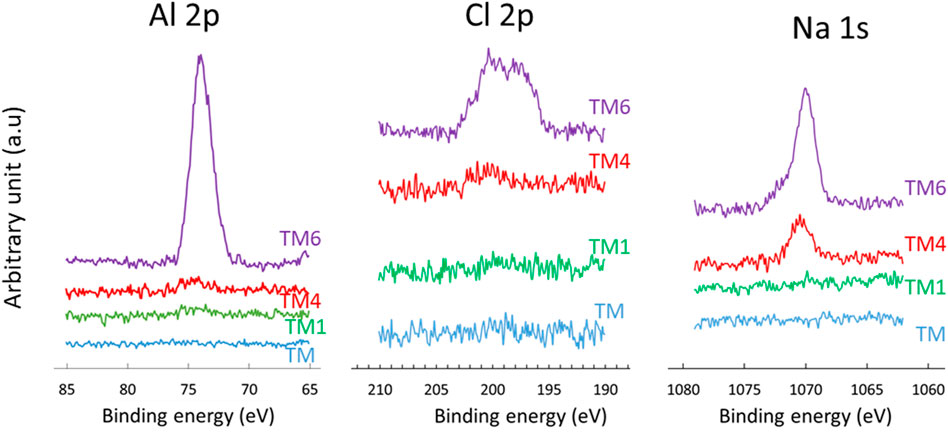
FIGURE 8. High-resolution XPS Al 2p, Cl 2p and Na 1s spectra of aluminium coated with TM coating before immersion and after selected immersion times in 0.1 M NaCl (TM1 after 1 day, TM4 after 4 days and TM6 after 6 days). Spectra were not normalized on the intensity scale.
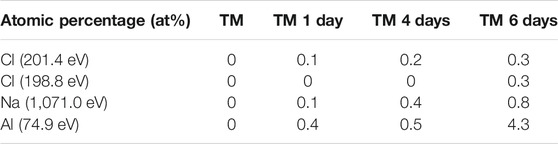
TABLE 4. The content of Cl (from Cl 2p peaks), Na (from Na 1s peak) and Al (from Al 2p peaks), given in atomic percentage (at %), determined from high energy resolution XPS spectra for TM coating before and after immersion for selected times in 0.1 M NaCl solution (1, 4, and 6 days).
The high energy resolution XPS spectra of TMZ coating show the presence of characteristic peaks of Si 2p, Zr 3d, C 1s and O 1s, Figure 9. Hence, in addition to silicon, carbon and oxygen as in TM coating, TMZ contains also zirconium, in agreement with FTIR results, Figure 4B. The centre of the Si 2p peak is located at 102.3 eV, confirming the formation of a silica-siloxane network like in the TM coating. The Si 2p spectra were deconvoluted using two single peaks, associated with chemical environment R3−Si−O1 (101.4 eV) and R2−Si−O2 (102.4 eV). As in the case of TM coating, the latter predominates. It is interesting to note that the intensity of the component associated with R3−Si−O1 compared to that associated with R2−Si−O2 is higher in TMZ coating compared to TM coating. TMZ coating presents more C−Si−O bonds than TM coatings. The position of C 1s and O 1s peaks is similar to TM coating. The Zr 3d spectra were deconvoluted using two doublet peaks, at 182.9 eV/185.3 eV, associated to Zr(IV) in ZrO2 and 181.8 eV/184.2 eV associated to Zr suboxides following the structure presented in Figure 4B. For the as-prepared coating, the Zr(IV) peak predominates indicating that the majority of zirconium is bonded to oxygen (Naumkin et al., 2000).
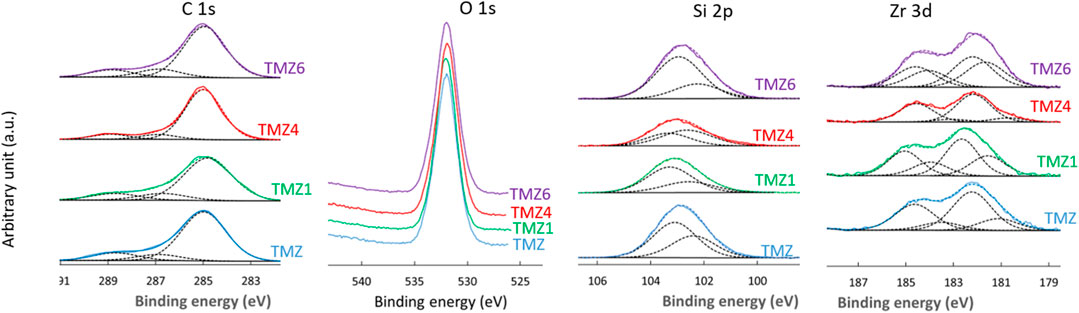
FIGURE 9. High-resolution XPS C 1s, O 1S, Si 2p and Zr 3d spectra of aluminium coated with TMZ coatings before immersion and after selected immersion times in 0.1 M NaCl (TMZ1 after 1 day, TMZ4 after 4 days and TMZ6 after 6 days). The C 1s, Si 2p and Zr 3d spectra were deconvoluted using component peaks as described in the text: C−C/C−H, C−O and C=O, and R3−Si−O1 (101.4 eV) and R2−Si−O2 (102.1 eV) chemical environment, and Zr(IV) at 182.9 eV/185.3 eV and Zr suboxides at 181.8 eV/184.2 eV, respectively.
The composition of the TMZ coating determined from XPS spectra decomposition is given in Table 2. The amount of Zr in TMZ coating is rather low, but due to chelating with MAA, the addition of Sol 2 changes the ratio between C/Si, O/Si, resulting in higher values compared to TM coating, Table 3. The ratios C/Zr and O/Zr were again not in agreement with stoichiometric values of the precursors, which confirms the complex structure of the formed coating.
Similar to TM, there was no aluminium on the coating surface, indicating full and homogeneous coverage of the substrate by the TMZ coating, Figure 10. The surface also did not contain Cl and Na. However, in contrast to the TM coating, peaks related to Cl, Na and Al were not detected even after prolonged immersion in NaCl, proving much better barrier properties of TMZ coating compared to TM coating. The ratios C/Si, C/Zr and O/Zr were not markedly changed, Supplementary Table S3.
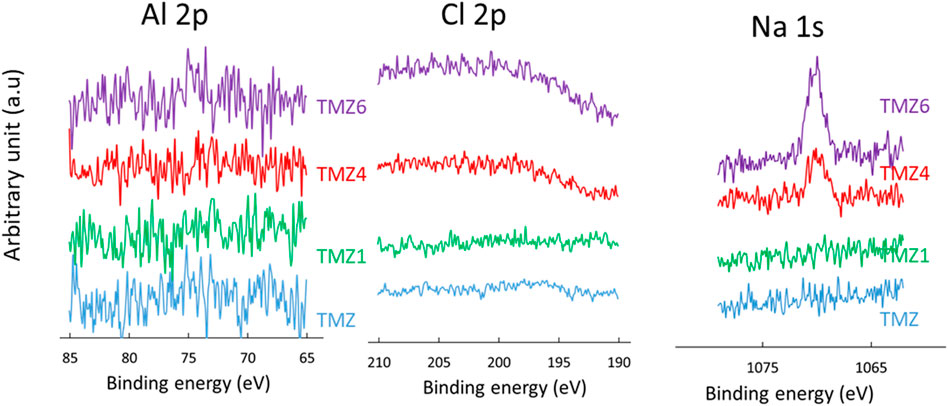
FIGURE 10. High-resolution XPS Al 2p, Cl 2p and Na 1s spectra of aluminium coated with TMZ coating before immersion and after selected immersion times (TMZ1 after 1 day, TMZ4 after 4 days and TMZ6 after 6 days). Spectra were not normalized on the intensity scale.
Salt-Spray Chamber Testing
The ground aluminium samples without and with TM and TMZ coatings were tested under accelerated conditions in the saline environment using the standardised salt-spray chamber testing. Usually, specifications of a corrosive protective system require resistance of at least 500 h under the tested conditions. The surface appearances before and after various exposure times are shown in Figure 11. The conditions in the salt spray chamber are much more aggressive (higher concentration of NaCl, 5 wt%, and higher temperature of 35°C, humidity) compared to the immersion test evaluated by EIS (0.1 M NaCl, ambient temperature). In addition, coated samples exposed to salt spray were cross-scribed before testing to directly expose the Al substrate to the corrosive electrolyte and initiate corrosion reactions within the defect region.
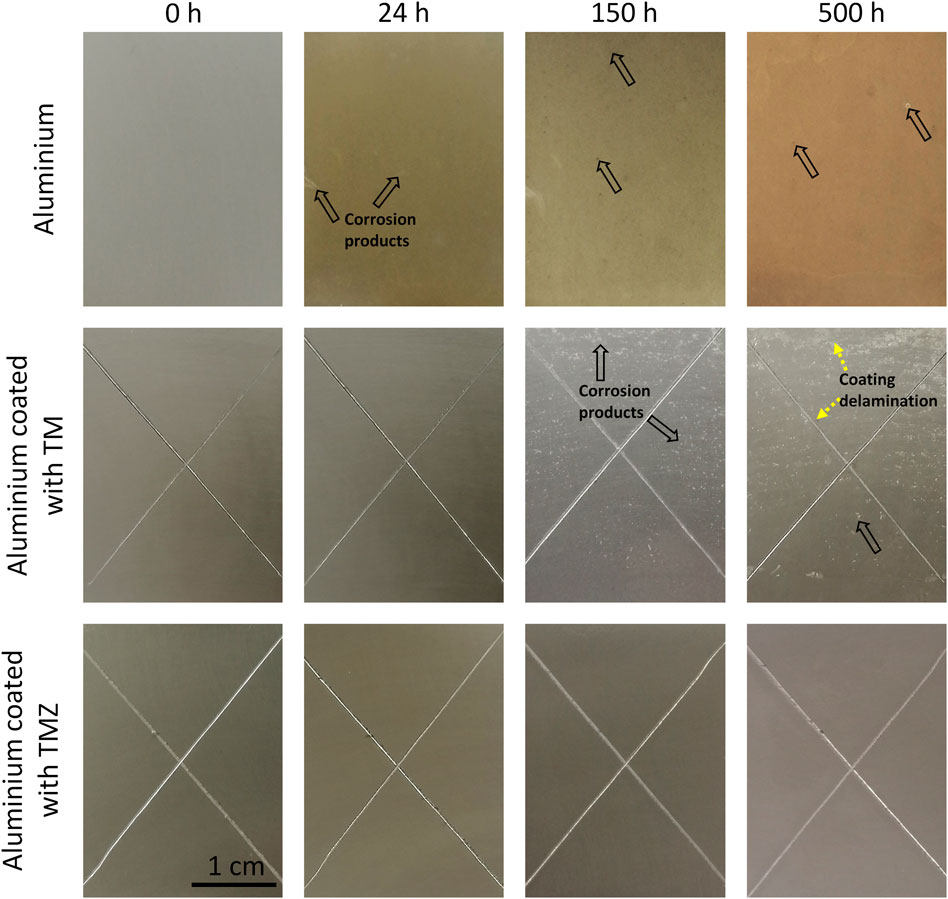
FIGURE 11. The surface appearance of ground aluminium and coated with TM and TMZ coatings at various exposure times in salt-spray chamber. The arrows mark the spots where corrosion starts on aluminium and aluminium coated with TM. The X-cross scribe was made before exposure to salt spray. Testing was in 5 wt% NaCl at 37°C according to the standard ASTM B117.
Ground aluminium was susceptible to corrosion during testing. After 24 h, several spots of dark-grey corrosion products and white corrosion spots covered almost the whole surface. Corrosion progressed with exposure time and, after 150 h, the aluminium surface was completely covered with a thick film of corrosion products. After 500 h, large spots of accumulated corrosion products are seen on the Al surface.
The samples coated with TM and TMZ showed superior corrosion resistance compared to uncoated aluminium. Both samples remained virtually unchanged in the first 24 h. After longer exposure (150 h), the difference in the surface appearance of aluminium coated with TM and TMZ coating became more pronounced. Although not visible by SEM (Figure 5), the TM sol-gel coating inherently contains microscopic pores, which are conductive pathways for the diffusion of water, oxygen and ions into the coating matrix. Corrosion products were formed in the area coated with TM coating because the low barrier properties of the coating allow the electrolyte to diffuse through the coating and reach aluminium, which started to corrode. But still, some parts of the aluminium surface coated with TM remained efficiently protected, without delamination of the coating or serious damage. After 500 h, however, the amounts of corrosion products increased and covered almost the whole surface.
At some spots, the delamination of the TM coating was noticed, especially in the intersection of the scribe. Two parallel anodic (dissolution of aluminium, Al → Al3+ + 3e–) and cathodic (oxygen reduction, 2H2O + O2 + 4e– → 4OH−) reactions occur. The produced hydroxyl (OH−) ions increase the pH locally and provide an alkaline environment beneath the coating. High pH is not suitable for the organic coating since it causes the hydrolysis and deterioration of the bonds between the sol-gel coating and aluminium surface. As a result, the coating delaminates and blisters are formed.
On the other hand, the aluminium surface covered with TMZ was without any damage or pits even after 500 h of immersion. Efficient barrier protection of the coating does not allow any penetration of the electrolyte through the coating. The TMZ coating protects the aluminium even along the X-cross scribed surface. No delamination of the coating was noticed around the scribe, despite the local increase of the pH due to the oxygen reduction reaction. Such behaviour can be explained with better alkaline resistance of the TMZ coating due to the presence of the zirconium (Rodič et al., 2018b).
Based on the performed testing, it can be concluded that the barrier corrosion performance was more durable if the aluminium surface was coated with TMZ.
Conclusion
Two types of acrylic hybrid coatings, one containing only Si and the other both Si and Zr, were synthesised. Real-time FTIR data showed the important differences in the formation of acrylic coatings based on Si and on Si and Zr, the main differences being the intensity of the bands ascribed to Si–O–Si in Si-based coating and Si–O–Si, Zr–O–Zr and Si–O–Zr bonding in Si/Zr-based coating. The SEM images of the top view confirmed that both sol-gel coatings formed a continuous, smooth surface without any cracks. The coatings were 2–3 μm thick without any visible pores or defects. The EIS analyses reflected that both coatings provided barrier properties at the beginning of immersion in 0.1 M NaCl solution. However, after prolonged immersion, the Si/Zr-based coating still provided barrier protection, whereas the Si-based coating lost barrier properties after a few days of immersion. The degradation of the coatings was additionally confirmed by XPS analysis. The comparison of the high-resolution XPS spectra of Si/Zr-based coating before and after immersion confirmed unchanged spectra of Si, O, C and Zr. On the other hand, XPS spectra of the Si-based coatings show the presence of corrosion products of aluminium (peaks for Al and Cl detected), which diffused through the coating. The difference in the corrosion resistance of both coatings was also confirmed in the salt spray chamber, where the Si/Zr-based coating remained stable for more than 500 h.
The presented results provide a valuable demonstration of the correlation between EIS and XPS data and are crucial to showing the evidence of distribution of the aluminium corrosion products and coating degradation. Better barrier corrosion protection and lower coating degradation on the aluminium surface were achieved with a Si/Zr-based hybrid coating. It is noteworthy that the aim of this study was the comparison between Si and Si/Zr based coatings and not the optimization of the coating, which would provide the highest corrosion protection. In our previous publications, it was reported that optimized TMZ coatings can achieve high corrosion protection (Rodič et al., 2014a; Rodič et al., 2014b; Rodič et al., 2018b). Therefore, TMZ coatings prepared under optimized conditions can be considered an important candidate for the replacement of chromate-based treatments for Al-based materials.
Data Availability Statement
The raw data supporting the conclusions of this article will be made available by the authors, without undue reservation upon request.
Author Contributions
PR conceptualisation, experimental work (FTIR, EIS), data analysis and writing; SZ experimental work (XPS) and data analysis; IM conceptualisation, writing and editing, PM conceptualisation, writing and editing. All authors have read and agreed to the published version of the manuscript.
Funding
This work is a part of M-ERA.NET project entitled “Design of corrosion resistant coatings targeted for versatile applications” (acronym COR_ID). The financial support of the project by MESS (Ministry of Education, Science and Sport of Republic of Slovenia) and ANR (The French National Research Agency) is acknowledged. This work is also a part of the bilateral Proteus programme between Slovenia and France. The project entitled “DCOIN: Distentagling Corrosion and its Inhibition” was financed by Slovenian Research Agency (ARRS) and The French National Research Agency (ANR) (grant No. BI-FR/BI-FR/21-22). Financial support from the Slovenian Research Agency (research core funding Nos. P2-0393 and P1-0134) is acknowledged.
Conflict of Interest
The authors declare that the research was conducted in the absence of any commercial or financial relationships that could be construed as a potential conflict of interest.
The handling editor declared a past collaboration with one of the authors IM.
Publisher’s Note
All claims expressed in this article are solely those of the authors and do not necessarily represent those of their affiliated organizations, or those of the publisher, the editors and the reviewers. Any product that may be evaluated in this article, or claim that may be made by its manufacturer, is not guaranteed or endorsed by the publisher.
Acknowledgments
The authors acknowledge The Centre of Excellence for Integrated Approaches in Chemistry and Biology of Proteins (CIPKeBiP), Ljubljana, Slovenia, to access scientific equipment (real-time FTIR). The authors also acknowledge the Centre of Excellence in nanoscience and nanotechnology−Nanocentre, Ljubljana, Slovenia to access the scientific equipment (SEM/EDXS/FIB). The authors acknowledge Barbara Kapun, BSc, for performing FIB/SEM analysis.
Supplementary Material
The Supplementary Material for this article can be found online at: https://www.frontiersin.org/articles/10.3389/fmats.2021.756447/full#supplementary-material
References
Abdolah Zadeh, M., van der Zwaag, S., and Garcia, S. J. (2013). Routes to Extrinsic and Intrinsic Self-Healing Corrosion Protective Sol-Gel Coatings: a Review. Self-heal. Mater. 1, 1–18. doi:10.2478/shm-2013-0001
Alexander, M. R., Short, R. D., Jones, F. R., Michaeli, W., and Blomfield, C. J. (1999). A Study of HMDSO/O2 Plasma Deposits Using a High-Sensitivity and -energy Resolution XPS Instrument: Curve Fitting of the Si 2p Core Level. Appl. Surf. Sci. 137, 179–183. doi:10.1016/S0169-4332(98)00479-6
Bae, J.-Y., Yang, S., Jin, J. H., Jung, K., Kim, J.-S., and Bae, B.-S. (2011). Fabrication of Transparent Methacrylate Zirconium Siloxane Hybrid Materials Using Sol-Gel Synthesized Oligosiloxane Resin. J. Sol-gel Sci. Technol. 58, 114–120. doi:10.1007/s10971-010-2363-x
Brinker, C. J., and Scherer, G. W. (1990). Sol-gel Science: The Physics and Chemistry of Sol-Gel Processing London: Academic Press, Inc..
Costenaro, H., Lanzutti, A., Paint, Y., Fedrizzi, L., Terada, M., de Melo, H. G., et al. (2017). Corrosion Resistance of 2524 Al alloy Anodized in Tartaric-Sulphuric Acid at Different Voltages and Protected with a TEOS-GPTMS Hybrid Sol-Gel Coating. Surf. Coat. Tech. 324, 438–450. doi:10.1016/j.surfcoat.2017.05.090
Cullen, M., Kaworek, A., Mohan, J., Duffy, B., and Oubaha, M. (2021). An Investigation into the Role of the Acid Catalyst on the Structure and Anticorrosion Properties of Hybrid Sol-Gel Coatings. Thin Solid Films 729, 138703. doi:10.1016/j.tsf.2021.138703
Cullen, M., Morshed, M., O’Sullivan, M., MacHugh, E., Duffy, B., and Oubaha, M. (2017). Correlation between the Structure and the Anticorrosion Barrier Properties of Hybrid Sol-Gel Coatings: Application to the protection of AA2024-T3 Alloys. J. Sol-gel Sci. Technol. 82, 801–816. doi:10.1007/s10971-017-4349-4
Cullen, M., O’Sullivan, M., Kumar, A. M., Sorour, A. A., Duffy, B., and Oubaha, M. (2018). The Role of the Hydrolysis and Zirconium Concentration on the Structure and Anticorrosion Performances of a Hybrid Silicate Sol-Gel Coating. J. Sol-gel Sci. Technol. 86, 553–567. doi:10.1007/s10971-018-4657-3
Davis, J. R. (1999). Corrosion of Aluminum and Aluminum Alloys. Novelty, Ohio: The United States of America: ASM International.
del Olmo, R., Tiringer, U., Milošev, I., Visser, P., Arrabal, R., Matykina, E., et al. (2021). Hybrid Sol-Gel Coatings Applied on Anodized AA2024-T3 for Active Corrosion protection. Surf. Coat. Tech. 419, 127251. doi:10.1016/j.surfcoat.2021.127251
dos Santos, F. C., Pulcinelli, S. H., Santilli, C. V., and Hammer, P. (2021). Protective PMMA-Silica Coatings for Aluminum Alloys: Nanostructural Control of Elevated thermal Stability and Anticorrosive Performance. Prog. Org. Coat. 152, 106129. doi:10.1016/j.porgcoat.2020.106129
ECHA European Chemicals Agency (2016). Chromium VI Compounds - ANNEX XVII TO REACH - Conditions of Restrictions. Available at: https://echa.europa.eu.
Féron, D. (2007). “European Federation of Corrosion (EFC) Publications: Series Introduction,” in Corrosion Behaviour and Protection of Copper and Aluminium Alloys in Seawater (Cambridge, England: Woodhead Publishing Ltd), xiii–xiv. Available at: http://www.sciencedirect.com/science/article/pii/B9781845692414500150 (Accessed April 15, 2015).
Figueira, R. B. (2020). Hybrid Sol-Gel Coatings for Corrosion Mitigation: A Critical Review. Polymers 12, 689. doi:10.3390/polym12030689
Gharbi, O., Thomas, S., Smith, C., and Birbilis, N. (2018). Chromate Replacement: what Does the Future Hold? Npj Mater. Degrad. 2, 1–8. doi:10.1038/s41529-018-0034-5
Gorin, A., Copperwhite, R., Elmaghrum, S., McDonagh, C., and Oubaha, M. (2011). Hybrid Zirconium Sol-Gel Thin Films with High Refractive Index. Proc. SPIE 8191, 81911Q-1–81911Q–7. doi:10.1117/12.900813
Hagans, P. L., and Haas, C. M. (1994). “Chromate Conversion Coatings,” in Surface Engineeringings ASM Handbook (Cleveland, Ohio, USA: ASM International), 405–411.
Hammer, P., dos Santos, F. C., Cerrutti, B. M., Pulcinelli, S. H., and Santilli, C. V. (2012). Highly Corrosion Resistant Siloxane-Polymethyl Methacrylate Hybrid Coatings. J. Sol-gel Sci. Technol. 63, 266–274. doi:10.1007/s10971-011-2672-8
Hamulić, D., Rodič, P., Poberžnik, M., Jereb, M., Kovač, J., and Milošev, I. (2020). The Effect of the Methyl and Ethyl Group of the Acrylate Precursor in Hybrid Silane Coatings Used for Corrosion Protection of Aluminium Alloy 7075-T6. Coatings 10, 172. doi:10.3390/coatings10020172
Harb, S. V., Trentin, A., Uvida, M. C., Magnani, M., Pulcinelli, S. H., Santilli, C. V., et al. (2020). A Comparative Study on PMMA-TiO2 and PMMA-ZrO2 Protective Coatings. Prog. Org. Coat. 140, 105477. doi:10.1016/j.porgcoat.2019.105477
Henley, V. F. (2013). Anodic Oxidation of Aluminium and its Alloys: The Pergamon Materials Engineering Practice Series. Headington, Oxford, England: Elsevier.
Hinton, B. R. W., Arnott, D. R., and Ryan, N. E. (1986). Cerium Conversion Coatings for the Corrosion Protection of Aluminium. Mater. Forum 9, 162–173.
Liu, J., Chaudhury, M. K., Berry, D. H., Seebergh, J. E., Osborne, J. H., and Blohowiak, K. Y. (2006). Effect of Surface Morphology on Crack Growth at a Sol-Gel Reinforced Epoxy/Aluminum Interface. J. Adhes. 82, 487–516. doi:10.1080/00218460600713725
Milošev, I., and Frankel, G. S. (2018). Review-Conversion Coatings Based on Zirconium And/or Titanium. J. Electrochem. Soc. 165, C127–C144. doi:10.1149/2.0371803jes
Naumkin, A. V., Kraut-Vass, A., Powell, C. J., and Gaarenstroom, S. W. (2000). NIST X-ray Photoelectron Spectroscopy (XPS) Database. Version 3.5. Available at: https://srdata.nist.gov/xps/(Accessed May 6, 2018).
O'Hare, L.-A., Parbhoo, B., and Leadley, S. R. (2004). Development of a Methodology for XPS Curve-Fitting of the Si 2p Core Level of Siloxane Materials. Surf. Interf. Anal. 36, 1427–1434. doi:10.1002/sia.1917
Osborne, J. H. (2001). Observations on Chromate Conversion Coatings from a Sol-Gel Perspective. Prog. Org. Coat. 41, 280–286. doi:10.1016/S0300-9440(01)00143-6
Oubaha, M., Varma, P. C. R., Duffy, B., Gasem, Z. M., and Hinder, S. J. (2014). Development of a Novel Hybrid Aluminum-Based Sol-Gel Materials: Application to the Protection of AA2024-T3 Alloys in Alkaline Environment. Ampc 04, 75–84. doi:10.4236/ampc.2014.45010
Padinchare Covilakath, R. V., Cassidy, J., Oubaha, M., McDonagh, C., Colreavy, J., and Duffy, B. (2010a). Corrosion Protection Properties of Various Ligand Modified Organic Inorganic Hybrid Coating on AA 2024-T3. ECS Trans. 24, 231–246. doi:10.1149/1.3453619
Qi, J.-T., Hashimoto, T., Walton, J. R., Zhou, X., Skeldon, P., and Thompson, G. E. (2015). Trivalent Chromium Conversion Coating Formation on Aluminium. Surf. Coat. Tech. 280, 317–329. doi:10.1016/j.surfcoat.2015.09.024
Rodič, P., Iskra, J., and Milošev, I. (2014a). A Hybrid Organic-Inorganic Sol-Gel Coating for Protecting Aluminium alloy 7075-T6 against Corrosion in Harrison's Solution. J. Sol-gel Sci. Technol. 70, 90–103. doi:10.1007/s10971-014-3278-8
Rodič, P., Iskra, J., and Milošev, I. (2014b). Study of a Sol-Gel Process in the Preparation of Hybrid Coatings for Corrosion protection Using FTIR and 1H NMR Methods. J. Non-Crystalline Sol. 396-397, 25–35. doi:10.1016/j.jnoncrysol.2014.04.013
Rodič, P., Kapun, B., Panjan, M., and Milošev, I. (2020). Easy and Fast Fabrication of Self-Cleaning and Anti-icing Perfluoroalkyl Silane Film on Aluminium. Coatings 10, 234. doi:10.3390/coatings10030234
Rodič, P., Katić, J., Korte, D., Desimone, P., Franko, M., Ceré, S., et al. (2018a). The Effect of Cerium Ions on the Structure, Porosity and Electrochemical Properties of Si/Zr-Based Hybrid Sol-Gel Coatings Deposited on Aluminum. Metals 8, 248–268. doi:10.3390/met8040248
Rodič, P., Mertelj, A., Borovšak, M., Benčan, A., Mihailović, D., Malič, B., et al. (2016). Composition, Structure and Morphology of Hybrid Acrylate-Based Sol-Gel Coatings Containing Si and Zr Composed for Protective Applications. Surf. Coat. Tech. 286, 388–396. doi:10.1016/j.surfcoat.2015.12.036
Rodič, P., and Milošev, I. (2016). Corrosion Inhibition of Pure Aluminium and Alloys AA2024-T3 and AA7075-T6 by Cerium(III) and Cerium(IV) Salts. J. Electrochem. Soc. 163, C85–C93. doi:10.1149/2.0431603jes
Rodič, P., and Milošev, I. (2014). Corrosion Properties of UV Cured Hybrid Sol-Gel Coatings on AA7075-T6 Determined under Simulated Aircraft Conditions. J. Electrochem. Soc. 161, C412–C420. doi:10.1149/2.1091409jes
Rodič, P., and Milošev, I. (2015). Electrochemical and Salt Spray Testing of Hybrid Coatings Based on Si and Zr Deposited on Aluminum and its Alloys. J. Electrochem. Soc. 162, C592–C600. doi:10.1149/2.0801510jes
Rodič, P., Milošev, I., Lekka, M., Andreatta, F., and Fedrizzi, L. (2018b). Corrosion Behaviour and Chemical Stability of Transparent Hybrid Sol-Gel Coatings Deposited on Aluminium in Acidic and Alkaline Solutions. Prog. Org. Coat. 124, 286–295. doi:10.1016/j.porgcoat.2018.02.025
RoHS Directive (2021). RoHS Directive. Available at: https://ec.europa.eu/environment/topics_sl (Accessed April 28, 2021).
Scully, J. R. (2000). Polarization Resistance Method for Determination of Instantaneous Corrosion Rates. Corrosion 56, 199–218. doi:10.5006/1.3280536
Varma, P. C. R., Colreavy, J., Cassidy, J., Oubaha, M., Duffy, B., and McDonagh, C. (2009). Effect of Organic Chelates on the Performance of Hybrid Sol-Gel Coated AA 2024-T3 Aluminium Alloys. Prog. Org. Coat. 66, 406–411. doi:10.1016/j.porgcoat.2009.09.004
Varma, P. C. R., Colreavy, J., Cassidy, J., Oubaha, M., McDonagh, C., and Duffy, B. (2010b). Corrosion Protection of AA 2024-T3 Aluminium Alloys Using 3, 4-Diaminobenzoic Acid Chelated Zirconium-Silane Hybrid Sol-Gels. Thin Solid Films 518, 5753–5761. doi:10.1016/j.tsf.2010.05.088
Yu, M., Liang, M., Liu, J., Li, S., Xue, B., and Zhao, H. (2016). Effect of Chelating Agent Acetylacetone on Corrosion protection Properties of Silane-Zirconium Sol-Gel Coatings. Appl. Surf. Sci. 363, 229–239. doi:10.1016/j.apsusc.2015.12.013
Keywords: aluminium, hybrid sol-gel, corrosion protection, real-time FTIR, XPS, EIS
Citation: Rodič P, Zanna S, Milošev I and Marcus P (2021) Degradation of Sol-Gel Acrylic Coatings Based on Si and Zr Investigated Using Electrochemical Impedance, Infrared and X-Ray Photoelectron Spectroscopies. Front. Mater. 8:756447. doi: 10.3389/fmats.2021.756447
Received: 10 August 2021; Accepted: 30 September 2021;
Published: 08 November 2021.
Edited by:
Peyman Taheri, Delft University of Technology, NetherlandsReviewed by:
Marjorie Olivier, University of Mons, BelgiumAndressa Trentin, Alexander Dubcek University in Trencin, Slovakia
Copyright © 2021 Rodič, Zanna, Milošev and Marcus. This is an open-access article distributed under the terms of the Creative Commons Attribution License (CC BY). The use, distribution or reproduction in other forums is permitted, provided the original author(s) and the copyright owner(s) are credited and that the original publication in this journal is cited, in accordance with accepted academic practice. No use, distribution or reproduction is permitted which does not comply with these terms.
*Correspondence: Ingrid Milošev, ingrid.milosev@ijs.si