Relation between beluga whale aggregations and sea temperature on climate change forecasts
 Marga L. Rivas
 Emilio Guirado2†
  Zaida Ortega
- 1Department of Biology, The Institute of Marine Science (INMAR), University of Cadiz, Cadiz, Spain
- 2Multidisciplinary Institute for Environmental Studies, University of Alicante, Alicante, Spain
- 3Department of Biodiversity and Environmental Management, University of Leon, Leon, Spain
Climate change has been shown to alter the spatial distribution of whales and other marine mammals. Fast changing ocean temperatures may also affect the spatial distribution of whales at a finer scale, namely within populations, including aggregation behaviour. Our ability to analyze the impact of climate change on whale aggregation behavior, however, has been limited by our ability to collect spatial observation data over large areas. To overcome this limitation, this study analyzed open-access satellite imagery obtained between 2007 and 2020 in Canada, Russia, and Alaska using Deep Convolutional Neural Networks (CNN) to detect 1,980 beluga whales in 11 populations and to quantify their aggregation patterns within their populations. Subsequently, we examined the relationship between sea surface temperature (SST) and the intra-population spatial patterns of beluga whales during summer seasons, when these whales normally aggregate. We detected a negative correlation between SST and the frequency of beluga whale aggregation, suggesting that warming temperatures may impact beluga whale spatio-behavioral dynamics. Considering that the relative abundance of beluga whales is declining and the future SST projections in these Arctic Ocean locations, climate change may pose yet another threat to beluga whales and other ice-dependent species.
Introduction
Human activities are predicted to cause an increase of up to 5°C in the global average temperature by the end of the 21st century (IPCC, 2021). In addition, the global rise in temperatures is melting glaciers and ice accumulations (Geyman et al., 2022; Sirmacek and Vinuesa, 2022), which may lead to a significant reduction of Arctic ice extension and duration in future decades. This rapid and marked increase in warming ocean temperatures and melting sea ice is also leading to seasonal shifts in habitat use of some marine mammals (Insley et al., 2021), which could exacerbate the extinction risk of ice-associated species by population depletion. Furthermore, as the speed of environmental change is higher in marine systems than in terrestrial systems (Poloczanska et al., 2016), some species may be more vulnerable to this new climatic scenario than others (Simmonds & Isaac, 2007; Moore & Huntington, 2008). Traditionally, cetaceans living in remote areas have been monitored through aerial line transect surveys from planes, among others (e.g., DeMaster et al., 2001; Heide-Jørgensen et al., 2010). Cetacean aerial surveys imply in a significant amount of time and money and can lead to population underestimations if researchers cannot cover the whole distributional range of the studied species (Kaschner et al., 2012). Classifying freely available satellite imagery using artificial intelligence allows for low-cost identification and monitoring of large cetacean populations over time (Guirado et al., 2019). In addition, traditional methods to forecast species distributions over different time periods after aerial surveys usually comprise species distribution models (SDMs) (Bouchet et al., 2019), although predictions from SDMs may be less accurate over long time frames or in periods and areas undergoing rapid warming (Franklin, 2010). By combining animal object detection through artificial intelligence and climate change projections from the Copernicus Climate Change Service (C3S), we can contribute both effectively and at low costs to identify and establish new high seas habitat protected areas, which may be essential in the conservation of beluga whales and other threatened species. Cetacean species with a range limited to non-tropical waters are more likely to be impacted by water temperature alterations (MacLeod, 2009). Beluga whales (Delphinapterus leucas) (Pallas, 1776) are strictly ice-dependent species that inhabit isolated Arctic Ocean waters (Suydam et al., 2001) and, thus, may comprise good bioindicators concerning how climate change can affect other ice-dependent Arctic species. They occur in coastal and offshore waters of western and northern Alaska and Canada (Richard et al., 2001; Suydam et al., 2001) and Russia (Shpak, et al., 2019), comprising the most geographically isolated cetacean (Laydre et al., 2015). To estimate their abundance, aerial surveys began in Cook Inlet and in the Gulf of Alaska in 1993, documenting a 42.6% decline (1993-2006) (Hobbs et al., 2006). Due to these critically low numbers, beluga whales were listed as endangered (Goetz et al., 2012), and their current situation seems somber as, out of 19 populations, 14 are data deficient, three are declining, one is stable and only one is increasing (Laydre et al., 2015). The combination of natural and anthropogenic factors, such as climate change and/or illegal harvesting, may be hindering beluga population recoveries (Carter and Nielsen, 2011).
Traditionally, long-term marine mammal monitoring techniques have comprised direct observation, and, during the last decades, the use of satellite tracking tools has efficiently revealed individual movement patterns and distributions (Kennedy et al., 2013; Scales et al., 2017). Object detection photo identification is significantly more accurate than visual observation (Chernetsky & Krasnova, 2018), with lower costs than traditional counting techniques in sampling animals living in remote areas (Taylor et al., 2007). Recently, remote sensing imagery has been used to identify both whale individuals and aggregations allowing for estimates concerning population abundance. This technique, however, still does not provide a high detection accuracy for marine mammals (Abileah, 2002; Fretwell et al., 2014; Fretwell et al., 2017), which makes it difficult to develop reliable estimates concerning spatial distribution or aggregation patterns.
In remote sensing methods, free Google Earth images have been used to train Deep Convolutional Neural Networks (CNN) for conservation goals (Guirado et al., 2017), which automatically learn the distinctive features of each object class from a large set of annotated images (LeCun et al., 2015). Previous studies in marine mammal detection and counting have resulted in a recall rate of more than 80% (Bogucki et al., 2019; Guirado et al., 2019; Gabaldon et al., 2022; Khan et al., 2022). This can have a big impact in reducing the effort required for manual verification, increasing the advantage of employing an automatic detector in long-term monitoring (Li et al., 2022; Marquez et al., 2022), estimating population abundances and projecting dynamics and fluctuations under future climate change scenarios. Therefore, this technology provides an essential tool in predicting, assessing and implementing conservation measures, which may, in turn, contribute to the protection of these and other marine and ice-dependent species.
Our aim here is to identify beluga whale individuals and aggregations in the Arctic Ocean from high-resolution satellite imagery employing Deep CNN to automatically detect beluga whales from open Google Earth images, and assess their correlation with sea surface temperature (SST) projected scenarios and with beluga-data to evaluate potential changes in beluga distribution. To this end, this study (i) detected beluga whale individuals and aggregations, (ii) assessed intra-population spatial patterns and their relationship to SST, and (iii) compiled SST future projections at beluga whale locations from 2015 to 2100 under three IPCC representative concentration pathway (RCP) scenarios.
Methods
Beluga whale identification and intra-population spatial patterns
Beluga whales (Delphinapterus leucas) (Pallas, 1776) are distributed throughout the Arctic Ocean mainly at western and northern Alaska, Canada (Suydam et al., 2001; Richard et al., 2001) and Russia (Shpak, et al., 2019). These animals are ice-dependent, and their distribution have been documented at high latitudes in the Arctic Ocean. However, they have also been observed in southern regions such as Baffin Bay (O’Corry-Crowe, 2009), Greenland (Heide-Jørgensen et al., 2010), or Hudson Bay (Colbeck et al., 2013). Beluga whale aggregations herein were detected using satellite imagery from open very high-resolution (< 1 m/pixel) images of Arctic coasts and Deep CNN (Guirado et al., 2019) from 2007 to 2020. The automatic whale-counting procedure employed a two-step CNN-based model. In the first step (first, a classification of images to obtain the possibility of finding beluga whales and second, in the images with high probability of finding beluga whales, to detect them in order to count the whales), the CNN scanned the sample area to search for the presence of beluga whales in each grid cell. Only grid cells in which the first-step CNN (a model based on Inception v3) gives a high probability for a whale presence (black square) (Supplementary Figure 1SI) are then analyzed by the second step, in which CNN (a model based on Faster-RCNN Inception-Resnet v2) finally locates and counts whale aggregations. The CNN-based model was developed employing an open-source software using free Google Earth and Mapbox images (subjected to terms of service). To train and test the CNN-based classifier, we selected a dataset with very-high resolution images acquired between the 1st and 2nd of January 2019 with eye altitude of ~200 m and approximately 1 m/pixel (zoom 18 in Google Earth) with acquisition date of June 4th, 2007. Many of the images provided by Google Earth or Mapbox are Quickbird satellite imagery that has a spatial resolution of 0.61 m/pixel satellite in panchromatic image spatial resolution. This date coincides with the breeding and feeding stage of D. leucas (Smith et al., 1985; Koski et al., 2002). To increase the volume of the training dataset, we employed data-augmentation techniques by applying rotation with a factor selected randomly between 0 and 360°, randomly flipping half of the training images, cropping, and changing the scale size of the images and the brightness level of pixels by a factor of up to 50%. To train and test the models, we used the Google TensorFlow deep-learning framework (Abadi et al., 2016) in the step-1 CNN-based model, and the Google Tensorflow Object Detection API (Huang et al., 2017) to train, validate and test the step-2 CNN-based model. For step-1, two classes were employed for model training containing 1,400 of images, (1) Beluga whale (D. leucas) samples and (2) Icebergs. For step-2, the training dataset contains 700 aerial images, in which each beluga whale is annotated within a bounding box (the total number of bounding boxes is 846). For belugas testing and validating, we downloaded 13,348 cells of 71 m x ~ 71 m. For “icebergs”, we selected 700 images. For step-2, to test the CNN-based model, 80% of the beluga whales object-interpreted in the Prince Regent Inlet (Canada) from aerial images from NOAA (National Oceanic and Atmospheric administration) were used using Mapbox.
Two authors visually inspected all the images to annotate each cell with the name of the corresponding class and with the number of whales. Both annotators also verified the presence of belugas in these areas through specialized websites on whale watching and used the Mapbox and Google Earth tools to differentiate beluga whales from sea floor and icebergs by comparing images from the same spot at different dates.
To evaluate the performance of CNN-based models, we used: positive predictive value, sensitivity and F1-measure. True positives correspond to images that were correctly classified or counted as belugas by the models, false positives correspond to images that were classified or counted as whales by the models but corresponded to another class, and false negatives correspond to images not detected with whales. In simple terms, a high positive predictive value means that the model returned many more real whales than false ones, while a high sensitivity means that the model returned most of the real whales. The F1 measure provides a balance between accuracy and sensitivity. Unfortunately, in areas where icebergs of similar size to beluga whales were present, the accuracy of the models was not good (less than 50% accuracy), and the images were photo-interpreted to detect beluga whales manually.
To assess aggregation patterns, intra-community spatial patterns (L-function) of individual beluga whales were calculated through the relationship between the Clark-Evans R index (Clark & Evans, 1954) and the minimum Nearest Neighbor distance, in meters.
Sea surface temperature
To assess the potential influence of sea surface temperature (SST) on beluga whale aggregation patterns, Pearson’s correlations between the SST (°C) and the minimum Nearest Neighbor distance of the studied populations between 2007-2020 were calculated. To this end, an annual time series of mean SST for every location was obtained from satellite imagery. In addition, we employed The Scenario Model Intercomparison Project (ScenarioMIP) for the climate model projections (CMIP6), which provided multi-model climate projections based on alternative future emission scenarios (O’Neill, 2016) and the Intergovernmental Panel on Climate Change (IPCC, 2021) projections to visualize SST trends for each beluga whale aggregations, as well as mean effects, for every decade throughout this century (2015-2100) applying three emissions scenarios (IPCC, 2021). These were obtained by downloading 25 SST models from the CMIP6 climate projections available at the Copernicus database (Yang et al., 2021), with monthly SST projection data available for three climate change scenarios described in the 6th IPCC’s report: SSP1-2.6, SSP2-4.5 and SSP5-8.5 (Supplementary Table 2SI). Models were contained in NetCDF files, so we transformed them to raster files. Then, we extracted the SSF data (in °C and with a spatial resolution of 1° in latitude and longitude) for the locations of the 11 studied beluga whale aggregations using the extract function of the raster package (Hijmans et al., 2015) available in the R statistical environment (R Core Team, 2022). Following data extraction, only up to six models contained data available at our studied locations (Supplementary Table 2SI). We then averaged the SST projections for each location, date, and climate change scenario.
Results
We were able to detect six beluga whales’ aggregations for during the summer feeding period between 2007-2020 using open-access satellite imagery and deep learning. A total of 1,980 beluga whales were detected, grouped in eleven aggregations at the Cunningham Inlet, Nunavut land and Hudson Bay (Canada), Norton Sound (USA), and North and South Ojotsk sea (Russia) (Figures 1, 2; Supplementary Table 1SI).
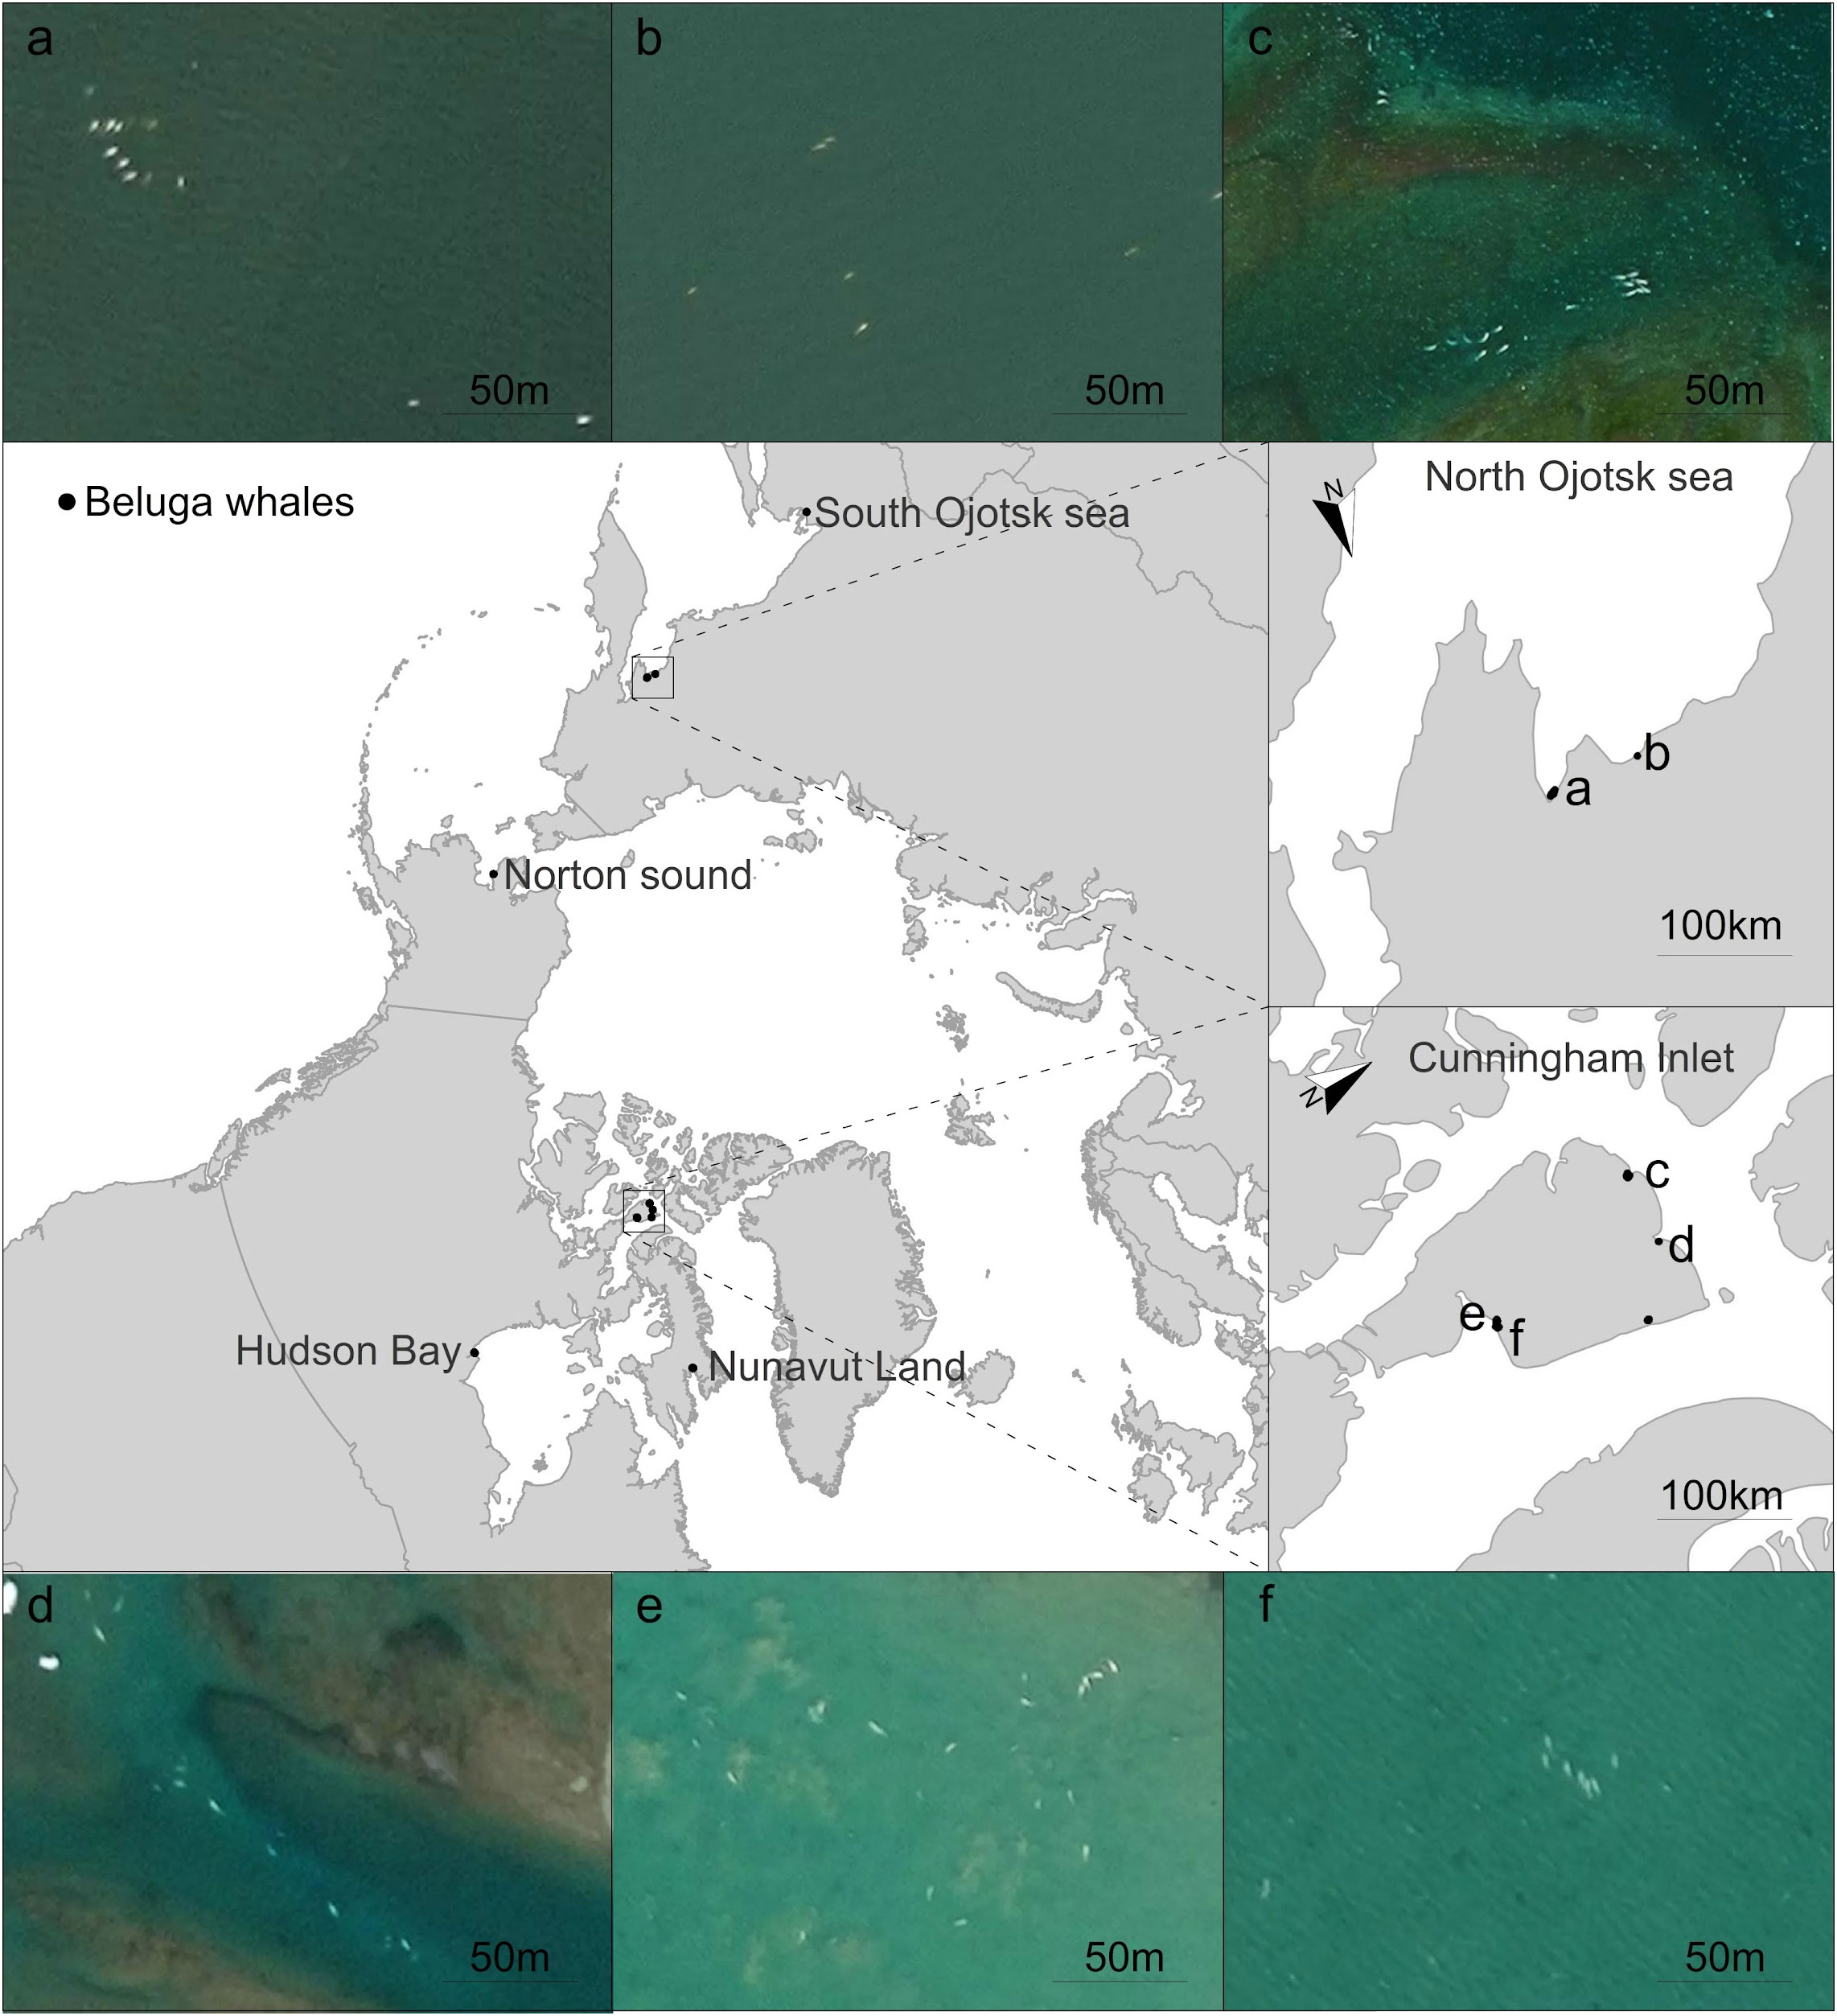
Figure 1 Beluga whale aggregations in the Arctic Ocean detected in very high-resolution satellite imagery from Google Earth. (A–F) beluga whale aggregations.
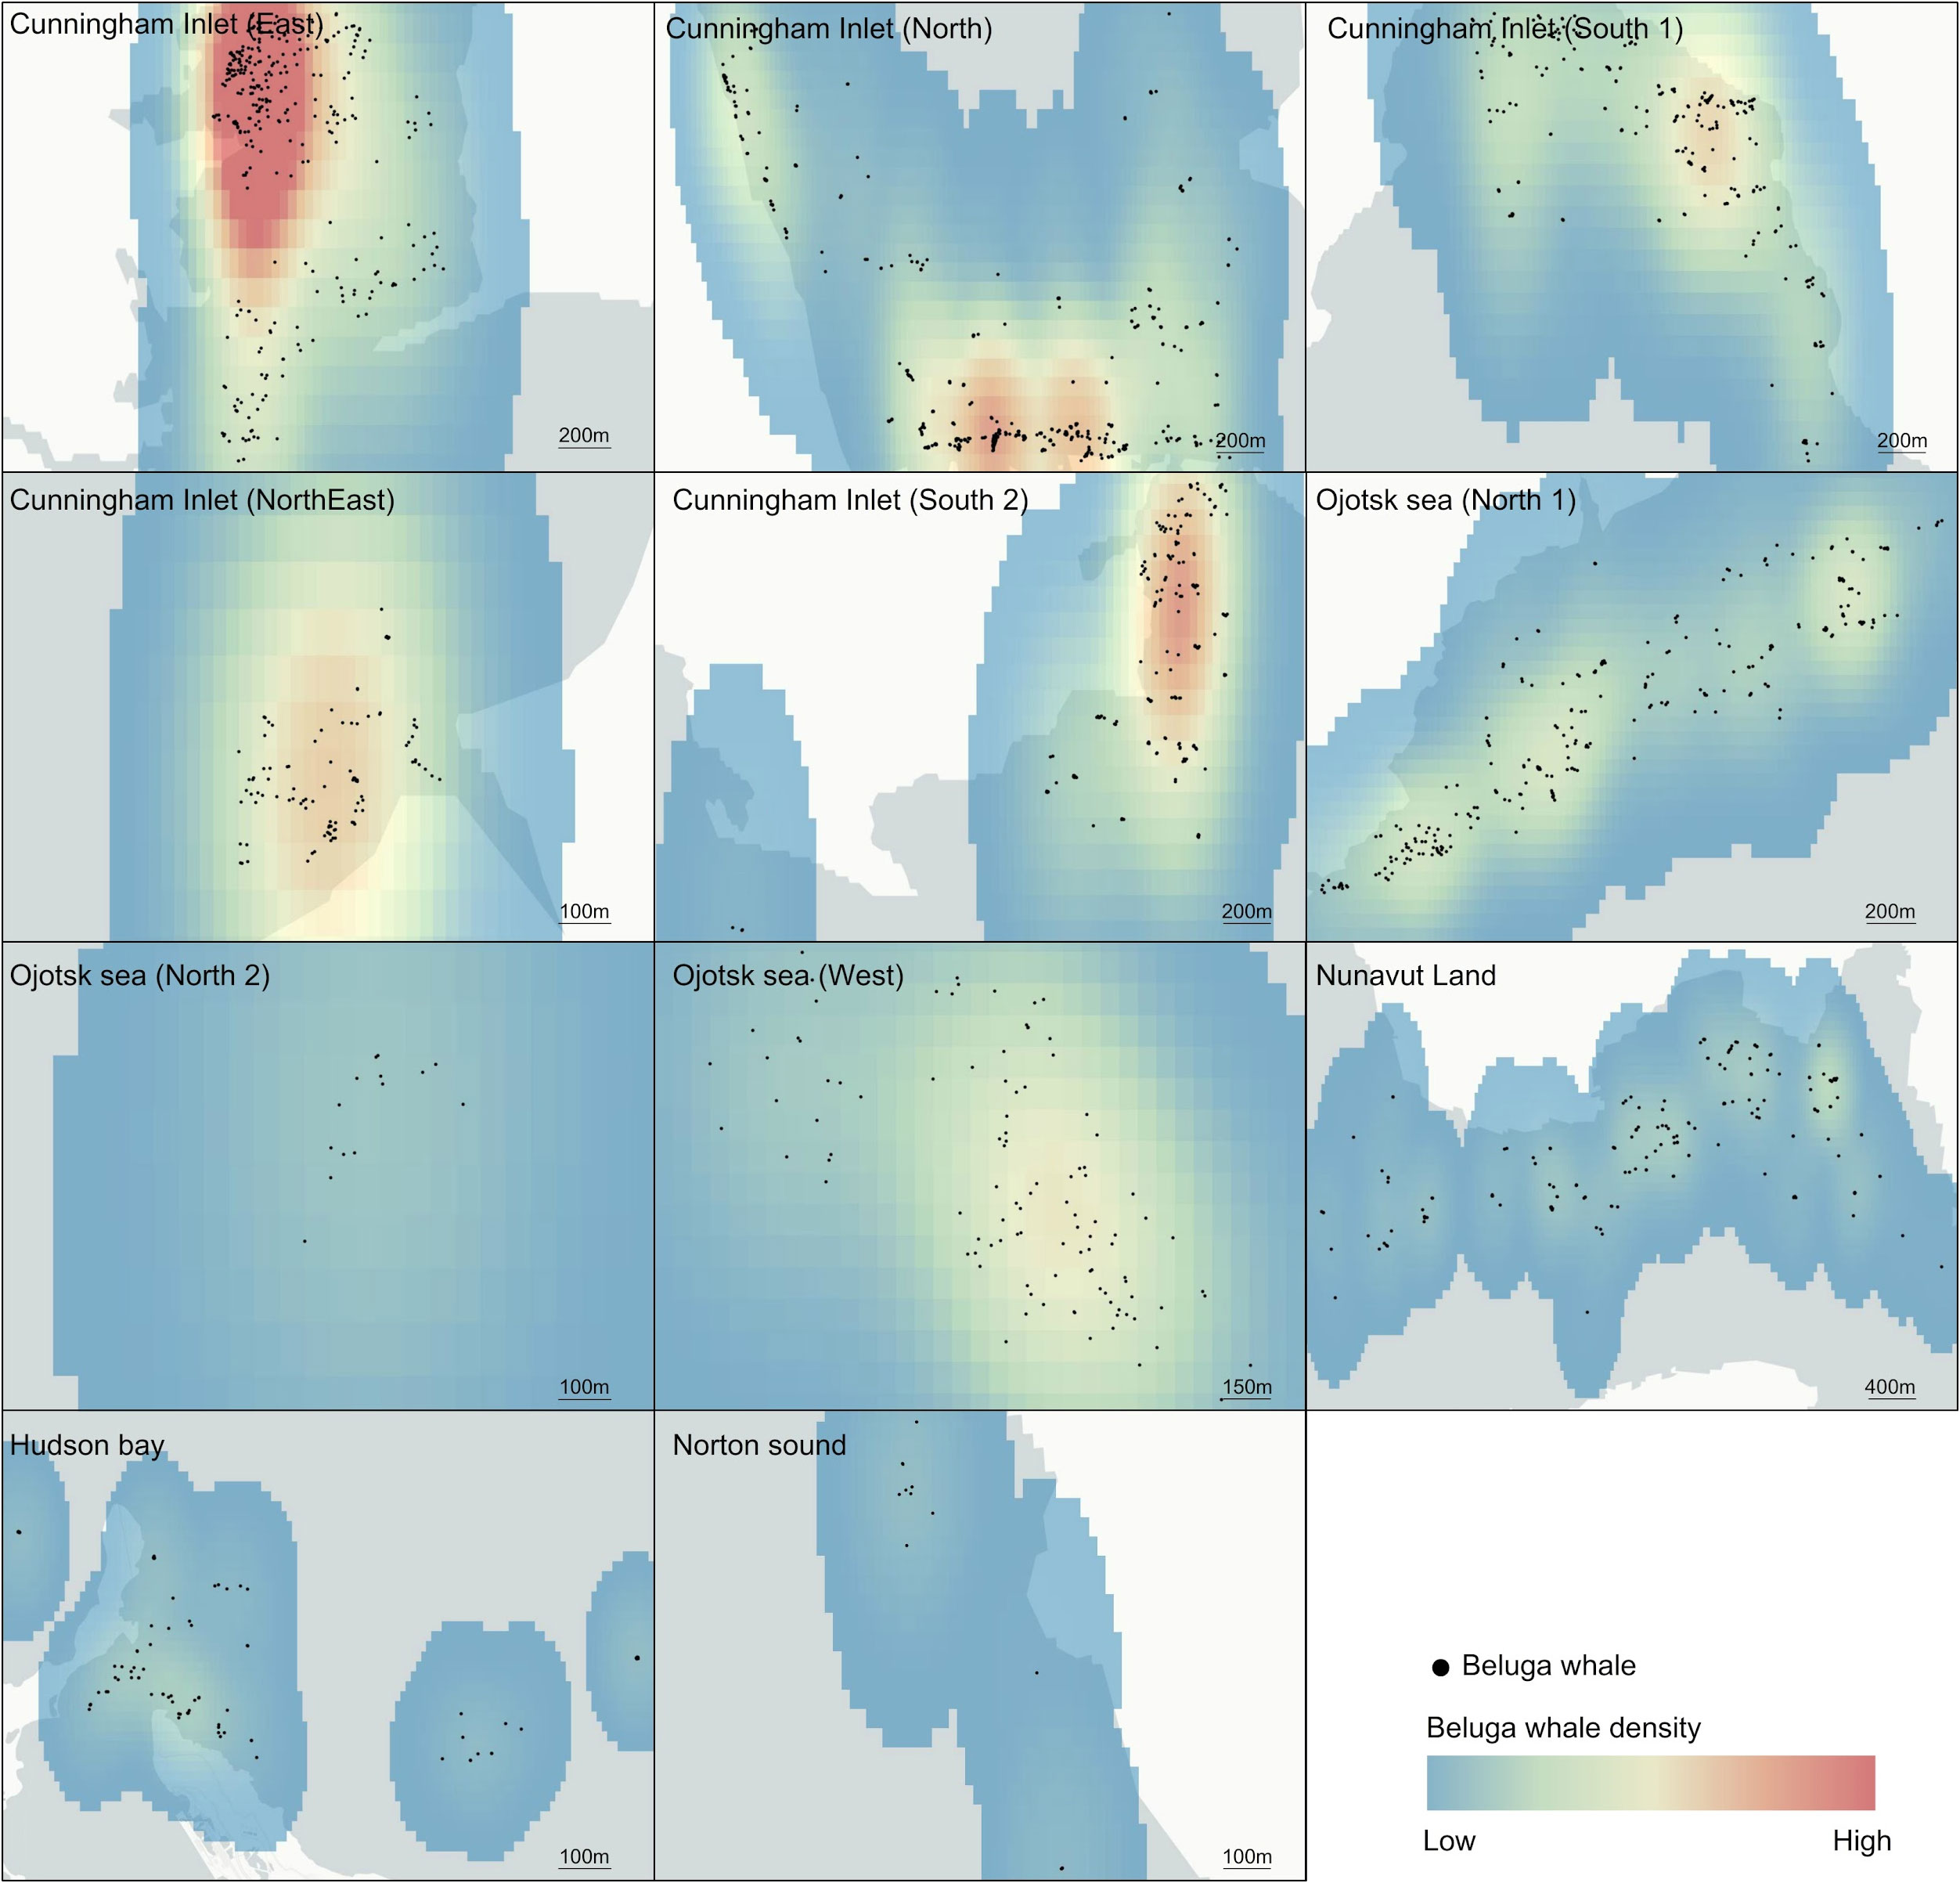
Figure 2 Density maps of beluga whale aggregations. Red indicates high densities.
In a first test in the bay where the North Elwin River flows (73.554006396, -90.96751917) with Google Earth images, the model trained for the detection of the family Monodontidae based on Faster-RCNN Inception-Resnet v2 of Tensorflow API obtained 99% accuracy. In the test phase, we obtained a 98% F1 measurement of D. leucas (Supplementary Table 2SI) with images exclusively from Google Earth in the classification for object detection using bounding boxes (Supplementary Figure 2SI). For the iceberg class the measured F1 was 100%. However, in other bays further north and with more mixed icebergs the automatic results were not good (F1 < 60%). Therefore, we proceeded to manually photo-interpret the other bays with high probability of beluga whale presence.
The intra-population spatial patterns (L-function) of many individual beluga whales displayed low minimum Nearest Neighbour distances, following a quadratic relationship with the Clark-Evans R index (R2 = 0.65) (Supplementary Figure 3SI).
To assess the relationship between SST and these aggregations, we calculated the correlation between the SST (°C), detecting a positive correlation between SST and Nearest Neighbour distance (r = 0.65, p = 0.042), where most aggregations were located at areas with low SST, ranging from -2 to 5°C, except for Russian locations (Figure 3A). The averages of temperature (Figure 3B) also highlighted how the Arctic Sea, including the Russian and North Canadian locations, are increasing SST mean records along the last decades. Our results highlighted that SST is expected to increase at least one degree before 2050 in the three scenarios, but will increase from 1.5 to 3°C from 2050 to 2100, depending on the RCP scenario (Figure 3), with northern areas comprising the most affected under the three RCP scenarios (Figure 4; Supplementary Figure 3SI).
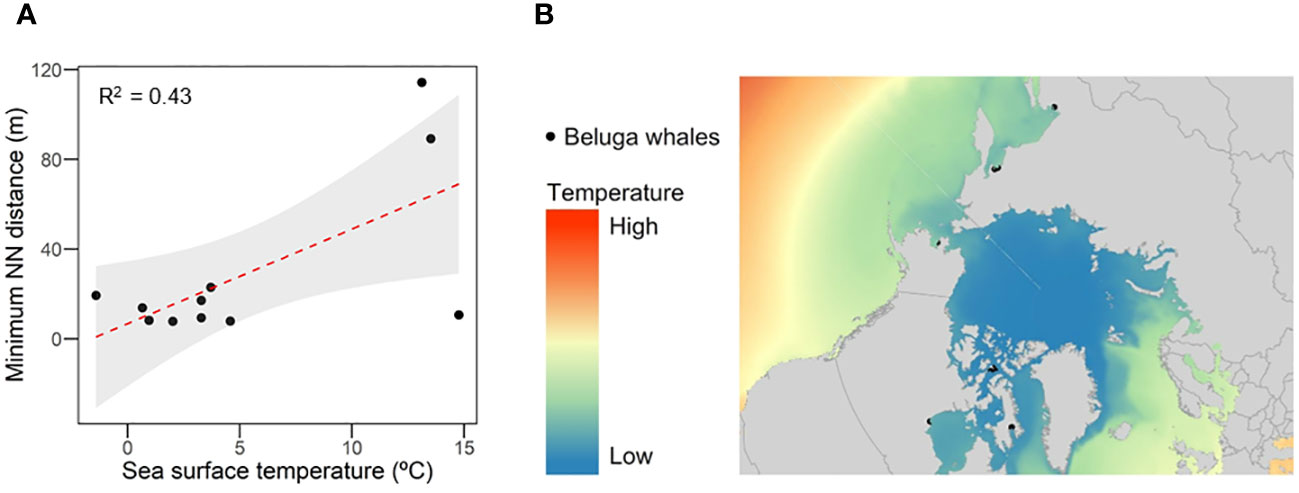
Figure 3 (A) Relationship between sea surface temperature (°C) and minimum Nearest Neighbour distance, in meters (B) Heat map indicating mean sea surface temperature (°C) between 2007-2020.
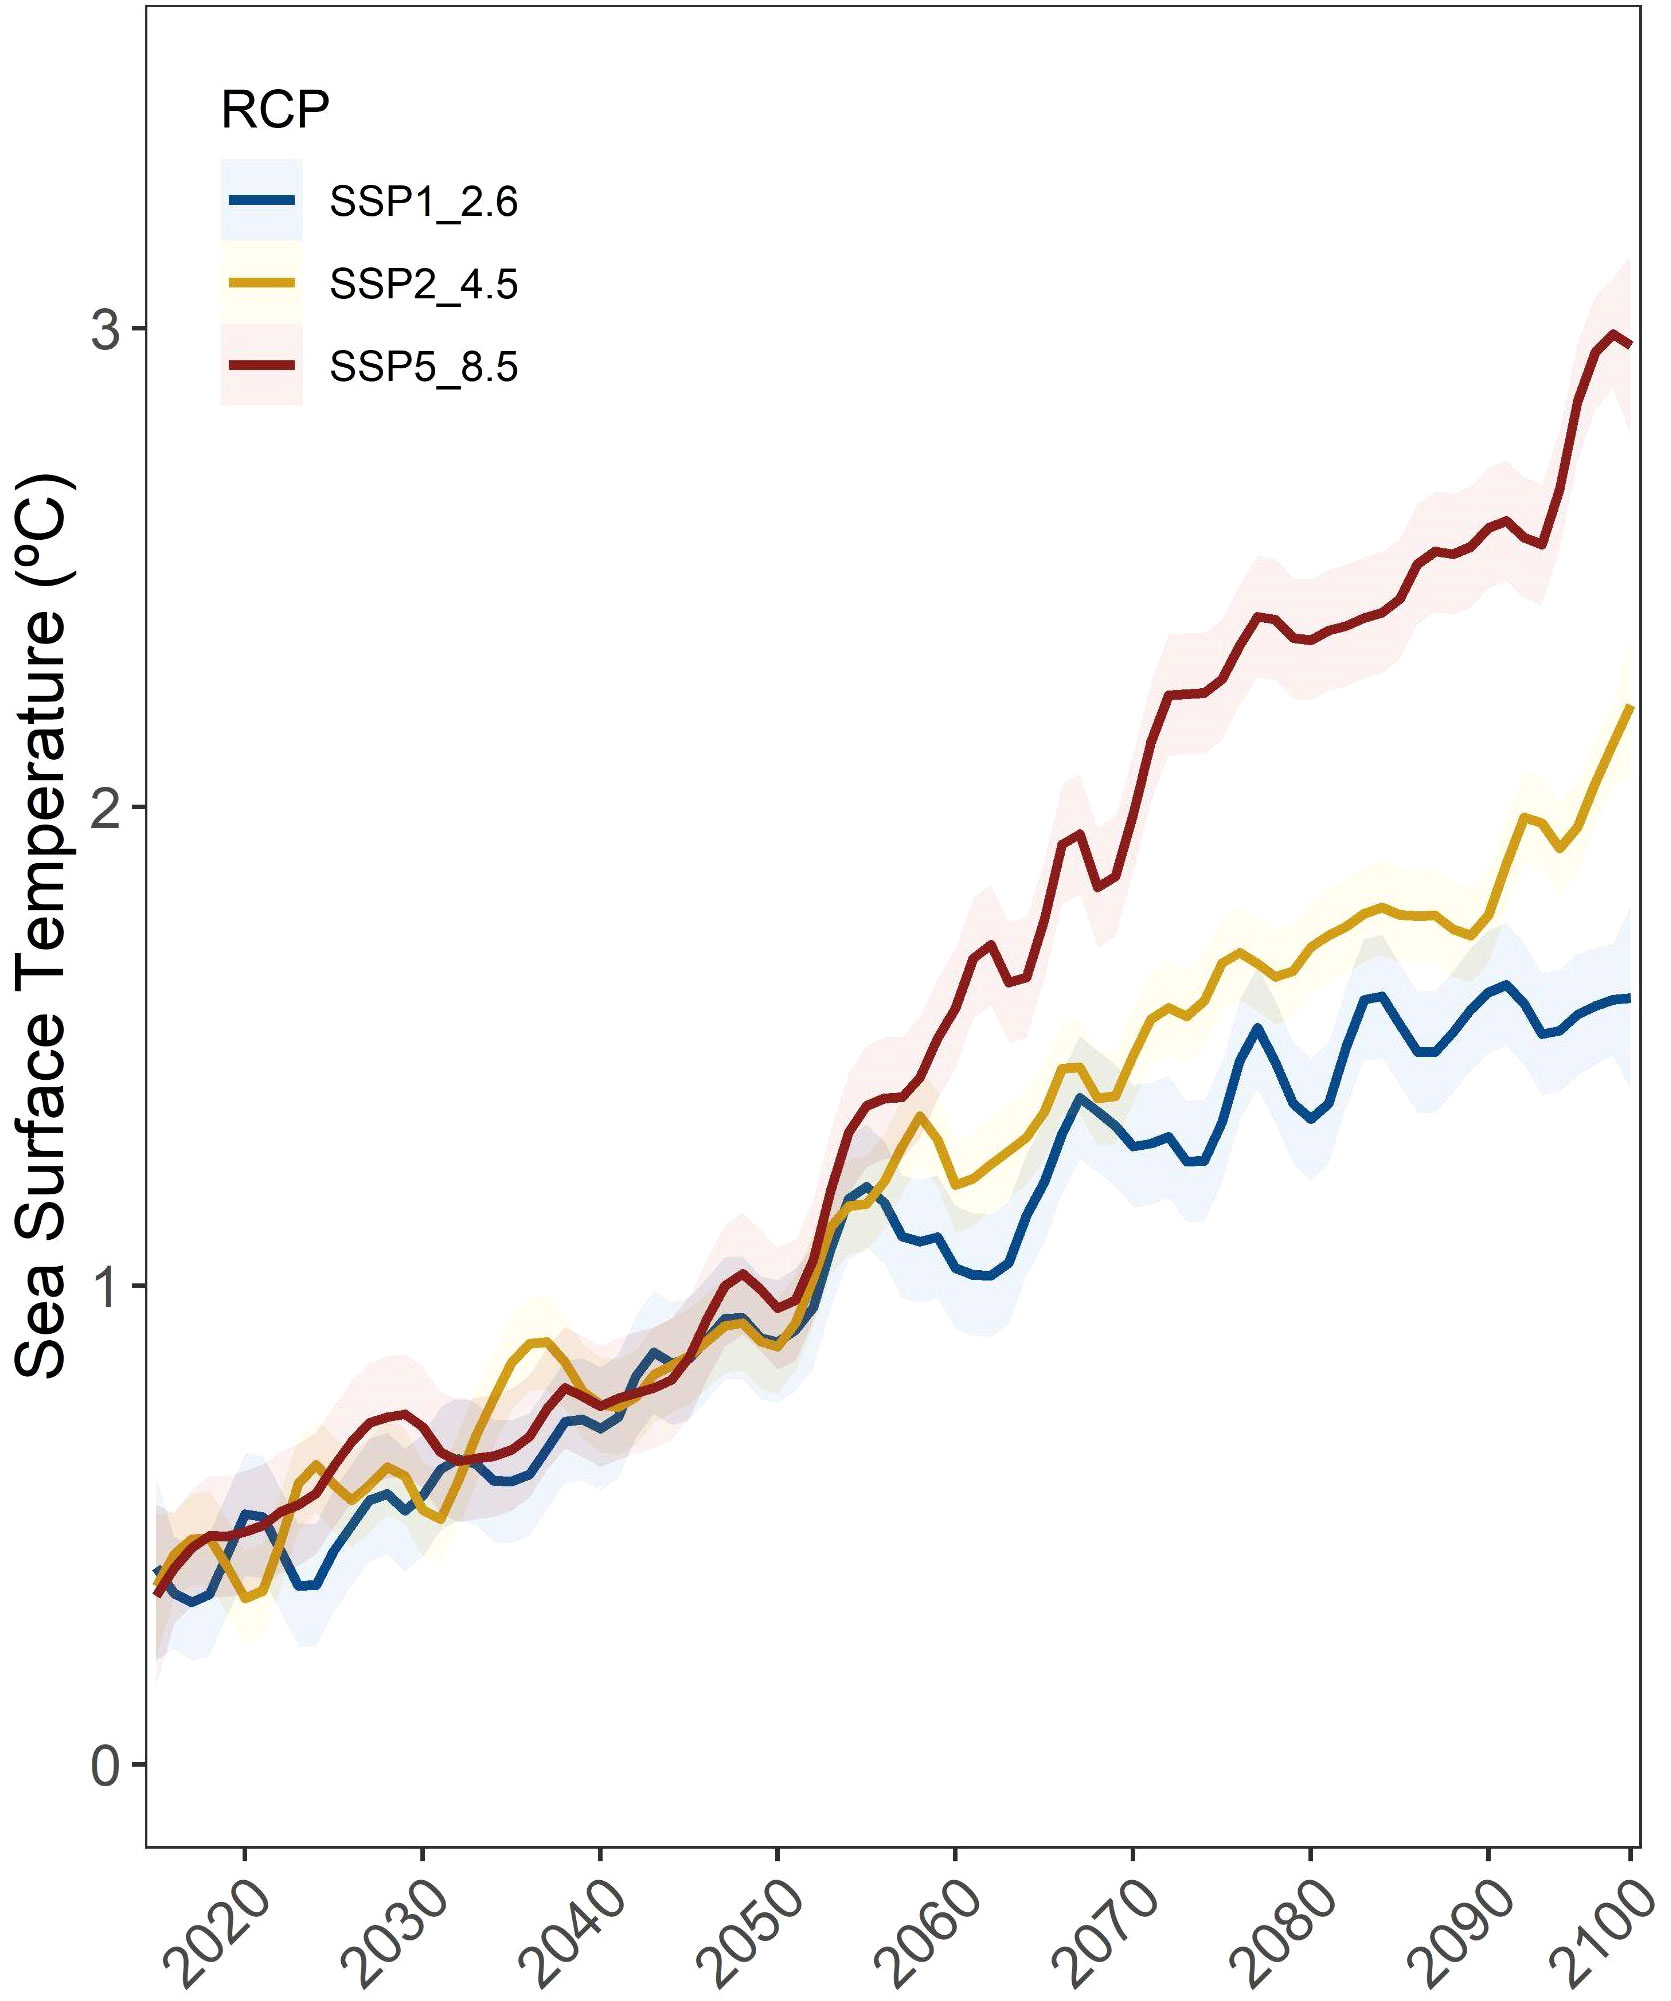
Figure 4 Average sea surface temperature (°C) projections under the SSP1 2.6, SSP2 4.5 and SSP5 8.5 IPCC scenarios at the 11 beluga locations analyzed herein (solid lines) with their corresponding standard errors (semi-transparent ribbons).
Discussion
Here we employed satellite imagery and Deep CNN to identify individual beluga whales and assess their patterns, obtaining accurate results (Wu et al., 2022). However, not in all bays the accuracy was good, and we proceeded to make a manual effort to obtain the final results, using a lot of effort and time. The lesson learned from this attempt to automate the detection of beluga whales with satellite images would be that the spatial resolution of the free images used is still low for detecting beluga whales (5m long without submerging). In addition, individual automatic detection is easily confused with icebergs, with the same color and sometimes size or shape. Finally, we are optimistic for future work to increase the accuracy of beluga whale detection using other strategies such as the detection of sets of whales instead of isolated individuals, as they are often found in groups where they could be better identified.
Our results highlighted that the rapid changes the Arctic region is now facing due to climate change (Poloczanska et al., 2016) emphasizing the importance of learning more about beluga whale spatiotemporal distributions and latitudinal habitat use shifts. (We detected herein a positive and significant relationship between SST and whale aggregation, suggesting a higher number of beluga whale aggregations in colder waters. However, the correlation value could be influenced by the distinctive characteristics of two Russian populations with low aggregation of whales (Figure 3A) compared to other populations. Overall, this relationship may be due to the fact that many areas, such as Baffin Bay, have experienced significant sea ice changes, with sea ice retreating 7 days earlier and advancing 5 days later per decade (Laidre et al., 2015). In West Greenland, there was a clear correlation between decreasing sea-ice cover and increasing distance from shore for beluga sightings. Despite their relatively restricted distribution close to the coast and in limited open areas in the early 1980s, when sea ice cover was higher (Heide-Jørgensen et al., 2010). The northern archipelagos in the Barents Sea have also been recording annual warming of up to 2.7°C per decade, with a maximum up to 4°C observed in some periods (Isaksen et al., 2022). The higher records also observed in the Russian locations may be due to the Arctic Sea experiencing the highest SST ever recorded since increasing SSTs in the Northern Pacific over the past decades, with associated changes in extreme marine heatwaves (Carvalho et al., 2021). Current Arctic sea-ice coverage levels are the lowest since 1850 for both annual mean and late-summer values and the region will become practically ice-free by the end of the 21st century in both low and high greenhouse gas emissions scenarios such as SSP2-4.5, SSP3-7.0, and SSP5-8.5 (high confidence) (Fox-Kemper et al., 2021) (IPCC, 2021).
The ocean absorbs almost 90% of the Earth’s energy imbalance (Von Schuckmann et al., 2020), which is accelerating ocean warming due to climate change (IPCC, 2021). We downloaded the IPCC SST projections at the eleven study locations to highlight whether those beluga whale populations could potentially be affected by sea surface warming in the next decades, and our findings indicate that all the locations might experience a one degree temperature increase from 2015 to 2050 under the three RCP scenarios. However, the warming pattern diverges from 2050 depending on the RCP scenario, demonstrating how, depending on the emissions path we choose, the SST will increase at those locations from 1.5°C to 3°C, with northern locations more affected than southeast ones (Figure 4). Consequently, if our SST IPCC scenarios are confirmed, northern populations could be experiencing deep sea thermal changes in their distribution areas from the 50s decade (Figure 5). This could, in turn, push their distribution patterns towards cooler southern areas, overlapping with northward distribution shifts of other marine mammal species (Thorne et al., 2022), increasing habitat and resource competition or even leading to drastic population depletion, depending on species ability to adapt to new climate scenarios.
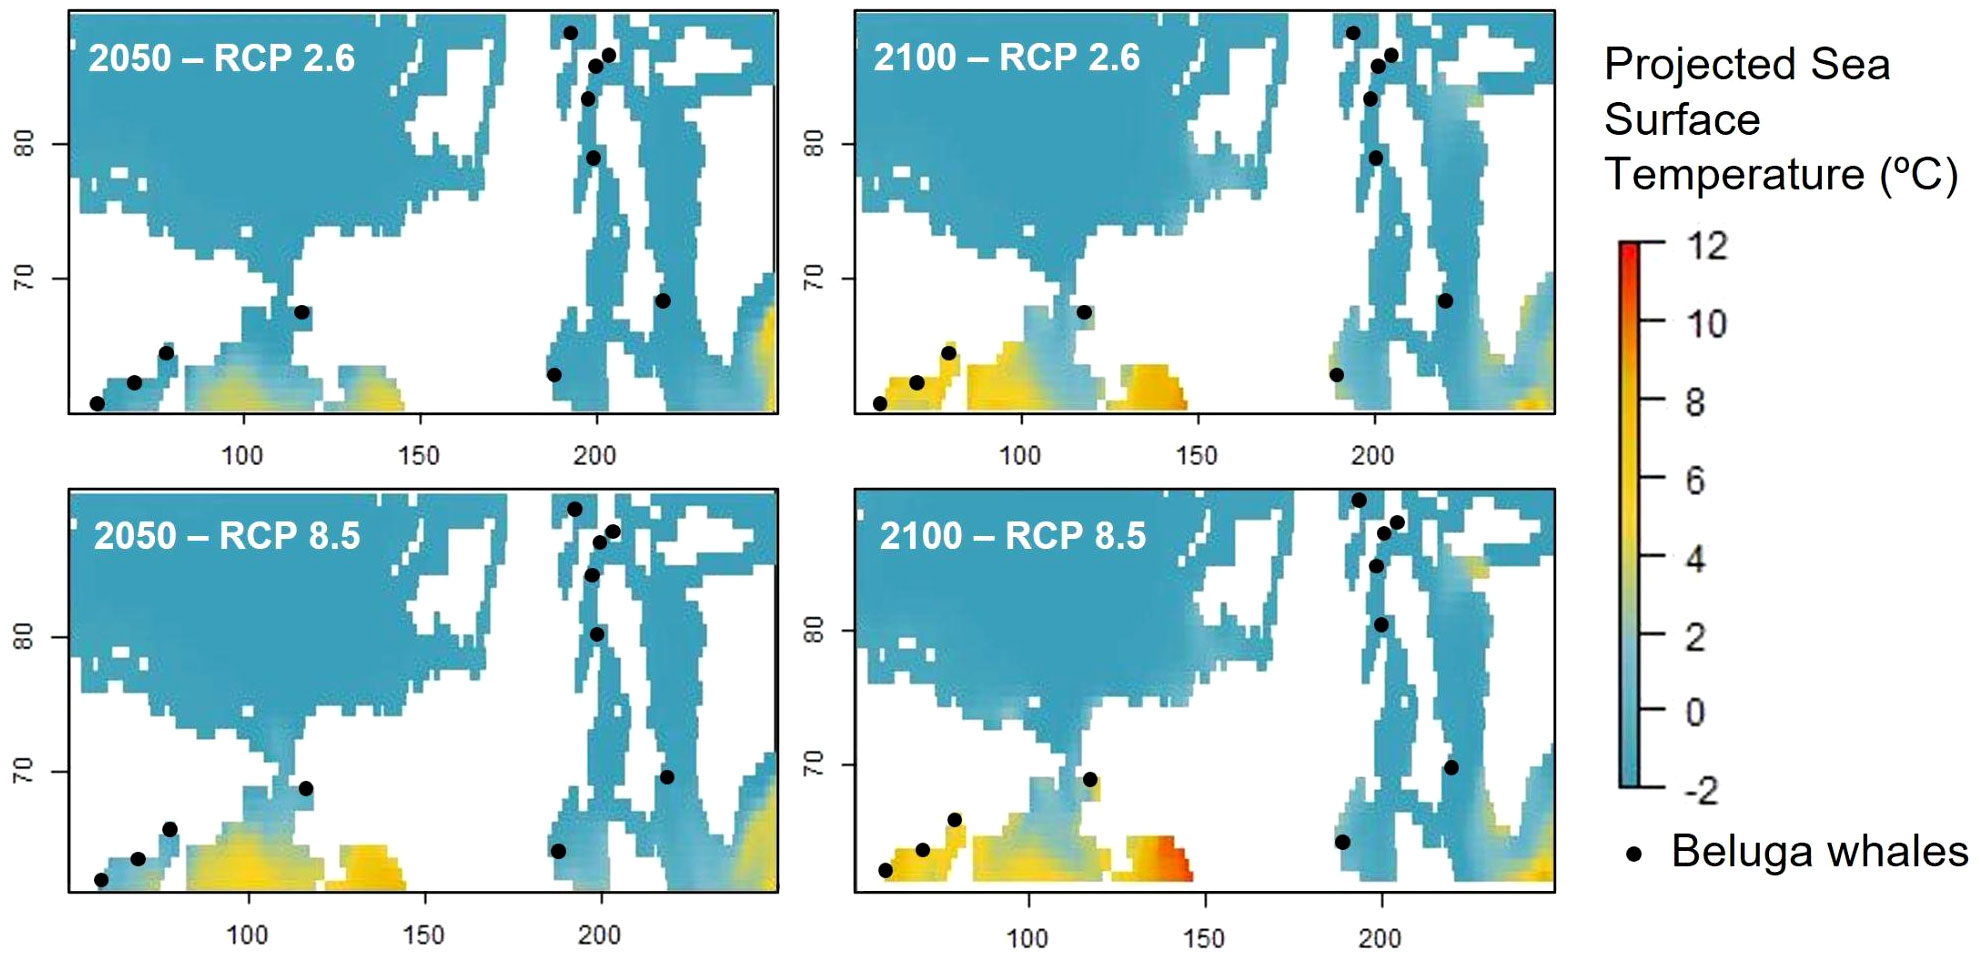
Figure 5 Projected sea surface temperature (°C) under SSP1 2.6 and SSP5 8.5 IPCC scenarios at the 11 beluga locations analyzed herein.
Overall, our study with a low-cost tool to monitor cetaceans using freely available satellite imagery and artificial intelligence demonstrated how beluga whales aggregate less in higher SST and how their habitats are predicted to warm throughout the 21st century. Spatial beluga whale population patterns are directly associated to sea temperature and climate change will certainly affect them in the future decades. However, the chosen IPCC greenhouse emission path will determine the extent and speed of SST increases for the rest of the century. Under this scenario, we recommend a prompt and global reduction of gas emissions and the protection of beluga whale territories from marine traffic if we wish to preserve this vulnerable species. In this regard, this study, along with future research to detect thermal shelters in the Arctic may comprise valuable tools in highlighting potential climate change impacts on beluga whale populations.
Data availability statement
The original contributions presented in the study are included in the article/Supplementary Material. Further inquiries can be directed to the corresponding author.
Ethics statement
Ethical approval was not required for the studies on animals in accordance with the local legislation and institutional requirements because the study was observational only.
Author contributions
MR: Writing – original draft, Writing – review & editing. EG: Conceptualization, Formal analysis, Writing – review & editing. ZO: Formal analysis, Supervision, Writing – review & editing.
Funding
The author(s) declare financial support was received for the research, authorship, and/or publication of this article. MLR and ZO were supported by Postdoctoral Research Contracts of the Andalusian government (Spain) and FEDER EU funds (refs. 839 and 401) and EG acknowledges funding from Generalitat Valenciana and European Social Fund grant (APOSTD/2021/188). The open access fee was co-funded by the plan propio UCA and QUALIFICA Project (QUAL21-0019, Junta de Andalucía).
Conflict of interest
The authors declare that the research was conducted in the absence of any commercial or financial relationships that could be construed as a potential conflict of interest.
Publisher’s note
All claims expressed in this article are solely those of the authors and do not necessarily represent those of their affiliated organizations, or those of the publisher, the editors and the reviewers. Any product that may be evaluated in this article, or claim that may be made by its manufacturer, is not guaranteed or endorsed by the publisher.
Supplementary material
The Supplementary Material for this article can be found online at: https://www.frontiersin.org/articles/10.3389/fmars.2024.1359429/full#supplementary-material
References
Abadi M., Agarwal A., Barham P., Brevdo E., Chen Z., Citro C., et al. (2016). Tensorflow: Large-scale machine learning on heterogeneous distributed systems. arXiv preprint, 1603.04467. doi: 10.48550/arXiv.1603.04467
Abileah R. (2002). Marine mammal census using space satellite imagery. US Navy J. Underw. Acoust. 52.
Bogucki R., Cygan M., Khan C. B., Klimek M., Milczek J. K., Mucha M. (2019). Applying deep learning to right whale photo identification. Conserv. Biol. 33 (3), 676–684.
Bouchet P., Miller D. L., Roberts J., Mannocci L., Harris C. M., Thomas L. (2019). From here and now to there and then: Practical recommendations for extrapolating cetacean density surface models to novel conditions. CREEM Tech. Report no. 2019-1.
Carter B. T., Nielsen E. A. (2011). Exploring ecological changes in cook inlet beluga whale habitat though traditional and local ecological knowledge of contributing factors for population decline. Mar. Policy 35 (3), 299–308.
Carvalho K. S., Smith T. E., Wang S. (2021). Bering Sea marine heatwaves: Patterns, trends and connections with the Arctic. J. Hydrology 600, 126462. doi: 10.1016/j.jhydrol.2021.126462
Chernetsky A. D., Krasnova V. V. (2018). The structure of the reproductive gathering of beluga whales, delphinapterus leucas (Palla), off solovetsky island (White sea) as inferred from results of photo identification in 2007–2013. Russian J. Mar. Biol. 44, 394–403.
Clark P. J., Evans F. C. (1954). Distance to nearest neighbour as a measure of spatial relationships in populations. Ecology 35, 445–453.
Colbeck G. J., Duchesne P., Postma L. D., Lesage V., Hammill M. O., Turgeon J. (2013). Groups of related belugas (Delphinapterus leucas) travel together during their seasonal migrations in and around hudson bay. Proc. R. Soc. B: Biol. Sci. 280 (1752), 20122552.
DeMaster D. P., Lowry L. F., Frost K. J., Bengston R. A. (2001). The effect of sea state on estimates of abundance for beluga whales (Delphinapterus leucas) in norton sound, alaska. Fishery Bull. - Natl. Oceanic Atmospheric Administration 99 (1), 197–201.
Fox-Kemper B., Hewitt H. T., Xiao C., Aðalgeirsdóttir G., Drijfhout S. S., Edwards T. L., et al. (2021). “Ocean, cryosphere, and sea-level change,” in Climate change 2021: the Physical Science Basis. Contribution of Working Group I to the Sixth Assessment Report of the Intergovernmental Panel on Climate Change. Eds. Masson-Delmotte V., Zhai P., Pirani A., Zhou B. (Cambridge University Press, Cambridge, United Kingdom and New York, NY, USA), 1211–1362.
Franklin J. (2010). Mapping species distributions: spatial inference and prediction (Cambridge University Press).
Fretwell P. T., Scofield P., Phillips R. A. (2017). Using super-high resolution satellite imagery to census threatened albatrosses. Ibis 159 (3), 481–490.
Fretwell P. T., Staniland I. J., Forcada J. (2014). Whales from space: counting southern right whales by satellite. PloS One 9 (2), e88655.
Gabaldon J., Zhang D., Lauderdale L., Miller L., Johnson-Roberson M., Barton K., et al. (2022). Computer-vision object tracking for monitoring bottlenose dolphin habitat use and kinematics. PloS One 17, e0254323. doi: 10.1371/journal.pone.0254323
Geyman E. C., van Pelt W. J.J., Maloof A. C., Aas H. F., Kohler J. (2022). Historical glacier change on Svalbard predicts doubling of mass loss by 2100. Nature 601 (7893), 374–379.
Goetz K. T., Montgomery R. A., Ver Hoef J. M., Hobbs R. C., Johnson D. S. (2012). Identifying essential summer habitat of the endangered beluga whale Delphinapterus leucas in Cook Inlet, Alaska. Endangered Species Research, 16 (2), 135–147.
Guirado E., Tabik S., Alcaraz-Segura D., Cabello J., Herrera F. (2017). Deep-learning versus OBIA for scattered shrub detection with google earth imagery: Ziziphus lotus as case study. Remote Sens. 9 (12), 1220.
Guirado E., Tabik S., Rivas M. L., Alcaraz-Segura D., Herrera F. (2019). Whale counting in satellite and aerial images with deep learning. Sci. Rep. 9 (1), 1–12.
Heide-Jorgensen M. P., Laidre K. L., Borchers D., Marques T. A., Stern H., Simon M. (2010). The effect of sea-ice loss on beluga whales (Delphinapterus leucas) in west greenland. Polar Res. 29 (2), 198–208.
Hijmans R. J., Van Etten J., Cheng J., Mattiuzzi M., Sumner M., Greenberg J. A., et al. (2015). Package ‘raster’. R package, 734, 473.
Hobbs R. C., Shelden K. E., Vos D. J., Goetz K. T., Angliss R. P., Brix K., et al. (2006). Status review and extinction assessment of cook inlet belugas (Delphinapterus leucas).
Huang J., Rathod V., Sun C., Zhu M., Korattikara A., Fathi A., et al. (2017). “Speed/accuracy trade-offs for modern convolutional object detectors,” in Proceedings of the IEEE conference on computer vision and pattern recognition.
Insley S. J., Halliday W. D., Mouy X., Diogou N. (2021). Bowhead whales overwinter in the amundsen gulf and eastern beaufort sea. R. Soc. Open Sci. 8 (4), 202268.
IPCC. (2021). Climate change: The physical basis, 6th assessment report of the intergovernmental panel on climate change. Eds. Masson-Delmotte V., Zhai P., Pirani A., Connors S. L., Péan C., Berger S., Zhou B., 2.
Isaksen K., Nordli Ø., Ivanov B., Køltzow M. A. Ø., Aaboe S., Gjelten H. M., et al. (2022). Exceptional warming over the barents area. Sci. Rep. 12, 9371. doi: 10.1038/s41598-022-13568-5
Kaschner K., Quick N. J., Jewell R., Williams R., Harris C. M. (2012). Global coverage of cetacean line-transect surveys: status quo, data gaps and future challenges. PloS One 7 (9), e44075.
Kennedy A. S., Zerbini A. N., Vásquez O. V., Gandilhon N., Clapham P. J., Adam O. (2013). Local and migratory movements of humpback whales (Megaptera novaeangliae) satellite-tracked in the north atlantic ocean. Can. J. Zool. 92, 9–18.
Khan C., Blount D., Parham J., Holmberg J., Hamilton P., Charlton C., et al. (2022). Artificial intelligence for right whale photo identification: from data science competition to worldwide collaboration. Mamm. Biol. 102 (3), 1025–1042. doi: 10.1007/s42991-022-00253-3
Koski W. R., Davis R. A., Finley K. J. (2002). Distribution and abundance of canadian high arctic beluga -1979. NAMMCO Sci. Publications 4, 87–126.
Laydre K. L., Stern H., Kovacs K. M., Lowry L., Moore S. E., Regehr E. V., et al. (2015). Arctic marine mammal population status, sea ice habitat loss, and conservation recommendations for the 21st century. Conserv. Biol. 29 (3), 724–737.
Li T. H., Lim E., Chen I., Lin C. F., Chen S. C., Tsai M. A. (2022). Environmental enrichment and the behavioral effects on captive beluga whales (Delphinapterus leucas). Thai J. Veterinary Med. 52 (3), 559–565.
MacLeod C. D. (2009). Global climate change, range changes and potential implications for the conservation of marine cetaceans: a review and synthesis. Endangered Species Res. 7 (2), 125–136.
Marquez L., Fragkopoulou E., Cavanaugh K. C., Houskeeper H. F., Assis J. (2022). Artificial intelligence convolutional neural networks map giant kelp forests from satellite imagery. Sci. Rep. 12, 22196. doi: 10.1038/s41598-022-26439-w
Moore S. E., Huntington H. P. (2008). Arctic marine mammals and climate change: impacts and resilience. Ecol. Appl. 18 (sp2), S157–S165.
O'Corry-Crowe G. M. (2009). “Beluga whale: Delphinapterus leucas,” in Encyclopedia of marine mammals (Academic Press), 108–112.
O'Neill C. (2016). Oceanography and underwater acoustics in resolute bay, nunavut: 2012-2015 (Doctoral dissertation).
Pallas P. S. (1776). Samlungen historischer nachrichten über die mongolischen völkerschaften (No. 147). gedruckt bey der kayserlichen akademie der wissenschaften.
Poloczanska E. S., Burrows M. T., Brown C. J., García Molinos J., Halpern B. S., Hoegh-Guldberg O., et al. (2016). Responses of marine organisms to climate change across oceans. Front. Mar. Sci. 3 (62), 1–21.
R Core Team. (2022). A language and environment for statistical computing (Vienna: R Foundation for Statistical Computing).
Richard P. R., Martin A. R., Orr J. R. (2001). Summer and autumn movements of belugas of the bastern beaufort sea stock. Arctic, 223–236.
Scales K. L., Hazen E. L., Jacox M. G., Edwards C. A., Boustany A. M., Oliver M. J., et al. (2017). Scale of inference: on the sensitivity of habitat models for wide‐ranging marine predators to the resolution of environmental data. Ecography 40 (1), 210–220.
Shpak O. V., Meschersky I. G., Glazov D. M., Litovka D. I., Kuznetsova D. M., Rozhnov V. V. (2019). Structure and assessment of beluga whale, delphinapterus leucas, populations in the russian far east. Mar. Fisheries Rev. 81 (3-4), 72–87.
Simmonds M. P., Isaac S. J. (2007). The impacts of climate change on marine mammals: early signs of significant problems. Oryx 41 (1), 19–26.
Sirmacek B., Vinuesa R. (2022). Remote sensing and AI for building climate adaptation applications. Results Eng. 15, 100524.
Smith T. G. (1985). Polar bears, ursus maritimus, as predators of belugas, delphinapterus leucas. Can. Field-Nat. 99, 7 1–775.
Suydam R. S., Lowry L. F., Frost K. J., O'Corry-Crowe G. M., Pikok D. Jr. (2001). Satellite tracking of eastern chukchi sea beluga whales into the arctic ocean. Arctic 54 (3), 237–243.
Taylor B. L., Martinez M., Gerrodette T., Barlow J., Hrovat Y. N. (2007). Lessons from monitoring trends in abundance of marine mammals. Mar. Mammal Sci. 23, 157–175.
Thorne L. H., Heywood E. I., Hirtle N. O. (2022). Rapid restructuring of the odontocete community in an ocean warming hotspot. Global Change Biol. 28 (22), 6524–6540.
Von Schuckmann K., Le Traon P. Y., Smith N., Pascual A., Djavidnia S., Gattuso J. P., et al. (2020). Copernicus marine service ocean state report, issue 4. J. Operational Oceanography 13, S1–S172. doi: 10.1080/1755876X.2020.1785097
Wu E., Wang H., Lu H., Zhu W., Jia Y., Wen L., et al. (2022). Unlocking t167 he potential of deep learning for migratory waterbirds monitoring using surveillance video. Remote Sens. 14 (3), 514.
Keywords: biodiversity conservation, climate projections, deep learning, global warming, marine mammals
Citation: Rivas ML, Guirado E and Ortega Z (2024) Relation between beluga whale aggregations and sea temperature on climate change forecasts. Front. Mar. Sci. 11:1359429. doi: 10.3389/fmars.2024.1359429
Received: 22 December 2023; Accepted: 07 February 2024;
Published: 29 February 2024.
Edited by:
Tim Wilhelm Nattkemper, Bielefeld University, GermanyReviewed by:
Yiannis Aloimonos, University of Maryland, College Park, United StatesEduardo Cuevas, Autonomous University of Baja California, Mexico
Copyright © 2024 Rivas, Guirado and Ortega. This is an open-access article distributed under the terms of the Creative Commons Attribution License (CC BY). The use, distribution or reproduction in other forums is permitted, provided the original author(s) and the copyright owner(s) are credited and that the original publication in this journal is cited, in accordance with accepted academic practice. No use, distribution or reproduction is permitted which does not comply with these terms.
*Correspondence: Marga L. Rivas, mrivas@ual.es; mlrivas@uca.es
†These authors have contributed equally to this work