Long-term trends in functional diversity of exploited marine fish in the Azores’ archipelago: past and present
 Eudriano F. S. Costa
 Neus Campanyà-Llovet
 Daphne Cuvelier
 Gui M. Menezes
 Ana Colaço
- 1OKEANOS – Institute of Marine Sciences, University of the Azores, Horta, Portugal
- 2IMAR - Instituto do Mar, Departamento de Oceanografia e Pescas, University of the Azores, Horta, Portugal
Introduction: Effective fisheries management requires monitoring and quantifying changes in exploited fish communities. Concerns about global fisheries sustainability have led to innovative approaches. Functional diversity, rooted in ecological theory, offers valuable insights into fishery activities and ecosystem processes. A trait-based approach was used to investigate the functional diversity of landed fish species in the Azores archipelago from 1980 to 2021.
Methods: Landings data of exploited Actinopterygii and Elasmobranchii were provided by the Azores Fisheries Auction Services (LOTAÇOR/OKEANOS-UAc Fisheries Database). A trait matrix was built, incorporating 12 functional traits assigned to each species, capturing their importance in marine ecological processes. The Quickhull algorithm for convex hull was employed to calculate the volume occupied by the species in the four-dimensional functional space. Functional diversity (FD) was measured using three indices: functional richness (FRic), functional evenness (FEve), and functional divergence (FDiv). Trends in FD indices over the past 42 years were visualized using Generalized Additive Models (GAM) with interaction terms.
Results and discussion: GAM analysis revealed significant variations in the functional space and FD metrics over time. FRic exhibited peaks in the 1980s and 2010s, declining in the 1990s and from the 2010s onwards, indicating diversification in target species. The recent decrease in FRic can be attributed to the absence of catches of species with unique traits. The distribution of landings and trait combinations showed higher regularity in the functional space during the 1980s and 1990s (high FEve). Actinopterygii species targeted in the 1980s and 1990s had lower trait divergence (low FDiv) compared to those targeted from the 2000s onwards (high FDiv). Variability in FD can be linked to changes in fishing practices, species availability, market demand, environmental factors, and local regulations. This study underscores the importance of considering FD metrics alongside species richness and abundance when assessing the potential effects of fisheries on marine ecosystems and sustainable use of fishery resources.
1 Introduction
Monitoring and quantifying changes in fish communities under exploitation is crucial for effective fisheries management (FAO, 2005; Hilborn et al., 2020; Artetxe-Arrate et al., 2021). Traditionally, fisheries management has primarily relied on species-based approaches, focusing on factors such as species composition, fish size and catches or biomass (Christensen et al., 2014; Froese et al., 2017; Hilborn et al., 2020; Medeiros-Leal et al., 2023). However, concerns about the sustainability of global fisheries have escalated in recent decades, driving researchers and policymakers to actively explore innovative approaches for assessing and managing fish populations (Bradley et al., 2019; Hilborn et al., 2020). One approach that has gained recognition in this context is functional diversity, which is derived from ecological theory and provides valuable insights into the fishery activities and ecosystem processes (Mouillot et al., 2013; Mouillot et al., 2014; Villéger et al., 2017; Trindade-Santos et al., 2020; Carrington et al., 2021; Rincón-Díaz et al., 2021; Zhao et al., 2022a; Zhao et al., 2022b). This approach focuses on the traits that species possess (e.g., feeding habits, size at maturity, fecundity, habitat preferences) and how these traits affect their interactions with the environment and other organisms (Pease et al., 2012; Törnroos and Bonsdorff, 2012; Carrington et al., 2021). By considering traits as function proxies, the trait-based approach enhances traditional methods and provides additional information that describes the ecological roles of the fish species in the ecosystem (Mouillot et al., 2014; Villéger et al., 2017; Beukhof et al., 2019; Sgarlatta et al., 2023). Combining these traits creates a multi-dimensional trait space that represents functional diversity within a community. Each species can be assigned coordinates within this trait space to indicate their specific functional attributes and ecological functions (Villéger et al., 2008; Villéger et al., 2011; Maire et al., 2015; Villéger et al., 2017; Carrington et al., 2021). This approach provides a quantitative framework to analyze and compare functional diversity across different communities, habitats, and temporal scales (Rincón-Díaz et al., 2021; Zhao et al., 2022a; Zhao et al., 2022b).
Although relatively new to fisheries science, the concept of functional diversity has been increasingly applied to gain a deeper understanding how fishing pressure affects the functional composition, stability and resilience of exploited fish populations, shedding light on the effect of fishing activities on ecosystem functioning (Mouillot et al., 2014; Mbaru et al., 2019; Trindade-Santos et al., 2020; Carrington et al., 2021; Rincón-Díaz et al., 2021). By examining the diverse functional traits of exploited fish over time, catches and their interactions with the fishing behavior, fishing gears and environment, functional diversity provides valuable insights into the sustainability of fishery resources (Mouillot et al., 2014; Nash et al., 2017; Mbaru et al., 2019; Trindade-Santos et al., 2020; Rincón-Díaz et al., 2021; Zhao et al., 2022a; Zhao et al., 2022b). Incorporating this approach into fisheries science enables a more holistic assessment of ecosystem health and informs the development of targeted management strategies that minimize negative impacts on fisheries resources, habitats, and overall ecosystem health (Trindade-Santos et al., 2020; Rincón-Díaz et al., 2021).
Fisheries are an essential component of the Azores archipelago’s economy and culture. Due to the artisanal and traditional fishing practices prevalent in the region, small-scale fishing, which represents between 80-90% of the fleet, significantly contributes to the overall fishery production (Morato, 2012; Diogo et al., 2015). Fishing operations in the Azores archipelago often concentrate on nearshore areas and seamounts, targeting a diverse range of fish species with very different economic values, and that occupy different ecological niches and depths (Menezes et al., 2006; Menezes et al., 2013). For instance, catch composition encompasses various migratory and nonmigratory pelagic (e.g., Katsuwonus pelamis, Thunnus obesus, Trachurus picturatus, and Xiphias gladius), demersal species (e.g., Conger conger, Beryx decadactylus, Helicolenus dactylopterus, and Scorpaena scrofa), coastal species (e.g. Sparisoma cretense, Balistes capricus, and Kyphosus incisor) including sharks and rays (Menezes et al., 2013; Pham et al., 2013; Fauconnet et al., 2019; Santos et al., 2020a; Santos et al., 2020b; Parra et al., 2023). Demersal fisheries in the Azores have expanded from the island shelves to offshore seamount areas and deeper waters, mainly since the 1980s (Menezes, 1996; Sedberry et al., 1999; Menezes et al., 2006). Fishing in Azorean waters has been recognized as a region with commendable practices that support sustainable fishing practices in small-scale fisheries. This achievement can be attributed, at least in part, to the implementation of diverse local regulations (e.g., area-gear restrictions- Ordinance N° 101/2002; fishing effort reduction- Ordinance N° 1102-C/2000 and N° 43/2009; selectivity restrictions- Ordinance N° 101/2002 and N° 116/2018, Ordinance N° 92/2019) and the establishment of an efficient and unique system for fishery data collection that has been in operation since the 1970s (Pham et al., 2013; Santos et al., 2019; Medeiros-Leal et al., 2023).
Although significant efforts have been made to manage fishery resources sustainably in the Azores archipelago, there is a growing concern regarding overfishing, ecosystem degradation, biodiversity loss and the impacts of climate change on fisheries (Morato et al., 2006; Morato et al., 2010; Pham et al., 2014; Abecasis et al., 2015; Neves et al., 2021; Torres et al., 2022). This emphasizes the need for a deeper understanding of the changes occurring in fish communities exploited by Azorean fishing fleet (Pham et al., 2013; Fauconnet et al., 2019; Santos et al., 2019; Medeiros-Leal et al., 2023; Parra et al., 2023). To effectively address these concerns, long-term monitoring and new research approaches based on local information are crucial. Thus, the objective of this study was to investigate changes in the functional diversity of fish landed in the Azores archipelago over the past 42 years using a trait-based approach. By analyzing long-term trends in functional diversity, this research paper aims to provide insights into the implications of these changes for sustainable fisheries management and the ecosystem. This approach will offer valuable insights into the dynamics of fishing activities and support informed decision-making towards the conservation and responsible exploitation of marine resources in the Azores archipelago.
2 Materials and methods
2.1 Datasets
2.1.1 Landings data
The Azores archipelago is composed of nine volcanic islands located in the Macaronesia region of the North Atlantic Ocean, and Its Economic Exclusive Zone (EEZ) includes 461 identified seamounts (ICES, 2020) (Figure 1). The list of all species recorded in the Azorean islands was taken from Campanyà-Llovet et al. (2023) and Costa et al. (2023b). Landings data of Actinopterygii and Elasmobranchii exploited in the Azores archipelago from 1980 to 2021 were provided by the Azores Fisheries Auction Services (LOTAÇOR/OKEANOS-UAc)(www.lotacor.pt/). The scientific names of the species reported in the annual landings were taken from Santos et al. (1997) and Santos et al. (2020a). Throughout the text, the term ‘biomass of catch’ refers to the reported fish landings. Thus, the fish assemblage data frame contained the names of the species, fish group (Actinopterygii and Elasmobranchii) and biomass of catch annually reported in the Azorean landings. See also the electronic supplementary material for the list of all fish landed in Azores as well as the total biomass of catch by species (Supplementary Table 1, Costa et al., 2023a).
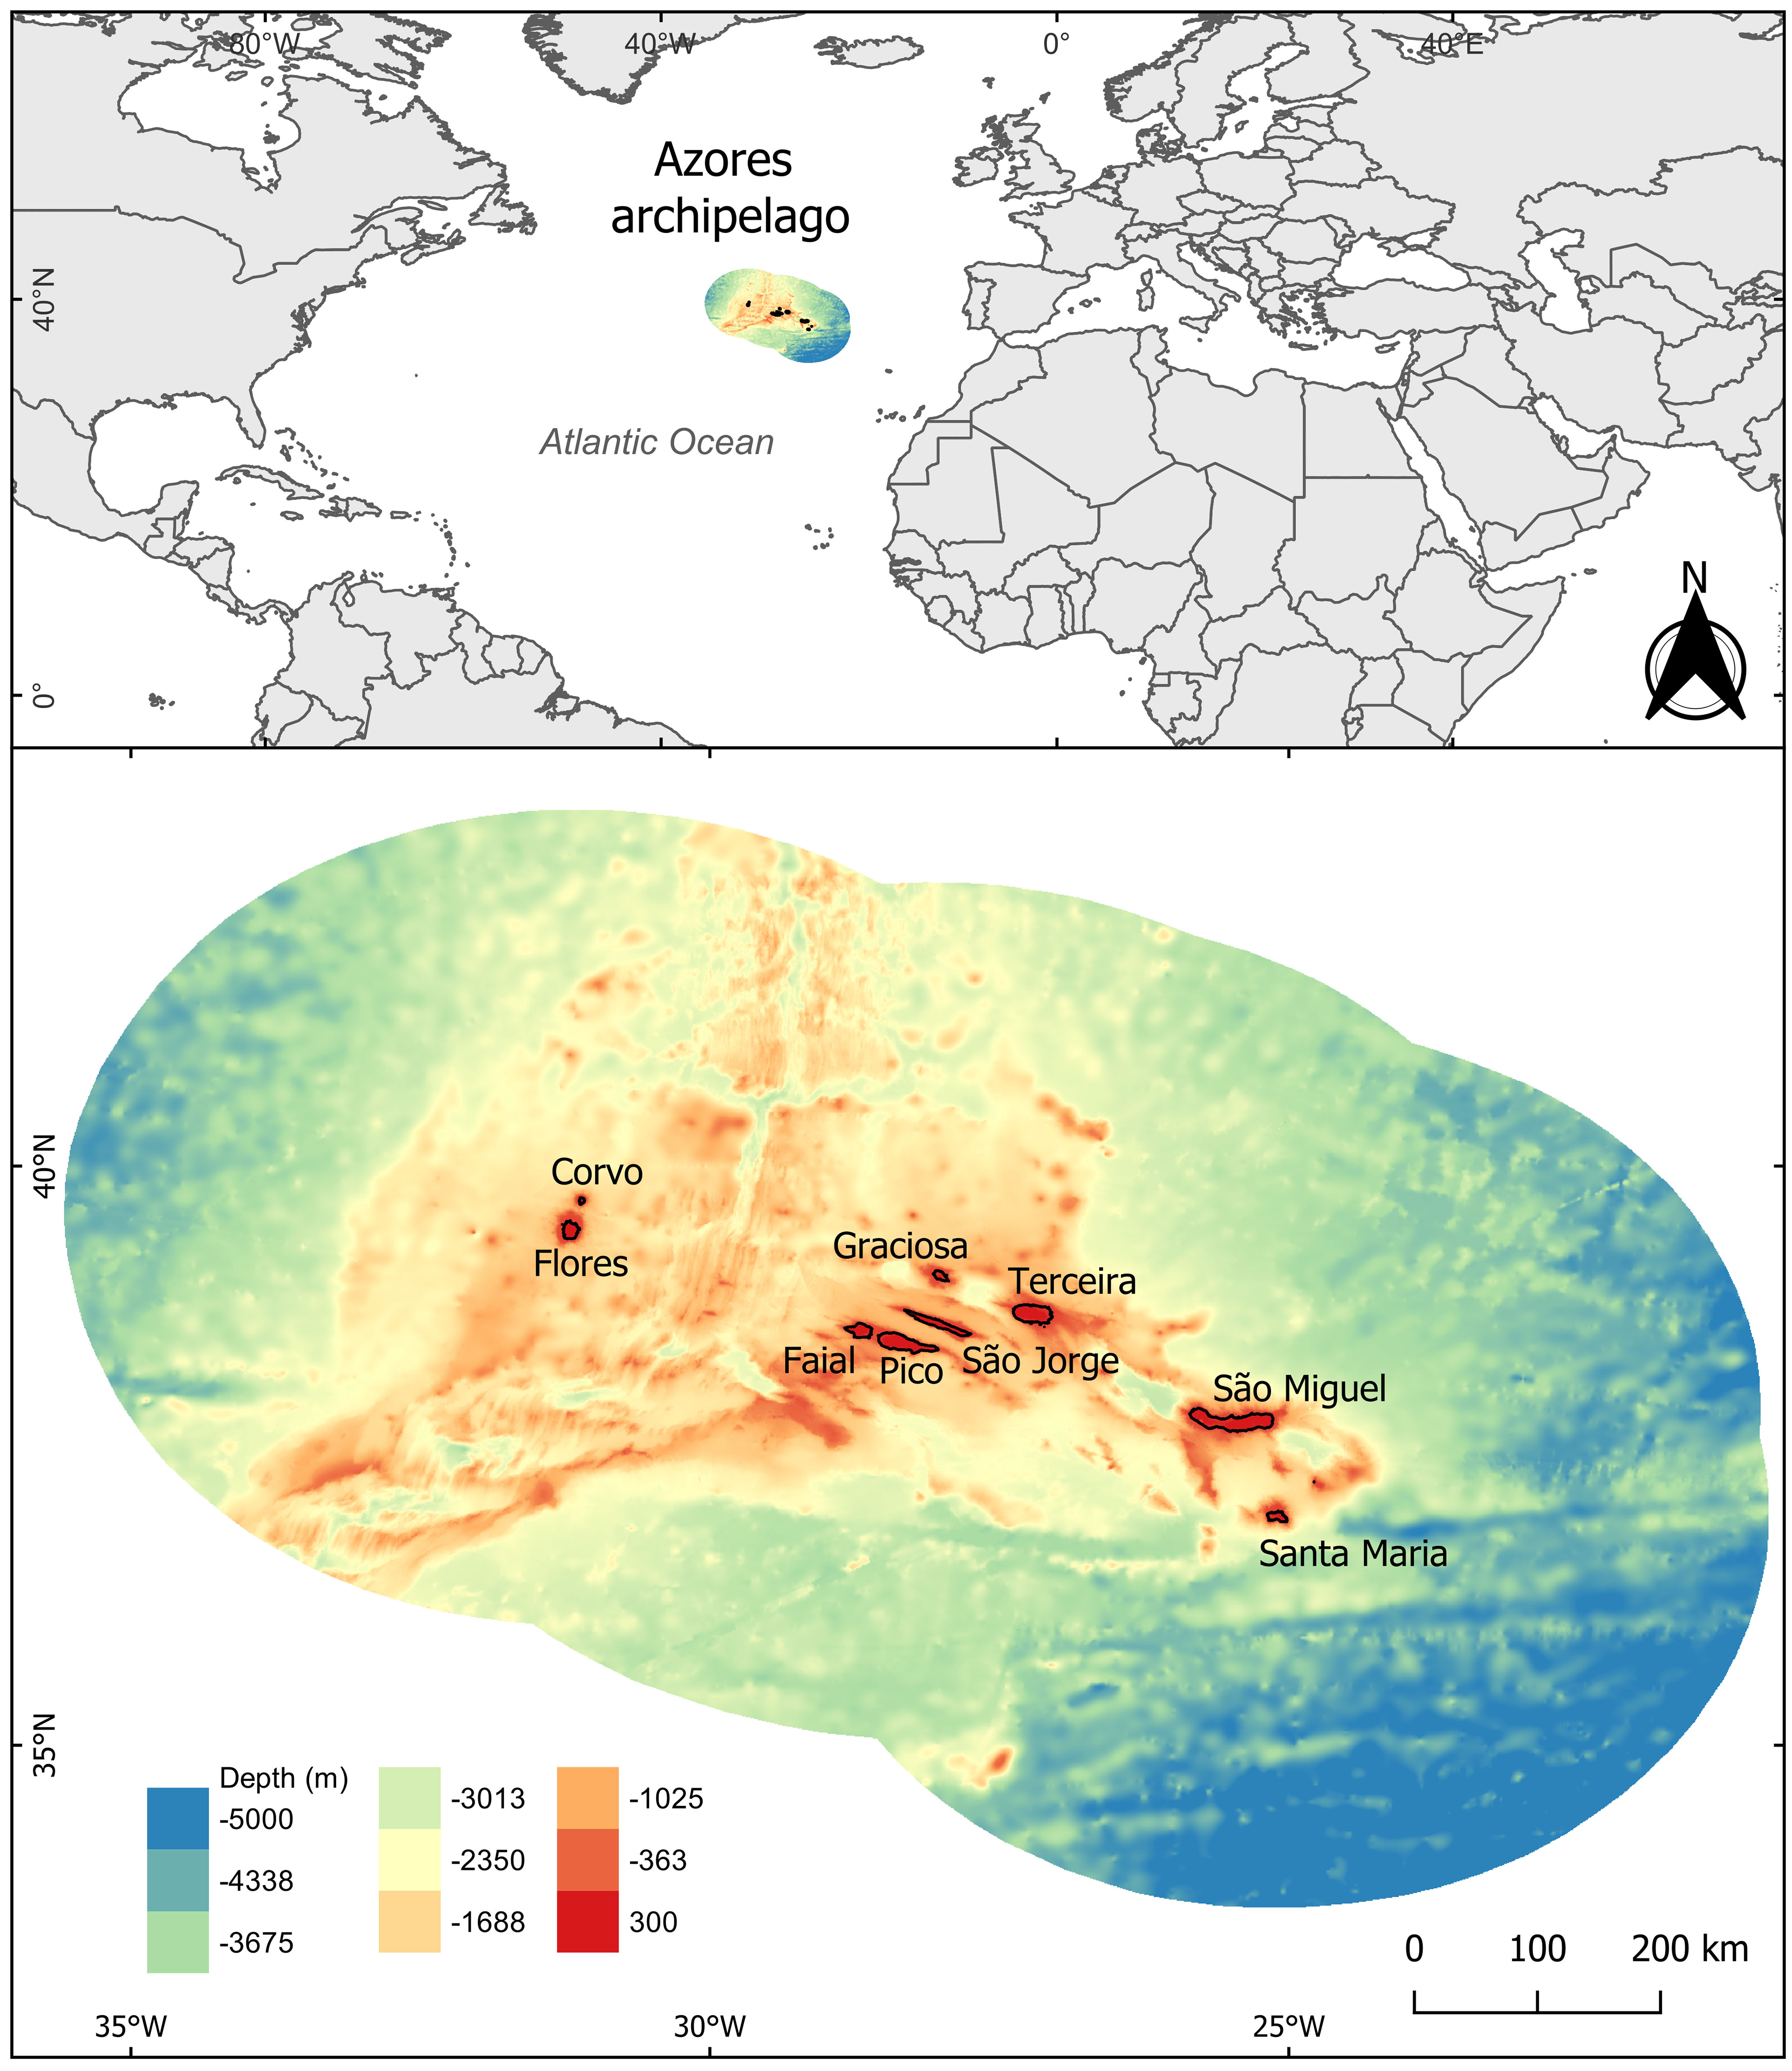
Figure 1 Azores archipelago map showing its islands and Economic Exclusive Zone.
2.1.2 Functional traits
The traits scores were assigned based on databases provided by FishBase (Froese and Pauly, 2023), and Trindade-Santos et al. (2020). Additionally, information from relevant literature was also utilized (Costa et al., 2023b). Thus, the trait matrix was built based on 12 functional traits (3 categorical, 2 ordinal and 7 continuous variables) assigned to each species (Table 1). These traits were selected based on the biological and ecological knowledge of species that are critical for ecological processes in marine ecosystem, as well as data availability. The selected traits were associated with the following fish functions: habitat use, locomotion, feeding and life-history (Table 1). Habitat use is linked to distribution, abundance, and fish diversity, as well as their interactions with other organisms in the ecosystem; for instance, some fish species may be adapted to living in deeper, colder waters, while others may prefer shallower, warmer waters (Gratwicke and Speight, 2005; Honda et al., 2013; Farré et al., 2016; Saunders et al., 2021; Scoulding et al., 2023). Locomotion contributes to the survival and fitness of fishes, facilitating food acquisition and improving their ability to avoid predators (Higham, 2007; Fu et al., 2019; Myers et al., 2020). Fish rely on feeding to obtain energy for growth, development, and reproduction (Gerking, 1994). Feeding behavior plays an important role in the ecosystem, influencing trophic interactions, nutrient cycling, and interspecific and intraspecific competition in the ecological areas (Stergiou and Karpouzi, 2002; Ward et al., 2006; Mézo et al., 2022). Life-history traits (e.g., growth rate, size at maturity, generation time, and fecundity) can affect the reproductive success and survival of individual fish as well as the dynamics of fish populations (King and McFarlane, 2003; Winemiller, 2005; Morales-Nin, 2009). For example, fish species that provide parental care (e.g., egg care or incubation) usually have higher embryonic survival, while fish that spawn in the water column exhibit lower success due to the dispersion of the gametes and high egg mortality (Morales-Nin, 2009). Conservation status of species was added to the trait matrix using the information from the IUCN Red List of Threatened Species (www.iucnredlist.org/) (retrieved 20 August 2022), using the R package ‘rredlist’ (Chamberlain, 2018). The IUCN categories were reclassified as data deficient (data deficient and not available categories), least concern, near threatened and threatened (critically endangered, endangered, and vulnerable categories) (Supplementary Table 1). To ensure that there was no redundancy among the traits, a pairwise correlation matrix was performed using the function ‘sjp.corr’ from the R package ‘sjPlot’ (Laughlin, 2014; Lüdecke, 2023). The final trait matrix included only traits that exhibited weak correlations (weaker than ± 0.5) (Carrington et al., 2021). As a result, the estimation of multidimensional functional spaces did not include body size and mean temperature preference, as these variables exhibited a significant correlation with other factors (Supplementary Figure 1).
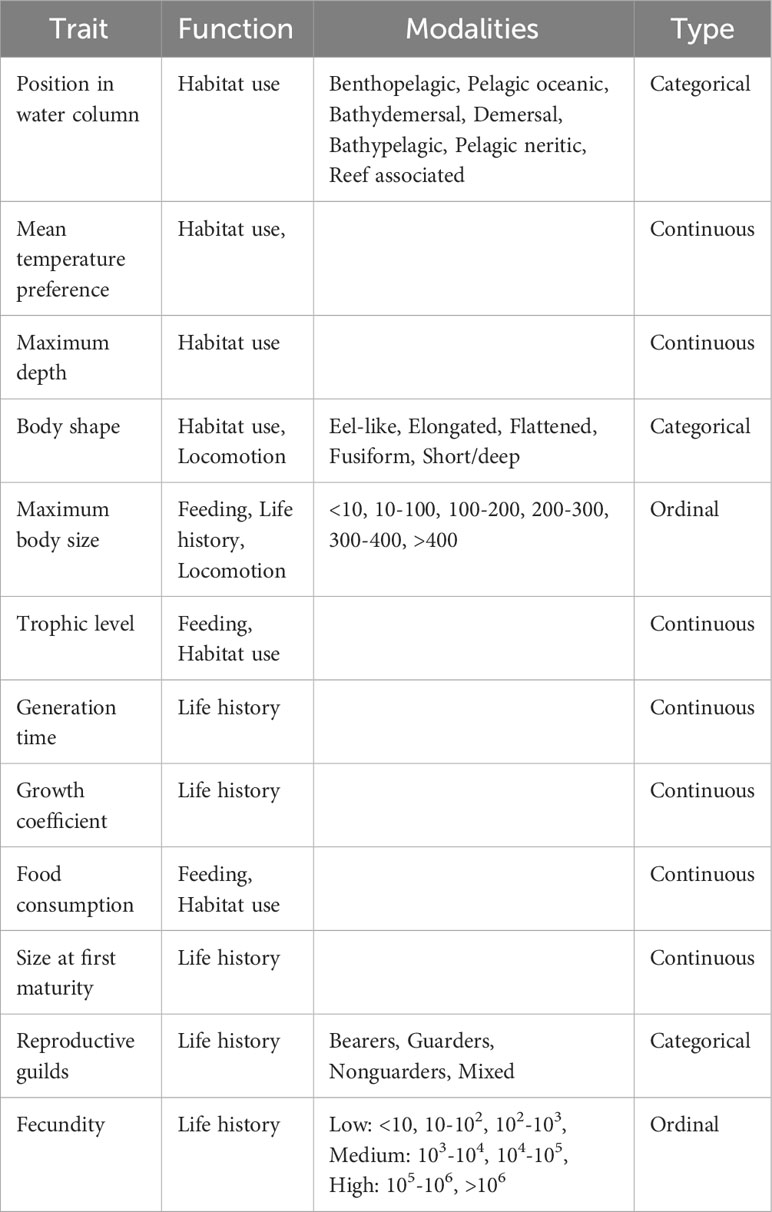
Table 1 Functional traits used to estimate the functional diversity indices.
2.2 Multidimensional functional space
The functional space was built using the functional traits of all species in an n-dimensional space. Gower’s distance was used to calculate the multivariate distance between species, and to build the functional dissimilarity matrix. Gower´s distance was chosen because it can handle different type of traits (e.g., continuous, ordinal and categorical), missing trait values and when individual traits need to be weighted differently (Laliberté and Legendre, 2010; Villéger et al., 2011). Then, Principal Coordinates Analysis (PCoA) was applied to the dissimilarity matrix to determine the position of each species in the four-dimensional functional space based on its combination of functional traits (Villéger et al., 2008). The volume occupied by the species in the functional space was computed using the Quickhull algorithm for convex hull (Barber et al., 1996; Villéger et al., 2008). This hull enclosed all species in the four-dimensional functional space, reducing the amount of empty spaces (Barber et al., 1996; Conwell et al., 2006). The functional space was calculated for all fish species recorded in the Azores archipelago, all exploited species and each assemblage reported in the annual catches. In particular, the functional space for all species documented in the Azores islands was calculated to quantify the portion occupied by the exploited species within that space. All analyses were focused on the functional space of exploited species, which refers to the species reported in the landings over the past 42 years.
The quality of the functional space was evaluated based on the mean squared deviation (mSD) using the function ‘quality_funct_space()’ (Maire et al., 2015). The mSD values range from 0 to 1, and a high-quality functional space is indicated by an mSD lower than 0.01 when considering at least four dimensions (Maire et al., 2015).
Thus, the four dimensions functional spaces of exploited species (i.e., PC1, PC2, PC3, and PC4) had good quality (mSD < 0.0035) and explained 65% of the variability observed in the data (Supplementary Figures 2–4). The correlation between the functional traits and the axes of the functional spaces was assessed by the “traits.faxes.cor()” function from the R package mFD (Magneville et al., 2022). Thus, changes in the species positions along PC1 (32.6%) were driven by all traits, while PC2 (14.5%) was influenced by all categorical traits and maximum depth. Only the reproductive guilds trait was found to have no significant correlation with the PC3 (9.5%) functional axis. Finally, PC4 (8.4%) was driven by body shape, position in water column, generation time, growth rate and food consumption (Supplementary Table 2; Supplementary Figures 5, 6). The four-dimensional functional space, which was computed for the species pool, Actinopterygii, and Elasmobranchii, along with the biomass of the catch data, was used to compute the functional diversity indices. Although the functional space for Elasmobranchii was computed, functional diversity indices were not calculated for this group due to the small number of species in comparison to the number of traits in most years, as recommended by Mouillot et al. (2013).
2.3 Functional diversity
FD was calculated based on three complementary indices: Functional richness (FRic), functional evenness (FEve), and functional divergence (FDiv). The FRic represents the amount of functional trait space (convex hull) occupied by the species, considering the role that each species play in the community and ecosystem; FEve indicates changes in how evenly the reported catches, in terms of biomass of catch, are distributed in the four-dimensional functional space; and FDiv the extent to which the species recorded with highest biomass of catch are positioned towards the functional space periphery, indicating how fisheries are removing species with more divergent traits over time (Villéger et al., 2008; Trindade-Santos et al., 2020). FD indices were calculated using the ‘multdimFD function’ (Mouillot et al., 2013).
2.4 Statistical analysis
2.4.1 Data standardization
Numerical traits and biomass of catch data were both standardized to an equal range (0-1 scale) according to x’ = x- min(x)/[max(x)-min(x)] where x is the original value and x’ is the standardized value (Williams, 2011; Mouillot et al., 2013).
2.4.2 Variability in catch composition
Permutation Analysis of Variance (PERMANOVA) with 999 permutations was used to test whether taxonomic richness and the relative biomass of the species caught varied significantly over years. The former hypothesis was tested using the presence (1) or absence (0) of species over the years, whereas the latter was carried out with the biomass of catch data. Prior to PERMANOVA analysis, the Hellinger transformation was applied to the landing data (Legendre and Gallagher, 2001). The presence-absence and biomass of catch matrices were built using Bray-Curtis distance similarity. Both matrices were also used to evaluate the pattern dispersion of the data among years, i.e., tested for homogeneity of multivariate dispersions (Anderson, 2006; Oksanen et al., 2022).
2.4.3 Null models
FRic is influenced by the species richness of the communities, i.e., by the number of species reported in the catches by year. In other words, FRic increases monotonically with species richness, indicating that observed values of FRic can increase in the absence of any change in the community process (Mason et al., 2008; Mason et al., 2013). Changes in FRic trends due to the corresponding increases in the species richness can lead to spurious conclusions about changes in the community process (Mason et al., 2013). Thus, null models were performed to remove any trivial effects of the species richness on FRic (Rader et al., 2014). A total of 999 assemblages were generated based on a random subset of species, and computed FRic values for each year and each simulation. In order to simulate realistic assemblages, all species in each assemblage had the same probability of being selected, and the number of species was kept constant during the random choice process (999 interactions). The standardized effect size (SES) was estimated using the null model results as follows: FRicobs ─ mean (FRicnull)/sd (FRicnull), where obs is the observed values and null the expected values (Rader et al., 2014). The significance of the difference from null expectations was tested using a two-tailed test (p<0.05). The standardized values were also used to evaluate trends in FRic across the years.
2.4.4 Trends in FD indices over time
Generalized Additive Models (GAM) with interaction terms were carried out to visualize trends in FD indices over the years. The fitted GAMs were based on a Gaussian distribution, considering each FD index (FRic, FRicnull, FRic, FEve and FDiv) as the response variable, the Year as a covariate, and species pool (Actinopterygii + Elasmobranchii) and Actinopterygii as factors. The syntax of the GAM models can be illustrated as: gam(FD ~ Factors + s(Year, by= Factors)), where s is the smooth function of the covariate which varies between different factor levels (Wood, 2017; Wood, 2019). However, for Elasmobranchii, the general trends in FD indices were investigated by subtracting the smooth curves of the species pool by Actinopterygii, according to Rose et al. (2012). The differences between pairs of the two smooths, standard error, confidence intervals are available at Costa et al. (2023a).
3 Results
3.1 Composition and structure of the fish assemblages in the landings
In the Azores archipelago, 613 species characterize the fish functional space, with a total of 113 species being recorded in the fishery catches over the past 42 years, including 97 Actinopterygii and 16 Elasmobranchii. Although some threatened Actinopterygii species were recorded in the catches (11%), the majority of the species were classified as of least concern (75%) (Supplementary Figure 7). Out of the reported Elasmobranchii, seven species were classified as not threatened (43%) and nine as threatened (56%) (Supplementary Figure 8). Overall, the composition and structure of the caught assemblages, in terms of biomass, varied significantly over the past 42 years (Permanova, p<0.01; Supplementary Tables 3, 4). Taxonomic richness for both Actinopterygii and Elasmobranchii showed an increase from an average of 61 (minimum= 52, maximum= 72, standard deviation= 6.80) during the 1980s and 1990s to 80 (minimum= 54, maximum= 89, standard deviation= 9.93) over the past 20 years. (Supplementary Figures 9A). The trends in biomass of catch also varied significantly over time, with two peaks occurring in 1995 and 1996 and between 2010 and 2012 (Supplementary Figure 9B). There was no association between the biomass of catch and taxonomic richness (Supplementary Figure 9C). Temporal variation in the total biomass of catch for the species pool, Actinopterygii and Elasmobranchii can be seen in Supplementary Figure 10.
3.2 Functional diversity metrics
The correlation between FD indices and the variables taxonomic richness and biomass of catch exhibited different relationships. FRic and taxonomic richness showed a significant positive correlation, as expected (Figure 2A). However, FRic was not associated with the biomass of catch (Figure 2B). FEve decreased as taxonomic richness increased, and it exhibited a weak positive correlation with the biomass of catch (Figures 2C, D). There was no significant association between FDiv and taxonomic richness, but there was a positive correlation with the biomass of catch (Figures 2E, F). Overall, observed FRic over the years did not significantly differ from those estimated by the null model (expected FRic or null FRic) for both species pool and Actinopterygii (Supplementary Figures 11–14). However, in the last five years, there were recorded values of observed FRic that were significantly lower than the expected FRic. The negative SES indicated that the observed functional volume was lower than what would be expected by chance, indicating a possible effect of fisheries filtering on fish assemblages (Figure 3).
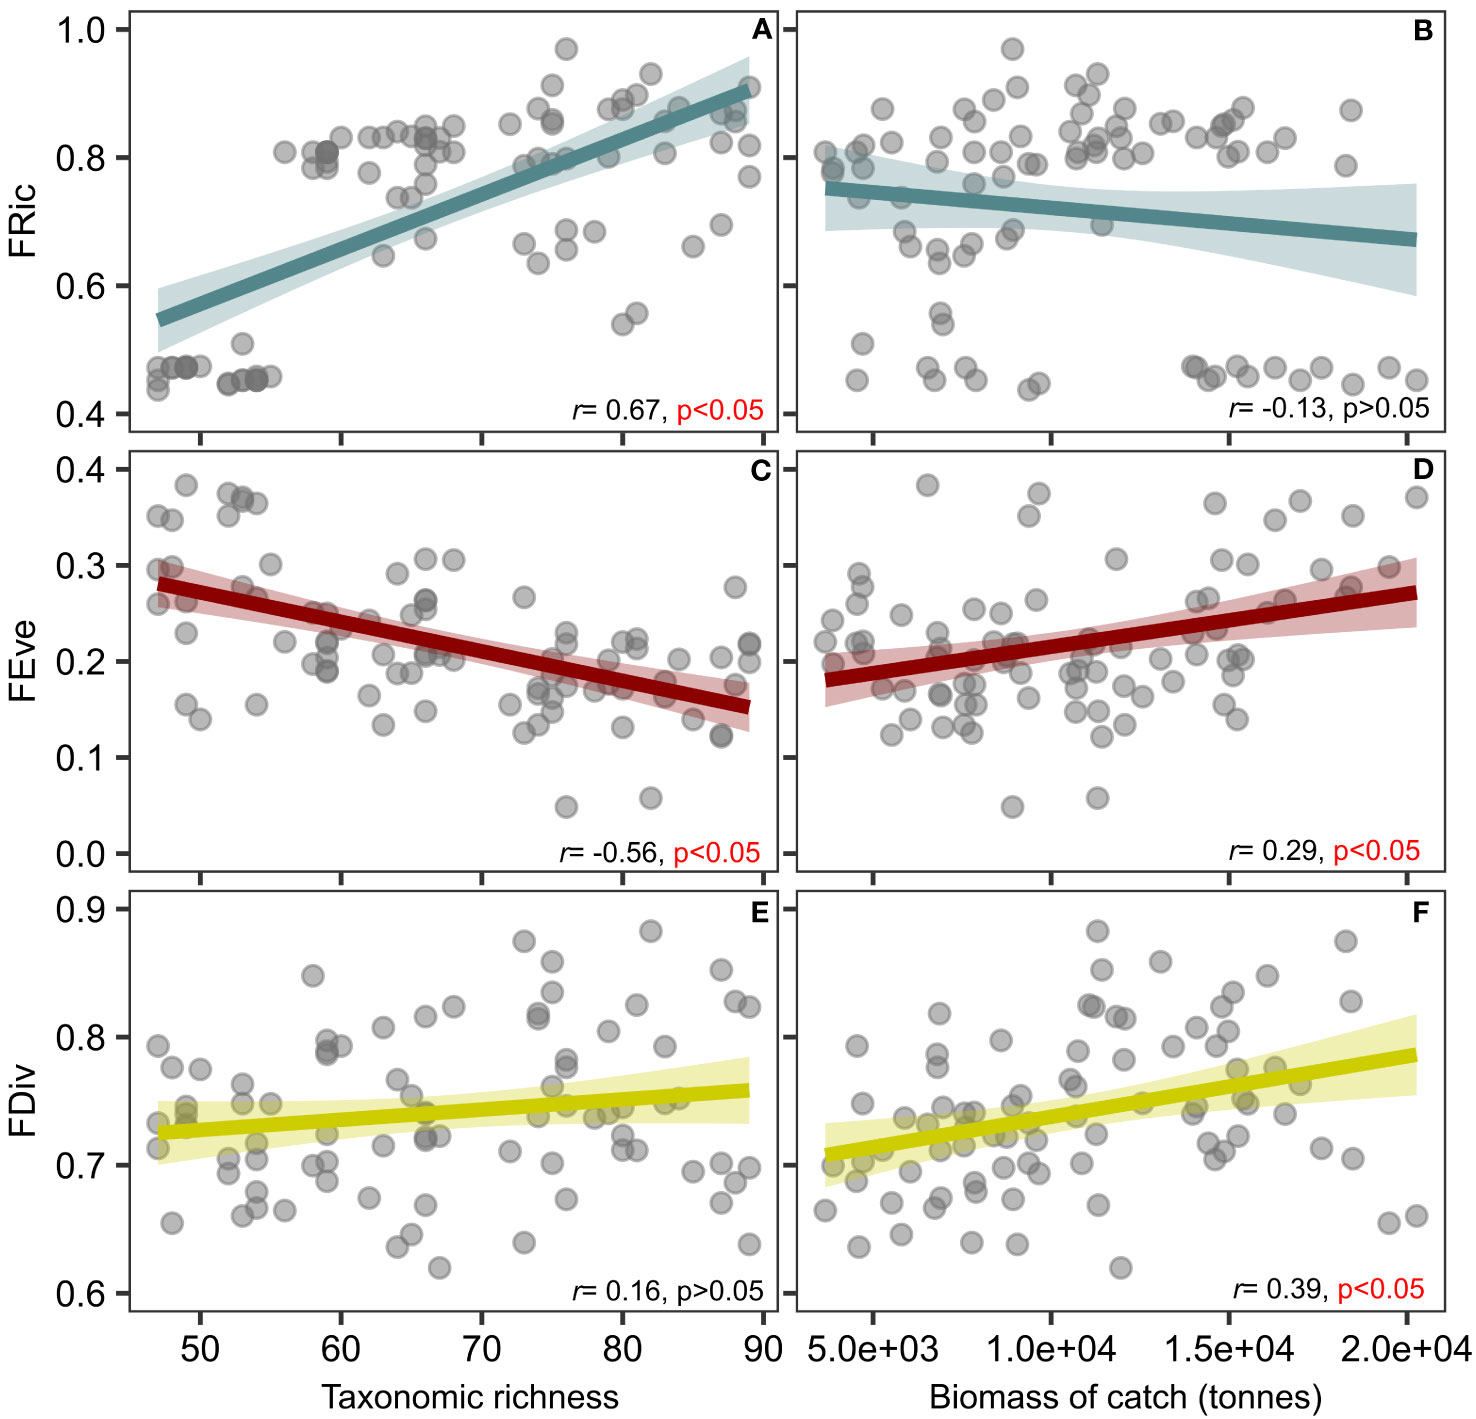
Figure 2 Relationship between functional diversity indices (FRic- functional richness, FEve- functional evenness, and FDiv- functional divergence) and the variables taxonomic richness and biomass of catch. (A) correlation between FRic and taxonomic richness, (B) correlation between FRic and biomass of catch, (C) correlation between FEve and taxonomic richness, (D) correlation between FEve and biomass of catch, (E) correlation between FDiv and taxonomic richness, (F) correlation between FDiv and biomass of catch. Shaded area represents the 95% confidence interval for the fitted linear regression. r = Pearson’s correlation coefficient.
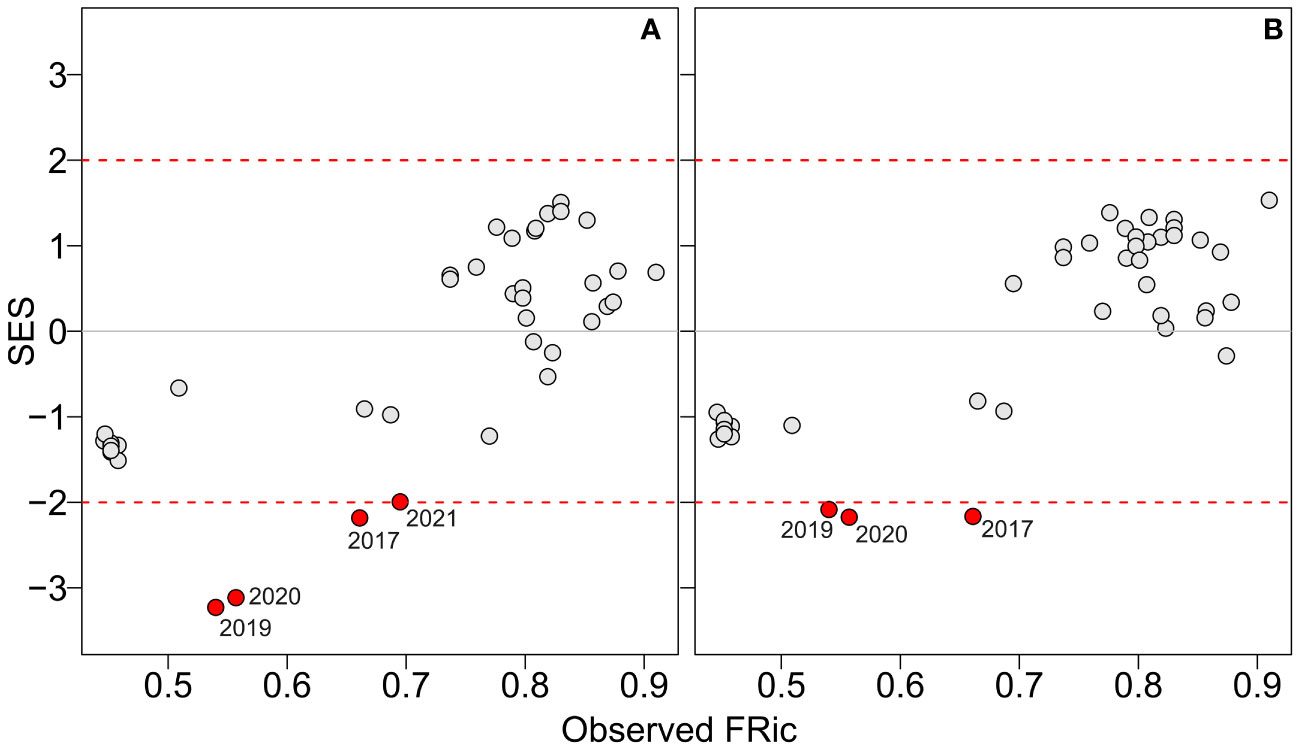
Figure 3 Relationship between observed functional richness (FRic) and standardized effect size for two sets of simulated assemblages: (A) assemblages randomly assembled from the species pool, and (B) assemblages randomly assembled from the Actinopterygii group. The borders of significance, represented by dashed red lines, indicate when FRic values were significantly higher or lower than the 5% of the null communities (red points).
3.2.1 Trends in functional richness
In general, the landed species occupied 28% (FRic= 0.28) of the four-dimensional functional space within the combined group of Actinopterygii and Elasmobranchii species recorded in the Azorean waters, indicating that the species reported in the catches had a substantial presence in terms of functional traits (Supplementary Figure 15). However, GAM analysis revealed a significant variation of the functional space of exploited species, i.e., FRic, over the past 42 years (Table 2). FRic showed two peaks in the 1980s and 2010s, with a decrease in the 1990s for species pool. However, when using standardized values from the null models (null FRic), it was observed that FRic drastically decreased over the last 12 years (Figure 4A). A similar trend was observed for Actinopterygii when using non-standardized data, whereas null FRic showed only a slight change with a discrete peak in the 2000s (Figure 4B). The highest FRic values for Elasmobranchii were recorded in the 1980s, with a decreasing trend from 2010 onwards (Figure 4C). The analyses of the functional space occupied by the species during the periods of highest and lowest FRic values revealed diversification of target species, with changes in the species located in the vertices of the functional space over the years (Figure 4D). Thus, although many species were recorded in the catches for 42 years (e.g., alb- Thunnus alalunga, bon- Sarda sarda, coe- Conger conger, and rjc- Raja clavata), some species were only reported from 2000s onwards (e.g., poa-Brama brama, sdr- Synodus saurus, cbr- Serranus cabrilla, and sdu- Deania profundorum) (Figure 4D; Supplementary Figures 7, 8). Supplementary Figures 16–21 provide information on the variation in the functional spaces, species composition and FRic from 1980 to 2021 for PCs 1 and 2, as well as for PCs 3 and 4.
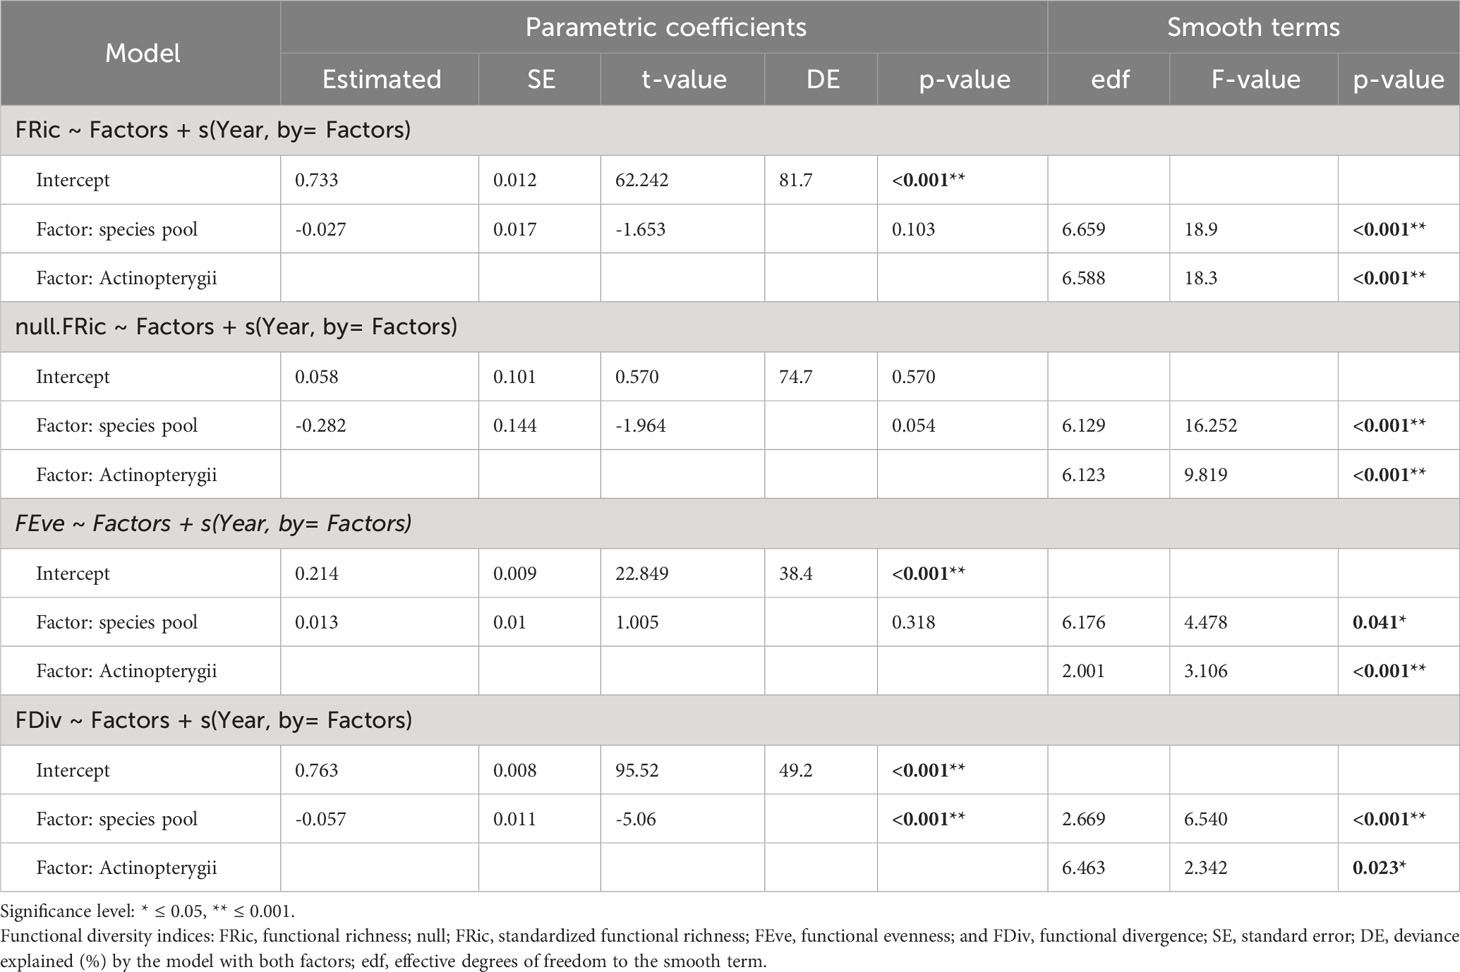
Table 2 Results of the Generalized Additive Models (GAM) using interactive terms.
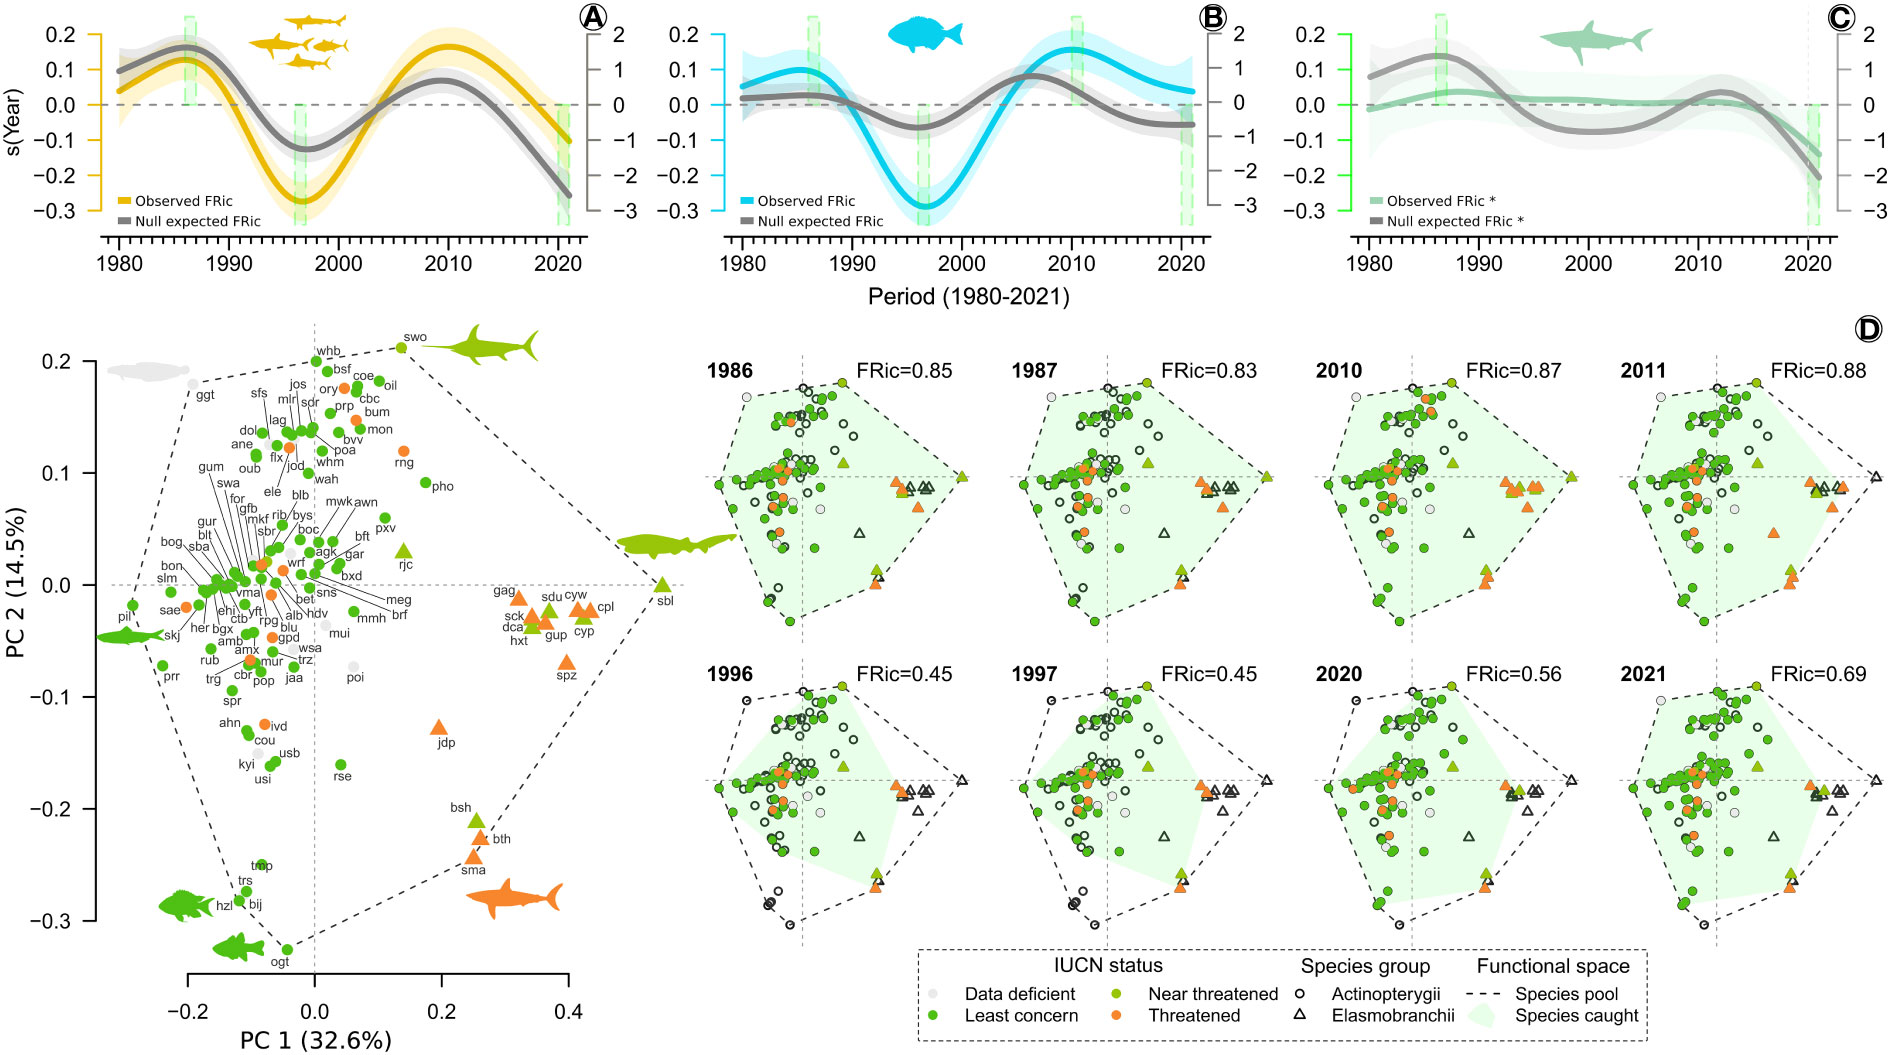
Figure 4 Trends in functional richness (FRic) and functional spaces from 1980 to 2021. (A) FRic trends for species pool; (B) FRic trends for Actinopterygii; (C) FRic trends for Elasmobranchii; and (D) distribution of the species in the functional space during the highest and lowest FRic. The shaded area in the trend line indicates 95% confidence interval. Open circles and triangles represent in the functional spaces species not recorded in the catches. Species with the most divergent traits positioned in the vertices of the functional space: sbl= Hexanchus griseus, Isurus oxyrinchus, hzl= Chromis limbata, ogt= Apogon imberbis, pil= Sardina pilchardus, ggt=Gaidropsaurus guttatus, swo= Xiphias gladius. 3-alpha code for all species is available in Supplementary Table 1. See also Supplementary Figures 17–20 for information on the variation in the functional spaces, species composition and FRic from 1980 to 2021 for PCs 1 and 2, as well as for PCs 3 and 4. *.
3.2.2 Trends in functional evenness
The highest FEve values were recorded in the 1990s for species pool, Actinopterygii and Elasmobranchii. A decreasing trend in FEve from the 2010s onwards was observed for the species pool (Figure 5A) and Actinopterygii (Figure 5B). However, there was a decrease followed by a slight variation in the FEve trend over the last 20 years for Elasmobranchii (Figure 5C). Changes in FEve trend over the years were generally linked to variations in catch biomass of fifteen Actinopterygii (e.g., Katsuwonus pelamis, Thunnus obesus, and Trachurus picturatus) and two Elasmobranchii species (e.g., Prionace glauca, and Dalathias licha), which were the ones with the highest recorded biomass of catch (Figure 5D) (Supplementary Table 1). These results revealed that in the 1990s, the species were more evenly distributed in the functional space, in terms of biomass of catch, than in the last 10 years. The low FEve also showed that only small number of species, particularly K. pelamis, T. obesus and T. picturatus, contributed significantly to the highest biomass of catch removed from the ecosystem by fisheries over the last 10 years. Supplementary Figures 24–27 provide information on the changes in FEve over time in relation to the position of the species in the functional space and those with the highest biomass of catch for PCs 1 and 2, as well as for PCs 3 and 4.
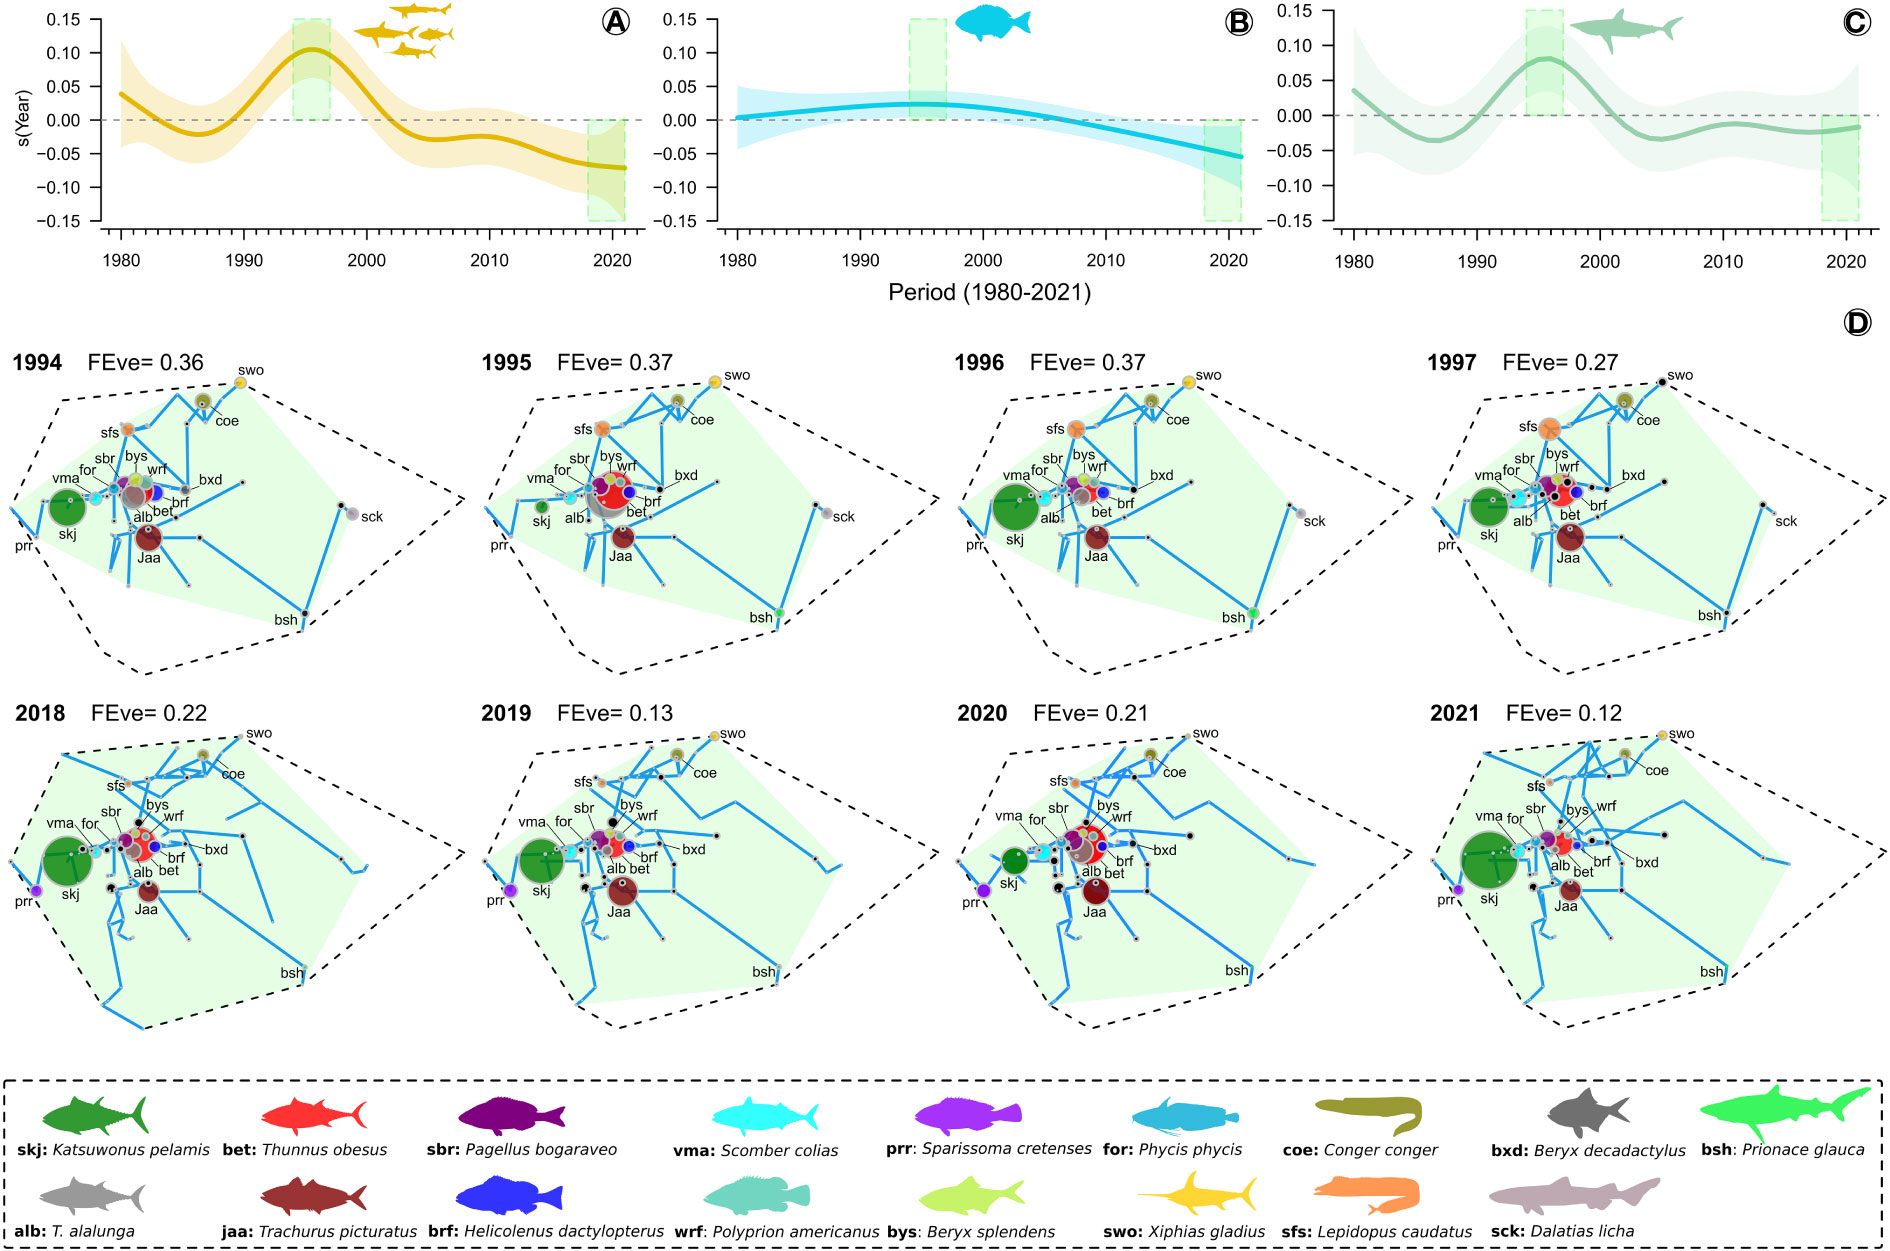
Figure 5 Trends in functional evenness index (FEve) from 1980 to 2021. (A) FEve trends for species pool; (B) FEve trends for Actinopterygii; (C) FEve trends for Elasmobranchii; and (D) evenness of the distribution of species in the two-dimensional functional space (PC 1 and PC 2) that contributed to the highest (years 1994, 1995, 1996 and 1997) and lowest (years 2018, 2019, 2020 and 2021) FEve. The shaded area in the trend line indicates 95% confidence interval. For figure (D), species with a catch biomass greater than 100 tonnes in at least one of the presented years are shown in a different color. Blue line represents the minimum spanning tree (MST) that connects all circles (see Villéger et al., 2008). The dashed line represents the functional space of the species pool, and the light green area represents the functional space of the caught species in each year. The size of the circles is proportional to the biomass of catch of each represented species. An illustrative figure representing variation in FEve in response to changes in the biomass of catch of the species in the functional space can be seen in the Supplementary Figure 22A. See also Supplementary Figures 23–27 for information on the variation of FEve in the functional spaces with all species from 1980 to 2021 for PCs 1 and 2, as well as for PCs 3 and 4.
3.2.3 Trends in functional divergence
The FDiv trend increased for species pool over time (Figure 6A). In general, Actinopterygii showed a similar trend, with the lowest FDiv values observed in the 1980s and highest values observed in the past five years (Figure 6B). This trend suggests that the species with the highest functional diversity, such as K. pelamis, has also becoming the most commonly caught species in fishing activities. In contrast, Elasmobranchi showed an inverse trend to Actinopterygii, with the lowest FDiv in the 1980s and the highest in the 2010s (Figure 6C). In addition, this group has experienced a declining trend in FDiv over the past five years. This decline suggests a potential decrease in the biomass of catch for Elasmobranchi species that possess the most divergent traits, such as D. licha (Figure 6C). The positions of the species with the highest biomass of catch in the functional space, exhibiting the most divergent traits (located towards the border of the functional space) and least divergent traits (located towards the centre of the functional space), as well as the corresponding FDiv values from 1980 to 2021, can be found in Figure 6D and Supplementary Figures 28–31.
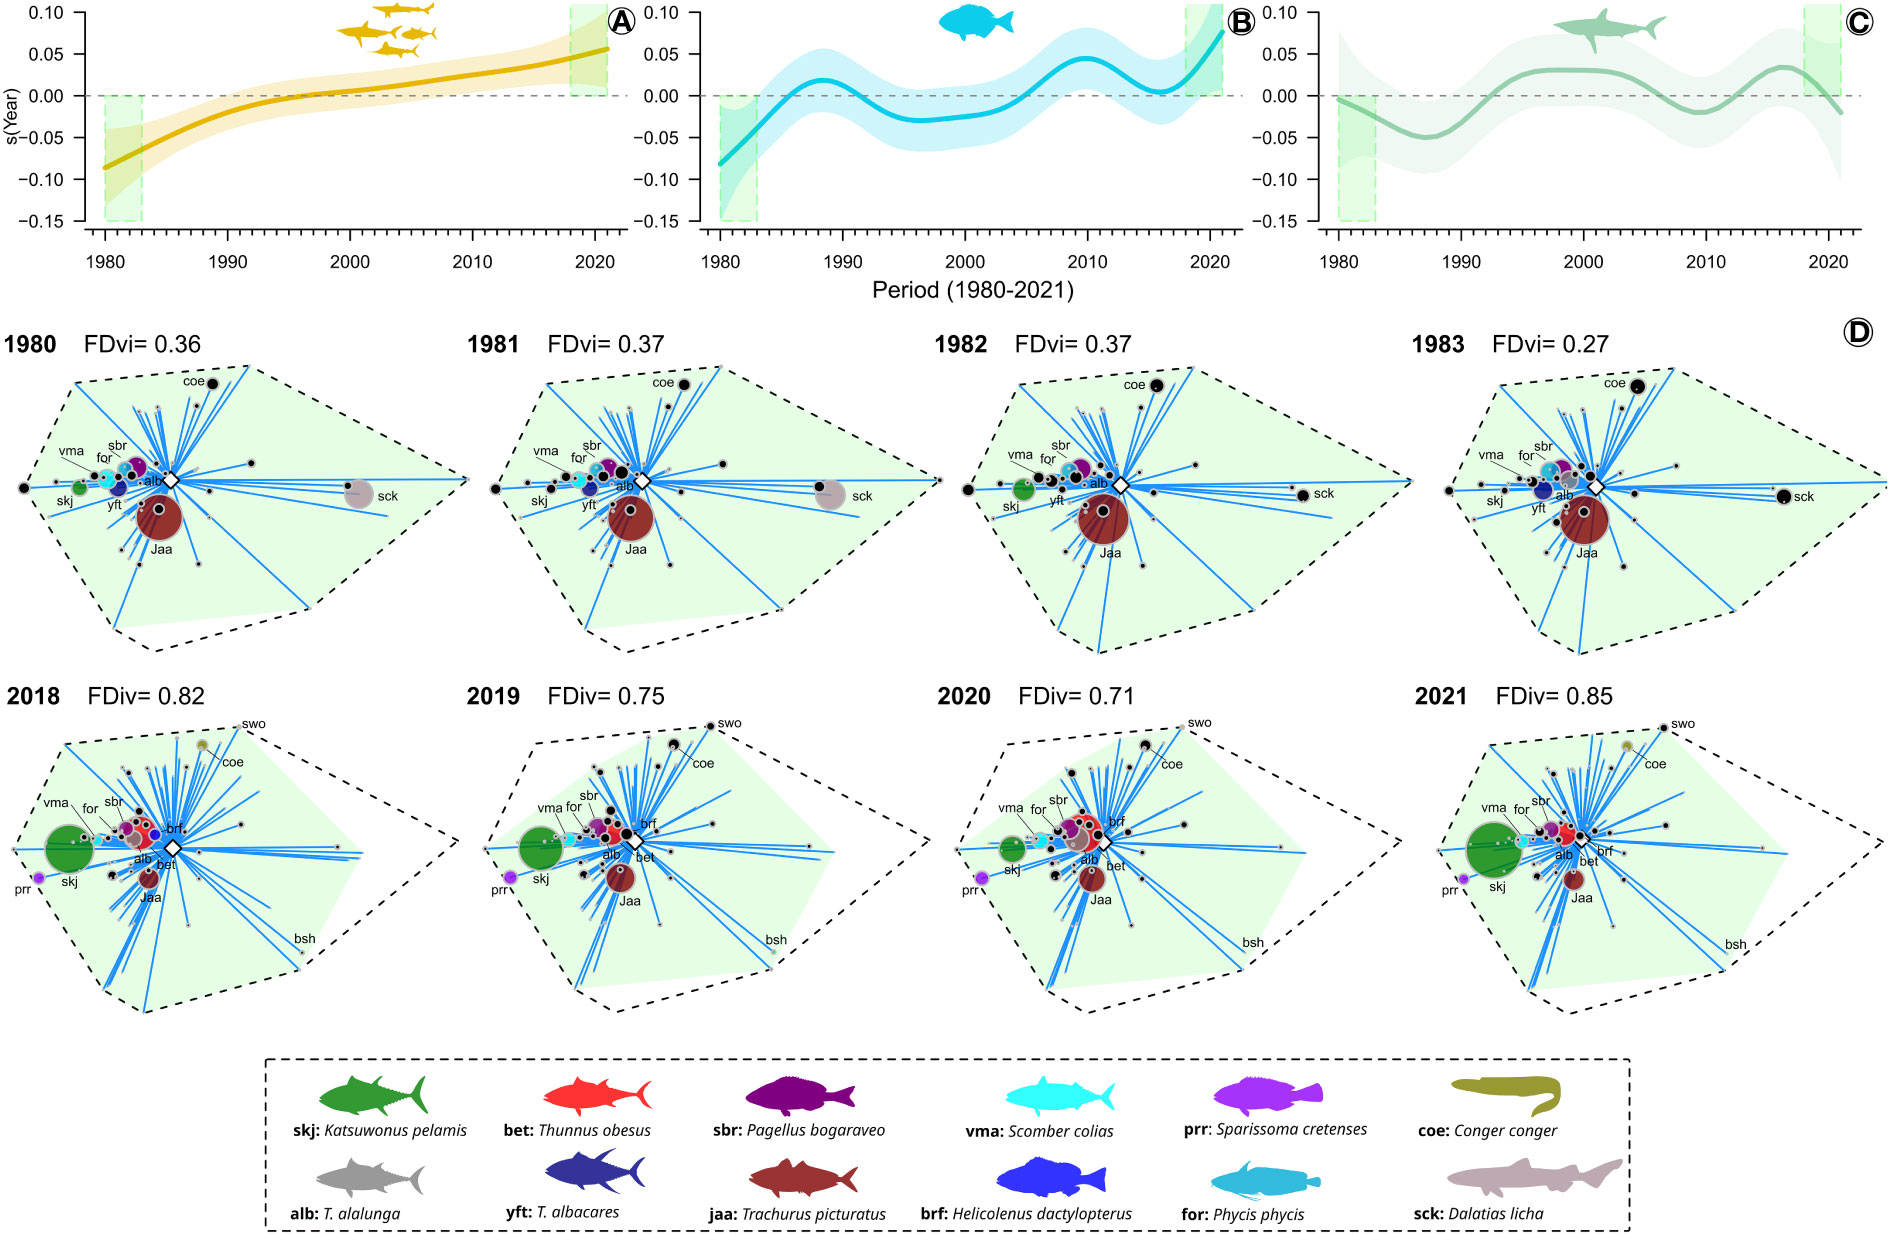
Figure 6 Trends in functional divergence (FDiv) from 1980 to 2021. (A) FEve trends for species pool; (B) FDiv trends for Actinopterygii; (C) FDiv trends for Elasmobranchii; and (D) Regularity of the distribution of species in the two-dimensional functional space (PC 1 and PC 2) that contributed to the (years 1980, 1981, 1982 and 1983) and lowest (years 2018, 2019, 2020 and 2021) FDiv. The shaded area in the trend line indicates 95% confidence interval. For figure (D), species with a catch biomass greater than 100 tonnes in at least one of the presented years are shown in a different color. Blue line connects each species to the center to the functional space (see Villéger et al., 2008). The dashed line represents the functional space of the species pool, and the light green area represents the functional space of the caught species in each year. The size of the circles is proportional to the biomass of catch of each represented species. An illustrative figure representing variation in FDiv in response to changes in the biomass of catch of the species in the functional space can be seen in the Supplementary Figure 22B. See also Supplementary Figures 28–32 for information on the variation of FDiv in the functional spaces with all species from 1980 to 2021 for PCs 1 and 2, as well as for PCs 3 and 4.”.
4 Discussion
Understanding the connection between the observed trends in functional diversity in catches is important for establishing the relationships between patterns in fisheries exploitation and the long-term functioning and resilience of ecosystems (Nash et al., 2017). In the Azores archipelago, the fishing sector has witnessed a shift in its practices over time (Diogo et al., 2015; Santos et al., 2019; Santos et al., 2020b). Over the past 42 years, these changes have resulted in the removal of a wide range of both bony and cartilaginous fish species from the ecosystem, along with their associated functional traits. Remarkably, landed species represented 28% of the functional space occupied by all fish species recorded in Azorean waters. The expansion in the variety of targeted fish species reflects several factors. Firstly, the introduction of new fishing gear has allowed fishers to target a broader range of species, thereby affecting the composition of catches. Secondly, the exploitation of new fishing grounds has expanded the fishing opportunities and increased the diversification of target species. Finally, the increase in the value of certain species has driven the targeting of those species (Morato, 2012; Pham et al., 2013). In addition, the application of international and regional fishing regulation measures in the Azores islands have a direct influence on the species catch composition and biomass of catch removed by fisheries annually, which in turn affects the functional diversity of catches (Pham et al., 2013; Santos et al., 2019; Santos et al., 2020b).
4.1 Functional richness
Functional richness of the landings, as well as the functional space, can be influenced directly by increasing the number of target species; however, this is not always true because the species may share similar trait combinations, having similar ecological functions in the marine ecosystem, known as functional redundancy (Villéger et al., 2008; Mouillot et al., 2014; McLean et al., 2019; Su et al., 2022). In systems with high functional redundancy, i.e., where the ecological roles are supported by many different species, the loss of species may not have immediate and apparent effects on ecosystem functioning. This is because other species with similar functions can compensate, thus enhancing resilience and adaptability to fishing activities (Mbaru et al., 2019; Rincón-Díaz et al., 2021). Overall, the positive relationship between taxonomic and functional richness suggests that Azorean fisheries targeted species with unusual combinations of ecological traits. This finding partially agrees with the trends of increasing taxonomic and functional richness observed for both Actinopterygii and Elasmobranchii in global fisheries catches over the past 65 years (Trindade-Santos et al., 2020). However, in contrast to this global trend, in Azorean waters, we found a significant decrease in FRic over the past 12 years, along with an increasing in taxonomic richness and significant variation in species catch composition. This suggests that the species recently added to the catches in Azorean waters are generally similar to or less functionally specialized in terms of their trait combinations compared to the species that already are being exploited. Therefore, the general positive correlation between FRic and taxonomic richness, as well as the decrease in FRic, can be attributed to the presence of species with unusual traits that ceased to be reported in the landings over the past 12 years and the decline or absence of catches of species that possess the most unusual combinations of traits. Examples of such functionally important species include Apogon imberbis, Gaidropsaurus guttatus, and cartilaginous fish such as Hexanchus griseus and Alopias superciliosus, which may play particular roles within the food web and participating in nutrient cycles, contributing complementary functions to ecological processes (Villéger et al., 2017). On the other hand, example of species recorded in the catches over the last decades that shared similar combination of trait positioned toward the center of the functional space include Lepidorhombus whiffiagonis, Polimixia nobilis, Acanthocybium solandri, Caranx crysos, Auxis rochei and the Elasmobranchii Dasyatis pastinaca.
4.2 Functional evenness
Fisheries target specific parts of the multidimensional functional space by focusing on species that possess similar combinations of traits (Martins et al., 2012; Mbaru et al., 2019; Trindade-Santos et al., 2020). Thus, fisheries may target species that share similar size ranges, predatory behavior, and those species occupying the specific trophic level within the food web (Pauly et al., 1998; Myers and Worm, 2003; Olden et al., 2007; Mbaru et al., 2019). For instance, large predatory fish species like tuna or swordfish are targeted for their size and market value (FAO, 2005). In Azorean fisheries, the biomass of the species caught, and their trait combinations were more regularly distributed in the functional space during the 1980s and 1990s (high FEve) compared to the pattern observed from the 2000s onwards (low FEve). With lower FEve values in the last decade, the distribution of biomass and trait combinations became less regular in the functional space, indicating a more focused targeting of a smaller group of species as well as a decrease in the diversity of species being caught (negative correlation between FEve and taxonomic richness, Figure 2D). According to Trindade-Santos et al. (2020), a decrease in FEve observed in the large marine ecosystems over time was attributed to an increase in catches of certain groups of species. In addition, fluctuations in total landings in the Azores archipelago are mainly caused by fluctuations in the tuna fisheries, which depend on live baitfish (mainly T. picturatus) (Morato, 2012; Pham et al., 2013). Our findings support these ideas, as an increase in the catch of specific species, such as T. picturatus, K. pelamis and T. obesus, contributed to the reduction of FEve in the Azores over the last two decades. Therefore, variability in FEve over time may be linked to changes in fishing practices, species availability, market demand, local legislation or other factors affecting the composition and biomass of catches.
4.3 Functional divergence
Fisheries are expected to impact the distribution of species within the functional space, particularly for target species with distinct trait combinations under exploitation (Villéger et al., 2008; Mouillot et al., 2013). As these species are progressively removed from the ecosystem, resulting in a rise in the recorded landings, there is a corresponding increase in functional divergence of catches (Mouillot et al., 2013; Zhao et al., 2022a; Zhao et al., 2022b). Our findings support this idea, as we observed that the species exploited in the 1980s and 1990s, which had the highest biomass of catch, exhibited a lower combination of unusual traits compared to those targeted from the 2000s onwards. This implies that the exploitation of the most functionally specialized species has increased in the Azores archipelago over the past two decades, and this is reflected in the increased FDiv. Notably, this increase in FDiv is likely driven by the species K. pelamis, which has represented the highest landings in recent decades and possesses the most unusual traits compared to other species with a high biomass of catch that were positioned close to the center of the functional space, such as T. picturatus and T. obesus.
The species K. pelamis is the second most landed species in the Azores archipelago (ICES, 2020). This species is considered to be more resilient to fishing pressure compared to other tuna species such as T. obesus, primarily due to its relatively small size at maturity, fast growth rate and high reproductive capacity (Grande et al., 2014; Murua et al., 2017; Artetxe-Arrate et al., 2021). Despite the steady increase in global catches of the K. pelamis since the 1950s, its stock is not overexploited (Arrizabalaga et al., 2012; ISSF, 2023). In Azorean waters, the tuna stocks are managed under the EU Common Fisheries Policy (CFP), the International Commission for the Conservation of Atlantic Tunas (ICCAT), and the regional government (ICES, 2020). The tuna regulations encompass measures such as fish quotas, temporal closures, and minimum landing sizes or weights (e.g., regulation -EU n° 1224/2009, Ordinance n° 108/2021). These measures are crucial for regulating the amount of biomass removed by fisheries. They are particularly important for functionally important species like K. pelamis. Thus, FDiv can be influenced by a combination of local management strategies and environmental factors. Local management strategies, including the aforementioned measures, help shape fishing activities and control the impact on the exploited species and ecosystem. Environmental factors, such as surface water temperature, chlorophyll concentrations and currents, on the other hand, can directly affect the spatiotemporal distribution and abundance of K. pelamis (Dueri et al., 2014; Druon et al., 2017). By monitoring changes in FDiv, researchers and managers can obtain valuable insights into the effects of fishing activities on the functional composition and exploited ecosystems (Trindade-Santos et al., 2020; Zhao et al., 2022b).
4.4 Implications for management, conservation and ecosystem functioning
Our findings emphasize the significance of incorporating functional diversity metrics into fisheries management and conservation. These metrics play an important role in detecting changes in the composition of the catches over time, especially in response to local effort measures to promote sustainable use of the marine resources and conservation of threatened and/or high functionally species i.e., those species that possess a combination of unusual traits. This approach can also be useful for understanding changes in fishing practices resulting from gear changes, shifts in fishing depths, changes in market demands, and other factors. The fisheries practices in Azorean waters serve as an example of this perspective. For instance, a decreasing trend in FRic recorded over the past decade may also reflect the UE and local regulation measures that prohibit the capture of highly functionally important Elasmobranchii species, including Alopias superciliosus, Hexanchus griseus, Centroselachus crepidater, Centrophorus spp., and D. licha. These species have been protected by local regulation Ordinance N° 14/2014 as well as European Union regulations N° 2021/91, 2021/92, and 2019/1241, which also regulate the use of certain fishing practices aimed at reducing the catchability of pelagic sharks. The absence of these species in the landings over the last decades is an indication of successful management efforts to protect their populations and maintain their ecological functions within the ecosystem.
Functional indices that consider both abundance and biomass of catch, such as FEve and FDiv, enhance our understanding of the functional dynamics in exploited ecosystems. By monitoring these indices, early-warning signals can be detected, enabling timely interventions and promoting the long-term conservation and sustainable management of marine resources. For instance, the removal of high-biomass species can considerably impact ecosystem functioning and lead to the exploitation of smaller and less valuable fish at lower trophic levels in response to changes of their relative abundances, so-called fishing down the food web (Pauly et al., 1998; Christensen et al., 2014). Fishing down the food web is commonly interpreted as a symptom of overfishing, unsustainable fishing practices, and unintended ecological consequences resulting from the removal of high-trophic-level species (Pauly et al., 1998; Essington et al., 2006; Hočevar and Kuparinen, 2021; Gough et al., 2022). Consequently, monitoring changes in FDiv over time can provide valuable insights in this context, particularly regarding the specialist or generalist nature of the high-trophic-level species being targeted by fisheries. This information is crucial in determining whether these species perform unique or common functions within the ecosystem, shedding light on the potential ecological consequences of their removal. Although fishing down the food web is prevalent among marine ecosystems worldwide (Essington et al., 2006); in the Azores archipelago, out of the top ten species with the highest biomass removal from the ecosystem by fisheries over the past 42 years, eight have high trophic levels above 4, including K. pelamis, T. obesus, Conger conger, T. alalunga, Phycis phycis, Dalatias licha, Pagellus bogaraveo and Helicolenus dactylopterus (Costa et al., 2023a). Additionally, our approach showed that, with the exception of K. pelamis, these species may perform similar functions within the ecosystem (generalist species). This observation suggests that the most landed species exhibit a degree of functional redundancy, which can contribute to the resilience and adaptability of the ecosystem to fishing pressure. In addition, removing high biomass of specialist species may also affect the ecosystem functioning through trophic cascades (Hočevar and Kuparinen, 2021). Local regulations that promote the sustainable use of these species through measures such as quotas, area and temporal fishing closures can help control the amount of biomass removed from the ecosystem annually (e.g., local regulation ordinance n° 74/2015) (Pham et al., 2013; Santos et al., 2019; Santos et al., 2020b). These regulations are important for maintaining the populations of these species and preventing overexploitation (Pham et al., 2013; Wakefield, 2019).
Ecosystems are intricate and interconnected systems with numerous species, habitats, and ecological processes. The complexity of these interactions makes it challenging to accurately predict and quantify the consequences of fishing activities on ecosystem functioning. However, by incorporating functional diversity metrics (e.g., FRic, FEve and FDiv), we can obtain a more holistic perspective beyond traditional measures such as abundance or species richness (Villéger et al., 2008; Mouillot et al., 2011; Mouillot et al., 2013; Bagousse-Pinguet et al., 2019). Our findings have implications for the responsible management of marine resources and emphasize the significance of implementing Ecosystem-Based Fisheries Management (EBFM). Rather than focusing solely on individual species or stocks, EBFM approach considers the interdependencies and interactions among species, habitats, and ecological processes (Pikitch et al., 2004; Zhou et al., 2010; Fogarty, 2014). The incorporation of functional diversity within the framework of EBFM can enhance our understanding of the ecological consequences of fishing activities. By recognizing the diverse roles of species within ecosystems, EBFM can guide the development of sustainable management that can help maintain the integrity of ecosystems and ensure their continued provision of valuable ecological services. Furthermore, considering the temporal variation in functional diversity provides insight into the functional roles of different species and the overall functional diversity of the system, thereby aiding in the establishment of Marine Protected Areas (MPAs). It is crucial to establish long-term monitoring programs that capture temporal dynamics and integrate this information into MPA planning, evaluation, and adaptive management practices (Leenhardt et al., 2015).
It’s important to mention that the interaction between genetic and environmental influences can lead to adaptive shifts in the traits of exploited fish populations (Pandolfi, 2009; Crespel et al., 2021). This can potentially result in altered evolutionary trajectories and the emergence of characteristics that enhance survival in a stock under exploitation (Kenchington, 2003; Hutchings, 2005; Thériault et al., 2008). This variability may expand the range of trait values within the fish community (Hutchings, 2005; Crespel et al., 2021), which, in turn, affects the estimation of the functional metrics. Furthermore, it may impact the degree of functional redundancy and overlap, thus influencing metrics such as FRic and FEve (Villéger et al., 2008). However, it’s essential to emphasize that this aspect was not investigated in the present study. Nevertheless, considering the intraspecific trait variability of targeted species in future studies is crucial for adaptive fisheries management, conservation, and ecosystem functioning.
5 Conclusions
Understanding the functional roles of exploited species within an ecosystem is crucial for maintaining its balance and resilience. Our study reveals a significant increase in the number of target species over the past 42 years in the Azores archipelago. The newly reported species in the catches over the last two decades have similar functions or are less specialized compared to the already exploited species. The ecosystem is experiencing a decrease in the loss of species within the ecosystem that possess unique and essential functions, contributing to the overall maintenance of its functioning and stability. Fishing regulations are essential in controlling the number and amount of fish biomass (generalist and specialist species) removed by fisheries in the Azorean waters, influencing the functional diversity indices. Our study highlights the importance of considering not only species richness and abundance, but also functional diversity when assessing potential effects of fisheries on ecosystem functioning. Further research and monitoring efforts are needed to assess the consequences of these changes on the overall ecosystem functioning and long-term sustainable use of fishery resources under exploitation. Conservation measures may be necessary to preserve the remaining functionally important species and mitigate potential impacts on the ecosystem’s integrity.
Data availability statement
The original contributions presented in the study are included in the article/Supplementary Material. The primary codes used to analyze the datasets can be found at https://github.com/Eudriano/FD_Fisheries_Azores.git. Further inquiries can be directed to the corresponding author.
Author contributions
EC: investigation, conceptualization, methodology, data curation, performed the analyses, writing the initial draft of the manuscript, review and editing. NC-L: conceptualization, methodology, critical review. DC: conceptualization, critical review. GM: conceptualization, critical review, AC: fundings, conceptualization, critical review. All authors contributed to the article and approved the submitted version.
Funding
This work was performed under the framework of the project FunAzores co-funded by AÇORES 2020, through the FEDER fund from the European Union: ACORES 01-0145-FEDER-000123. Okeanos team received national funds through the FCT – Foundation for Science and Technology, I.P., under the project UIDB/05634/2020 and UIDP/05634/2020 and through the Regional Government of the Azores through the initiative to support the Research Centers of the University of the Azores and through the project M1.1.A/REEQ.CIENTÍFICO UI&D/2021/010. AC is supported by the national funds through the – FCT Foundation for Science and Technology within the scope of CEECIND/00101/2021.
Acknowledgments
We would like to thank João Carlos Santos (OKEANOS-UAc) for the organization of the landing data of the Lotaçor/OKEANOS-UAc) database. We would like also to extend our sincere gratitude to the referees for their valuable contributions and insightful comments improving our article.
Conflict of interest
The authors declare that the research was conducted in the absence of any commercial or financial relationships that could be construed as a potential conflict of interest.
Publisher’s note
All claims expressed in this article are solely those of the authors and do not necessarily represent those of their affiliated organizations, or those of the publisher, the editors and the reviewers. Any product that may be evaluated in this article, or claim that may be made by its manufacturer, is not guaranteed or endorsed by the publisher.
Supplementary material
The Supplementary Material for this article can be found online at: https://www.frontiersin.org/articles/10.3389/fmars.2023.1243918/full#supplementary-material
References
Abecasis R. C., Afonso P., Colaço A., Longnecker N., Clifton J., Schmidt L., et al. (2015). Marine conservation in the Azores: evaluating marine protected area development in a remote island context. Front. Mar. Sci. 2. doi: 10.3389/fmars.2015.00104
Anderson M. J. (2006). Distance-based tests for homogeneity of multivariate dispersions. Biometrics 62, 245–253. doi: 10.1111/j.1541-0420.2005.00440.x
Arrizabalaga H., Murua H., Majkowski J. (2012). Global status of tuna stocks: summary sheets. Rev. Invest. Mar. 18, 646–676.
Artetxe-Arrate I., Fraile I., Marsac F., Farley J. H., Rodriguez-Ezpeleta N., Davies C. R., et al. (2021). A review of the fisheries, life history and stock structure of tropical tuna (skipjack Katsuwonus pelamis, yellowfin Thunnus albacares and bigeye Thunnus obesus) in the Indian Ocean. Adv. Mar. Biol. 88, 39–89. doi: 10.1016/bs.amb.2020.09.002
Bagousse-Pinguet Y., Soliveres S., Gross N., Torices R., Berdugo M., Maestre T. (2019). Phylogenetic, functional, and taxonomic richness have both positive and negative effects on ecosystem multifunctionality. PNAS 116, 8419–8424. doi: 10.1073/pnas.1815727116
Barber C. B., Dobkin D. P., Dobkin D. P., Huhdanpaa H. (1996). The quickhull algorithm for convex hulls. ACM Trans. Math. Software 22, 469–483. doi: 10.1145/235815.235821
Beukhof E., Frelat R., Pecuchet L., Maureaud A., Dencker T. S., Sólmundsson J., et al. (2019). Marine fish traits follow fast-slow continuum across oceans. Sci. Rep. 9, 17878. doi: 10.1038/s41598-019-53998-2
Bradley D., Merrifield M., Miller K. M., Lomonico S., Wilson J. R., Gleason M. G. (2019). Opportunities to improve fisheries management through innovative technology and advanced data systems. Fish Fish. 20, 564–583. doi: 10.1111/faf.12361
Campanyà-Llovet N., Bates A. E., Cuvelier D., Giacomello E., Catarino D., Gooday A. J., et al. (2023). FUN Azores: A trait database for the marine species of the ridges, seamounts, and hydrothermal vents of the Azores, NE Atlantic. Pangea. doi: 10.1594/PANGAEA.955357
Carrington V. G., Papa Y., Beese C. M., Hall J., Covain R., Horn P., et al. (2021). How functionally diverse are fish in the deep? A comparison of fish communities in deep and shallow-water systems. Divers. Distrib. 27, 1208–1223. doi: 10.1111/ddi.13268
Chamberlain S. (2018) rredlist: “IUCN” Red List Client (R package version 0.7.1). Available at: https://cran.r-project.org/web/packages/rredlist/.
Christensen V., Coll M., Piroddi C., Steenbeek J., Buszowski J., Pauly D. (2014). A century of fish biomass decline in the ocean. Mar. Ecol. Prog. Ser. 512, 155–166. doi: 10.3354/meps10946
Conwell W. K., Schwilk D. W., Ackerly D. D. (2006). A trait-based test for habitat filtering: convex hull volume. Ecology 87, 1465–1471. doi: 10.1890/0012-9658(2006)87[1465:ATTFHF]2.0.CO
Costa E. F. S., Campanyà-Llovet N., Cuvelier D., Menezes G. M. M., Colaço A. (2023a). Supplementary data for Long-term trends in functional diversity of exploited marine fish in the Azores' archipelago: past and present. Zenodo . doi: 10.5281/zenodo.8006982
Costa E. F. S., Campanyà-Llovet N., Cuvelier D., Menezes G. M. M., Colaço A. (2023b). Data from: Exploring functional traits of fish species in the Azores archipelago: a database compilation. Pangaea. doi: 10.1594/PANGAEA.961793
Crespel A., Schneider K., Miller T., Rácz A., Jacobs A., Lindström J., et al. (2021). Genomic basis of fishing-associated selection varies with population density. PNAS 118, e2020833118. doi: 10.1073/pnas.2020833118
Diogo H., Pereira J. G., Higgins R. M., Canha A., Reis D. (2015). History, effort distribution and landings in an artisanal bottom longline fishery: An empirical study from the North Atlantic Ocean. Mar. Policy 51, 75–85. doi: 10.1016/j.marpol.2014.07.022
Druon J.-N., Chassot E., Murua H., Lopez J. (2017). Skipjack tuna availability for purse seine fisheries Is driven by suitable feeding habitat dynamics in the Atlantic and Indian Oceans. Front. Mar. Sci. 4. doi: 10.3389/fmars.2017.00315
Dueri S., Bopp L., Maury O. (2014). Projecting the impacts of climate change on skipjack tuna abundance and spatial distribution. Glob. Change Biol. 20, 742–753. doi: 10.1111/gcb.12460
Essington T. E., Beaudreau A. H., Wiedenmann J. (2006). Fishing through marine food webs. PNAS 103, 3171–3175. doi: 10.1073/pnas.0510964103
FAO. (2005). Review of the state of world marine fishery resources. FAO Fisheries Technical Paper . No. 457 (Rome: FAO. 2005), 235.
Farré M., Tuset V. M., Cartes J. E., Massuití E., Lombarte A. (2016). Depth-related trends in morphological and functional diversity of demersal fish assemblages in the western Mediterranean Sea. Prog. Oceanogr. 147, 22–37. doi: 10.1016/j.pocean.2016.07.006
Fauconnet L., Pham C. K., Canha C. K., Afonso P., Diogo H., Machete M., et al. (2019). An overview of fisheries discards in the Azores. Fish. Res 209, 2030–2241. doi: 10.1016/j.fishres.2018.10.001
Fogarty M. J. (2014). The art of ecosystem-based fishery management. Can. J. Fish. Aquat. Sci. 71, 479–490. doi: 10.1139/cjfas-2013-0203
Froese R., Demirel N., Coro G., Kleisner K. M., Winker H. (2017). Estimating fisheries reference points from catch and resilience. Fish Fish. 18, 506–526. doi: 10.1111/faf.12190
Froese R., Pauly D. (2023). FishBase version (02/2023). Available at: www.fishbase.org (Accessed March 01, 2023).
Fu C., Cao Z., Fu S. (2019). Predation experience underlies the relationship between locomotion capability and survival. Comp. Biochem. Physiol. 227, 32–38. doi: 10.1016/j.cbpa.2018.09.005
Gough C., Ateweberhan M., Godley B. J., Harris A., Le Manach F., Zafindranosy E., et al. (2022). Temporal change and fishing down food webs in small-scale fisheries in morondava, Madagascar. Front. Mar. Sci. 9. doi: 10.3389/fmars.2022.884083
Grande M., Murua H., Zudaire I., Goñi N., Bodin N. (2014). Reproductive timing and reproductive capacity of the Skipjack Tuna (Katsuwonus pelamis) in the western Indian Ocean. Fish. Res. 156, 14–22. doi: 10.1016/j.fishres.2014.04.011
Gratwicke B., Speight M. R. (2005). The relationship between fish species richness, abundance and habitat complexity in a range of shallow tropical marine habitats. J. Fish Biol. 66, 650–667. doi: 10.1111/j.0022-1112.2005.00629.x
Higham T. E. (2007). Feeding, fins and braking maneuvers: locomotion during prey capture in centrarchid fishes. J. Exp. Biol. 210, 107–117. doi: 10.1242/jeb.02634
Hilborn R., Amoroso R. O., Anderson C. M., Baum J. K., Branch T. A., Costello C., et al. (2020). Effective fisheries management instrumental in improving fish stock status. PNAS 117, 2218–2224. doi: 10.1073/pnas.1909726116
Hočevar S., Kuparinen A. (2021). Marine food web perspective to fisheries-induced evolution. Evol. Appl. 14, 2378–2391. doi: 10.1111/eva.13259
Honda K., Nakamura Y., Nakaoka M., Uy W. H., Fortes M. D. (2013). Habitat use by fishes in coral reefs, seagrass beds and mangrove habitats in the Philippines. PloS One 8, e65735. doi: 10.1371/journal.pone.0065735
Hutchings J. A. (2005). Life history consequences of overexploitation to population recovery in the Northwest Atlantic cod (Gadus morhua). Can. J. Fish. Aquat. Sci. 62, 824–832. doi: 10.1139/f05-081
ICES. (2020). ICES 2020 Azores ecoregion fisheries overview - data outputs. doi: 10.17895/ices.data.7608
ISSF. (2023). Status of the world fisheries for tuna. Mar. 2023. ISSF Technical Report 2023-01 (Pittsburgh, PA, USA: International Seafood Sustainability Foundation).
Kenchington E. (2003). “The effects of fishing on species and genetic diversity,” in Responsible fisheries in the Marine Ecosystem. Eds. Sinclair M., Valdimarsson G. (Rome: FAO and CABI Publishing), 235–405. doi: 10.1079/9780851996332.02
King J. R., McFarlane G. A. (2003). Marine fish life history strategies: applications to fishery management. Fish. Manage. Ecol. 10, 249–264. doi: 10.1046/j.1365-2400.2003.00359.x
Laliberté E., Legendre P. (2010). A distance-based framework for measuring functional diversity from multiple traits. Ecology 91, 299–305. doi: 10.1890/08-2244.1
Laughlin D. C. (2014). The intrinsic dimensionality of plant traits and its relevance to community assembly. J. Ecol. 102, 186–193. doi: 10.1111/1365-2745.12187
Leenhardt P., Low N., Pascal N., Micheli F., Claudet J. (2015). “The Role of Marine Protected Areas in Providing Ecosystem Services,” in Aquatic Functional Biodiversity. Eds. Belgrano A., Woodward G., Jacob U. (Academic Press), 211–239. doi: 10.1016/B978-0-12-417015-5.00009-8
Legendre P., Gallagher E. D. (2001). Ecologically meaningful transformations for ordination of species data. Oecologia 129, 271–280. doi: 10.1007/s004420100716
Lüdecke D. (2023) sjPlot: Data visualization for statistics in social science [R package version 2.8.13]. Available at: https://CRAN.R-project.org/package=sjPlot.
Magneville C., Loiseau N., Albouy C., Casajus N., Claverie T., Escalas A., et al. (2022). mFD: an R package to compute and illustrate the multiple facets of functional diversity. Ecography 2022, e05904. doi: 10.1111/ecog.05904
Maire E., Grenouillet G., Brosse S., Villéger S. (2015). How many dimensions are needed to accurately assess functional diversity? A pragmatic approach for assessing the quality of functional spaces. Glob. Ecol. Biogeography 24, 728–740. doi: 10.1111/geb.12299
Martins G. M., Arenas F., Neto A. I., Jenkins S. R. (2012). Effects of fishing and regional species pool on the functional diversity of fish communities. PloS One 7, e44297. doi: 10.1371/journal.pone.0044297
Mason N. W. H., Bello F., Mouillot D., Pavoine S., Dray S. (2013). A guide for using functional diversity indices to reveal changes in assemble process along ecological gradients. J. Veg. Sci. 24, 794–806. doi: 10.1111/jvs.12013
Mason N. W. H., Irz P., Lanoiselee C., Mouillot D., Argillier C. (2008). Evidence that niche specialization explains species–energy relationships in lake fish communities. J. Anim. Ecol. 77, 285–296. doi: 10.1111/j.1365-2656.2007.01350.x
Mbaru E. K., Graham N. A. J., McClanahan T. R., Cinner J. E. (2019). Functional traits illuminate the selective impacts of different fishing gears on coral reefs. J. App. Ecol. 57, 241–252. doi: 10.1111/1365-2664.13547
McLean M., Auber A., Graham N. A. J., Houk P., Villéger S., Violle C., et al. (2019). Trait structure and redundancy determine sensitivity to disturbance in marine fish communities. Glob. Change Biol. 25, 3424–3437. doi: 10.1111/gcb.14662
Medeiros-Leal W., Santos R., Peixoto U. I., Casal-Ribeiro M., Novoa-Pabon A., Sigler M. F., et al. (2023). Performance of length-based assessment in predicting small-scale multispecies fishery sustainability. Rev. Fish. Biol. Fish. 33, 819–852. doi: 10.1007/s11160-023-09764-9
Menezes G. (1996). Interacções tecnológicas na pesca demersal dos Açores. Arquivos do DOP Série Estudos 1, 187.
Menezes G. M., Diogo H., Giacomello E. (2013). Reconstruction of demersal fisheries history on the Condor seamount, Azores archipelago (Northeast Atlantic). Deep Sea Res. Part II: Top. Stud. Oceanogr. 98, 190–203. doi: 10.1016/j.dsr2.2013.02.031
Menezes G., Sigler M., Silva H., Pinho M. (2006). Structure and zonation of demersal fish assemblages off the Azores Archipelago (mid-Atlantic). Mar. Ecol. Prog. Ser. 324, 241–260. doi: 10.3354/meps324241
Mézo P. L., Guiet J., Scherrer K., Bianchi D., Galbraith E. (2022). Global nutrient cycling by commercially targeted marine fish. Biogeosciences 19, 2537–2555. doi: 10.5194/bg-19-2537-2022
Morales-Nin B. (2009). “Ecology, behavior and productivity of marine fish,” in Marine ecology: encyclopedia of life support systems. Eds. Duarte C. M., Helgueras A. L. (Oxford: EOLSS), 474.
Morato T. (2012). Description of environmental issues, fish stocks and fisheries in the EEZs around the Azores and Madeira. Available at: https://stecf.jrc.ec.europa.eu/documents/43805/465474/Item+6.2+Report+Morato_Azores_Madeira.pdf.
Morato T., Cheung W. W. L., Pitcher T. J. (2006). Vulnerability of seamount fish to fishing: fuzzy analysis of life-history attributes. J. Fish Biol. 68, 209–221. doi: 10.1111/j.1095-8649.2005.00894
Morato T., Pitcher T. J., Clark M. R., Menezes G., Tempera F., Porteiro F., et al. (2010). Can we protect seamounts for research? A call for conservation. Oceanography 23, 190–199. doi: 10.5670/oceanog.2010.71
Mouillot D., Graham N. A. J., Villéger S., Mason N. W. H., Bellwood D. R. (2013). A functional approach reveals community response to disturbances. Trends Ecol. Evol. 28, 167–177. doi: 10.1016/j.tree.2012.10.004
Mouillot D., Villéger S., Parravicini V., Kulbicki M., Arias-González J. E., Bender M., et al. (2014). Functional over-redundancy and high functional vulnerability in global fish faunas on tropical reefs. PNAS 111, 13757–13762. doi: 10.1073/pnas.1317625111
Mouillot D., Villéger S., Scherer-Lorenzen M., Mason N. W. H. (2011). Functional structure of biological communities predicts ecosystem multifunctionality. PloS One 6, e17476. doi: 10.1371/journal.pone.0017476
Murua H., Rodriguez-Marin E., Neilson J. D., Farley J. H., Juan-Jordá M. J. (2017). Fast versus slow growing tuna species: age, growth, and implications for population dynamics and fisheries management. Rev. Fish. Biol. Fisheries 27, 733–773. doi: 10.1007/s11160-017-9474-1
Myers E. M. V., Anderson M. J., Eme D., Ligins L., Roberrts C. D. (2020). Changes in key traits versus depth and latitude suggest energy-efficient locomotion, opportunistic feeding and light lead to adaptive morphologies of marine fishes. J. Anim. Ecol. 89, 309–322. doi: 10.1111/1365-2656.13131
Myers R. A., Worm B. (2003). Rapid worldwide depletion of predatory fish communities. Nature 423, 280–283. doi: 10.1038/nature01610
Nash K. L., Watson R. A., Halpern B. S., Fulton E. A., Blanchard J. L. (2017). Improving understanding of the functional diversity of fisheries by exploring the influence of global catch reconstruction. Sci. Rep. 7, 10746. doi: 10.1038/s41598-017-10723-1
Neves J., Giacomello E., Menezes G. M., Fontes J., Tanner S. E. (2021). Temperature-driven growth variation in a deep-sea fish: the case of Pagellus bogaraveo (Brünnich 1768) in the azores archipelago. Front. Mar. Sci. 8. doi: 10.3389/fmars.2021.703820
Oksanen J., Simpson G. L., Blanchet F. G., Kindt R., Legendre P., Minchin P. R., et al. (2022). vegan: Community Ecology Package (R package version 2.6-2). Available at: https://CRAN.R-project.org/package=vegan.
Olden J. D., Hogan Z. S., Zanden M. J. V. (2007). Small fish, big fish, red fish, blue fish: size-biased extinction risk of the world’s freshwater and marine fishes. Global Ecol. Biogeogr. 16, 694–701. doi: 10.1111/j.1466-8238.2007.00337.x
Pandolfi J. M. (2009). Evolutionary impacts of fishing: overfishing’s ‘Darwinian debt’. Biol. Rep. 1, 43. doi: 10.3410/B1-43
Parra H., Pham C. K., Machete M., Santos M., Bjorndal A., Vandeperre F. (2023). The Portuguese industrial pelagic longline fishery in the Northeast Atlantic: catch composition, spatio-temporal dynamics of fishing effort, and target species catch rates. Fish. Res 264, 106730. doi: 10.1016/j.fishres.2023.106730
Pauly D., Christensen V., Dalsgaard J., Froese R., Torres J. F. (1998). Fishing down marine food webs. Science 279, 860–863. doi: 10.1126/science.279.5352.860
Pease A. A., González-Díaz A. A., Rodiles-Hernández R., Winemiller K. O. (2012). Functional diversity and trait–environment relationships of stream fish assemblages in a large tropical catchment. Freshw. Biol. 57, 1060–1075. doi: 10.1111/j.1365-2427.2012.02768.x
Pham C. K., Canha A., Diogo H., Pereira J. G., Prieto R., Morato T. (2013). Total marine fishery catch for the Azores, (1950-2010). ICES J. Mar. Sci. 70, 564–577. doi: 10.1093/icesjms/fst024
Pham C. K., Diogo P. H., Menezes G., Porteiro F., Braga-Henriques A., Vandeperre F., et al. (2014). Deep-water longline fishing has reduced impact on Vulnerable Marine Ecosystems. Sci. Rep. 4, 4837. doi: 10.1038/srep04837
Pikitch E. K., Santora C., Babcock E. A., Bakun A., Bonfil R., Conover D. O., et al. (2004). Ecosystem-based fishery management. Science 305, 346–347. doi: 10.1126/science.109822
Rader R., Bartolomeus I., Tylianakis J. M., Laliberté E. (2014). The winners and losers of land use intensification: pollinator community disassembly is non-random and alters functional diversity. Divers. Distrib. 20, 908:917. doi: 10.1111/ddi.12221
Rincón-Díaz M. P., Bovcon N. D., Cochia P. D., Góngora M. E., Galván D. E. (2021). Fish functional diversity as an indicator of resilience to industrial fishing in Patagonia Argentina. J. Fish. Biol. 99, 1650–1667. doi: 10.1111/jfb.14873
Rose N. L., Yang H., Turner S. D., Simpson G. L. (2012). An assessment of the mechanisms for the transfer of lead and mercury from atmospherically contaminated organic soils to lake sediments with particular reference to Scotland, UK. GCA 82, 113–135. doi: 10.1016/j.gca.2010.12.026
Santos R., Medeiros-Leal W., Pinho M. (2020a). Stock assessment prioritization in the Azores: procedures, current challenges and recommendations. Arquipelago 37, 45–64.
Santos R., Novoa-Pabon A., Silva H., Pinho M. (2020b). Elasmobranch species richness, fisheries, abundance and size composition in the Azores archipelago (NE Atlantic). Mar. Biol. Res. 16, 103–106. doi: 10.1080/17451000.2020.1718713
Santos S. S., Porteiro F. M., Barreiros J. P. (1997). Marine fishes of the Azores: an annotated checklist and bibliography. Arquipelago 1, 1–242.
Santos R. V. S., Silva W. M. M. L., Novoa-Pabon A. M., Silva H. M., Pinho M. R. (2019). Long-term changes in the diversity, abundance and size composition of deep sea demersal teleosts from the Azores assessed through surveys and commercial landings. Aquat. Living Resourc. 25, 25. doi: 10.1051/alr/2019022
Saunders B. J., Galaiduk R., Inostroza K., Myers E. M. V., Goetze J. S., Westera M. (2021). Quantifying patterns in fish assemblages and habitat use along a deep submarine canyon-valley feature using a remotely operated vehicle. Front. Mar. Sci. 8. doi: 10.3389/fmars.2021.608665
Scoulding B., Gastauer S., Taylor J. C., Boswell K. M., Fairclough D. V., Jackson G., et al. (2023). Estimating abundance of fish associated with structured habitats by combining acoustics and optics. J. App. Ecol. 60, 1274–1285. doi: 10.1111/1365-2664.14412
Sedberry G. R., Andrade C. A. P., Carlin J. L., Chapman R. W., Luckhurst B. E., Manooch C. S., et al. (1999). Wreckfish Polyprion americanus in the North Atlantic: fisheries, biology, and management of a widely distributed and long lived fish. Am. Fish. Soc. Symp. 23, 27–50.
Sgarlatta M. P., Ramírez-Valdez A., Ladah L. B., Calderón-Aguilera L. E. (2023). Fish functional diversity is modulated by small−scale habitat complexity in a temperate ecosystem. Hydrobiologia 850, 747–759. doi: 10.1007/s10750-022-05061-x
Stergiou K. I., Karpouzi V. S. (2002). Feeding habits and trophic levels of Mediterranean fish. Rev. Fish Biol. Fish. 11, 217–254. doi: 10.1023/A:1020556722822
Su G., Tadesco P. A., Toussaint A., Villéger S., Brosse S. (2022). Contemporary environment and historical legacy explain funcional diversity of freshwater fishes in the world rivers. Glob. Ecol. Biogeogr. 31, 700–713. doi: 10.1111/geb.13455
Thériault V., Dunlop E. S., Dieckmann U., Bernatchez L., Dodson J. J. (2008). The impact of fishing-induced mortality on the evolution of alternative life-history tactics in brook charr. Evol. Appl. 1, 409–423. doi: 10.1111/j.1752-4571.2008.00022.x
Törnroos A., Bonsdorff E. (2012). Developing the multitrait concept for functional diversity: lessons from a system rich in functions but poor in species. Ecol. Appl. 22, 2221–2236. doi: 10.1890/11-2042.1
Torres P., Figueiras D. M., Diogo H., Afonso P. (2022). Risk assessment of coastal fisheries in the Azores (north-eastern Atlantic). Fish. Res. 246, 106156. doi: 10.1016/j.fishres.2021.106156
Trindade-Santos I., Moyes F., Magurran A. E. (2020). Global change in the functional diversity of marine fisheries exploitation over the past 65 years. Proc. R. Soc. B 287, 20200889. doi: 10.1098/rspb.2020.0889
Villéger S., Brosse S., Mouchet M., Mouillot D., Vanni M. J. (2017). Functional ecology of fish: current approaches and future challenges. Aquat. Sci. 79, 783–801. doi: 10.1007/s00027-017-0546-z
Villéger S., Mason N. W. H., Mouillot D. (2008). New multidimensional functional diversity indices for a multifaceted framework in functional ecology. Ecology 89, 2290–2301. doi: 10.1890/07-1206.1
Villéger S., Novack-Gottshall P. M., Mouillot D. (2011). The multidimensionality of the niche reveals functional diversity changes in benthic marine biotas across geological time. Ecol. Lett. 14, 561–568. doi: 10.1111/j.1461-0248.2011.01618.x
Wakefield J. (2019). “European protection of fisheries in the North East Atlantic,” in World seas: An Environmental Evaluation. Ed. Sheppard C. (Academic Press), 173–182. doi: 10.1016/B978-0-12-805052-1.00009-7
Ward A. J., Webster M. M., Hart P. J. (2006). Intraspecific food competition in fishes. Fish Fish. 7, 231–261. doi: 10.1111/j.1467-2979.2006.00224.x
Williams G. (2011). Data mining with rattle and R: the art of excavating data for knowledge discovery (New York: Springer-Verlag).
Winemiller K. O. (2005). Life history strategies, population regulation, and implications for fisheries management. Can. J. Fish. Aquat. Sci. 62, 872–885. doi: 10.1139/f05-040
Wood S. N. (2017). Generalized Additive models: an introduction with R. 2 nd edition (New York: Chapman and Hall/ CRC).
Wood S. N. (2019). mgcv: Mixed GAM computation vehicle with automatic smoothness estimation. Avaialble at: https://CRAN.R-project.org/package=mgcv.
Zhao K., Gaines S. D., Molinos J. G., Zhang M., Xu J. (2022a). Climate change and fishing are pulling the functional diversity of the world's largest marine fisheries to opposite extremes. Global Ecol. Biogeogr. 31, 1616–1629. doi: 10.1111/geb.13534
Zhao K., He Y., Su G., Xu C., Xu X., Zhang M., et al. (2022b). Implications for functional diversity conservation of China’s marine fisheries. Front. Mar. Sci. 9. doi: 10.3389/fmars.2022.970218
Keywords: trait-based approach, fisheries, functional richness, functional evenness, functional divergence, temporal changes, sustainable development, Atlantic Ocean
Citation: Costa EFS, Campanyà-Llovet N, Cuvelier D, Menezes GM and Colaço A (2023) Long-term trends in functional diversity of exploited marine fish in the Azores’ archipelago: past and present. Front. Mar. Sci. 10:1243918. doi: 10.3389/fmars.2023.1243918
Received: 21 June 2023; Accepted: 20 October 2023;
Published: 03 November 2023.
Edited by:
Carlo Pipitone, CNR - IAS Institute of Anthropic Impacts and Sustainability in Marine Environment, ItalyReviewed by:
Faye Helen Moyes, University of St Andrews, United KingdomCui Liang, Chinese Academy of Sciences (CAS), China
Melanie Culver, University of Arizona, United States
Copyright © 2023 Costa, Campanyà-Llovet, Cuvelier, Menezes and Colaço. This is an open-access article distributed under the terms of the Creative Commons Attribution License (CC BY). The use, distribution or reproduction in other forums is permitted, provided the original author(s) and the copyright owner(s) are credited and that the original publication in this journal is cited, in accordance with accepted academic practice. No use, distribution or reproduction is permitted which does not comply with these terms.
*Correspondence: Eudriano F. S. Costa, eudrianocosta@gmail.com