Organic carbon stocks of Great British saltmarshes
 Craig Smeaton1*
  Cai J. T. Ladd2,3
  Lucy C. Miller1
  Lucy McMahon4,5
  Ed Garrett4
  Natasha L. M. Barlow6
  W. Roland Gehrels4
  Martin W. Skov3
  William E. N. Austin1,7
- 1School of Geography and Sustainable Development, University of St. Andrews, St. Andrews, United Kingdom
- 2Department of Geography, Swansea University, Swansea, United Kingdom
- 3School of Ocean Sciences, Bangor University, Bangor, United Kingdom
- 4Department of Environment and Geography, Wentworth Way, University of York, York, United Kingdom
- 5Department of Natural Sciences, Manchester Metropolitan University, Manchester, United Kingdom
- 6School of Earth and Environment, University of Leeds, Leeds, United Kingdom
- 7Scottish Association of Marine Science, Oban, United Kingdom
Coastal wetlands, such as saltmarshes, are globally widespread and highly effective at capturing and storing ‘blue carbon’ and have the potential to regulate climate over varying timescales. Yet only Australia and the United States of America have national inventories of organic carbon held within saltmarsh habitats, hindering the development of policies and management strategies to protect and preserve these organic carbon stores. Here we couple a new observational dataset with 4,797 samples from 26 saltmarshes across Great Britain to spatially model organic carbon stored in the soil and the above and belowground biomass of Great British saltmarshes. Using average values derived from the 26 marshes, we deliver first-order estimates of organic carbon stocks across Great Britain’s 448 saltmarshes (451.66 km2). The saltmarshes of Great Britain contain 5.20 ± 0.65 Mt of organic carbon, 93% of which is in the soil. On average, the saltmarshes store 11.55 ± 1.56 kg C m-2 with values ranging between 2.24 kg C m-2 and 40.51 kg C m-2 depending on interlinked factors such as geomorphology, organic carbon source, sediment type (mud vs sand), sediment supply, and relative sea level history. These findings affirm that saltmarshes represent the largest intertidal blue carbon store in Great Britain, yet remain an unaccounted for component of the United Kingdom’s natural carbon stores.
1 Introduction
Blue carbon habitats, such as saltmarshes, play globally important roles in the burial and storage of organic carbon (OC) at the land-ocean interface, and may play a key part in climate regulation (Duarte et al., 2005; Nellemann and Corcoran, 2009; McLeod et al., 2011). Globally, between 0.4 – 6.5 Gt of OC is stored (McLeod et al., 2011; Duarte et al., 2013; Temmink et al., 2022) and annually a further 10.2 – 44.6 Mt of OC is buried in saltmarsh ecosystems (Chmura et al., 2003; Ouyang and Lee, 2014). Despite their importance, saltmarsh habitats are under stress from natural and anthropogenic pressure (Pendleton et al., 2012). Approximately 50% of global marsh habitat has already been lost or degraded (Barbier, 2013) at an average rate of 0.28% yr-1 over the last two decades (Campbell et al., 2022). Declines in marsh areas have two potentially significant carbon (C) impacts: (i) the release of OC previously stored in the saltmarsh back into the active C cycle where it can be remineralized and emitted to the atmosphere as carbon dioxide (CO2); (ii) a reduction in the saltmarshes’ ability to remove OC from the atmosphere through the burial of OC in their soils. Foundational knowledge of OC storage and sequestration rates is needed to inform decision–making and help develop strategies and policy to both protect and manage OC within these intertidal environments. Currently, the order of magnitude difference in global saltmarsh organic carbon stock estimates are the product of paucity in empirical observations, gaps in global saltmarsh areal extent (McOwen et al., 2017; Worthington et al., 2023), and a lack of national OC stock assessments which are now common in terrestrial environments (e.g., Guo and Gifford, 2002; Pan et al., 2011). To date, only the United States of America and Australia have quantified saltmarsh OC stocks at the national scale (Macreadie et al., 2017; Holmquist et al., 2018).
In Great Britain, OC stock assessments have either focused on single saltmarshes (Burden et al., 2019; Porter et al., 2020; Ladd et al., 2022) or on quantifying the OC stored in the surficial (top 10 cm) soils of the devolved nations of England, Wales, and Scotland (Ford et al., 2019; ABPmer, 2020; Austin et al., 2021). The latest national study (Smeaton et al., 2022) estimates that the surficial (top 10 cm) soils of GB saltmarshes hold 2.32 ± 0.47 Mt OC. Where full national saltmarsh soil OC stock estimates have been undertaken, they have been impacted by a scarcity of data with estimates only based on extrapolation from a few sites (Beaumont et al., 2014). Recently, the first national saltmarsh OC stock study for Scotland, which took into consideration the full depth of the saltmarsh soil, estimated that Scotland’s saltmarshes hold 1.15 ± 0.21 Mt OC (Miller et al., 2023) which is three times more than if only the surficial (top 10 cm) soils are considered (Smeaton et al., 2022).
Here we bring together multi-component observational datasets from 26 saltmarshes with spatial modelling to quantify the OC held within the biomass (above and belowground) and soils of GB saltmarshes. Quantifying OC stores will contribute to an understanding of the climate regulation potential of GB saltmarshes. These observations will facilitate comparisons with other global systems and enable the development of GB-specific policy and management approaches to prioritize saltmarsh conservation, restoration, and management for OC storage.
2 Study area
Saltmarshes are found along the sheltered coastlines of all three nations of GB (England, Scotland and Wales) (Figure 1), occupying 451.65 km2 (Haynes, 2016; Natural Resources Wales, 2016; Environment Agency, 2023). The majority (∼74%) of GB saltmarshes are in England, where sites > 20 km2 are common in open coastal systems such as The Wash and Morecambe Bay (May and Hansom, 2003). Saltmarshes of Scotland and Wales each account for ∼13% of the total GB saltmarsh habitat (Table 1) and are small in size, averaging 0.25 and 1.39 km2 respectively (Miller et al., 2023). Their smaller size is associated with differences in coastal geomorphology (Pye and French, 1993); 240 loch-head and perched marshes are found only in Scotland (Pye and French, 1993; Haynes, 2016), whilst the saltmarshes of Wales are generally situated in small estuaries resulting in 49 marshes of modest size.
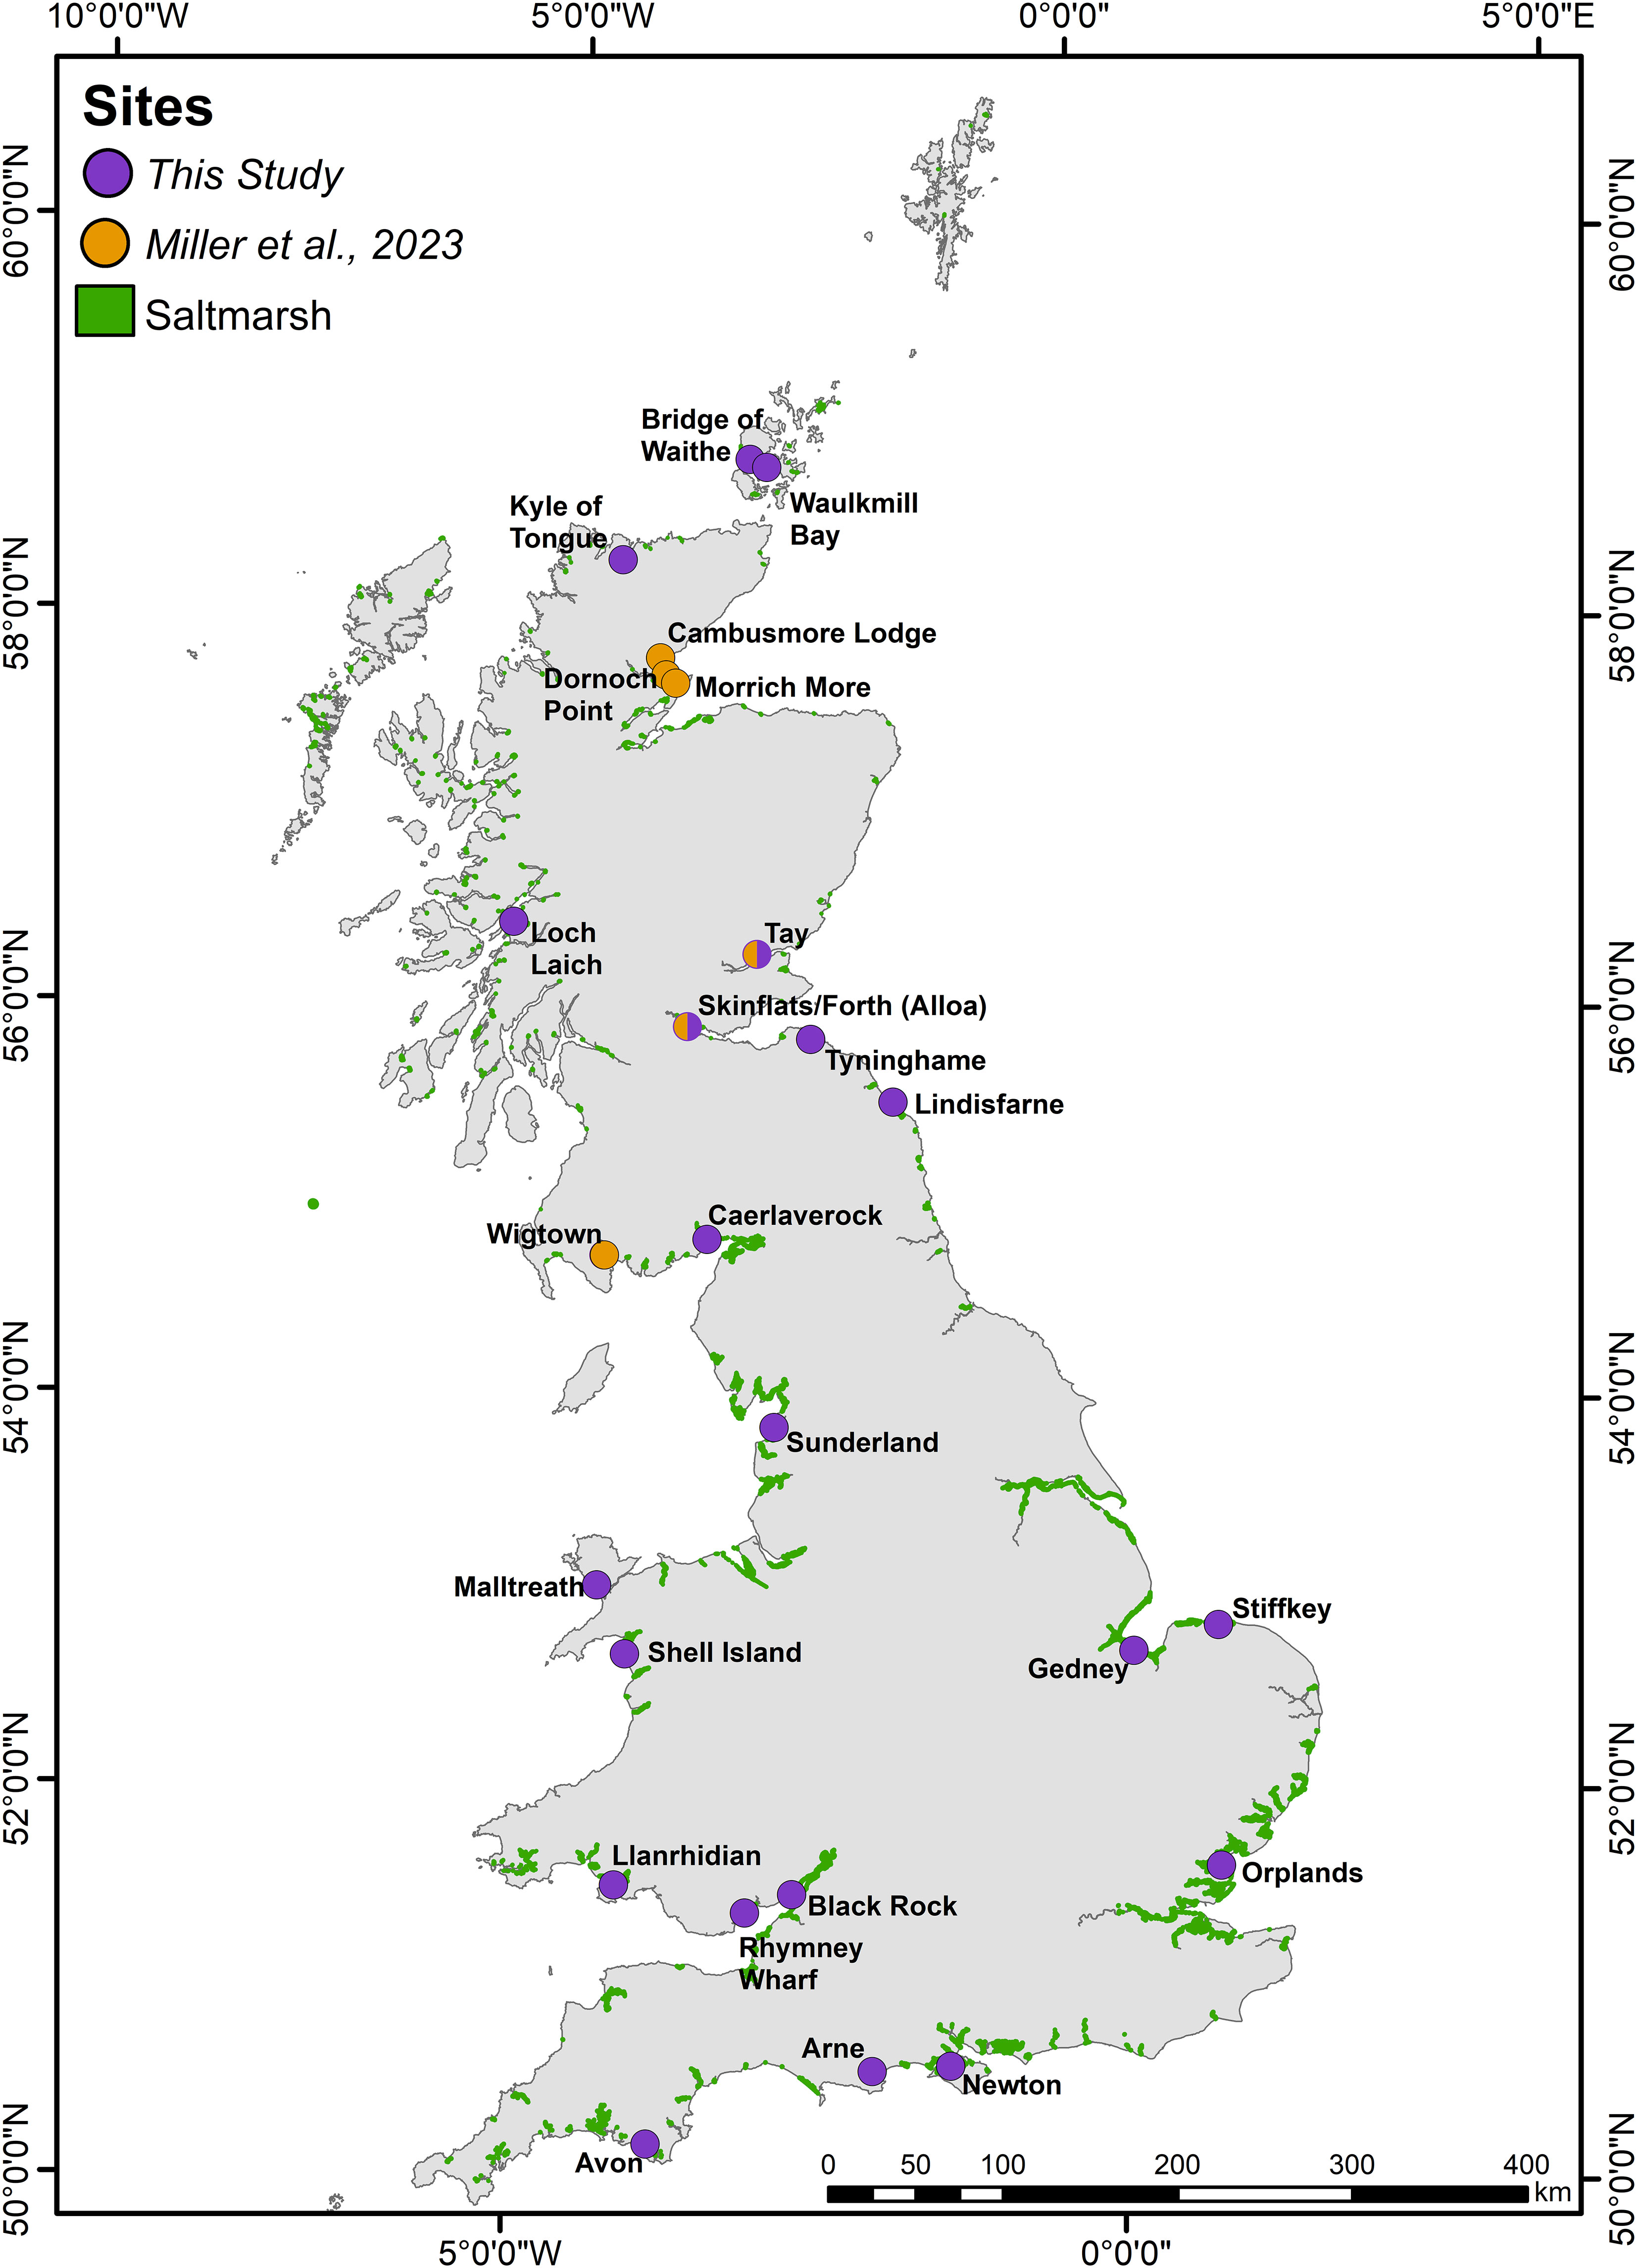
Figure 1 Sampling locations alongside the mapped extent of saltmarsh habitat across Great Britain (saltmarsh extent exaggerated by 1.5 times for visibility at this scale).
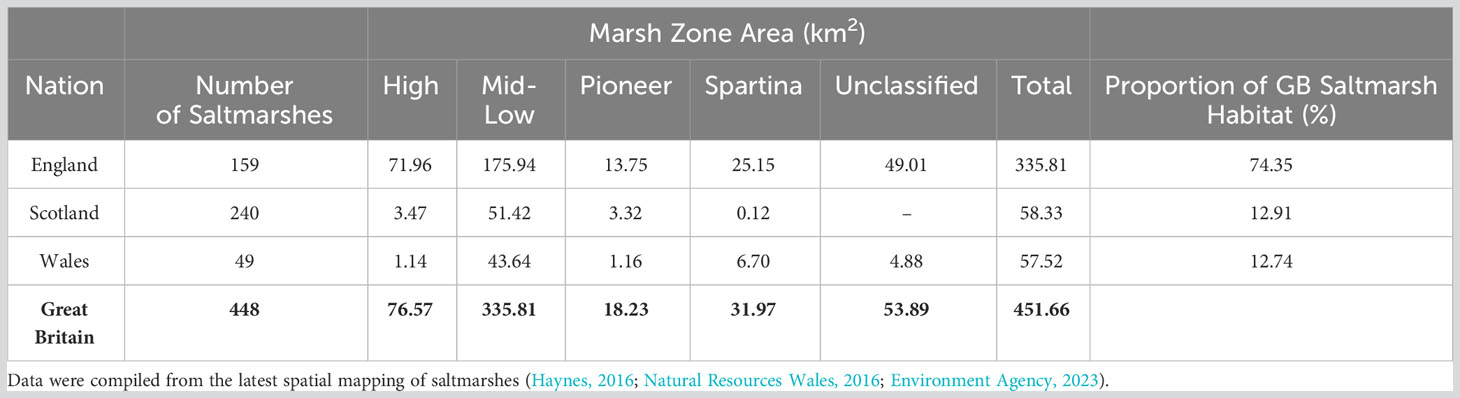
Table 1 Areal extent of the saltmarshes within the constituent nations of Great Britain (GB), divided into saltmarsh zone following the modified EUNIS classification system (Section 3.7.1).
This study focuses on a subset of 26 saltmarshes (Figure 1) with characteristics ranging from small loch-head marshes in the north and west of Scotland (Kyle of Tongue, Loch Laich) to large open coastal systems of England (Stiffkey, Gedney, Sunderland) (Figure 1). The different geomorphological, bio-physical, hydrological and climatic properties of these 26 saltmarshes broadly represent the spectrum of GB saltmarsh habitats (Adam, 1978; Burd, 1989; Haynes, 2016; Smeaton et al., 2022). Collectively, the 26 saltmarshes occupy an area of 78.78 km2 equivalent to 17.44% of the total mapped GB saltmarsh area.
3 Methods
3.1 Sampling
Soil cores were retrieved from 21 saltmarshes (supplemented with data from five other Scottish saltmarshes (Miller et al., 2023)) (Figure 1) between 2018 and 2020. A triple transect sampling strategy (Ladd et al., 2022) was employed where two transects ran perpendicular to the shore, intersecting the different marsh zones (high, mid-low and, where present, pioneer zones), with the third transect running diagonally to the shore intersecting the other transects (Figure 2). At each site, the positioning of the transects were adapted to site specific conditions (e.g., geomorphology, hydrology, vegetation communities). Sampling locations were spaced evenly and in proportion to marsh width, with the coordinates of each coring site recorded by differential global positioning system (dGPS) to an average accuracy of ∼2 cm both in the vertical and horizontal plane. A total of 474 soil cores were collected using a narrow (3 cm diameter) gouge corer which was pushed by hand to either a depth of 1 m, or until a resistant basal layer was reached. Gouge corers assure minimal compaction (Smeaton et al., 2020). The soil profile of each core was described using the Troels-Smith classification scheme (Troels-Smith, 1955) with the depth of transitions recorded. Cores were sub-sampled in the field at depths of 0–2 cm, 4–6 cm, 10–12 cm, 20–22 cm, 30–32 cm and every further 10 cm until 90–92 cm, generating 3,413 sub samples for soil analysis.
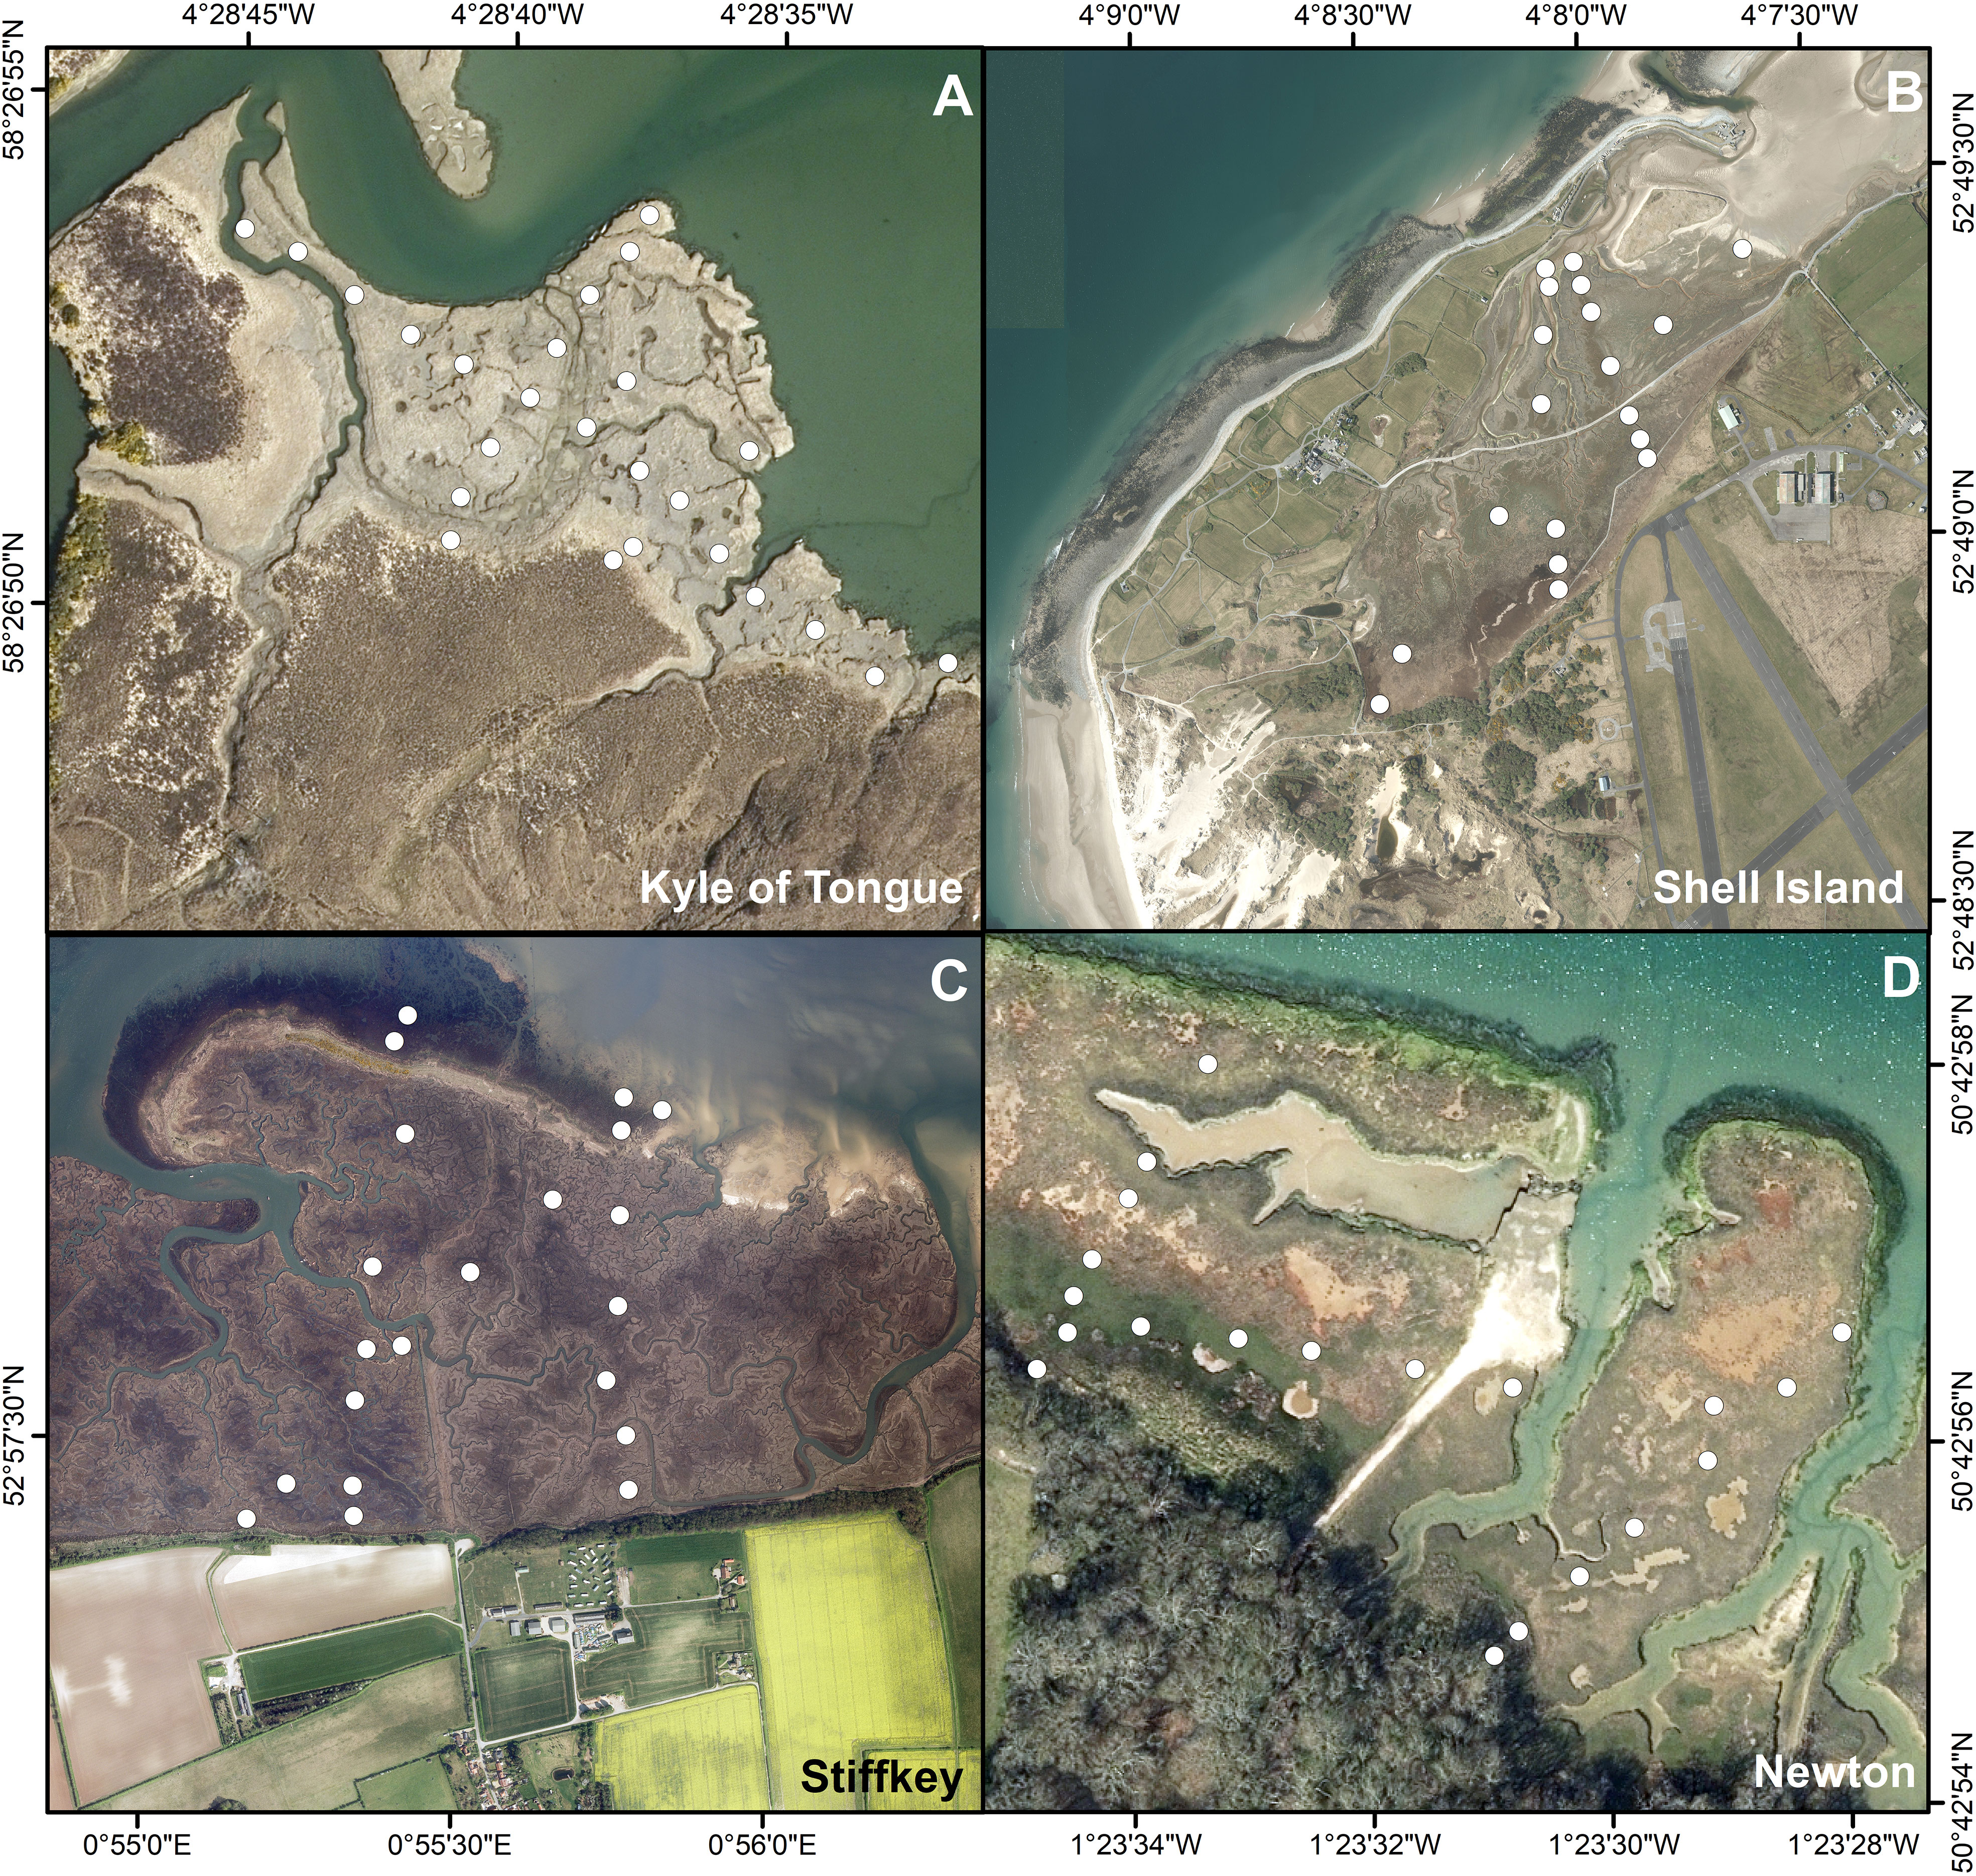
Figure 2 Examples of the sampling design used to collect 474 soil cores (white circles). Sites: (A) Kyle of Tongue, (B) Shell Island, (C) Stiffkey, and (D) Newton. Locations of all the soil cores included in this study can be found in Supplementary Figures 1–25.
Aboveground biomass samples were collected from each marsh, to assess its contribution to the saltmarsh OC stock. The aboveground vegetation was surveyed within 1 m2 quadrats at 143 sites across the saltmarshes. Vegetation composition was described following the National Vegetation Classification (NVC) scheme (Rodwell, 2000; Supplementary Table 1). Within each quadrat, living vegetation was cut at soil level from an area of 0.125 m2 (Harvey et al., 2019) and returned to the laboratory to calculate biomass.
3.2 Saltmarsh biomass
The harvested aboveground biomass (n = 143) samples were oven dried at 60°C for 72 hrs. After drying, the material was weighed and the aboveground biomass calculated for each harvested quadrat (Ford et al., 2019; Harvey et al., 2019; Miller et al., 2023).
3.3 Soil physical properties
The 3,413 soil samples were oven dried at 60°C for 72 hrs. Before and after drying, the samples were weighed for the calculation of wet bulk density, dry bulk density and water content following standard methods (Athy, 1930; Appleby and Oldfield, 1978; Dadey et al., 1992).
3.4 Geochemical analysis
The dried soil and biomass samples were milled to a fine powder in preparation for bulk elemental analysis. Then, 50 mg of homogenized sample was weighed into a steel crucible and placed into an Elementar Soli TOC. The Soli TOC utilizes the temperature gradient method (DIN 19539, 2015; Natali et al., 2020; Smeaton et al., 2021) of elemental analysis to quantify OC and inorganic carbon (IC) from a single untreated sample, unlike other methods where acidification steps are required (Verardo et al., 1990; Nieuwenhuize et al., 1994; Harris et al., 2001). This is accomplished through ramped heating of the sample at a rate of 70°C min−1 through sequential furnace temperatures of 600°C and 900°C. The CO2 evolved at the different temperature ranges represents the fraction of OC (0–600°C) and IC (600–900°C) within the sample. The evolved CO2 produced within each temperature window is measured by infrared spectrometry and converted to C (%).
The standard deviation of triplicate measurements (n = 200) was OC: 0.10% and IC: 0.21%. Further quality control was assured by the repeat analysis of standard reference material B2290 (silty soil standard from Elemental Microanalysis, United Kingdom); these analyses of standards deviated from the reference value by: OC = 0.09% and IC = 0.14% (n = 420).
3.5 Secondary data
The primary data collected within this study were combined with secondary data to support the saltmarsh OC stock estimations. Miller et al. (2023) includes data from aboveground biomass samples (n = 27), soil cores (n = 132) and belowground biomass (roots, stolons, and rhizomes) samples (n = 33) collected from six sites in Scotland (Figure 1) following the same sampling and analytical approaches used in this study. The belowground biomass samples were collected and analyzed following the standard methodology (Harvey et al., 2019; Penk et al., 2020). Biomass samples were loosened by hand, prior to gently shaking for 3 hrs in a 5% solution of sodium hexametaphosphate. The remaining soil was washed from the roots through a 500 µm sieve, which retained any loose root fragments. The fragments were combined with the main portion of belowground biomass, oven dried (60°C, 72 hrs), and weighed so the belowground biomass could be calculated. The dried material was milled to a fine powder and underwent bulk elemental analysis to quantify the belowground C.
Additional aboveground biomass data was acquired from 234 sites within England (Ford et al., 2012; Ford et al., 2016). Of these, 31 sites were rejected for not having the required meta-data (i.e., vegetation classification). Belowground biomass data was obtained from a further 307 sites across England and Wales (Ford et al., 2015; Ford et al., 2019) to supplement the 33 samples from Scotland (Miller et al., 2022b), resulting in a total of 4,797 samples.
3.6 Statistical analysis
To test if the differences in OC content, dry bulk density and soil thickness across the marsh zones and different soil units across GB saltmarshes, ANOVA and Tukey-Kramer (TK) statistical tests (Driscoll, 1996) were utilized.
3.7 Saltmarsh OC stock estimation
3.7.1 Saltmarsh areal extent
The areal extent, vegetation communities, and zonation of GB saltmarsh habitat have been mapped in different ways by the nations of GB. Scottish and Welsh systems are mapped down to the scale of the vegetation community (Haynes, 2016; Natural Resources Wales, 2016) following the NVC scheme (Rodwell, 2000; Supplementary Table 1). In contrast, English marshes are only classified to marsh zone (Spartina, Pioneer, Mid-Low, High) following a modified version of the European nature information system (EUNIS). For the purposes of this study, the Scottish and Welsh NVC mapping was converted to the modified EUNIS classification following the approach outlined in Smeaton et al. (2022) to create a unified GB dataset.
3.7.2 Above and belowground biomass OC stock
Above and belowground sample data were grouped by saltmarsh zone defined by the samples associated vegetation community (Supplementary Table 1. For each saltmarsh zone, the mean (and standard deviation) OC storage value (kg C m−2) was calculated for the above and belowground biomass by multiplying the biomass (kg m-2) with that sample’s associated OC content (%). The above and belowground OC stocks were estimated by multiplying the areal extent (m2) of the marsh zone with that zone’s OC storage value. As much of the saltmarsh mapping took place over a decade ago (Haynes, 2016; Natural Resources Wales, 2016), an error of ± 5% was applied to the area data to account for expansion and/or contraction (Smeaton et al., 2022; Ladd et al., 2019; Ladd, 2021).
A Markov Chain Monte Carlo (MCMC) framework was utilized to undertake the stock calculations and provide a robust assessment of uncertainties. MCMC analysis was applied within the OpenBUGS software package (Lunn et al., 2009) by taking 1,000,000 out of 10,000,000 random samples from a normal distribution of each variable (area, aboveground and belowground biomass OC storage) to calculate the above and belowground OC stock for each saltmarsh. The application of standard descriptive statistical techniques to the pool of generated solutions allows the mean, median standard deviation, 5th and 95th percentiles to be calculated.
3.7.3 Soil OC stock
3.7.3.1 Soil profiles
The Troels-Smith soil descriptions (Troels-Smith, 1955) were used to create soil profiles for the 606 cores (Miller et al., 2022a; Smeaton et al., 2023). The soil profiles highlight that, unlike the saltmarshes of North America and Australia (e.g., Kelleway et al., 2016; Gorham et al., 2021; Vaughn et al., 2021), soils associated with GB marshes rarely extend to a depth of 1 m. The GB systems are characterized by saltmarsh soils overlying sediments deposited in an intertidal flat environment that preceded the development of the saltmarsh (Figure 3). Soil profiles similar to these have been described in other blue carbon (Mueller et al., 2019; Smeaton et al., 2020; Miller et al., 2023) and sea level studies (Teasdale et al., 2011; Barlow et al., 2014; Long et al., 2014; Long et al., 2016) across the United Kingdom and Europe.
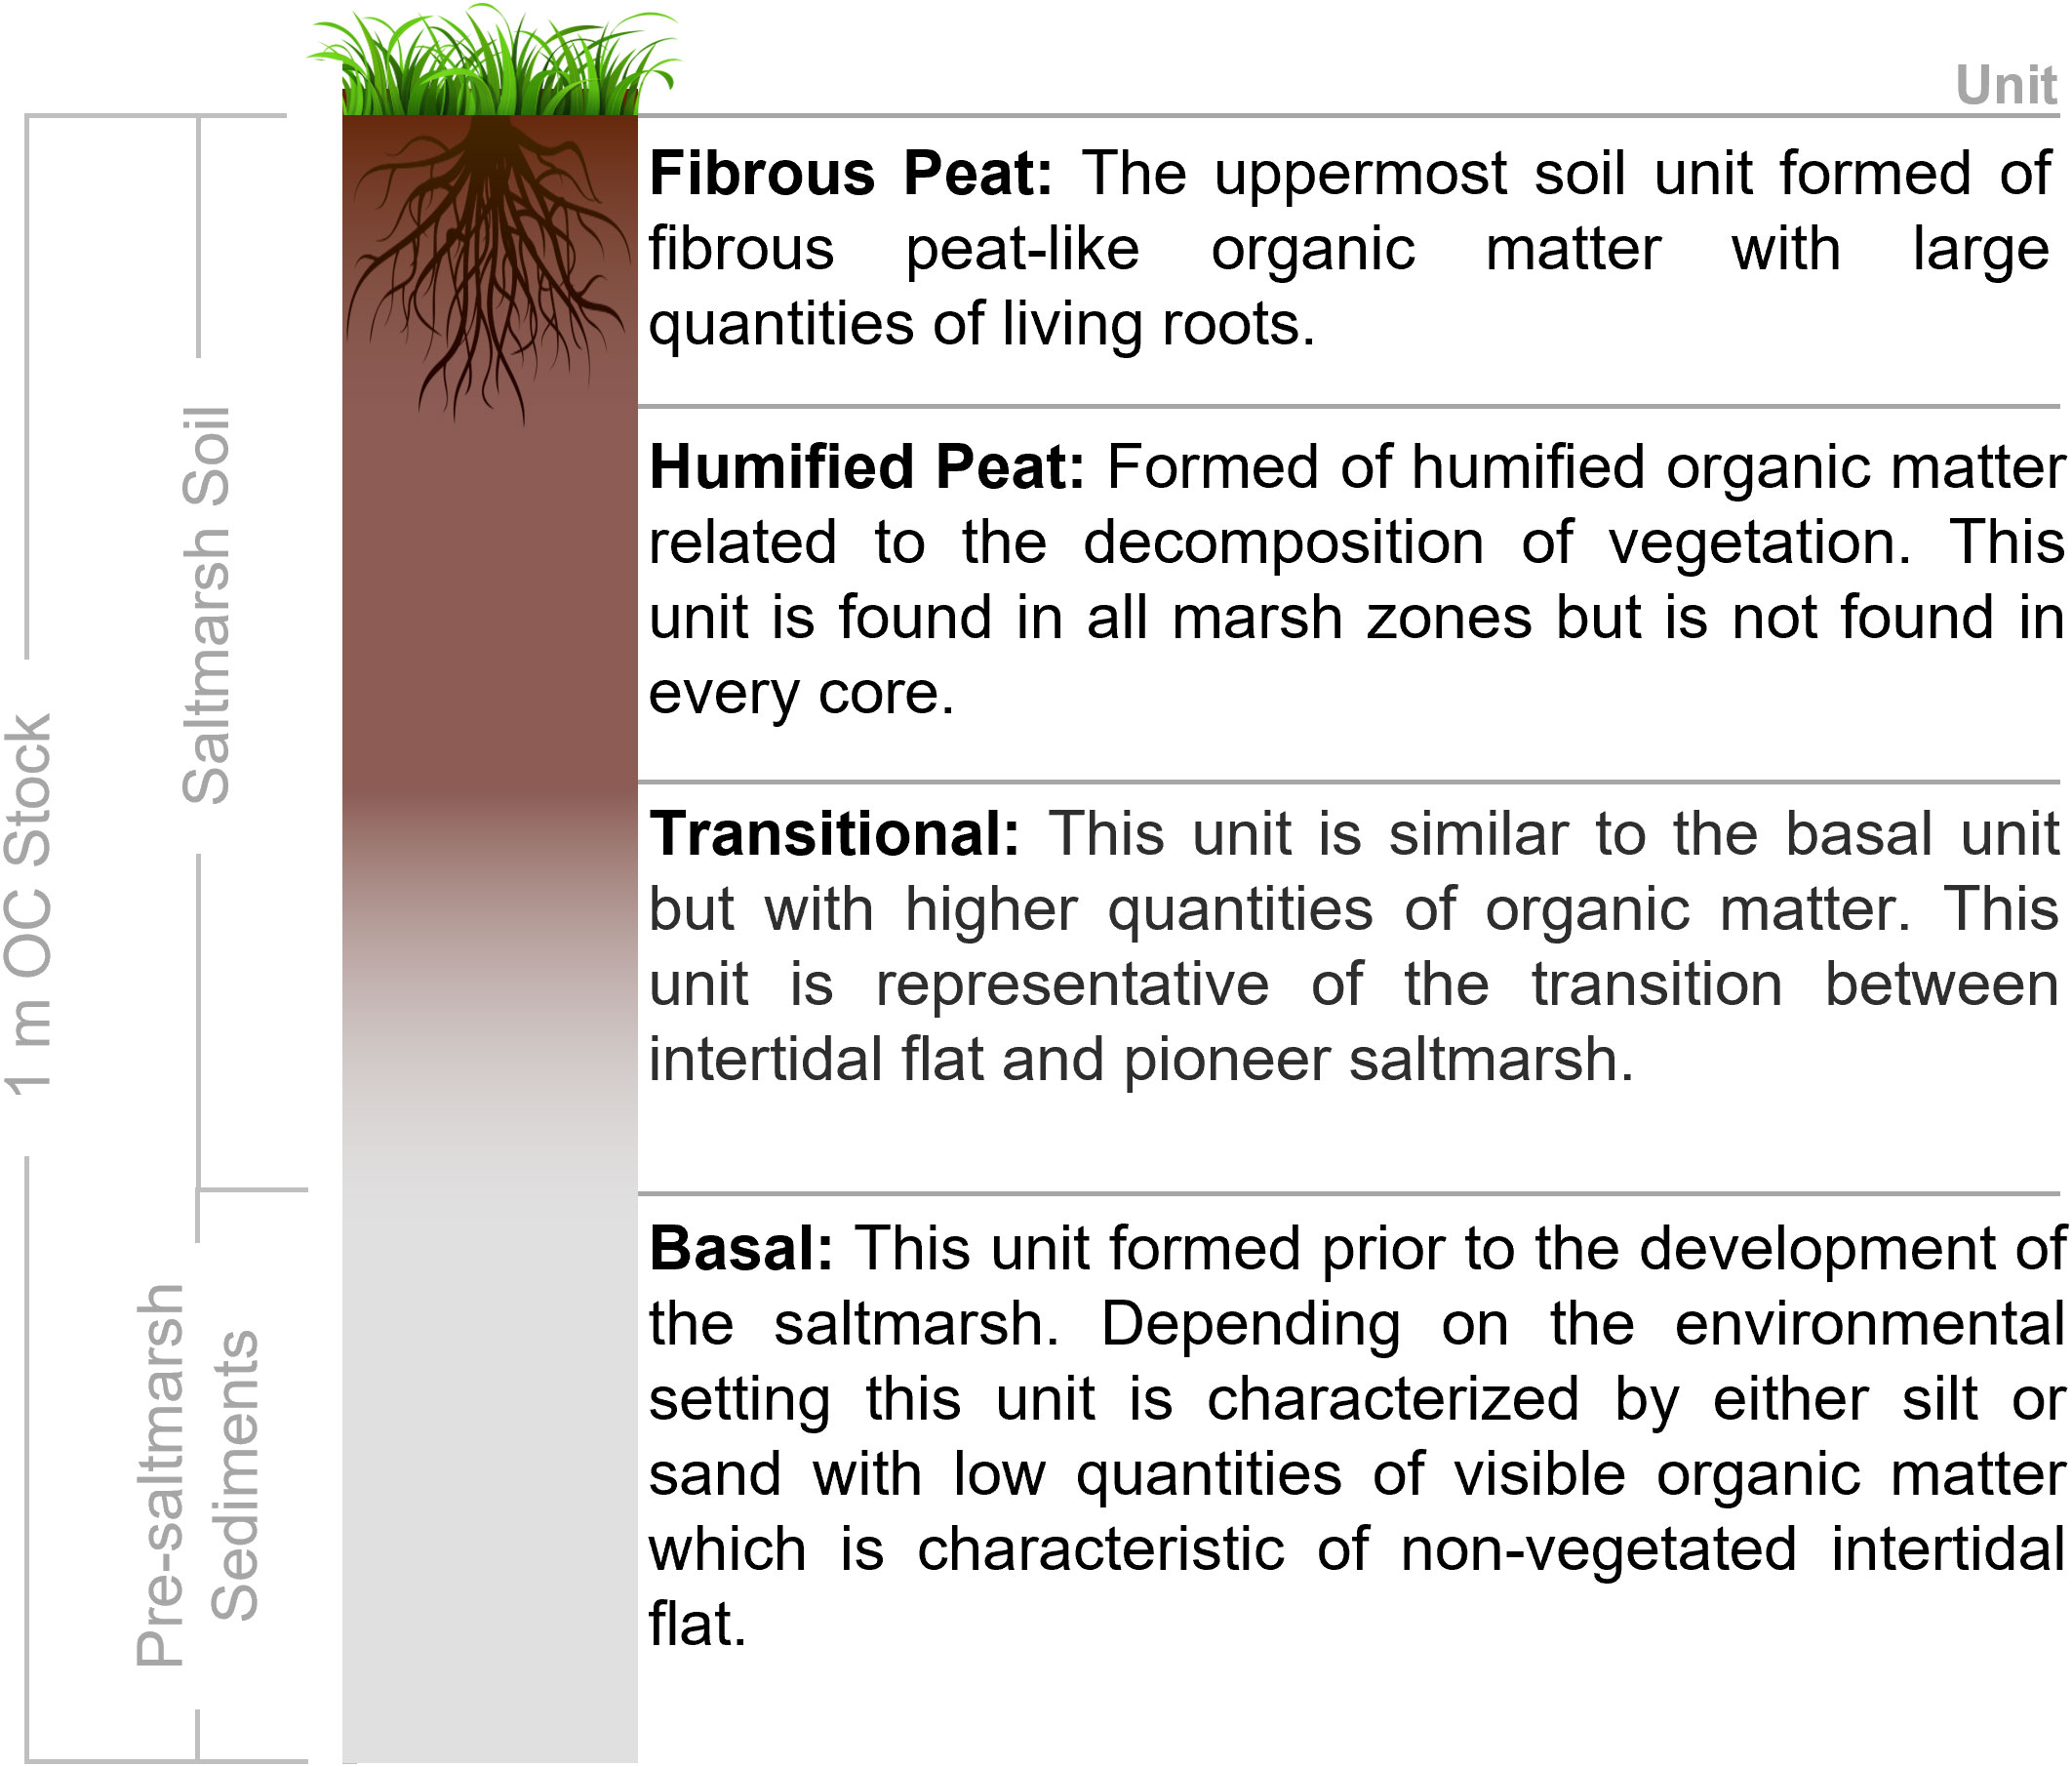
Figure 3 Conceptual diagram of the common soil profile found across the saltmarshes within this study.
To facilitate soil OC stock calculations, the Troels-Smith descriptions were simplified into four units that were present across all marshes in this study (Figure 3). The fibrous peat, humified peat and transitional soil units were associated with saltmarsh habitat, while the basal unit represented the pre-saltmarsh environment in the form of mud or sand flat.
3.7.3.2 OC stock calculations
Saltmarsh soil OC stocks were estimated for the 26 target saltmarshes following the calculation steps of Miller et al. (2023). The mean (and standard deviation) thickness, dry bulk density and OC content for each soil unit (section 3.6.3.1) were calculated from the soil core sub-samples for each saltmarsh. Using the MCMC framework (section 3.6.2), these metrics were assigned to the areal extent (again with ± 5% error) of the marsh zones within each saltmarsh to calculate the OC stock (eq.1-4).
OC stock for the saltmarsh soil (fibrous peat, humified peat and transitional soil units) and the OC stock down to a depth of 1 m (which includes the saltmarsh soil and the sediments associated with a pre-saltmarsh environment (Figure 3)) were calculated. Where cores did not extend to 1 m, the basal unit values were extrapolated.
3.8 Upscaling
3.8.1 k-medoids cluster analysis
To upscale the OC stock estimates from the 26 saltmarshes in this study to all saltmarsh in GB, a classification approach was used. Climatic, geomorphological, oceanographic, and ecological data were compiled for GB’s 448 saltmarshes (Table 2; Supplementary Data). The compiled data were used in conjunction with the k-medoids cluster algorithm using the partitioning around medoids (PAM) approach (Kaufman and Rousseeuw, 1990) to cluster (group) the saltmarshes with similar characteristics. The k-medoids algorithm (PAM) was chosen over the k-means cluster algorithm (Hartigan and Wong, 1979) for partitioning the data because PAM uses medoids as cluster centers instead of means to be less sensitive to noise and outliers. To determine the optimal number of clusters for the PAM algorithm, the average silhouette method was utilized (Kaufman and Rousseeuw, 1990). This method measures the quality of a clustering by determining how well each observation lies within its cluster, with a high average silhouette width indicating a good clustering. The average silhouette method computes the average silhouette of observations for different numbers of clusters, with the optimal number of clusters maximizing the average silhouette width (Kaufman and Rousseeuw, 1990).
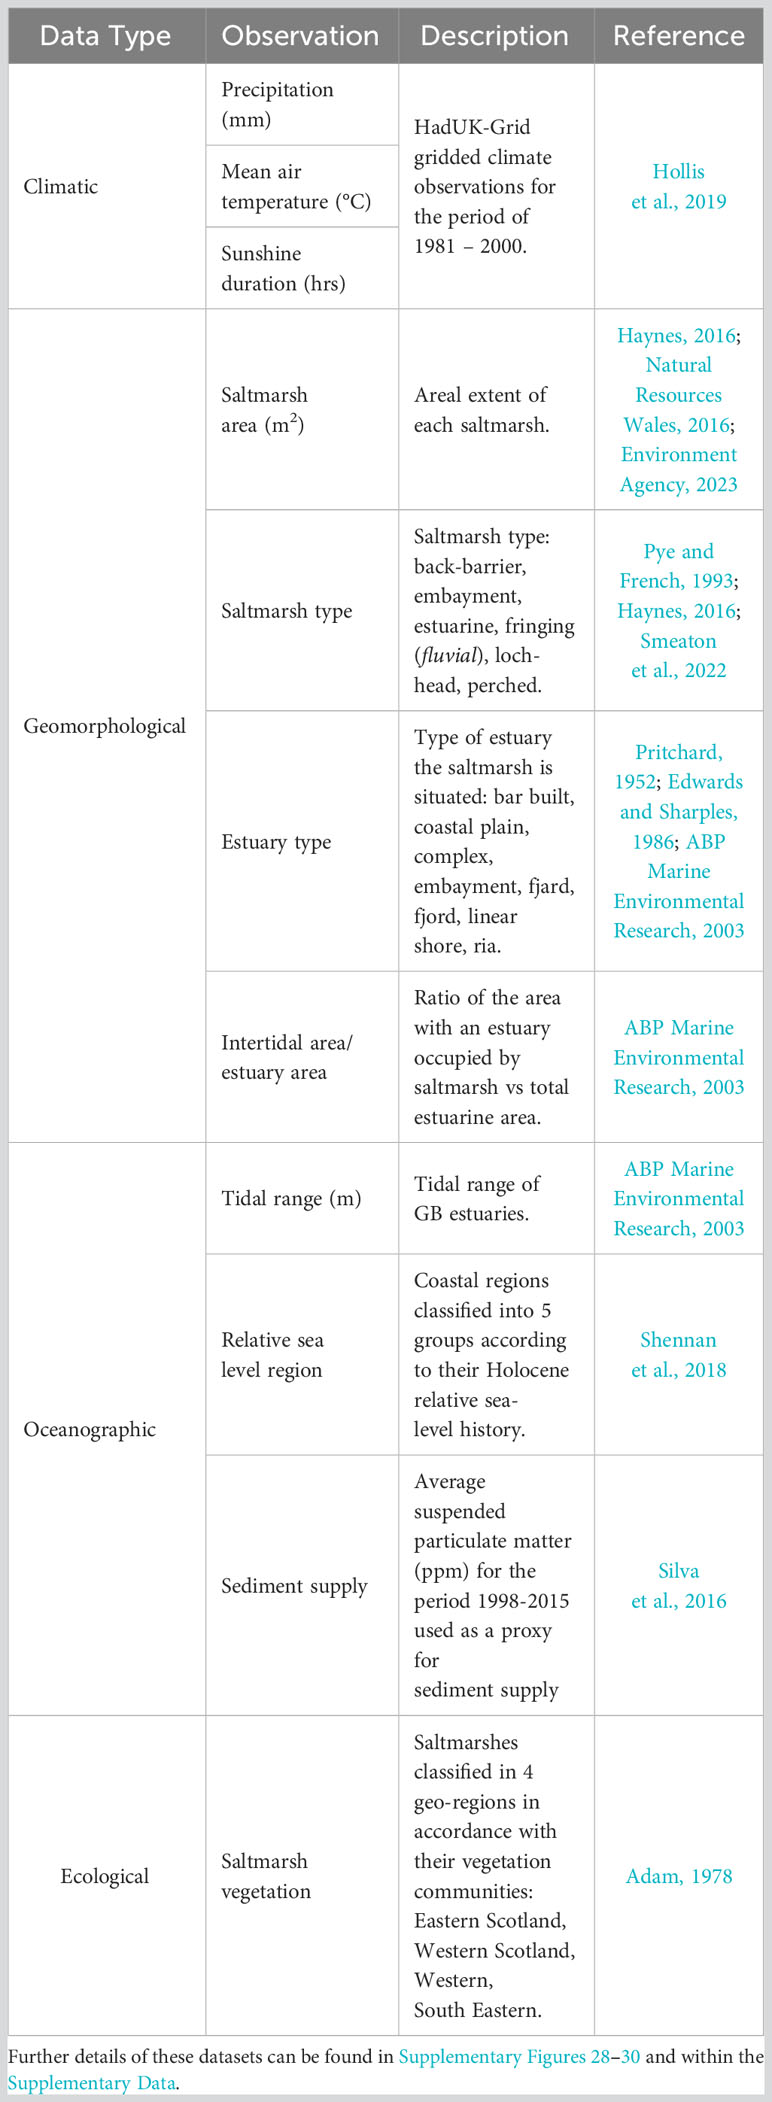
Table 2 Data used with the PAM analysis to group the 448 GB saltmarshes.
3.8.2 GB saltmarsh OC stock estimation
To estimate the OC stock of all GB saltmarshes, the areal extent of each marsh zone within the groups produced by the PAM clustering analysis was calculated. Again, a ±5% error was applied to the areal extent of all marsh zones to account for changes since the surveys were undertaken. The PAM analysis assigns each of the 26 saltmarshes with detailed OC stock estimates to a cluster. From these saltmarshes, cluster specific mean (and standard deviations) OC storage values (kg C m-2) were calculated for the saltmarsh soil to a depth of 1 m, alongside both the aboveground and belowground biomass. The mean OC storage values were combined with the area of each marsh zone within each cluster to estimate the OC stocks for the aboveground biomass, belowground biomass, and the saltmarsh soil, to a depth of 1 m for all 448 saltmarshes within GB. All calculations were carried out within a MCMC framework (section 3.7.2).
4 Results and discussion
4.1 Above and belowground OC
Progressing from the seaward edge to the landward side of the saltmarsh, the quantity of OC held within the vegetation increased from 0.06 ± 0.06 kg C m-2 to 0.15 ± 0.15 kg C m-2 (Figure 4A). The invasive Spartina alterniflora and S. anglica species, which often displace native vegetation in the pioneer and low marsh at lower latitudes (Hammond and Cooper, 2002), held 0.11 ± 0.08 kg C m-2 and outperformed the native pioneer vegetation due to the increase in biomass (clumping) associated with Spartina (Qi and Chmura, 2023). The calculated aboveground OC storage values across all marsh zones are comparable to values (0.09 – 0.28 kg C m-2) previously observed in GB (Beaumont et al., 2014; ABPmer, 2020; Miller et al., 2023) and other temperate European saltmarshes (Hemminga et al., 1996; Burke et al., 2022; Penk and Perrin, 2022; Carrasco-Barea et al., 2023), but are significantly smaller than values associated with tropical systems (Santini et al., 2019). The ANOVA highlights that the difference between the average aboveground OC storage is statistically significant (Supplementary Table 5), while the TK test reveals the most significant difference to be between the aboveground OC found in the mid-low and pioneer zones (Supplementary Table 6).
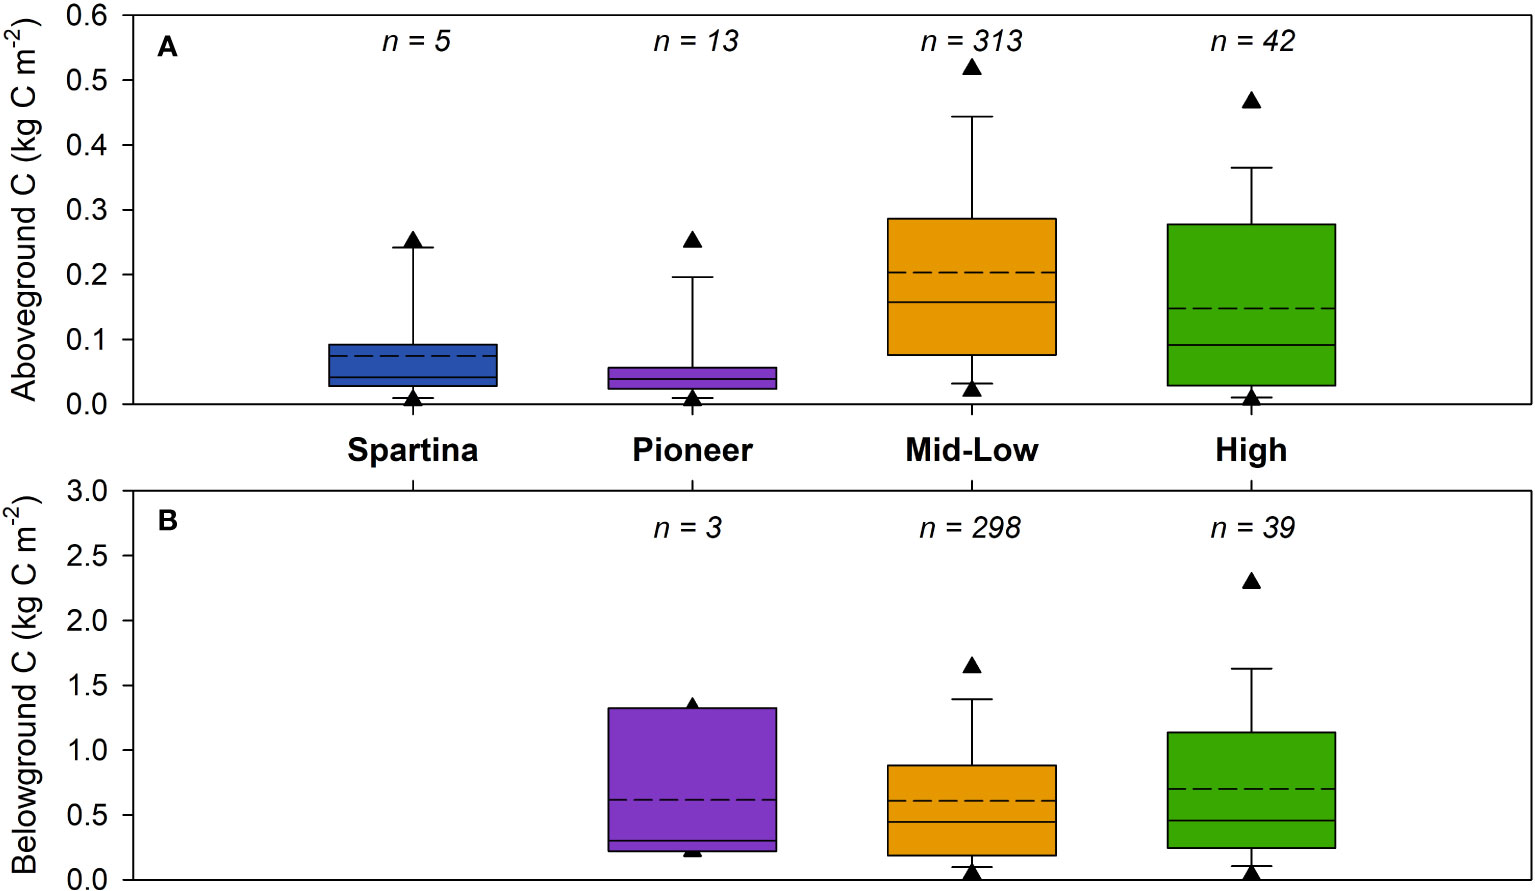
Figure 4 Biomass OC storage from across the study sites for (A) aboveground (vegetation) and (B) belowground (roots, stolons, and rhizomes) carbon (kg C m-2). Dotted and solid lines represent the mean and median values, respectively, and the triangles illustrate the 5th and 95th percentiles. Location of biomass sampling sites can be found in Supplementary Figure 27 and a breakdown of the data is presented in Supplementary Table 3, 4. Results from ANOVA and Tukey Kramer statistical tests can be found in Supplementary Table 5–8.
The compiled belowground biomass data (n = 340) comprise of observations from the pioneer, mid-low and high saltmarsh zones. Unlike the aboveground data, there are no values available for marsh colonized by Spartina (Figure 4B). In contrast to aboveground data, the belowground biomass showed no significant difference between the marsh zones (Supplementary Table 7, 8). The low amount of data from the pioneer zone likely does not fully reflect the range of belowground OC values, leading to the small differences observed between the zones.
The belowground OC data compiled in this study (Figure 4B) cover a greater range than observations (0.82 – 1.65 kg C m-2) previously used in OC stock estimates for GB saltmarshes (Beaumont et al., 2014; Ford et al., 2019; Miller et al., 2023). Nevertheless, they are comparable to values from temperate European saltmarshes which range between 0.22 to 3.75 kg C m-2 (Van de Broek et al., 2018; Burke et al., 2022; Graversen et al., 2022).
4.2 Saltmarsh soil
Across the 26 sampled saltmarshes, the thickness of the different soil units (section 3.6.3.1) differed significantly both within and between saltmarshes (Figure 5), as highlighted by the ANOVA and TK tests (Supplementary Table 9, 10). The saltmarsh soil thickness ranges from 57 ± 16 cm in the Kyle of Tongue in north Scotland to 22.93 ± 9.58 cm at Newton marsh in southern England (Figure 1). On average, the saltmarsh soil (fibrous peat, humified peat, transitional soil units) thickness within GB marshes is 28.19 ± 16.32 cm. Unlike the individual soil units, the statistical test show that the thickness of the saltmarsh soil (i.e., the fibrous peat, humified peat and the transitional units) is does not vary significantly between marshes (Supplementary Table 11, 12). The basal unit which represents the pre-saltmarsh environment (e.g., intertidal flat) therefore makes up a significant proportion of the upper 1 m of soil.
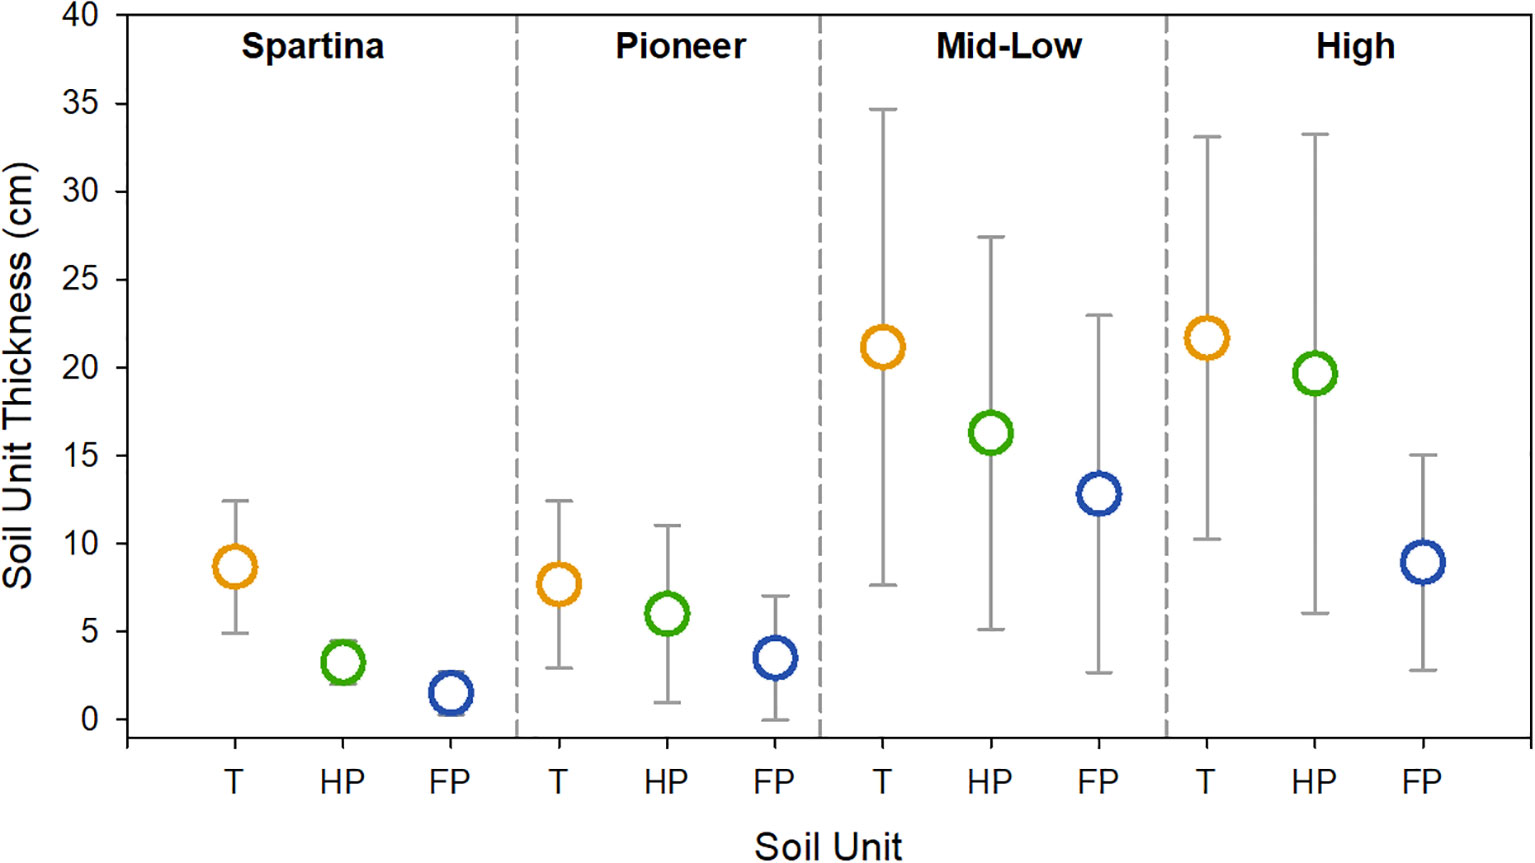
Figure 5 Mean thickness (cm) for the three saltmarsh soil units across the different marsh zones of the 26 marshes surveyed in this study. Error bars represent 1 standard deviation. Soil units, T: transitional (orange), HP: humified peat (green), FP: fibrous peat (blue). Full breakdown of the soil profiles for each marsh can be found in the Supplementary Data. Results from ANOVA and Tukey Kramer statistical tests can be found in Supplementary Tables 9–12.
Patterns of relatively thin saltmarsh soils overlaying marine sediments are not unique to GB. Such patterns have also been observed in the Wadden Sea (Mueller et al., 2019) and are a product of regional changes in Holocene relative sea level (Shennan et al., 2018) as well as local drivers, including sediment supply and coastal management practices.
The dry bulk density of the soil units differs across the 26 saltmarshes (Figure 6B) with values ranging between 0.10 g cm-3 in the fibrous peat layer at the Kyle of Tongue to 1.68 g cm-3 in the clay-rich basal unit at Black Rock marsh. Within the studied saltmarshes, the average dry bulk density of the saltmarsh soil is 0.55 ± 0.32 g cm-3, while the observed basal unit value is 0.84 ± 0.43 g cm-3. The dry bulk density increases down the soil profile (Figure 3) from the loosely consolidated fibrous peat unit to the more homogenous humified peat and transitional soil units, with the basal unit at each saltmarsh consistently having the highest dry bulk density values (Figure 5B). Within each saltmarsh, the high, mid-low, and pioneer marsh zones all exhibit similar dry bulk density values for each of the four soil units (Supplementary Data) indicating the dry bulk density is primarily driven by a suite of processes including: (i) the quantity (Figure 5A) and porosity of the organic matter (ii) the level of natural soil compaction and (iii) the dominant sediment type (sand vs mud) of the surrounding environment.
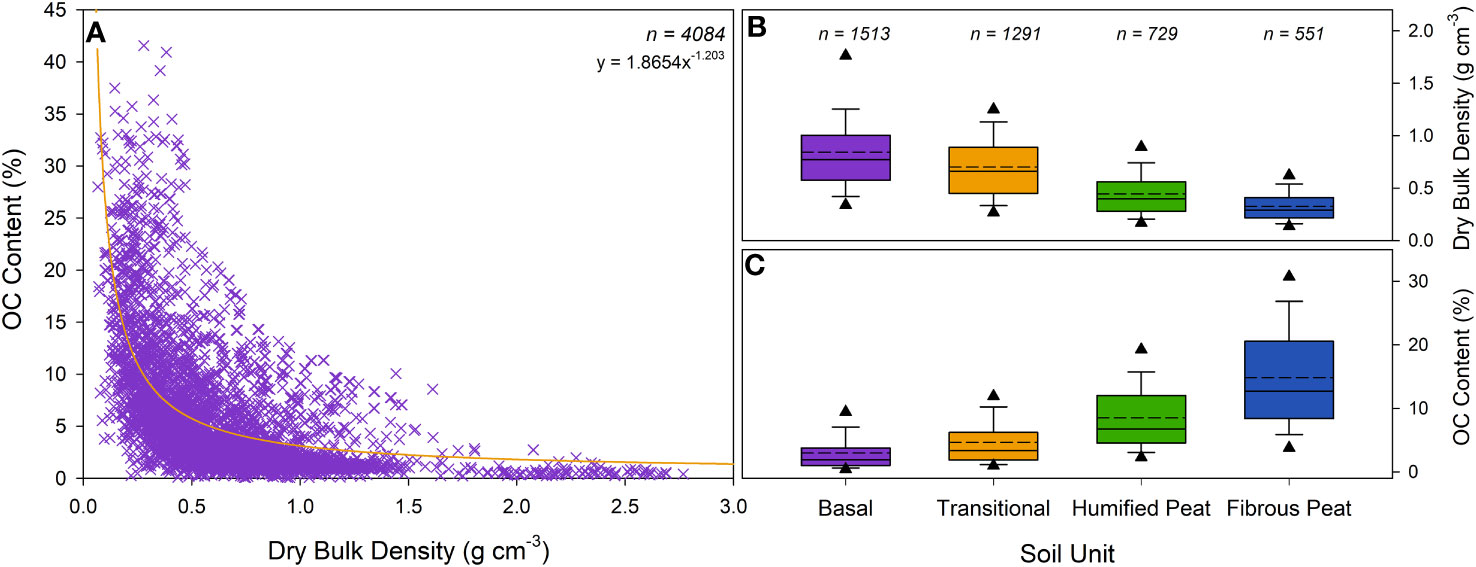
Figure 6 Dry bulk density (g cm-3) and OC content (%) of 4,084 soil samples collected from across the study sites. (A) Dry bulk density vs OC content. (B) Dry bulk density across the different soil units. (C) OC content of the different soil units observed across the 26 saltmarshes. Dotted and solid lines represent the mean and median values, respectively, and the triangles illustrate the 5th and 95th percentiles. Results from ANOVA and Tukey Kramer statistical test can be found in Supplementary Tables 13–20.
The OC content of the soil units differs significantly between marshes with OC values ranging from below 0.1% in the basal units of marshes dominated by sand (i.e., Caerlaverock, Llanrhidian, Shell Island, Sunderland) to over 40% in the fibrous peat layers in the marshes of Orkney (i.e., Bridge of Waithe and Waulkmill Bay) which are fed by catchments containing blanket peat (Porter et al., 2020). Across the 26 saltmarshes the average OC content of the saltmarsh soil and basal unit are 7.94 ± 6.86% and 2.96 ± 2.92% respectively. The high marsh zone soils have the greatest OC content, with a decrease observed in a seaward direction (Figure 6). The ANOVA and TK analysis indicates that the dry bulk density and OC content of the high and mid-low marsh zones are statistically similar, as are the pioneer and Spartina zones (Supplementary Table 19, 20). In contrast, the difference in dry bulk density and OC content of high and mid-low zones is statistically different to that found in the pioneer and Spartina zones across GB (Supplementary Table 19, 20).
Zone-specific vegetation composition is likely the primary driver of the differences observed in OC. Within saltmarshes, it is well understood that the OC content of the soil is driven by the vegetation either through direct OC input from the roots and dead biomass or by the vegetation structures (including leaves, stems, roots, stolons, and rhizomes), facilitating the capture of allochthonous OC (Ford et al., 2019; Austin et al., 2021; Penk and Perrin, 2022).
The diverse range of soil dry bulk density and OC content values (Figure 6) measured in this study are comparable with saltmarsh systems in the UK and Western Europe (Beaumont et al., 2014; Van de Broek et al., 2018; Burden et al., 2019; Ford et al., 2019; Harvey et al., 2019; Marley et al., 2019; Mueller et al., 2019; Smeaton et al., 2020; Smeaton et al., 2022; Burke et al., 2022; Ladd et al., 2022; Miller et al., 2023).
4.3 Individual saltmarsh OC stocks
The 26 saltmarshes contain vastly different quantities of OC, ranging from 957 ± 484 tonnes at Loch Laich to 197,862 ± 105,116 tonnes at Llanrhidian (Figure 7A). Across all sampled saltmarshes, the soils represent between 84% and 99% of the saltmarsh OC stock, with the above and belowground biomass only representing minor components of the total stock (Figure 7B). The magnitude of the saltmarsh OC stock is primarily driven by saltmarsh areal extent, with the largest systems holding the most OC. The largest quantities of OC are stored in the large marshes situated on open coastlines such as those in the Wash (Stiffkey, Gedney) and the Solway Firth (Wigtown, Caerlaverock). These systems are all > 5 km2 in size, extending to over 20 km2 (Gedney); in contrast the small saltmarshes of Scotland hold the smallest quantity of OC (Figure 7A).
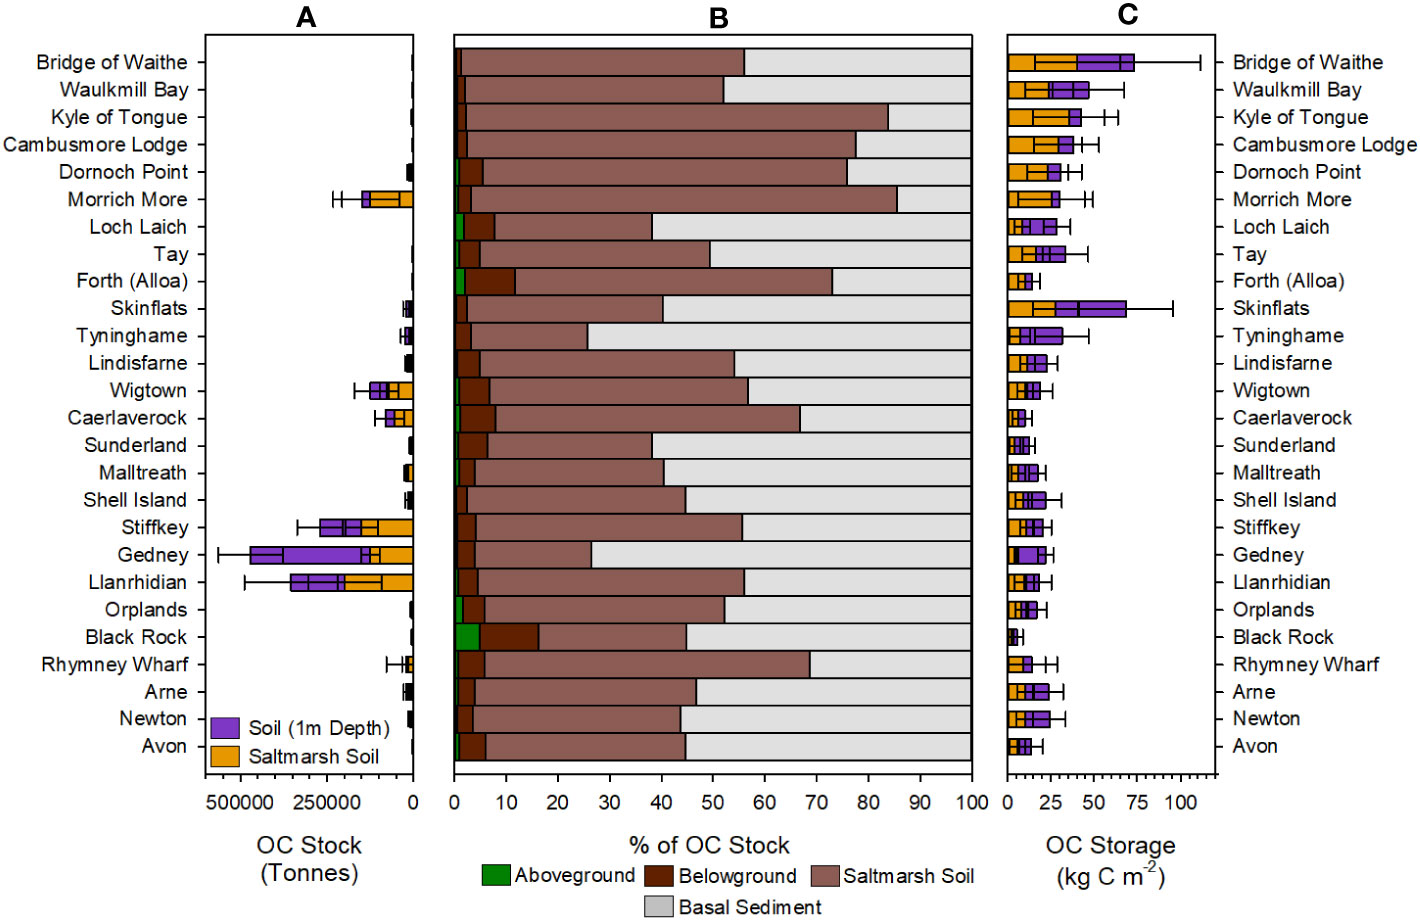
Figure 7 Organic carbon (OC) stocks and storage of the 26 saltmarshes. (A) Estimated OC (tonnes) held within the saltmarsh soil and to a depth of 1 m. (B) Percentage breakdown of the four components (aboveground, belowground, saltmarsh soil and basal sediment) contribution to the total OC stock. (C) Area normalized OC storage (kg C m-2) values for the saltmarsh soil and to a depth of 1m across the study sites. Saltmarshes are ordered from the most northerly (Bridge of Waithe) to southerly marshes (Avon). Full summary of the OC stocks and storage can be found in Supplementary Tables 21–24.
When the basal unit (i.e., pre-saltmarsh intertidal flat sediments) is considered, the OC stocks increase by between 15% and 77% depending on location. In the saltmarshes of northern Scotland, we observe the smallest increase in OC stock. These saltmarshes generally have soils associated with saltmarsh habitat to a greater depth than the rest of the country (Supplementary Data). In addition, the difference in OC content between the saltmarsh soil and the basal unit can be significant (Figure 6C). The difference is most pronounced at Morrich More where the saltmarsh soil contains 18.85 ± 13.08% OC in comparison to the sandy basal unit which holds 0.64 ± 0.34% OC. These factors result in the saltmarsh soils in the north of Scotland holding a greater quantity of OC than the pre-saltmarsh sediments. The opposite is true in marshes such as Tyninghame and Stiffkey where the pre-saltmarsh sediments hold significantly more (>75%) OC than the saltmarsh soils. In these marshes, the saltmarshes soils are thinly layered on top of much thicker deposits of pre-saltmarsh sediments. Furthermore, the difference in OC content between the saltmarsh soil and basal unit is far smaller. For example, the saltmarsh soil in the high marsh zone of Gedney contains 5.66 ± 0.85% OC, with the basal unit holding 3.99 ± 1.36% OC. The reduced depth of the saltmarsh soils, combined with the comparable OC contents of the saltmarsh soils and basal unit at these sites, results in the pre-saltmarsh sediment containing the majority of the OC held within the top 1 m. This clearly highlights the importance of understanding the temporal development of the saltmarsh and how this is reflected in the soil profile to assure the accurate quantification saltmarsh OC and to avoid the inclusion of OC held within underlying material deposited prior to saltmarsh development.
While saltmarsh areal extent clearly drives the magnitude of the saltmarsh OC stock, there are clear differences in the effectiveness of how individual saltmarshes store OC (Figure 7C; Figure 8). When normalized for area, the smaller saltmarshes of Scotland (such as Bridge of Waithe and the Kyle of Tongue) have both the smallest OC stocks yet per are unit store the greatest quantity. In contrast, the saltmarshes with the largest stocks (such as Llanrhidian and Stiffkey) store much smaller quantities per unit area (Figure 8). The differences are likely driven by regional and local factors such as geomorphology, source of the OC, sediment type (mud vs sand) and sediment supply (Kelleway et al., 2016).
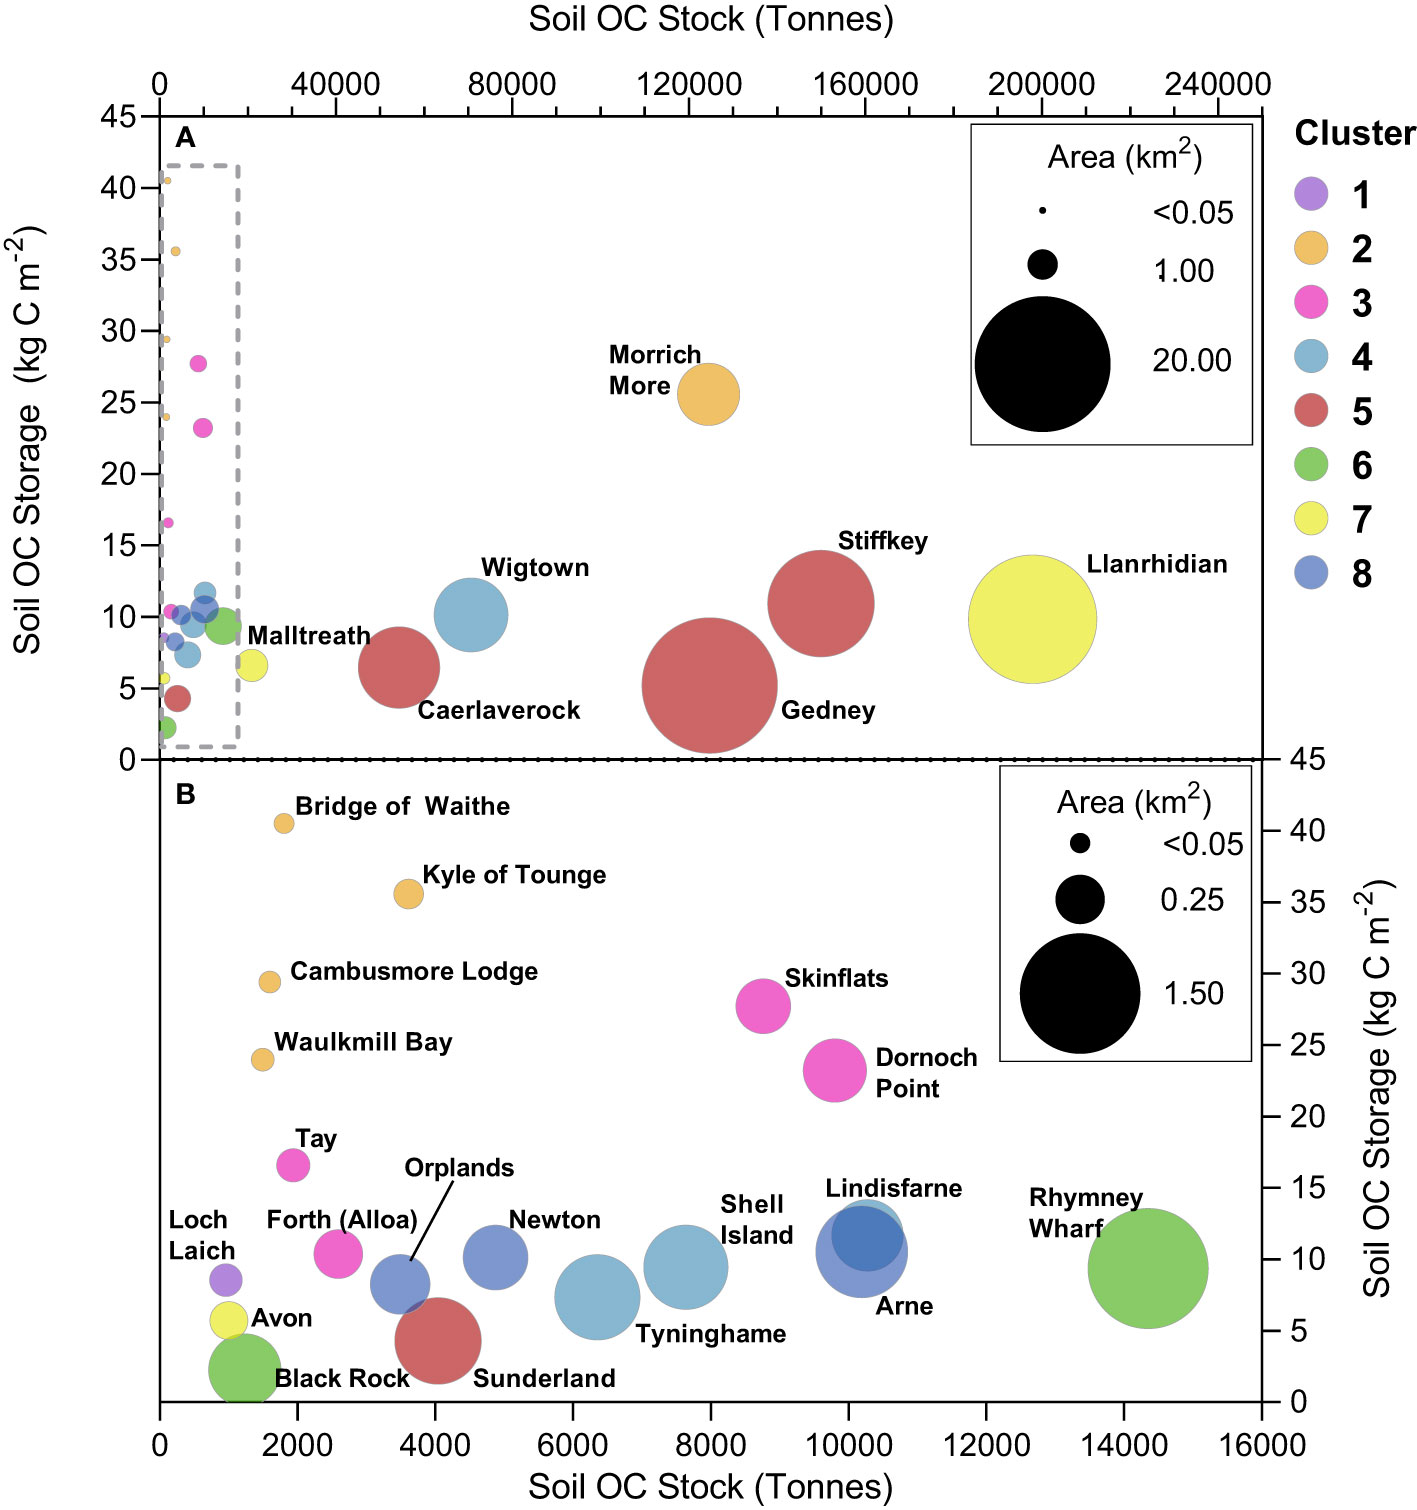
Figure 8 Organic carbon (OC) stock (tonnes) vs area normalized OC storage (kg C m-2) vs saltmarsh area (km2) across (A) All 26 saltmarshes. (B) 19 saltmarshes highlighted within the box in panel (A) Colors represent the cluster in which each saltmarsh is grouped. Full summary of the data can be found in Supplementary Tables 23, 24.
The saltmarshes in the north and northeast of Scotland (Bridge of Waithe, Kyle of Tongue, Cambusmore Lodge, Waulkmill Bay, Morrich More) store between 23.97 and 40.51 kg C m-2 (Figure 8), which far exceeds the global average of 16.2 kg C m-2 (Duarte et al., 2013) and that observed in other temperate saltmarshes in northwest Europe (Burke et al., 2022; Graversen et al., 2022). The above average OC storage values for these systems are likely attributed to allochthonous input from the OC rich terrestrial environment. The catchments of these saltmarshes are dominated by peatlands and represent some of the most OC rich environments in Europe (Lilly and Donnelly, 2012). Recent work highlighted that up to 89.1 ± 12.1% of the OC held within northern Scottish saltmarshes originates from the terrestrial/in situ sources (Miller et al., 2023). Additionally, regional differences in Holocene relative sea level history (Shennan et al., 2018; Bradley et al., 2023) across GB has resulted in a greater period of stability and time for saltmarsh soils to accumulate in north Scotland. For example, while the saltmarsh at the Kyle of Tongue began to develop around 2,000 years ago (Barlow et al., 2014), Newton Marsh on the Isle of Wight only began to form 300 years ago (Long et al., 2014). The combination of these factors likely explains why the northern Scottish saltmarshes store the greatest quantity of OC per area unit of any European saltmarshes to date.
A second group of saltmarshes (Tay, Skinflats, Dornoch Point, Forth (Alloa)) located in the estuaries of major rivers of Scotland also ranks above average in terms of OC storage, with values ranging between 10.36 and 27.71 kg C m-2. Again, allochthonous OC input is the most likely driver of the elevated OC storage values; together the rivers Tay and Forth drain 6,023 km2 of the OC-rich soils of mainland Scotland. Miller et al. (2023) found that 93.2 ± 14.5% of the OC in the saltmarsh soils of Skinflats originates from terrestrial/in situ sources.
The remaining 17 saltmarshes store similar quantities of OC with values ranging between 2.24 and 11.67 kg C m-2, with an average value from across these marshes of 8.03 ± 2.62 kg C m-2 (Figure 8). These saltmarshes fall below the global average of 16 - 40 kg C m-2 (Duarte et al., 2013; Temmink et al., 2022), yet are comparable to values found in both the Republic of Ireland (6.46 – 18.58 kg C m-2) and Denmark (4.27 – 8.18 kg C m-2) (Burke et al., 2022; Graversen et al., 2022). The lower OC storage values of the 17 saltmarshes in comparison to the Scottish systems is likely due to their catchments having less OC to supply marsh soils (Bradley et al., 2005). On average, the soils of these marshes 17 contained 6.34 ± 3.66% OC, compared to the 11.67 ± 13.05% OC of the Scottish saltmarsh soils. Additionally, the more southern saltmarshes have also had significantly less time to develop due to regional relative sea level history. Within this group of 17 saltmarshes, the variance in OC storage is largely driven by the dominant sediment type of the surrounding environment. The lowest OC storage values are found in saltmarshes such as Sunderland, Black Rock and Tyninghame which are sand-dominated and only contain a store a small quantity of OC (Figure 8), whereas the mud rich saltmarshes (Newton, Arne, Lindisfarne) contain higher quantities of OC and store more OC per area unit (Figure 8).
A combination of several regional and local factors likely govern the quantity of OC stored within saltmarshes around GB. Here we have identified the drivers that provide first-order control on OC storage (OC source, relative sea-level history, and sediment type). Further work is required to fully understand the interaction between first-order controls and other factors such as sediment supply and climatic conditions on OC storage.
4.4 Great British saltmarsh OC stocks
4.4.1 PAM clustering
The PAM clustering analysis based on saltmarsh and environmental variables (Table 2) results in the sub-division of the 448 saltmarshes of GB into eight groups (Figure 9) each with distinct characteristics (Table 3).
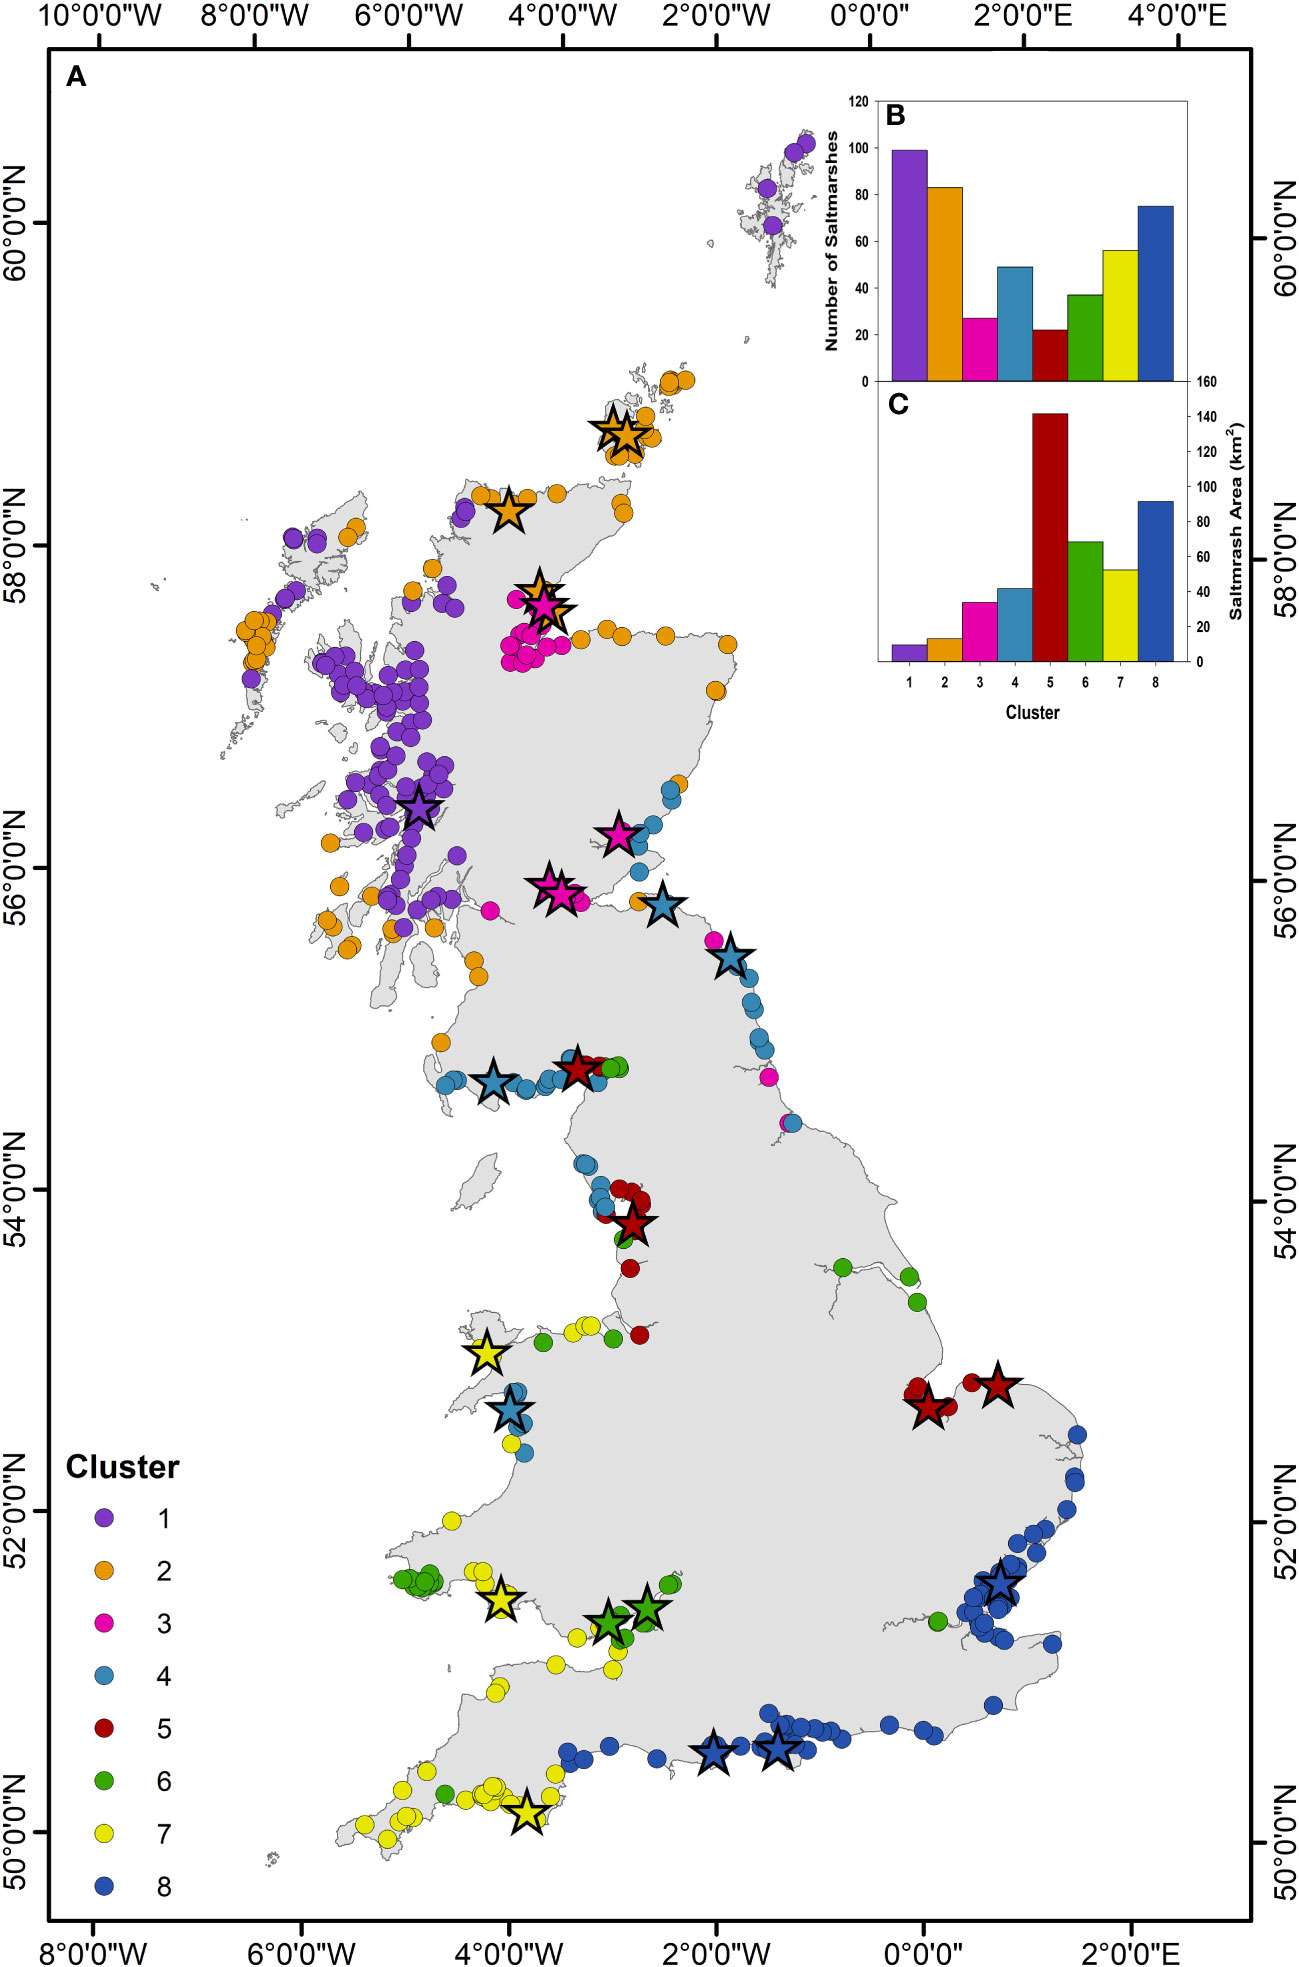
Figure 9 PAM cluster analysis. (A) Great British saltmarshes grouped corresponding to the eight clusters identified by the PAM cluster analysis (Supplementary Figures 32–34). Stars represent the 26 saltmarshes in this study and their associated cluster (Supplementary Table 25). (B) Number of saltmarshes in each cluster. (C) Areal extent (km2) of saltmarsh in each of the eight clusters.
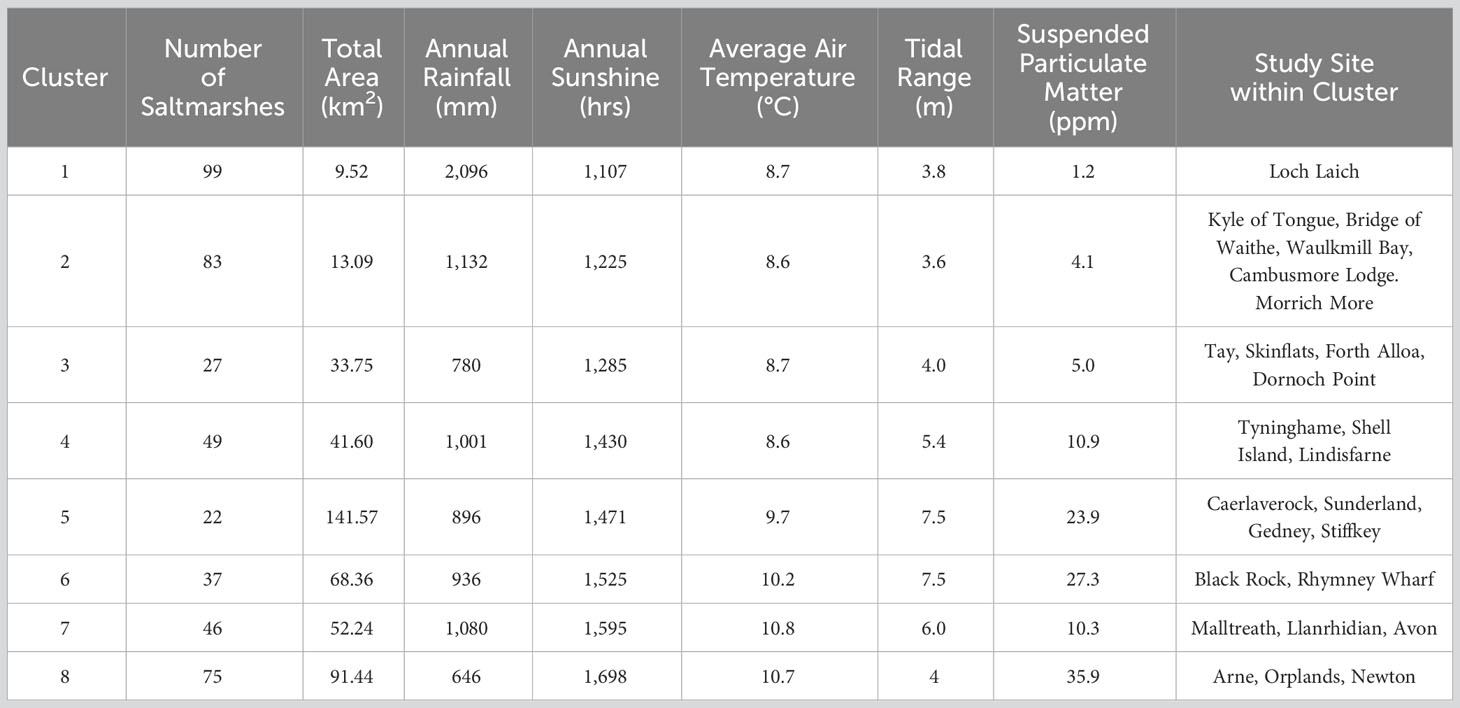
Table 3 Descriptions of the characteristics of the saltmarshes within the eight groups defined by the cluster analysis.
4.4.2 Upscaled national saltmarsh OC stocks
The quantity of OC held in the saltmarshes within the eight clusters ranges between 0.088 Mt in cluster 1 to 1.181 Mt in cluster 5 (Figures 10A, B). The main driver for these differences is the areal extent of saltmarshes. The saltmarshes of clusters 5 (141.57 km2) and 8 (91.44 km2) occupy the greatest area and, in turn, these clusters hold the greatest quantity of OC (Figures 10A, B). After areal extent, differences in OC storage values assigned to each of the cluster drive the variance in OC stocks (Figure 10A, B). As with individual saltmarshes, small differences in geomorphology, sediment type, OC source, and marsh zonation alter the OC storage values and, in turn, the OC stock of each cluster. Across the clusters, the OC storage values are generally< 10 kg C m-2, yet clusters 2 and 3 are outliers and store OC much more effectively, with average values of 25.92 ± 18.10 kg C m-2 and 19.23 ± 6.05 kg C m-2 respectively. The saltmarshes in cluster 2 are situated in peat-dominated catchments rich in OC (Lilly and Donnelly, 2012), and those in cluster 3 are located on major rivers (e.g., the Rivers Tay and Forth) as previously discussed (section 4.3). These factors likely result in the marshes capturing significant quantities of allochthonous material, resulting in the above average OC storage values. Bringing together the OC stored across the eight clusters, we estimate that GB saltmarshes store 5.204 ± 0.647 Mt of OC (Figures 10C, D). Northern Ireland saltmarshes occupy an area of 2.38 km2 (JNCC, 2013), approximately 0.5% of the GB total. It is therefore reasonable to assume that the quantity of OC stored in United Kingdom (i.e., Great Britain and Northern Ireland) saltmarshes would only be marginally greater than the GB estimate.
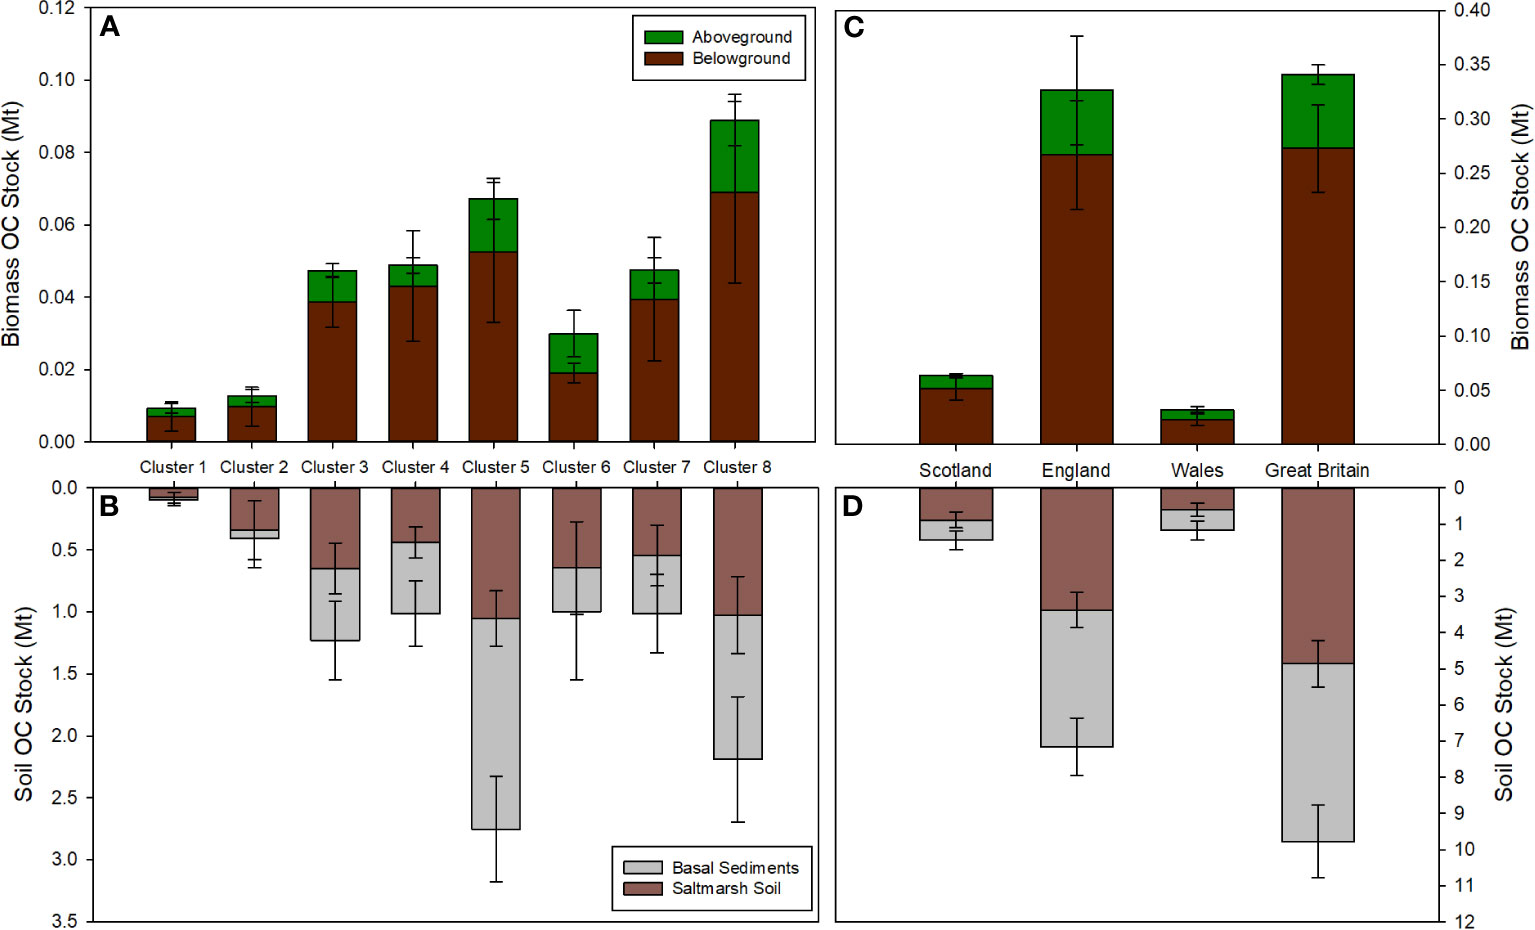
Figure 10 National organic carbon (OC) stocks (Mt). OC stock estimates for the eight clusters: (A) Aboveground and belowground OC stocks; (B) OC held with the saltmarsh soil and the soil to a depth of 1 m. OC stock estimate for Great Britain broken down into its three constituent nations: (C) Aboveground and belowground OC stocks; (D) OC held with the saltmarsh soil and the soil to a depth of 1 m. Full summary of these OC stocks can be found in Supplementary Tables 26-32.
Of the total OC stock, 93% is held within the soils, with the above and belowground biomass holding only a small fraction of the OC (Table 4). The saltmarshes of England hold 3.638 ± 0.491 Mt OC representing 70% of the GB stock, with Scotland and Wales marshes holding 17% and 12% of the GB OC stock, respectively. The differences in OC stock between nations is driven by the areal extent of the saltmarsh, with English saltmarshes occupying an area three times that of the Scottish and Welsh systems combined (Table 1). Per area unit, the Scottish saltmarshes store 16.32 ± 3.92 kg C m-2 compared to 11.04 ± 1.57 kg C m-2 and 11.05 ± 3.16 kg C m-2 for England and Wales respectively. The higher OC storage values observed in Scottish marshes are potentially driven by the capture and storage of allochthonous material (Miller et al., 2023). Rates of Holocene relative sea-level change varies around GB (Shennan et al., 2018), and relative stability during the late Holocene, alongside catchment-scale sediment supply, has allowed soil to develop to a greater depth in Scotland. Sea-level change is known to be a primary driver of saltmarsh OC storage at a global scale over millennia (Rogers et al., 2019). However relative sea-level history is likely to also play a key role in differences at the regional scale, and potentially is a first-order driver of OC accumulation requiring further investigation to fully understand these processes across the UK and globally.
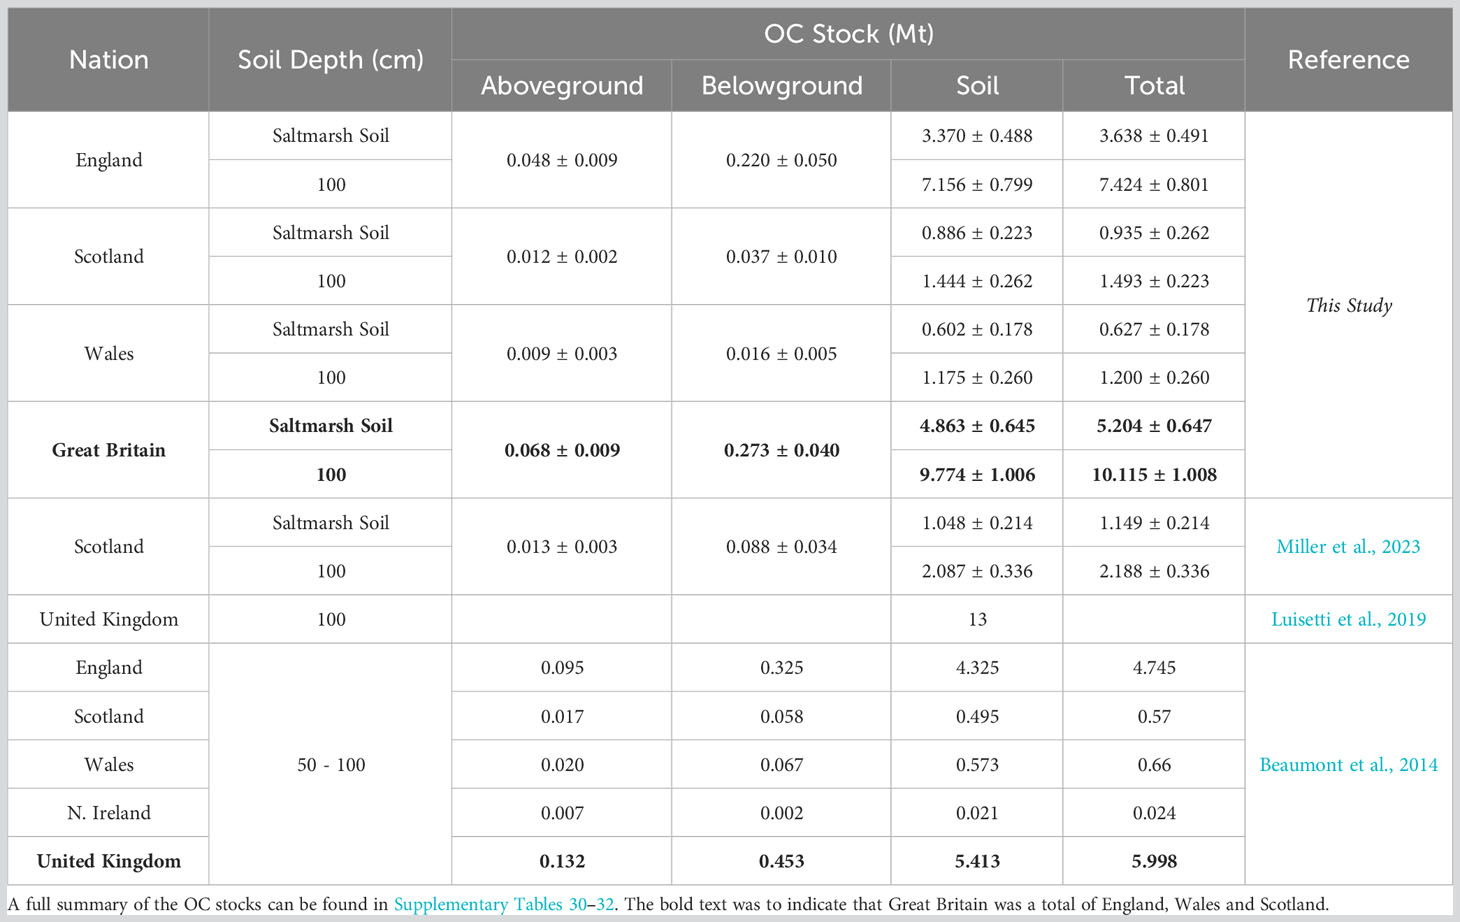
Table 4 National saltmarsh OC stock estimates from this study in comparison to existing OC soil stocks from Great Britain.
The top 1 m of GB saltmarshes sediments (including saltmarsh and basal sediments) holds 9.774 ± 1.006 Mt of OC. The basal unit of GB saltmarshes holds 4.910 ± 1.113 Mt of OC. This OC is not related to the saltmarsh, rather it associated with the pre-saltmarsh environment in the form of mud or sand flat habitat. This pattern is mirrored in England and Wales, with the basal unit accounting for 47% and 51% of the 1m soil OC stock respectively. In Scotland, the basal unit accounts for 61% of the OC in the top 1 m of soil. These results highlight that, to accurately account for OC within saltmarshes, it is crucial to understand the soil profile (Figure 3) and how this relates to different environmental settings (Mueller et al., 2019; Ladd et al., 2022; Miller et al., 2023). Arbitrarily accounting for saltmarsh OC down to a depth of 1 m to match terrestrial OC accounting approaches or the Intergovernmental Panel Climate Change reporting (Howard et al., 2014; Kennedy et al., 2013) may either underestimate (Pace et al., 2021) or, as in the case of GB saltmarshes, significantly overestimate the OC held within saltmarsh soils.
Currently, the only other OC stock assessment that takes into consideration the full depth of the saltmarsh soil is focused on Scottish saltmarsh and was undertaken using a sub-set of the data utilized in this study (Miller et al., 2023). Miller et al. (2023) estimated that the Scottish saltmarshes hold 1.149 ± 0.223 Mt OC, whilst we find the same saltmarshes store 0.935 ± 0.262 Mt OC. Both estimates are within error of one another, and the small difference in OC stock can be accounted for by (i) a greater number of saltmarshes in this study, (ii) different mapping approaches (vegetation communities vs marsh zones), and (iii) the upscaling approach used. Beaumont et al. (2014) estimated that UK saltmarshes hold a total of 5.998 Mt of OC, with the soils (0.5 – 1 m) holding 5.413 Mt OC and the vegetation and roots holding 0.132 Mt and 0.453 Mt of OC respectively, which are comparable with our estimates (Table 4).
The only other GB blue carbon habitat with an OC stock assessment is Scottish seagrass (Potouroglou et al., 2021). The seagrass of Scotland is estimated to hold between 1.49 and 10.57 kg C m−2 in underlying soils, which results in a national OC stock of 0.088 Mt for the top 0.5 m of the soil (Potouroglou et al., 2021). Saltmarsh habitats in Scotland occupy an area 73% larger than that of seagrass and hold 90% more OC per area unit. In England, there is an estimated 133 km2 of seagrass (Natural England, 2022). If these habitats store OC similarly to Scottish seagrass, then seagrass ecosystems would hold between 0.20 – 1.4 Mt of OC. In terms of OC storage, saltmarsh would therefore be the principal GB blue carbon habitat.
4.4.3 Comparison to other national saltmarsh OC stocks
National OC stock assessments for saltmarsh environments are still rare, with only the United States of America and Australia having such estimates (Macreadie et al., 2017; Holmquist et al., 2018). The saltmarshes of the conterminous United States store 750 Mt OC (45.5 kg C m-2) (Holmquist et al., 2018) while Australian saltmarsh habitats are estimated to store 212 Mt (16.54 kg C m-2) (Macreadie et al., 2017). Both the United States (17,234 km2) and Australian (13,765 km2) saltmarsh habitats occupy areas significantly larger than the GB systems (McOwen et al., 2017), which results in much higher OC stocks (Table 4). Additionally, both these estimates are to a depth of 1 m. Unlike GB marshes (Figure 3), the saltmarsh soils of the United States and Australia frequently extend to or beyond 1 m (Dittman et al., 2016; Pace et al., 2021). When area normalized OC values are compared, the GB marshes store on average 11.55 ± 1.56 kg C m-2 which is comparable to Australian systems that store between 9.13 and 18.83 kg C m-2 (Macreadie et al., 2017). The saltmarshes of the United States store on average 45.5 kg C m-2 (Holmquist et al., 2018), far exceeding that average quantity observed in GB saltmarshes.
4.5 Implications for the management of saltmarsh OC
Globally, saltmarshes are threatened by historical losses, increased anthropogenic disturbance, and a rapidly changing climate (Pendleton et al., 2012; Barbier, 2013; Campbell et al., 2022). Quantifying the OC stored in a nation’s saltmarsh habitat is a foundational step towards the development of nation-specific climate policy and management interventions to protect and preserve these at-risk costal ecosystems. For example, the third UK Climate Change Risk Assessment (CCRA3) states it is crucial to protect our natural C stores from climate and anthropogenic related threats in order for the UK to meet net zero commitments (Betts et al., 2021). To achieve this ambition, the CCRA3 underlines the urgent requirement for a baseline assessment of the total C stocks in coastal habitats to quantify the potential impact on climate from habitat loss and to assess the success of future management interventions (i.e., OC gains or losses) (Betts et al., 2021). The UK Blue Carbon Evidence Partnership (UKBCEP) echoes these points, asserting that a stronger evidence base including C stock assessments will enable more accurate Greenhouse Gas emissions reporting (GHG) and accounting of the UK’s natural capital (UKBCEP, 2023).
This study achieves the ambition of the CCRA3 and the UKBCEP and provides a baseline assessment of saltmarsh OC stocks for UK saltmarshes. From this assessment, we can identify hotspots for saltmarsh OC storage and quantify the potential climate risks from disturbance of the ecosystem, thereby allowing the prioritization of management interventions to protect and preserve these natural C stores.
5 Conclusion
We estimate that saltmarshes in Great Britain store 5.204 ± 0.647 Mt of organic carbon. This is the first full assessment of OC stored within these habitats and includes estimates of above and belowground biomass OC stocks alongside the OC stored within the full depth of saltmarsh soil. As such, it is one of the first national studies of its kind. The saltmarsh soils store on average 11.55 ± 1.56 kg C m-2 which represents 93% of the OC held with GB saltmarshes. Across 26 surveyed saltmarshes, storage of OC varies significantly from 2.24 kg C m-2 in the clay rich fluvial systems of the southeast of England to a maximum of 40.51 kg C m-2 in the marshes draining the OC-rich peatlands in the north of Scotland. The variability in OC storage is potentially driven by a range of interlinked factors including local geomorphology, OC source, sediment type (mud vs sand), sediment supply and relative sea-level history.
By considering the variability of soil profiles across the GB saltmarshes, our study has allowed first-order reporting of the OC stored in the saltmarsh soil (4.863 ± 0.645 Mt OC) and the first full OC stock down to 1 m depth (9.774 ± 1.006 Mt OC) that includes sediments associated with the pre-saltmarsh environment (i.e., intertidal flats). The contrast in OC stocks highlights the need to understand the temporal evolution (stratigraphy) of the marsh through time (differentiating between marsh and non-marsh habitats with depth), to avoid the possibility of under or overestimating the saltmarsh soil OC stocks by arbitrarily including OC down to a depth of 1 m. In the case of GB saltmarshes, this would result in an overestimation of 49.8%.
The findings of this study affirms that saltmarsh ecosystems represent the largest intertidal blue carbon resource in GB, and are a significant unaccounted-for component of the UK’s natural capital. This new understanding of saltmarsh OC provides the foundation for, (i) further research into the mechanisms that govern the accumulation and burial of OC in GB saltmarshes, and (ii) the development and implementation of UK-specific policy, including evidence to support the inclusion of saltmarsh in the GHG reporting as well as highlighting the priority for new management interventions, to protect and preserve these at-risk natural carbon stores.
Data availability statement
The datasets presented in this study can be found in online repositories. The names of the repository/repositories and accession number(s) can be found below: https://catalogue.ceh.ac.uk/documents/d301c5f5-77f5-41ba-934e-a80e1293d4cd https://catalogue.ceh.ac.uk/documents/d61b6033-be45-4682-b4dc-a2f95feefa7d https://catalogue.ceh.ac.uk/documents/f71c9f3e-0ae1-4318-a3ea-1dd30b7af3be https://catalogue.ceh.ac.uk/documents/032627e0-5780-4601-b9b3-e684403cee70 https://catalogue.ceh.ac.uk/documents/7815291a-ee3e-49a7-8ef1-e8baa81f4964 https://data.marine.gov.scot/dataset/physical-and-geochemical-properties-scottish-saltmarsh-soils.
Author contributions
The first draft of the manuscript was jointly developed by CS with assistance from all authors. All authors undertook the fieldwork to collect the samples and survey the saltmarsh. CS undertook the laboratory analysis with the assistance of LCM. CS carried out the calculations to estimate the soil OC stock with the support of the other authors. All authors contributed to the manuscript revision and approved the submitted version.
Funding
The author(s) declare financial support was received for the research, authorship, and/or publication of this article. This research was finically supported by the Natural Environment Research Council funded Carbon Storage in Intertidal Environments (C-SIDE) project (grant NE/R010846/1) with additional support from the Scottish Blue Forum.
Acknowledgments
We would like to extend thanks to Glenn Havelock, Bradley Foster, Robert Mills and Fiona Hibbert from the University of York, Simone Riegel, Heather Austin and Will Hiles from the University of St Andrews, Luis Rees-Hughes from the University of Leeds, Subhasree Mohantym and Joseph Apted from the Bangor University and Alan Radbourne from UK CEH for assistance in the field. Further we would like to thank members of NatureScot, Natural Resources Wales, and Natural England for assisting in gaining the required permissions to access and sample saltmarshes around the country. We would like to acknowledge friend Richard Payne who was part of the original C-SIDE team. Richard sadly passed away in May 2019. The expertise in carbon dynamics he brought to the project was a big inspiration. Finally, we would like to thank the editor and reviewers for providing helpful comments that have improved the manuscript.
Conflict of interest
The authors declare that the research was conducted in the absence of any commercial or financial relationships that could be construed as a potential conflict of interest.
Publisher’s note
All claims expressed in this article are solely those of the authors and do not necessarily represent those of their affiliated organizations, or those of the publisher, the editors and the reviewers. Any product that may be evaluated in this article, or claim that may be made by its manufacturer, is not guaranteed or endorsed by the publisher.
Supplementary material
The Supplementary Material for this article can be found online at: https://www.frontiersin.org/articles/10.3389/fmars.2023.1229486/full#supplementary-material
References
ABP Marine Environmental Research (2003). Estuaries Database 2003, A spatio-temporal GIS database of environmental data for 6 UK estuaries. CD (Including digital user manual).
ABPmer (2020) Estimating the carbon sink potential of the Welsh marine environment, Natural Resource Wales commissioned report. Available at: https://cdn.naturalresources.wales/media/692035/nrw-evidence-report-428_blue-carbon_v11-002.pdf.
Adam P. (1978). Geographical variation in British saltmarsh vegetation. J. Ecol. 66 (2), 339–366. doi: 10.2307/2259141
Appleby P. G., Oldfield F. (1978). The calculation of lead-210 dates assuming a constant rate of supply of unsupported 210Pb to the sediment. Catena 5 (1), 1–8. doi: 10.1016/S0341-8162(78)80002-2
Austin W., Smeaton C., Riegel S., Ruranska P., Miller L. (2021). Blue carbon stock in Scottish saltmarsh soils. Scottish Mar. Freshw. Sci. 12. doi: 10.7489/12372-1
Barbier E. B. (2013). Valuing ecosystem services for coastal wetland protection and restoration: Progress and challenges. Resources 2 (3), 213–230. doi: 10.3390/resources2030213
Barlow N. L., Long A. J., Saher M. H., Gehrels W. R., Garnett M. H., Scaife R. G. (2014). Salt-marsh reconstructions of relative sea-level change in the North Atlantic during the last 2000 years. Quaternary Sci. Rev. 99, 1–16. doi: 10.1016/j.quascirev.2014.06.008
Beaumont N. J., Jones L., Garbutt A., Hansom J. D., Toberman M. (2014). The value of carbon sequestration and storage in coastal habitats. Estuarine Coast. Shelf Sci. 137, 32–40. doi: 10.1016/j.ecss.2013.11.022
Betts R. A., Haward A. B., Pearson K. V. (2021). The Third UK Climate Change Risk Assessment Technical Report (London: Prepared for the Climate Change Committee).
Bradley S. L., Ely J. C., Clark C. D., Edwards R. J., Shennan I. (2023). Reconstruction of the palaeo-sea level of Britain and Ireland arising from empirical constraints of ice extent: implications for regional sea level forecasts and North American ice sheet volume. J. Quaternary Sci. 38 (6) 791-805. doi: 10.1002/jqs.3523
Bradley R. I., Milne R., Bell J., Lilly A., Jordan C., Higgins A. (2005). A soil carbon and land use database for the United Kingdom. Soil Use Manage. 21 (4), 363–369. doi: 10.1079/SUM2005351
Burd F. (1989). Saltmarsh survey of Great Britain: an inventory of British Saltmarshes (No. 17). Nature conservatory council, research and survey in nature conservation no. 42. (Peterborough: Nature Conservancy Council).
Burden A., Garbutt A., Evans C. D. (2019). Effect of restoration on saltmarsh carbon accumulation in Eastern England. Biol. Lett. (Peterborough: Nature Conservancy Council) 15 (1), 20180773. doi: 10.1098/rsbl.2018.0773
Burke S. A., Manahan J., Eichelmann E., Cott G. M. (2022). Dublin’s saltmarshes contain climate-relevant carbon pools. Front. Mar. Sci. 9. doi: 10.3389/fmars.2022.976457
Campbell A. D., Fatoyinbo L., Goldberg L., Lagomasino D. (2022). Global hotspots of salt marsh change and carbon emissions. Nature 612, 701–706. doi: 10.1038/s41586-022-05355-z
Carrasco-Barea L., Verdaguer D., Gispert M., Font J., Compte J., Llorens L. (2023). Carbon stocks in vegetation and soil and their relationship with plant community traits in a mediterranean non-tidal salt marsh. Estuaries Coasts 46, 376–387. doi: 10.1007/s12237-022-01155-w
Chmura G. L., Anisfeld S. C., Cahoon D. R., Lynch J. C. (2003). Global carbon sequestration in tidal, saline wetland soils. Global biogeochem. cycles 17 (4), 1111. doi: 10.1029/2002GB001917
Dadey K. A., Janecek T., Klaus A. (1992). Dry-bulk density: its use and determination. Proc. Ocean Drill. Program Sci. Results 126, 551–554. doi: 10.2973/odp.proc.sr.126.157.1992
DIN 19539 (2015). Investigation of solids temperature dependent differentiation of total carbon (TOC400, ROC, TIC900).
Dittman S., Bestland E., Davies E., Stirling E. (2016). Carbon burial and sediment accumulation rates in coastal saltmarsh sediments on Adelaide’s northern shores. Rep. Adelaide Mount Lofty Ranges Natural Resour. Manage. board.
Driscoll W. C. (1996). Robustness of the ANOVA and Tukey-Kramer statistical tests. Comput. Ind. Eng. 31 (1-2), 265–268. doi: 10.1016/0360-8352(96)00127-1
Duarte C. M., Losada I. J., Hendriks I. E., Mazarrasa I., Marbà N. (2013). The role of coastal plant communities for climate change mitigation and adaptation. Nat. Climate Change 3 (11), 961–968. doi: 10.1038/nclimate1970
Duarte C. M., Middelburg J. J., Caraco N. (2005). Major role of marine vegetation on the oceanic carbon cycle. Biogeosciences 2 (1), 1–8. doi: 10.5194/bg-2-1-2005
Environment Agency (2023) Saltmarsh extent and zonation. Available at: https://data.gov.uk/dataset/0e9982d3-1fef-47de-9af0-4b1398330d88/saltmarsh-extent-zonation#licence-info.
Ford H., Garbutt A., Duggan-Edwards M., Harvey R., Ladd C., Skov M. W. (2019). Large-scale predictions of salt-marsh carbon stock based on simple observations of plant community and soil type. Biogeosciences 16 (2), 425–436. doi: 10.5194/bg-16-425-2019
Ford H., Garbutt A., Jones L., Jones D. L. (2012). Methane, carbon dioxide and nitrous oxide fluxes from a temperate salt marsh: Grazing management does not alter Global Warming Potential. Estuarine Coast. Shelf Sci. 113, 182–191. doi: 10.1016/j.ecss.2012.08.002
Ford H., Garbutt A., Skov M. (2015). Coastal Biodiversity and Ecosystem Service Sustainability (CBESS) dry weight root biomass from three soil depths on salt marsh sites at Morecambe Bay and Essex. NERC Environ. Inf. Data Centre. doi: 10.5285/a84622db-842d-40d2-aad8-e3f85bd306c9
Ford H., Garbutt A., Skov M. (2016). Coastal Biodiversity and Ecosystem Service Sustainability (CBESS) standing crop biomass on salt marsh sites at Morecambe Bay and Essex. NERC Environ. Inf. Data Centre. doi: 10.5285/87114da4-3189-471f-9832-00b3e759232f
Gorham C., Lavery P., Kelleway J. J., Salinas C., Serrano O. (2021). Soil carbon stocks vary across geomorphic settings in Australian temperate tidal marsh ecosystems. Ecosystems 24 (2), 319–334. doi: 10.1007/s10021-020-00520-9
Graversen A. E. L., Banta G. T., Masque P., Krause-Jensen D. (2022). Carbon sequestration is not inhibited by livestock grazing in Danish salt marshes. Limnol. Oceanogr. 67, S19–S35. doi: 10.1002/lno.12011
Guo L. B., Gifford R. M. (2002). Soil carbon stocks and land use change: a meta analysis. Global Change Biol. 8 (4), 345–360. doi: 10.1046/j.1354-1013.2002.00486.x
Hammond M. E. R., Cooper A. (2002). “Spartina anglica eradication and inter-tidal recovery in Northern Ireland estuaries,” in Turning the Tide: The Eradication of Invasive Species Proceedings of the International Conference On Eradication of Island Invasives. Eds. Veitch C. R., Clout M. N. (IUCN SSC Invasive Species Specialist Group), 124–131.
Harris D., Horwáth W. R., Van Kessel C. (2001). Acid fumigation of soils to remove carbonates prior to total organic carbon or carbon-13 isotopic analysis. Soil Sci. Soc. America J. 65 (6), 1853–1856. doi: 10.2136/sssaj2001.1853
Hartigan J. A., Wong M. A. (1979). Algorithm AS 136: A K-means clustering algorithm. Applied Statistics. R. Stat. Soc. 28 (1), 100–108. doi: 10.2307/2346830
Harvey R. J., Garbutt A., Hawkins S. J., Skov M. W. (2019). No detectable broad-scale effect of livestock grazing on soil blue-carbon stock in salt marshes. Front. Ecol. Evol. 7. doi: 10.3389/fevo.2019.00151
Haynes T. A. (2016). Scottish Saltmarsh survey national report. Scottish Natural heritage commissioned Rep., 786.
Hemminga M. A., Huiskes A. H. L., Steegstra M., Van Soelen J. (1996). Assessment of carbon allocation and biomass production in a natural stand of the salt marsh plant Spartina anglica using 13C. Mar. Ecol. Prog. Ser. 130, 169–178. doi: 10.3354/meps130169
Hollis D., McCarthy M., Kendon M., Legg T., Simpson I. (2019). HadUK-Grid—A new UK dataset of gridded climate observations. Geosci. Data J. 6 (2), 151–159. doi: 10.1002/gdj3.78
Holmquist J. R., Windham-Myers L., Bliss N., Crooks S., Morris J. T., Megonigal J. P., et al. (2018). Accuracy and precision of tidal wetland soil carbon mapping in the conterminous United States. Sci. Rep. 8 (1), 9478. doi: 10.1038/s41598-018-26948-7
Howard J., Hoyt S., Isensee K., Telszewski M., Pidgeon E. (2014). Coastal blue carbon: methods for assessing carbon stocks and emissions factors in mangroves, tidal salt marshes, and seagrasses (International Union for Conservation of Nature). Available at: https://www.cifor.org/knowledge/publication/5095/.
Joint Nature Conservation Committee (2013) European Community Directive on the Conservation of Natural Habitats and of Wild Fauna and Flora (92/43/EEC).” Third Report by the United Kingdom under Article 17 on the implementation of the Directive from January 2007 to December 2012. Available at: www.efaidnbmnnnibpcajpcglclefindmkaj/https://jncc.gov.uk/jncc-assets/Art17/H1330-NI-Habitats-Directive-Art17-2019.pdf.
Kaufman L., Rousseeuw P. J. (1990). Finding groups in data: an introduction to cluster analysis (New Jersey, USA: John Wiley & Sons).
Kelleway J. J., Saintilan N., Macreadie P. I., Ralph P. J. (2016). Sedimentary factors are key predictors of carbon storage in SE Australian saltmarshes. Ecosystems 19, 865–880. doi: 10.1007/s10021-016-9972-3
Kennedy H., Alongi D. M., Karim A., Chen G., Chmura G. L., Crooks S., et al. (2013). “Chapter 4: coastal wetlands,” in (2013) Supplement to the 2006 IPCC Guidelines for National Greenhouse Gas Inventories. Eds. Hiraishi T., Krug T., Tanabe K., Srivastava N., Baasansuren J., Fukuda M., Troxler T. G. (Hayama: Wetlands. IPCC), 154–208. Available at: https://www.ipcc.ch/site/assets/uploads/2018/03/Wetlands_Supplement_Entire_Report.pdf.
Ladd C. J. (2021). Review on processes and management of saltmarshes across Great Britain. Proc. Geologists’ Assoc. 132 (3), 269–283. doi: 10.1016/j.pgeola.2021.02.005
Ladd C. J., Duggan-Edwards M. F., Bouma T. J., Pages J. F., Skov M. W. (2019). Sediment supply explains long-term and large-scale patterns in salt marsh lateral expansion and erosion. Geophys. Res. Lett. 46 (20), pp.11178–11187. doi: 10.1029/2019GL083315
Ladd C. J., Smeaton C., Skov M. W., Austin W. E. (2022). Best practice for upscaling soil organic carbon stocks in salt marshes. Geoderma 428, 116188. doi: 10.1016/j.geoderma.2022.116188
Lilly A., Baggaley N., Donnelly D. (2012). Map of soil organic carbon in topsoils of Scotland. Map prepared for EU project GS-SOIL-Assessment and strategic development of INSPIRE compliant Geodata-Services for European Soil Data. 318004, ECP-2008-GEO. https://soils.environment.gov.scot/maps/thematic-maps/map-of-topsoil-organic-carbon-concentration/
Long A. J., Barlow N. L., Dawson S., Hill J., Innes J. B., Kelham C., et al. (2016). Lateglacial and Holocene relative sea-level changes and first evidence for the Storegga tsunami in Sutherland, Scotland. J. Quaternary Sci. 31 (3), pp.239–pp.255. doi: 10.1002/jqs.2862
Long A. J., Barlow N. L. M., Gehrels W. R., Saher M. H., Woodworth P. L., Scaife R. G., et al. (2014). Contrasting records of sea-level change in the eastern and western North Atlantic during the last 300 years. Earth Planet. Sci. Lett. 388, 110–122. doi: 10.1016/j.epsl.2013.11.012
Luisetti T., Turner R. K., Andrews J. E., Jickells T. D., Kröger S., Diesing M., et al. (2019). Quantifying and valuing carbon flows and stores in coastal and shelf ecosystems in the UK. Ecosys. Serv. 35, pp.67–pp.76. doi: 10.1016/j.ecoser.2018.10.013
Lunn D., Spiegelhalter D., Thomas A., Best N. (2009). The BUGS project: Evolution, critique and future directions. Stat Med. 28 (25), 3049–3067. doi: 10.1002/sim.3680
Macreadie P. I., Ollivier Q. R., Kelleway J. J., Serrano O., Carnell P. E., Ewers Lewis C. J., et al. (2017). Carbon sequestration by Australian tidal marshes. Sci. Rep. 7 (1), 44071. doi: 10.1038/srep44071
Marley A. R., Smeaton C., Austin W. E. (2019). An assessment of the tea bag index method as a proxy for organic matter decomposition in intertidal environments. J. Geophys. Res.: Biogeosci. 124 (10), 2991–3004. doi: 10.1029/2018JG004957
May V. J., Hansom J. D. (2003). Coastal geomorphology of Great Britain. geological conservation review series no. 28 (Peterborough: Joint Nature Conservation Committee).
McLeod E., Chmura G. L., Bouillon S., Salm R., Björk M., Duarte C. M., et al. (2011). A blueprint for blue carbon: toward an improved understanding of the role of vegetated coastal habitats in sequestering CO2. Front. Ecol. Environ. 9 (10), 552–560. doi: 10.1890/110004
McOwen C. J., Weatherdon L. V., Van Bochove J. W., Sullivan E., Blyth S., Zockler C., et al. (2017). A global map of saltmarshes. Biodiversity Data J. 5), e11764. doi: 10.3897/BDJ.5.e11764
Miller L. C., Smeaton C., Garbutt A., Austin W. E. N. (2022b). Physical and biogeochemical measurements of belowground biomass and carbon content from Scottish salt marshe. NERC Environ. Inf. Data Centre. doi: 10.5285/032627e0-5780-4601-b9b3-e684403cee70
Miller L. C., Smeaton C., Yang H., Austin W. E. N. (2022a). Physical and geochemical properties of Scottish saltmarsh soils. Mar. Scotland Data. doi: 10.7489/12422-1
Miller L. C., Smeaton C., Yang H., Austin W. E. (2023). Carbon accumulation and storage across contrasting saltmarshes of Scotland. Estuarine Coast. Shelf Sci. 282, 108223. doi: 10.1016/j.ecss.2023.108223
Mueller P., Ladiges N., Jack A., Schmiedl G., Kutzbach L., Jensen K., et al. (2019). Assessing the long-term carbon-sequestration potential of the semi-natural salt marshes in the European Wadden Sea. Ecosphere 10 (1), e02556. doi: 10.1002/ecs2.2556
Natali C., Bianchini G., Carlino P. (2020). Thermal stability of soil carbon pools: Inferences on soil nature and evolution. Thermochimica Acta 683, 178478. doi: 10.1016/j.tca.2019.178478
Natural England (2022) National seagrass layer (England) – current extent. Available at: https://naturalengland-defra.opendata.arcgis.com/maps/e009f2adbc9b4028a34842b133c6636b/about.
Natural Resources Wales (2016). Available at: https://lle.gov.wales/catalogue/item/SaltmarshExtents/?lang=en.
Nellemann C., Corcoran E. (2009). Blue carbon: the role of healthy oceans in binding carbon: a rapid response assessment. UNEP/Earthprint.
Nieuwenhuize J., Maas Y. E., Middelburg J. J. (1994). Rapid analysis of organic carbon and nitrogen in particulate materials. Mar. Chem. 45 (3), 217–224. doi: 10.1016/0304-4203(94)90005-1
Ouyang X., Lee S. Y. (2014). Updated estimates of carbon accumulation rates in coastal marsh sediments. Biogeosciences 11 (18), 5057–5071. doi: 10.5194/bg-11-5057-2014
Pace G., Peteet D., Dunton M., Wang-Mondaca C., Ismail S., Supino J., et al. (2021). Importance of quantifying the full-depth carbon reservoir of Jamaica Bay salt Marshes, New York. City Environ. Interact. 12, 100073. doi: 10.1016/j.cacint.2021.100073
Pan Y., Birdsey R. A., Fang J., Houghton R., Kauppi P. E., Kurz W. A., et al. (2011). and persistent carbon sink in the world’s forests. Science 333 (6045), 988–993. doi: 10.1126/science.1201609
Pendleton L., Donato D. C., Murray B. C., Crooks S., Jenkins W. A., Sifleet S., et al. (2012). Estimating global “blue carbon” emissions from conversion and degradation of vegetated coastal ecosystems. PloS One 7 (9), e43542. doi: 10.1371/journal.pone.0043542
Penk M. R., Perrin P. M. (2022). Variability of plant and surface soil carbon concentration among saltmarsh habitats in Ireland. Estuaries Coasts 45 (6), 1631–1645. doi: 10.1007/s12237-021-01042-w
Penk M. R., Perrin P. M., Waldren S. (2020). Above-to belowground vegetation biomass ratio in temperate North-East Atlantic saltmarshes increases strongly with soil nitrogen gradient. Ecosystems 23 (3), 648–661. doi: 10.1007/s10021-019-00428-z
Porter J., Austin W., Burrows M., Clarke D., Davies G., Kamenos N., et al. (2020). Blue carbon audit of Orkney waters. Scottish Mar. Freshw. Sci. Rep. 11. doi: 10.7489/12262-1
Potouroglou M., Whitlock D., Milatovic L., MacKinnon G., Kennedy H., Diele K., et al. (2021). The sediment carbon stocks of intertidal seagrass meadows in Scotland. Estuarine Coast. Shelf Sci. 258, 107442. doi: 10.1016/j.ecss.2021.107442
Pritchard D. W. (1952). Estuarine hydrography. Adv. geophys. 1, 243–280. doi: 10.1016/S0065-2687(08)60208-3
Pye K., French P. W. (1993). “Cambridge Environmental research consultants Ltd.(United kingdom); ministry of agriculture, fisheries and food, London (United kingdom),” in Erosion and accretion processes on British saltmarshes: Volume four-modelling of saltmarsh and mudflat processes (Cambridge Environmental Research Consultants).
Qi X., Chmura G. L. (2023). Invasive Spartina alterniflora marshes in China: a blue carbon sink at the expense of other ecosystem services. Front. Ecol. Environ. 21 (4), 182–190. doi: 10.1002/fee.2611
Rodwell J. S. (2000). British Plant communities, maritime communities and vegetation of open habitats Vol. 5 (Cambridge, UK: Cambridge University Press).
Rogers K., Kelleway J. J., Saintilan N., Megonigal J. P., Adams J. B., Holmquist J. R., et al. (2019). Wetland carbon storage controlled by millennial-scale variation in relative sea-level rise. Nature 567 (7746), 91–95. doi: 10.1038/s41586-019-0951-7
Santini N. S., Lovelock C. E., Hua Q., Zawadzki A., Mazumder D., Mercer T. R., et al. (2019). Natural and regenerated saltmarshes exhibit similar soil and belowground organic carbon stocks, root production and soil respiration. Ecosystems 22, 1803–1822. doi: 10.1007/s10021-019-00373-x
Shennan I., Bradley S. L., Edwards R. (2018). Relative sea-level changes and crustal movements in Britain and Ireland since the Last Glacial Maximum. Quaternary Sci. Rev. 188, 143–159. doi: 10.1016/j.quascirev.2018.03.031
Silva T., Biermann L., Rees J., Hartley J. (2016). CEFAS Report 2016. Suspended Sediment Climatologies around the UK. Report for the UK Department for Business, Energy & Industrial Strategy offshore energy Strategic Environmental Assessment programme Cefas, Lowestoft, UK. doi: 10.14466/CefasDataHub.31
Smeaton C., Barlow N. L., Austin W. E. (2020). Coring and compaction: Best practice in blue carbon stock and burial estimations. Geoderma 364, 114180. doi: 10.1016/j.geoderma.2020.114180
Smeaton C., Burden A., Ruranska P., Ladd C. J., Garbutt A., Jones L., et al. (2022). Using citizen science to estimate surficial soil Blue Carbon stocks in Great British saltmarshes. Front. Mar. Sci. 9, 959459. doi: 10.3389/fmars.2022.959459
Smeaton C., Hunt C. A., Turrell W. R., Austin W. E. (2021). Marine sedimentary carbon stocks of the United Kingdom’s exclusive economic zone. Front. Earth Sci. 50. doi: 10.3389/feart.2021.593324
Smeaton C., Ladd C.J., Havelock G.M., Miller L.C., Garrett E., McMahon L., et al. (2023). Soil profile descriptions from narrow diameter cores in UK saltmarshes collected between 2018 and 2021. NERC EDS Environmental Information Data Centre. doi: 10.5285/55760544-b0a6-4845-a2e0-1cf533996c64
Teasdale P. A., Collins P. E., Firth C. R., Cundy A. B. (2011). Recent estuarine sedimentation rates from shallow inter-tidal environments in western Scotland: implications for future sea-level trends and coastal wetland development. Quaternary Sci. Rev. 30 (1-2), 109–129. doi: 10.1016/j.quascirev.2010.08.002
Temmink R. J., Lamers L. P., Angelini C., Bouma T. J., Fritz C., van de Koppel J., et al. (2022). Recovering wetland biogeomorphic feedbacks to restore the world’s biotic carbon hotspots. Science 376 (6593), eabn1479. doi: 10.1126/science.abn1479
Troels-Smith J. (1955). Characterization of unconsolidated sediments (Række Denamark: Reitzels Forlag). 3 (10), 1–73.
UKBCEP (2023). UK Blue Carbon Evidence Partnership Evidence Needs Statement (Lowestoft, UK: United Kingdom Blue Carbon Evidence Partnership). 23pp.
Van de Broek M., Vandendriessche C., Poppelmonde D., Merckx R., Temmerman S., Govers G. (2018). Long-term organic carbon sequestration in tidal marsh sediments is dominated by old-aged allochthonous inputs in a macrotidal estuary. Global Change Biol. 24 (6), 2498–2512. doi: 10.1111/gcb.14089
Vaughn D. R., Bianchi T. S., Shields M. R., Kenney W. F., Osborne T. Z. (2021). Blue carbon soil stock development and estimates within northern Florida wetlands. Front. Earth Sci. 9, 552721. doi: 10.3389/feart.2021.552721
Verardo D. J., Froelich P. N., McIntyre A. (1990). Determination of organic carbon and nitrogen in marine sediments using the Carlo Erba NA-1500 Analyzer. Deep Sea Res. Part A. Oceanogr. Res. Papers 37 (1), 157–165. doi: 10.1016/0198-0149(90)90034-S
Keywords: coastal, wetlands, soil, vegetation, belowground, storage, United Kingdom, blue carbon
Citation: Smeaton C, Ladd CJT, Miller LC, McMahon L, Garrett E, Barlow NLM, Gehrels WR, Skov MW and Austin WEN (2023) Organic carbon stocks of Great British saltmarshes. Front. Mar. Sci. 10:1229486. doi: 10.3389/fmars.2023.1229486
Received: 26 May 2023; Accepted: 16 November 2023;
Published: 04 December 2023.
Edited by:
Heliana Teixeira, University of Aveiro, PortugalReviewed by:
Anirban Akhand, Hong Kong University of Science and Technology, Hong Kong SAR, ChinaTilmann Harder, University of Bremen, Germany
Copyright © 2023 Smeaton, Ladd, Miller, McMahon, Garrett, Barlow, Gehrels, Skov and Austin. This is an open-access article distributed under the terms of the Creative Commons Attribution License (CC BY). The use, distribution or reproduction in other forums is permitted, provided the original author(s) and the copyright owner(s) are credited and that the original publication in this journal is cited, in accordance with accepted academic practice. No use, distribution or reproduction is permitted which does not comply with these terms.
*Correspondence: Craig Smeaton, cs244@st-andrews.ac.uk