De novo high-accuracy transcriptomes from long-read sequencing reveals a wide variety of novel splice variants in copepodids and adult female salmon lice (Lepeophtheirus salmonis)
 Sine Alise Hartvigsen Hansen1*
  Sigmund Ramberg2
  Nadezhda Lekanova1
  Bjørn Høyheim3
  Tor Einar Horsberg1
  Rune Andreassen2
  Marit Jørgensen Bakke1
- 1Pharmacology unit, Faculty of Veterinary Medicine, Norwegian University of Life Sciences, Ås, Norway
- 2Department of Life Sciences and Health, Faculty of Health Sciences, OsloMet - Oslo Metropolitan University, Oslo, Norway
- 3Medical Genetics Unit, Faculty of Veterinary Medicine, Norwegian University of Life Sciences, Ås, Norway
Former transcriptome studies of the ectoparasitic salmon louse (Lepeophtheirus salmonis) are based on short-read sequencing and in silico predictions, with the disadvantage of inadequately describing splice variants and insufficient differentiation between duplicated genes. In the present study, a de novo full-length transcriptome (TSA accession GKKU00000000) was generated using single-molecule long-read RNA-sequencing (PacBio IsoSeq platform) corrected by short reads (Illumina platform) from the same RNA samples. The two samples, cephalothorax of an adult female and her copepodid offspring, were analyzed separately to facilitate comparison and identification of transcripts unique to each life stage. Each transcript has been supported by two or more full-length non-chimeric reads and at least three short reads, ensuring high-sequence accuracy. A total of 31,092 unique high-accuracy full-length transcripts with an open reading frame > 150 bp, originating from 10,034 unique loci of the salmon louse genome, were identified. More than half of the transcripts are life-stage specific, exclusively present in either the copepodid or adult sample. Approximately one-third of the transcripts were full splice matches with predicted protein coding transcripts presented in NCBI, thus validating these. More than half of the transcripts constituted novel isoforms with at least one new splicing site. We conclude that the full-length transcriptomes represent a versatile reference resource of transcripts. Suitable applications include expression studies, SNP mining, and studies on the biological effects of differences in gene (or isoform) expression between copepodids and adult females. The additional functional annotation of 88% of transcripts allows for identification of gene families of particular interest and for exploration of gene networks and enrichment analysis following expression studies.
1 Introduction
High-throughput sequencing is gaining interest as costs have become significantly reduced and standardized pipelines for analyzing data are becoming more available. A widely used method has been to sequence short RNA fragments and assemble them into predicted transcripts and subsequently a transcriptome by using an already existing genome sequence as reference (Carmona-Antonanzas et al., 2015; Heggland et al., 2020; Borchel et al., 2021). This approach has the disadvantage of inadequately describing expression of splice variants and insufficient differentiation between duplicated genes. Nevertheless, short paired-end sequencing technology is considered favorable to long-read technology for expression analyses due to the much higher number of reads sequenced from each template (Freedman et al., 2020), and this technology also has a superior base call accuracy, which is crucial for correct prediction of protein coding sequences (CDSs). However, to utilize transcript data for research on specific genes or the complete transcriptome in a species, the final transcriptome should consist of experimentally generated high-quality (HQ) full-length (FL) transcripts of all genes and their isoforms. Such an HQ-FL transcriptome is crucial for accurate prediction of all isoforms, their CDSs as well as the untranslated regions (UTRs) that often carry functionally important motifs e.g., target sites for regulation by miRNA (Huntzinger and Izaurralde, 2011).
Long-read sequencing has a potential for unveiling the unknown complexity of transcriptome isoform structures and was chosen as the method of the year by Nature Methods in January 2023 (Marx, 2023). PacBio long-read isoform sequencing allows the sequencing of FL messenger RNA (mRNA) transcripts from single molecules and thus allows the characterization of splice variants and highly similar duplicated genes (Rhoads and Au, 2015; Wenger et al., 2019). This method depends on careful extraction of RNA to retain a high proportion of complete mRNA sequences. Each complementary DNA (cDNA) molecule representing an mRNA transcript is made into circular SMRTbell templates by ligating hairpin adapters at each end of the cDNA. The sequencing is performed by continuously recording the replication process as the circular template is sequenced multiple times. Each pass has an error rate of 11–15%, but since each transcript is read several times, a lower error rate of the circular consensus sequence (CCS) is achieved (Rhoads and Au, 2015). When sequencing mRNA (IsoSeq method), there are usually many reads of a given template providing a total predicted accuracy ≥ 99% for highly accurate long reads (high fidelity, HiFi) CCSs (PacBio, 2022). However, homopolymers still have a high frequency of errors due to method-generated insertion or deletion of bases (Tedersoo et al., 2018; Ramberg et al., 2021), and this leads to a substantially increased frequency of incorrect CDSs as such errors affect the length of open reading frames (ORFs) in the HQ reads (Ramberg et al., 2021).
A hybrid strategy for transcriptome assembly using a combination of long-read sequencing and error correction by short-read sequencing can be used to overcome the shortages of the two methods when applied separately. Furthermore, this hybrid strategy is independent of a reference genome as an error correcting source. This strategy has been successfully applied to the Atlantic salmon (Salmo salar), where the resulting HQ transcriptome revealed a large number of novel isoforms (Ramberg et al., 2021). Similar approaches has also been applied to generate HQ transcriptomes from cardoon, Cynara cardunculus (Puglia et al., 2020) and the endemic woody shrub, Gossypium australe (Feng et al., 2019).
To combat parasites and agricultural pests, research effort is constantly being put into describing biological features to identify possible anti-pest measures and treatment targets. Many of these studies rely on gene sequences and gene expression patterns to describe normal biology and the outcomes of the possible control strategies. The organism representing the major challenge to the Atlantic salmon aquaculture industry is the salmon louse (Lepeophtheirus salmonis, Caligidae). This crustacean arthropod has eight different life stages from hatching to adult (Hamre et al., 2013). The first three life stages are planktonic (nauplii 1 and 2 and copepodid), and the subsequent five stages are on the salmonid host, first as sedentary parasites (chalimus 1 and chalimus 2) and then as free-moving parasites (preadults 1 and 2 and adult). The copepodids and adults represent key life stages each in their own way. The copepodids have the ability to locate and attach to the host. There has been a larger focus on anti-attachment strategies over the last decade, and the interest in the biology and molecular features of the infective copepodid life stage is growing (Heggland et al., 2020). The adult females (AdFs) are important for oogenesis and reproduction. This is also the life stage causing the major damage to the host when they feed on blood, skin, and mucus. This is reflected in the transcriptome, and upregulated expression of genes related to digestion and egg production in the AdF has been reported (Eichner et al., 2008).
A large amount of sequencing data both on the genome and transcriptome level is available as a result of the ongoing research on the salmon louse. The reference genome (GCF_016086655.3) is a chromosome-level assembly. It was recently updated using long-read sequencing of the Pacific salmon louse, an allopatric subspecies of L. salmonis (Joshi et al., 2022). For the Atlantic subspecies of L. salmonis, a contig-level (36,095 scaffolds, N50: 478 Kb) genome assembly was also recently published (Skern-Mauritzen et al., 2021).
Until now, one transcriptome shotgun assembly (TSA) was published in GenBank (HACA00000000.1), hereby referred to as HACA. It is based on a pool of total RNA from samples of all life stages except chalimus 1 and 2 (Carmona-Antonanzas et al., 2015). This transcriptome assembly was created using a contig-level genome. Currently, both the Ensembl (Skern-Mauritzen et al., 2021; Cunningham et al., 2022) and the RefSeq transcriptomes (Joshi et al., 2022) are collections of transcripts solely predicted from short-read RNA datasets aligned against genome assemblies for L. salmonis. The Ensembl transcriptome, also available in LiceBase (licebase.org) (Skern-Mauritzen et al., 2021), has been extensively used as a reference in differential expression analyses (Eichner et al., 2018; Heggland et al., 2020; Borchel et al., 2022). The NCBI RefSeq mRNAs are predicted and based on the newest reference genome UVic_Lsal_1.2 (Joshi et al., 2022). So far, mRNA sequences generated by long-read sequencing technology has not yet been published for L. salmonis.
An HQ transcriptome made from error-corrected, FL single-molecule sequenced mRNA would represent a significantly improved transcriptome resource to the research community. Such HQ-FL mRNA sequences are the most reliable source for CDS information and gene function annotation as the complete CDS is provided within a single sequence. Since transcript sequences are generated by single-molecule sequencing, each FL sequenced isoform will be generated from one allele. Thus, the compiled transcriptome will allow for detection of splice variants of the genes, as well as detection of possible single-nucleotide polymorphisms. Also, as the boundaries of the CDS are reliably defined, sequence data from complete 3′-UTRs carrying sequence motifs important in regulation of gene expression may be investigated (Huntzinger and Izaurralde, 2011). Finally, the FL mRNA sequences may be used as a reference to which short reads from expression studies could be aligned. This would allow for analysis of gene expression differences, not only between well-annotated genes but also between their splice variants.
The HQ full-length de novo transcriptome assembly presented in this paper includes transcripts originating from two important developmental stages: the free-living copepodid stage and the adult female. The aim of this study was to generate a versatile reference resource of transcripts annotated according to their expression in these two developmental stages, including new insights into isoforms and alternative splicing.
2 Materials and methods
2.1 Salmon lice sample materials and RNA extraction
The laboratory strain LsAlta was used for the PacBio and Illumina sequencing. LsAlta was originally collected from a fish farm in northern Norway in 2011 (Helgesen and Horsberg, 2013). The strain is well characterized, and it is sensitive to all delousing agents used in Norway (Helgesen and Horsberg, 2013; Aaen and Horsberg, 2016). The salmon lice rearing was done at the University of Bergen (Norway), according to a previously described method (Hamre et al., 2009). All experimental procedures were performed in accordance with Norwegian Animal Welfare Legislation, and the use of salmon to rear salmon lice was approved by the Norwegian Animal Research Authority (ID 26020).
One pair of eggstrings from a selected female was allowed to hatch and develop for 13 days at 9°C before sampling. The AdF and a pool of her progenies in the copepodid stage (approximately 300 copepodids) were stored separately in RNA later at −80°C. The genital segment of the adult louse was removed prior to RNA extraction to avoid over-representation of genes expressed in the developing eggs and contamination from the spermatophore.
RNA extraction was performed using a combination of Trizol (Carlsbad, United States: Invitrogen™ Cat. No. 15596026) and RNeasy Mini Kit (Germantown, United States: QIAGEN, Cat. No. 74104), including DNase digestion with RNase-Free DNase Set (Germantown, United States: QIAGEN, Cat. No. 79254). The AdF and the copepodids were homogenized in Trizol (1 mL) using Precellys homogenizer (4 × 30 s, 6,000 rpm) with 1 stainless steel bead (5 mm) or 100 µL ceramic beads (1.4 mm), respectively. The lysate was separated by adding chloroform (200 µL) and centrifugation (12,500×g, 15 min, 4°C) before extracting the aqueous phase holding the RNA. One volume of 70% ethanol was added to the samples, and the total RNA was purified using the RNeasy Mini spin columns following manufacturers protocol, including DNase digestion with RNase-free DNase Set (Germantown, United States: QIAGEN, Cat. No. 79254) for genomic DNA removal. The RNA was quantified using Epoch microplate spectrophotometer (Agilent Technologies, Santa Clara, United States) and the quality was assessed using the 2100 Bioanalyzer instrument (Santa Clara, United States: Agilent Technologies) and the Agilent RNA 6000 Nano kit.
2.2 PacBio library preparation and Iso-Seq
The sequencing service was provided by the Norwegian Sequencing Centre (www.sequencing.uio.no), a national technology platform hosted by the University of Oslo and supported by the “Functional Genomics” and “Infrastructure” programs of the Norwegian Research Council and the Southeastern Regional Health Authorities.
Libraries were prepared using Pacific Biosciences (Menlo Park, United States) protocol for Iso-Seq™ Express Template Preparation for Sequel® and Sequel II Systems, one library per sample. The sequencing was performed on a Sequel II instrument, using Sequel II Binding kit 2.0, and Sequencing chemistry v2.0. One SMRT cell was used for each sample. Loading was performed by diffusion (Movie time: 30h, pre-extension time: 2h). CCSs were generated using CCS application on SMRT Link (SMRT Link v10.2.0.133434).
2.3 Illumina library preparation and RNA sequencing
The Illumina sequencing (Illumina Inc., San Diego, United States) and library preparation was performed by Novogene (Cambridge, UK) Company Limited. Prior to library construction, the RNA integrity was analyzed by Agilent 5400 Fragment Analyzer (Santa Clara, United States: Agilent Technologies) and gel electrophoresis. Ribosomal RNA was removed from total RNA using the TruSeq Stranded Total RNA Library Prep Human/Mouse/Rat kit, followed by ethanol precipitation. After fragmentation, the first-strand cDNA was synthesized using random hexamer primers. During the second-strand cDNA synthesis, dUTPs were replaced with dTTPs in the reaction buffer. The directional library was ready after end repair, A-tailing, adapter ligation, size selection, USER enzyme digestion, amplification, and purification. The library was checked with Qubit and real-time PCR for quantification and bioanalyzer for size distribution detection. Quantified libraries were pooled, and the paired-end sequencing (150 base pairs) was performed using the Illumina NovaSeq 6000 platform.
2.4 Pipeline for generation of a non-redundant de novo transcriptome resource made of error-corrected high-quality long reads
An overview of the pipeline used for generation of the de novo transcriptome is presented in Figure 1. The short-read sequences were used for error correction of the long-read sequences. The quality of short-read sequences was crucial for the final nucleotide-level transcriptome quality. A stringent filtering was therefore applied to remove sequences with Phred scores under 30 corresponding to a base call accuracy of 99.9%. The quality filtering and adapter trimming of the Illumina paired sequencing reads were performed using Trim Galore (Krueger, 2022) based on CutAdapt (Martin, 2011) and FastQC (Andrews et al., 2012) with stringency 3.
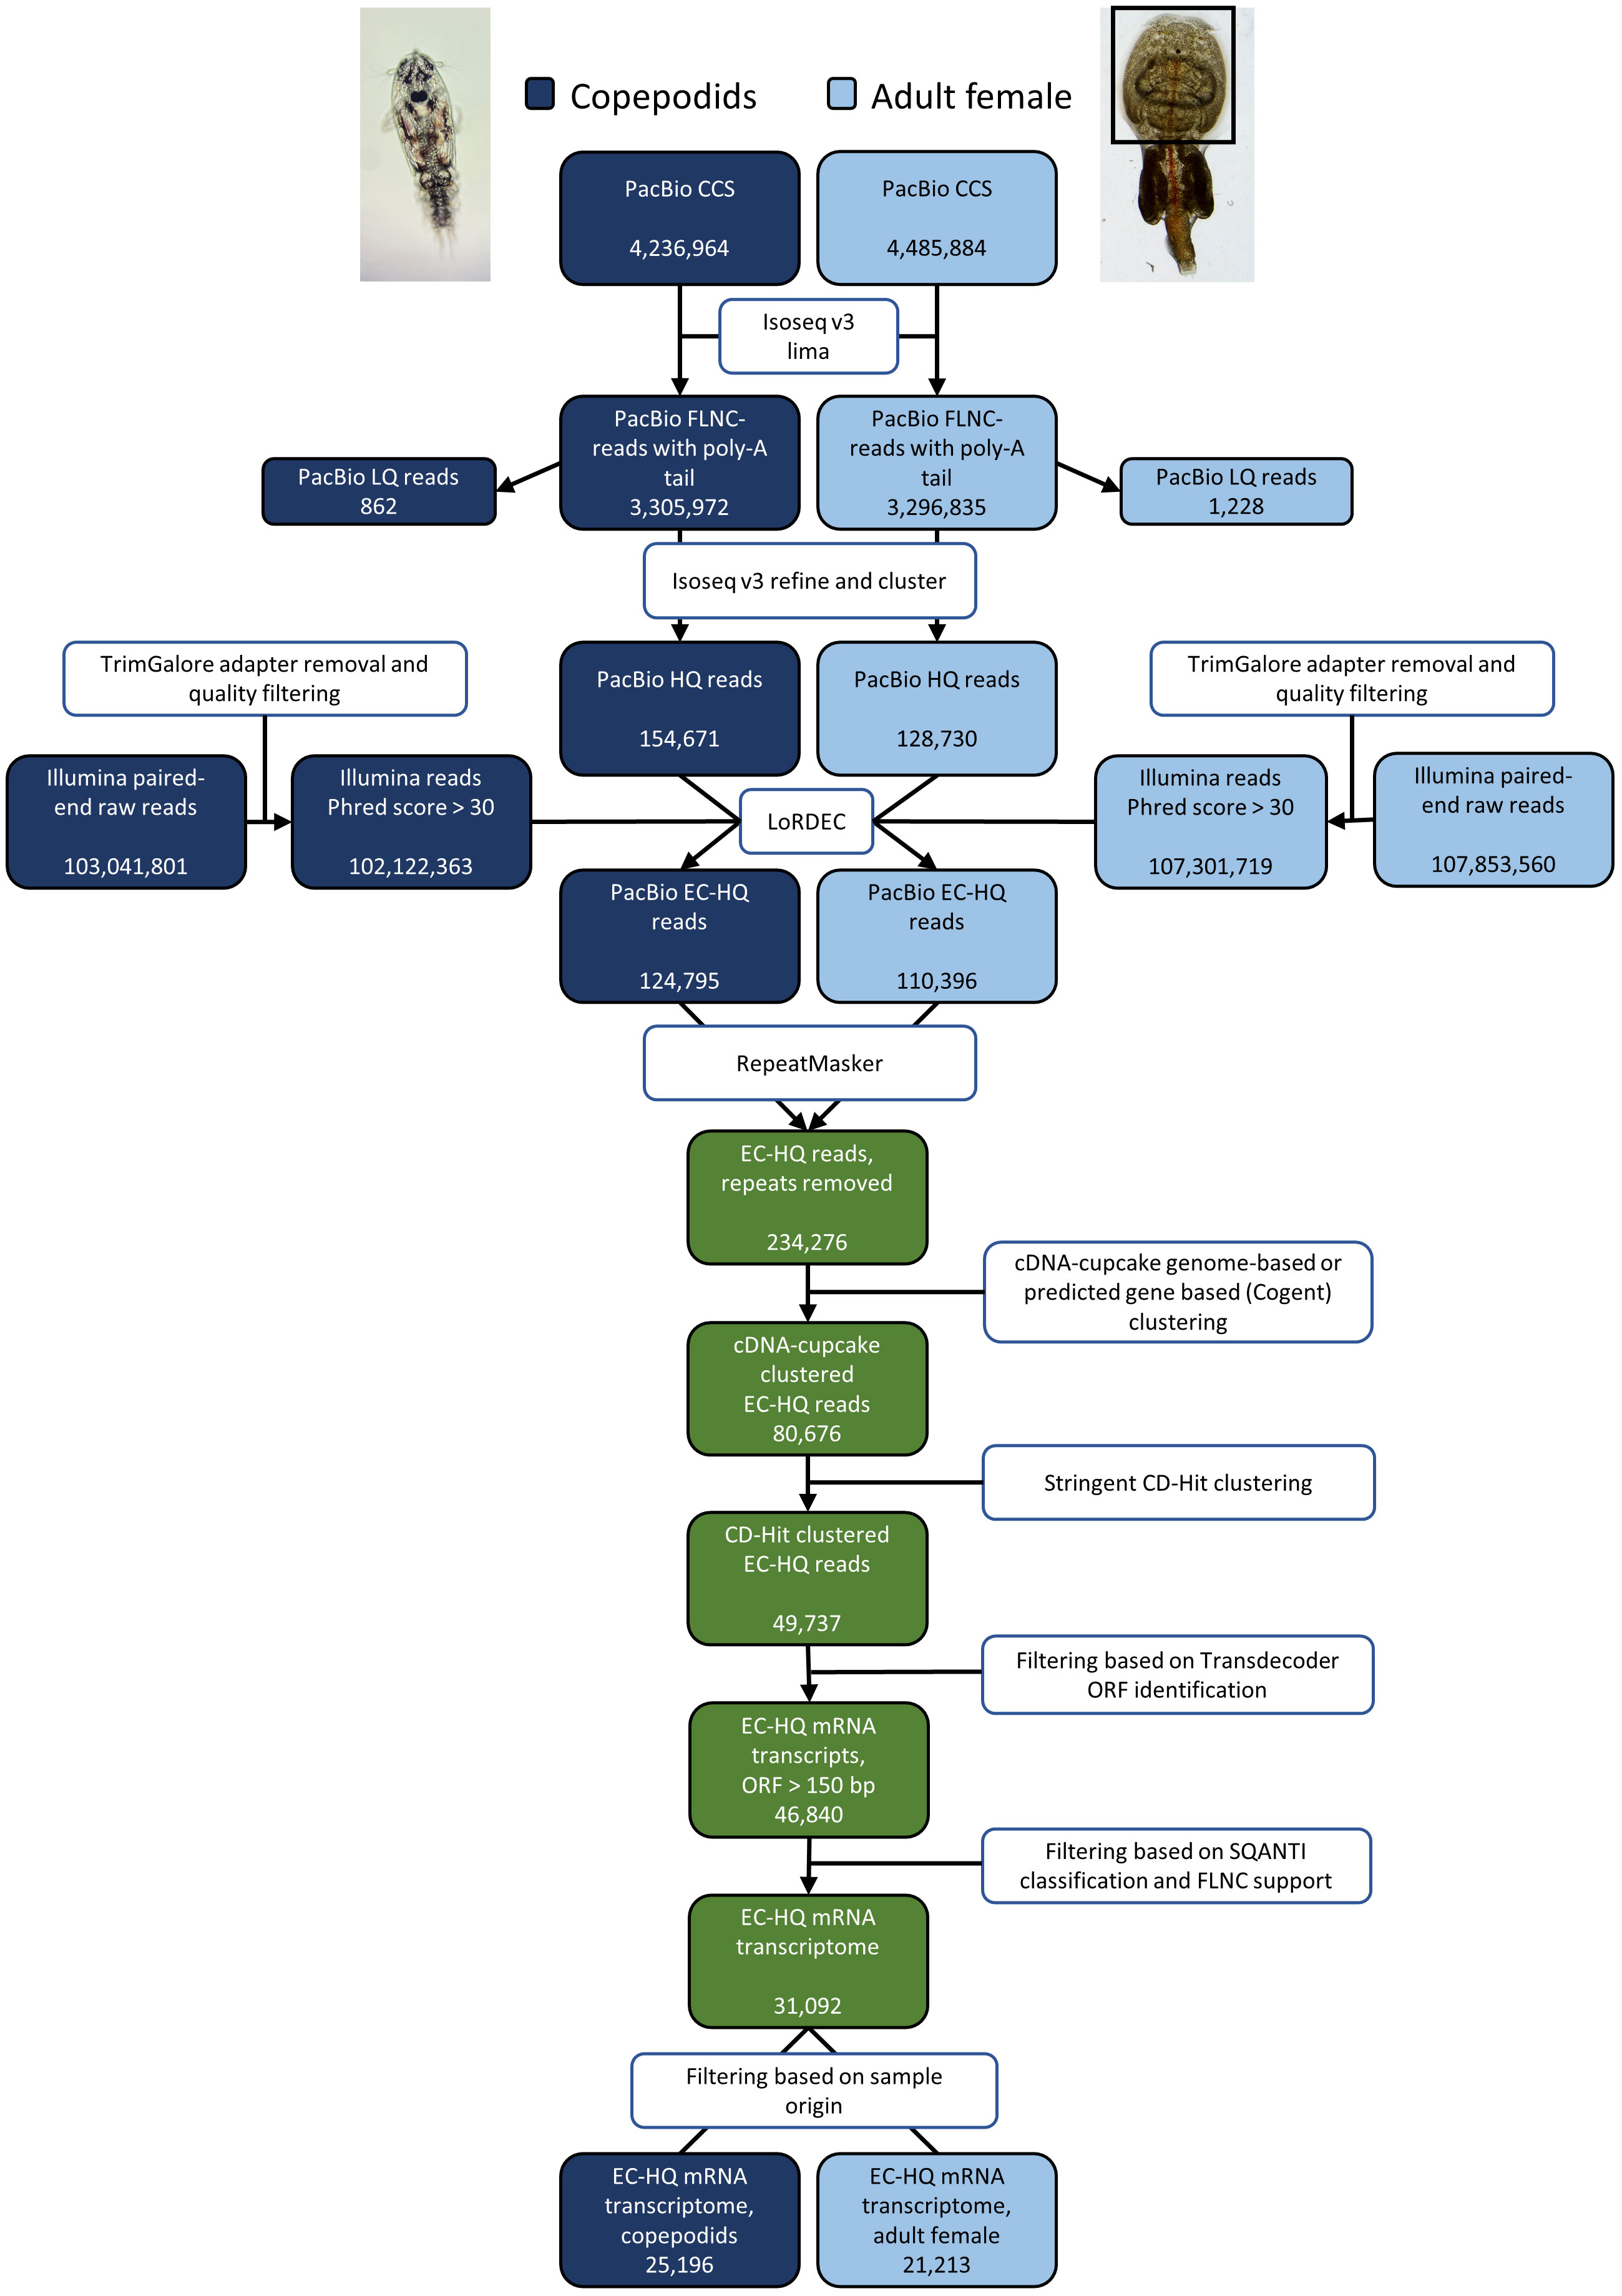
Figure 1 Overview of the process from raw sequencing reads to the final, EC-HQ mRNA transcriptome including number of reads in the output of PacBio and Illumina sequencing and number of sequences obtained in each step of the transcriptome assembly pipeline for the two samples copepodids and adult female.
Long-read HQ sequences were extracted from the CCS reads using the IsoSeq v3 pipeline (PacBio, 2022). This includes transcript orientation (requires poly-A tail), barcode and primer trimming by lima–isoseq with output being FL non-chimeric (FLNC) reads with poly-A tail. Poly-A tail trimming and concatemer removal, clustering and consensus sequence calling was performed using isoseq3 cluster, and final polishing using the isoseq3 polish command. The clustering step ensures that all HQ sequences are supported by two or more FLNC reads. The outputs of this step are fasta and fastq files for HQ sequences with predicted accuracy ≥ 99% and low-quality sequences with predicted accuracy < 99%.
The pipeline for error correction and annotation was applied as previously described by Ramberg et al. (2021) with minor changes. All program parameters were the same as in Ramberg et al. unless otherwise noted. In short, trimmed and filtered paired-end short sequencing reads were applied for hybrid error correction of the long HQ reads generated from the IsoSeq v3 pipeline. This ensured a support of at least three Illumina reads per nucleotide at a given nucleotide position using a k-mer size of 21 nucleotides. Reads that were less than 99% covered by the De Bruijn graph [LoRDEC, Salmela and Rivals (2014)] generated from the Illumina reads were removed. Reads with internal regions not supported by the De Bruijn graph were removed to exclude potential fusion artifacts among the HQ reads. LoRDEC also corrected single-base pair inconsistencies as well as small length inconsistencies in the HQ reads by use of the Illumina sequences. Repetitive sequences including interspersed repeats annotated within the classification Hexanauplia were identified using Repeatmasker version 4.0.9 and removed (Smit et al., 2013; Hubley et al., 2016). Error-corrected HQ (EC-HQ) reads aligning to the same locus of the genome (UVic_Lsal_1.2, GenBank accession GCA_016086655.3) using cDNA-Cupcake were grouped together. Identical reads from same locus that showed the same splice pattern were clustered together keeping the longest sequence as representing this isoform. Reads which did not map well to the L. salmonis genome (UVic_Lsal_1.2) were mapped to the Atlantic salmon genome and removed if mapped to this genome. This was carried out to assure that any sequences resulting from contamination of residual mucus that might have been transferred from the salmon to the adult lice (which is attached to the host salmon) were not included. Remaining EC-HQ sequences not mapping to any of the two genomes were clustered using Cogent (Tseng, 2020). Cogent predicts the transcribed regions of a genome from the FL transcript sequences. In this manner, the sequences that did not align successfully to the genome were grouped together assuming they likely derived from the same locus. All remaining sequences were finally clustered using CD-HIT (Li et al., 2001; Fu et al., 2012) aligning any shorter EC-HQ read to a longer identical isoform (sequence identity > 0.99, alignment length ≥ 99%) if present.
2.5 Classification of structural variants, functional annotation and final filtering
The annotation of transcripts was based on existing annotations from the reference genome annotation using SQANTI3 (Tardaguila et al., 2018), blastp Gene Ontology (GO) annotation and InterProScan that search for functional domains (Gotz et al., 2008; Jones et al., 2014; BioBam, 2019). ORFs were annotated (mitochondrial and nuclear genetic codes separately) using TransDecoder (Haas et al., 2013; Haas, 2015), and only EC-HQ reads with a complete ORF longer than 150 bp were retained. The resulting protein sequences were fed into the OmicsBox software suite (BioBam, 2019), and blastp-fast was used to identify matches that were used for GO annotation using Hexanauplia as the classification filter. The additional identification of functional motifs was performed using InterProScan. The classification of structural variants was collected through SQANTI3 from the genome alignment data. The classification was used for additional verification of EC-HQ data with low FLNC counts from PacBio sequencing. All transcripts in the final transcriptome meet at least one of these criteria:
● Supported by at least five FLNC reads
● Classified as full splice match or novel in catalog by SQANTI and at least two FLNC reads
● Classified as novel not in catalog by SQANTI and contains no non-canonical splice junctions and at least two FLNC reads
EC-HQ reads with low FLNC counts (< 5) and a high-adenine content (>60%) in the genomic sequence directly downstream of the transcript termination site were also removed because these sequences may be a result of oligo (dT) mis-priming during cDNA synthesis.
2.6 Transcriptome comparisons by blast analysis
A blast analysis was applied to compare the current FL transcriptome to existing transcriptome assemblies and collections of L. salmonis mRNA transcripts in the NCBI RefSeq database, predicted cDNA from Ensembl Metazoa (Cunningham et al., 2022) and the HACA transcriptome assembly (Carmona-Antonanzas et al., 2015). The RefSeq mRNA sequences were collected using a filtered search for taxonomy id 72036 (L. salmonis), molecule type mRNA and RefSeq in the NCBI nucleotide archive. Ensembl cDNA sequences were collected from the EnsemblMetazoa FTP site (Cunningham et al., 2022). The error-corrected FL transcriptome assembly was searched using the ENSEMBL, RefSeq, and HACA sequences as query, respectively, to assess the completeness of the transcriptome assembly compared with currently available transcriptome resources. The reverse search was also carried out using the FL transcriptome as query against the ENSEMBL, RefSeq, and HACA sequences. The blastn searches were carried out in the Omicsbox software suite using megablast and a blast expectation value cutoff of 10–15, word size 28, and HSP length cutoff 33.
2.7 Annotation of repeat sequences and transposable elements in the final mRNA transcriptome
In accordance with the model pipeline used in this study (Ramberg et al., 2021), long interspersed repeat sequences were removed in RepeatMasker prior to cDNA clustering. The group Hexanauplia was used as taxonomic description. During data analysis, sequences resembling expressed repeat sequences were observed in the dataset. Thus, the final error-corrected mRNA transcriptome was searched for additional repeat sequences and transposable elements from the wider taxonomic group Arthropoda and also from a de novo repeat database generated in RepeatModeler (Skern-Mauritzen et al., 2021). This was done in RepeatMasker using OmicsBox. The output from these two RepeatMasker searches were appended to the annotation file (Supplementary File S1.1).
3 Results
3.1 A non-redundant de novo transcriptome resource consisting of 31,092 error-corrected high-quality full-length transcripts
The output of PacBio and Illumina sequencing are summarized in Figure 1 together with the number of reads after exclusion by each filtering step and final numbers of FL transcripts. All raw data from PacBio and Illumina sequencing is deposited in the NCBI Sequence Read Archive (accession SRX19448789, SRX19448790, SRX19448791, and SRX19448792). The 283,401 HQ reads from the IsoSeq sequencing were error corrected by LoRDEC with 209,424,082 short reads from Illumina sequencing (see section 2.4), resulting in 235,191 EC-HQ reads. The error correction revealed that 96% of the HQ reads had a De-Bruijn graph coverage of 99% or more, demonstrating a good Illumina data coverage of HQ reads. HQ reads with no support from the short reads leading to short internal gaps in the De-Bruijn graph coverage (3% of HQ reads) were removed, while HQ reads with smaller nucleotide and length inconsistencies that could be error corrected by supporting short reads were retained. RepeatMasker identified interspersed repeats in 0.4% of the EC-HQ reads and removed them from further analysis. Further clustering of sequences originating from same locus by cDNA cupcake mapping to the UVic_Lsal_1.2 genome (92.5% of EC-HQ reads) and Cogent clustering of the remaining EC-HQ reads followed by final clustering by CD-hit reduced the number of unique EC-HQ reads to 49,737. No transcripts mapped to the Atlantic salmon genome, and no sequences were removed at this step.
Aiming to provide the protein coding part of the transcriptome, reads with ORFs < 150 bp were removed, retaining 46,840 EC-HQ reads. A final filtering step was applied based on the structural category assigned by SQANTI3 and PacBio FLNC support as described in section 2.5. This final filtering reduced the unique EC-HQ reads to a protein coding transcriptome consisting of 31,092 unique, HQ-FL transcripts (available in the TSA database, accession number GKKU00000000). These were predicted to be distributed on 10,034 loci, or likely loci in the case of 1,705 sequences assembled using Cogent. More than half (54%) of the loci have multiple transcripts (Table 1). A distribution of the number of transcripts per loci is shown in Figure 2A.
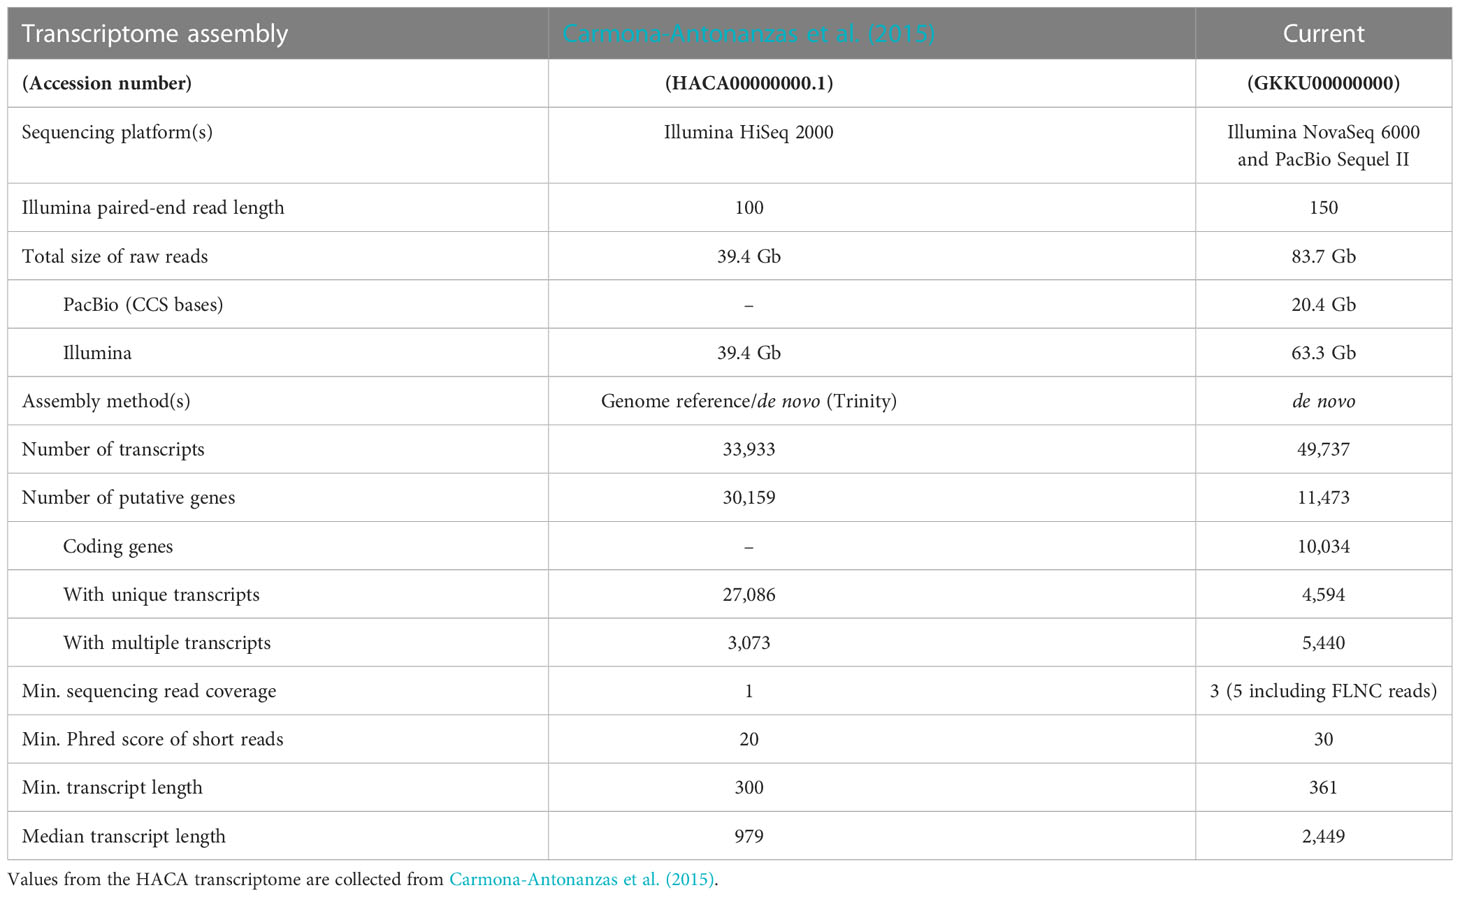
Table 1 Comparison of transcriptome assembly metrics of the error-corrected transcriptome (Current, GKKU00000000) and the single published transcriptome assembly for L. salmonis (HACA00000000.1).
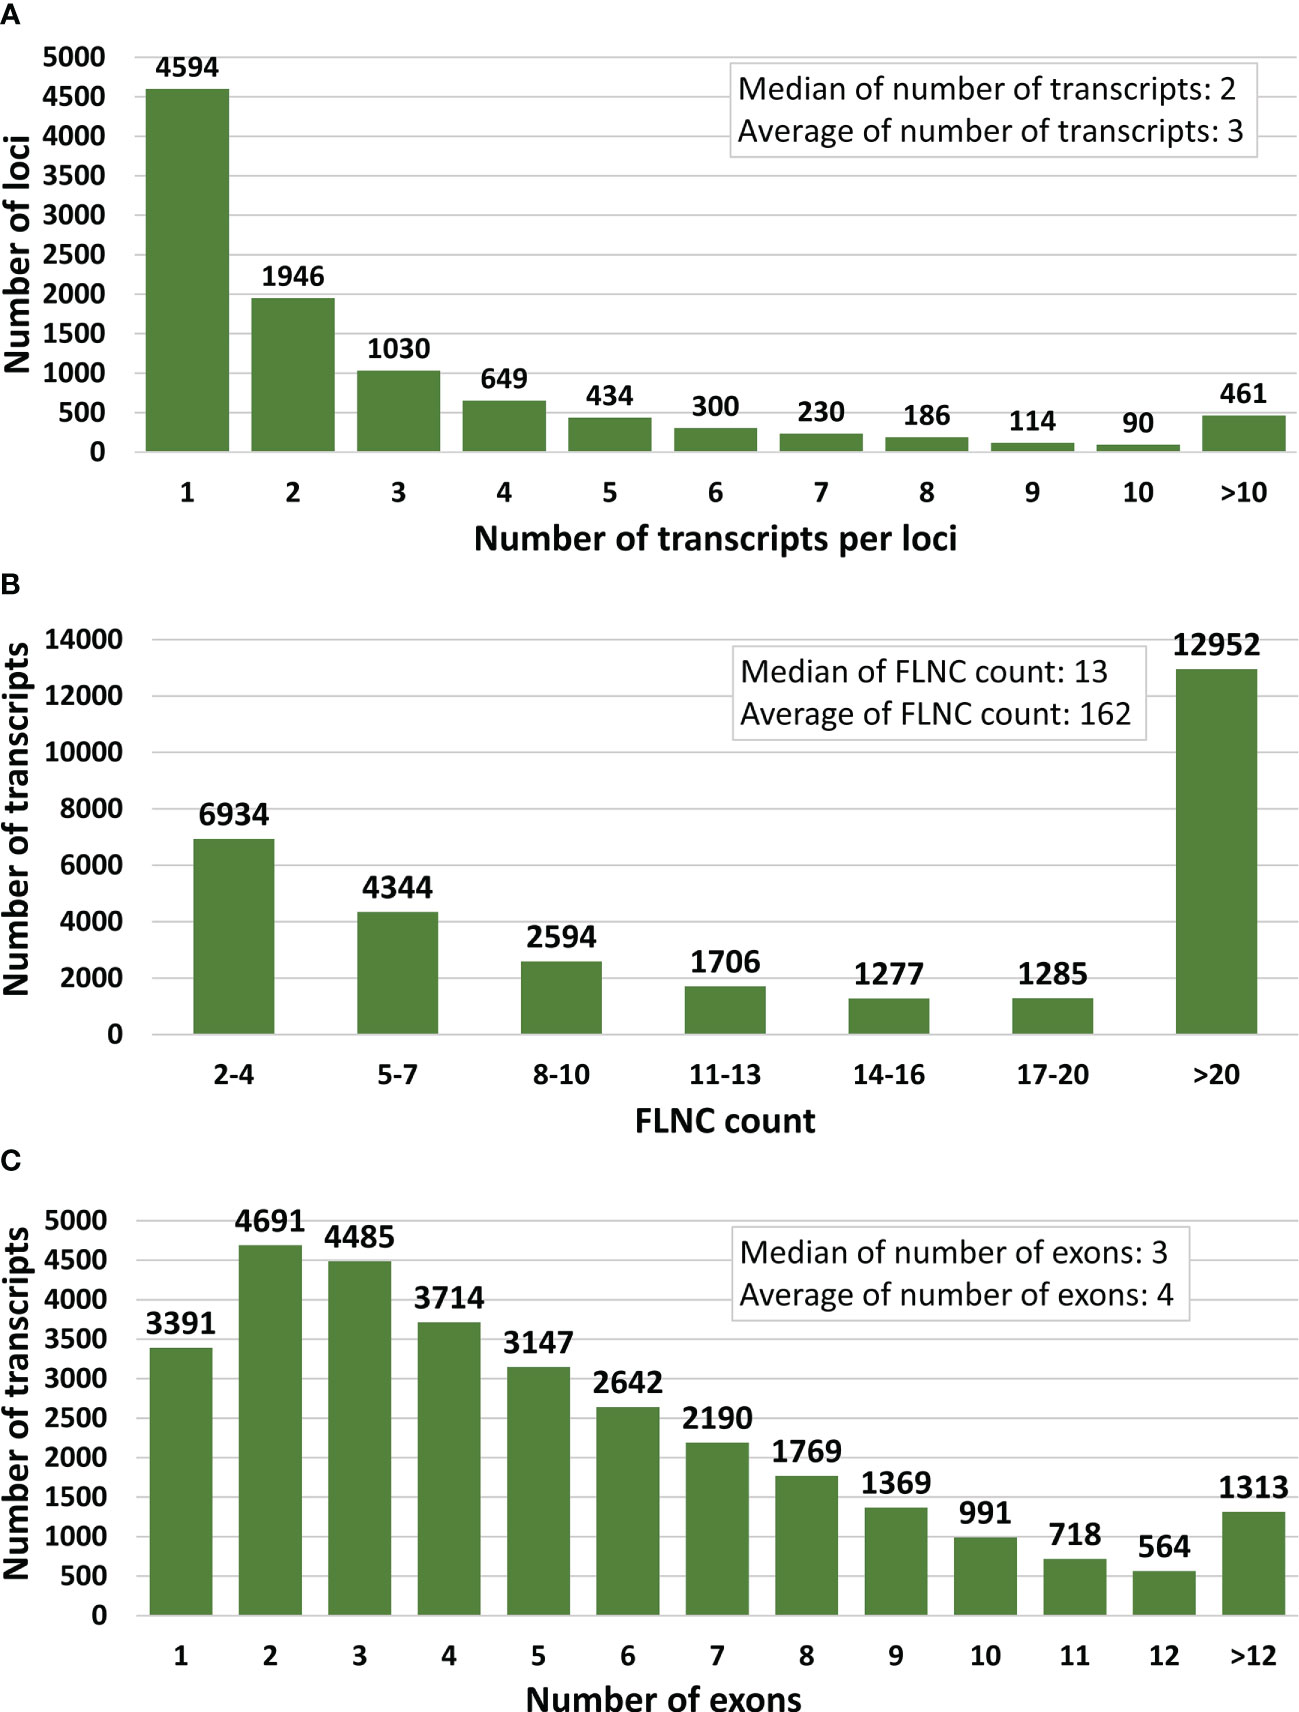
Figure 2 Key statistics for the final full-length error-corrected mRNA transcriptome. (A) Distribution of number of transcripts per loci, (B) Distribution of PacBio full-length non-chimeric (FLNC) sequence support per transcript, and (C) distribution of the number of exons per transcript.
Each transcript of the final error-corrected mRNA transcriptome has a minimum sequencing read coverage of three Illumina reads and two FLNC reads (Table 1). The distribution of the number of transcripts for different FLNC counts in Figure 2B shows that 72% of the transcripts have a FLNC count higher than 5, and the median and average FLNC count is 13 and 162, respectively. Each transcript has a median and average exon number of 3 and 4, respectively (Figure 2C). Transcript length distribution of the final error-corrected mRNA transcriptome (Figure 3A) shows a higher average sequence length compared with all compiled transcript datasets for the salmon louse (Figures 3B–D).
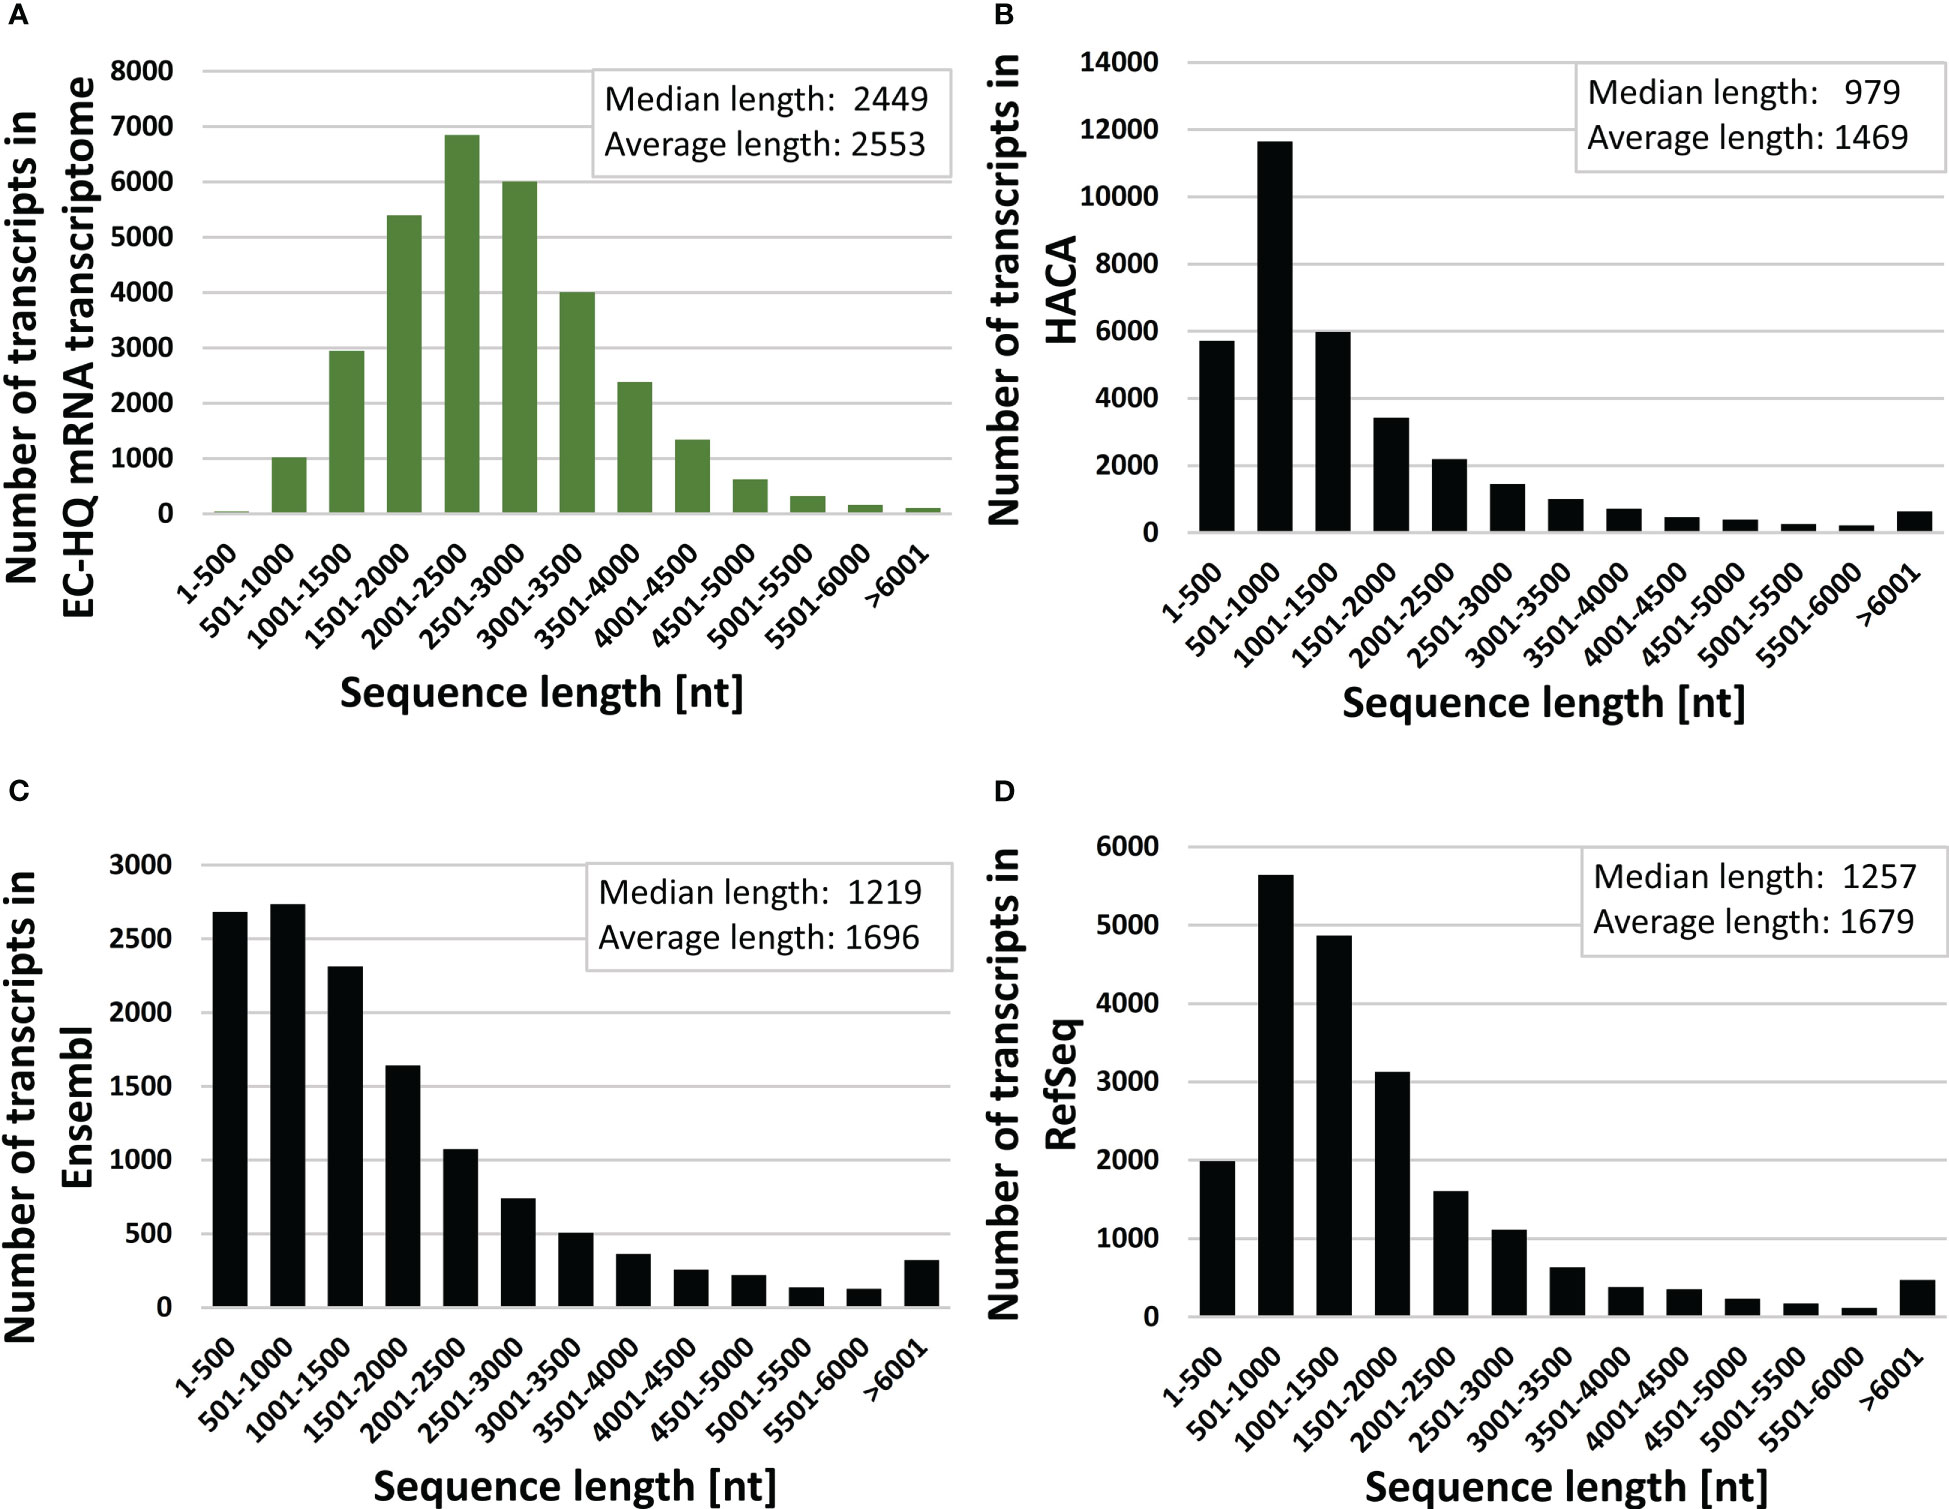
Figure 3 Transcript length distributions with median and average length values of (A) full-length error corrected mRNA transcriptome (GKKU00000000), (B) the HACA00000000.1 transcriptome assembly (HACA) Carmona-Antonanzas et al. (2015) (C) the Ensembl cDNA [Skern-Mauritzen et al. (2021); Cunningham et al. (2022)] and (D) NCBI RefSeq mRNA O’Leary et al. (2016) for L. salmonis.
3.2 Classification of structural variants reveals that more than 50% of the transcriptome are novel splice variants of predicted genes
The numbers of mRNA transcripts within each structural category classified (SQANTI3) are shown in Figure 4, including short category descriptions. For full explanation of the categories, see Tardaguila et al. (2018). The proportion of transcripts classified in the structural categories that originate from each sample type is also presented in the same figure (Figure 4).
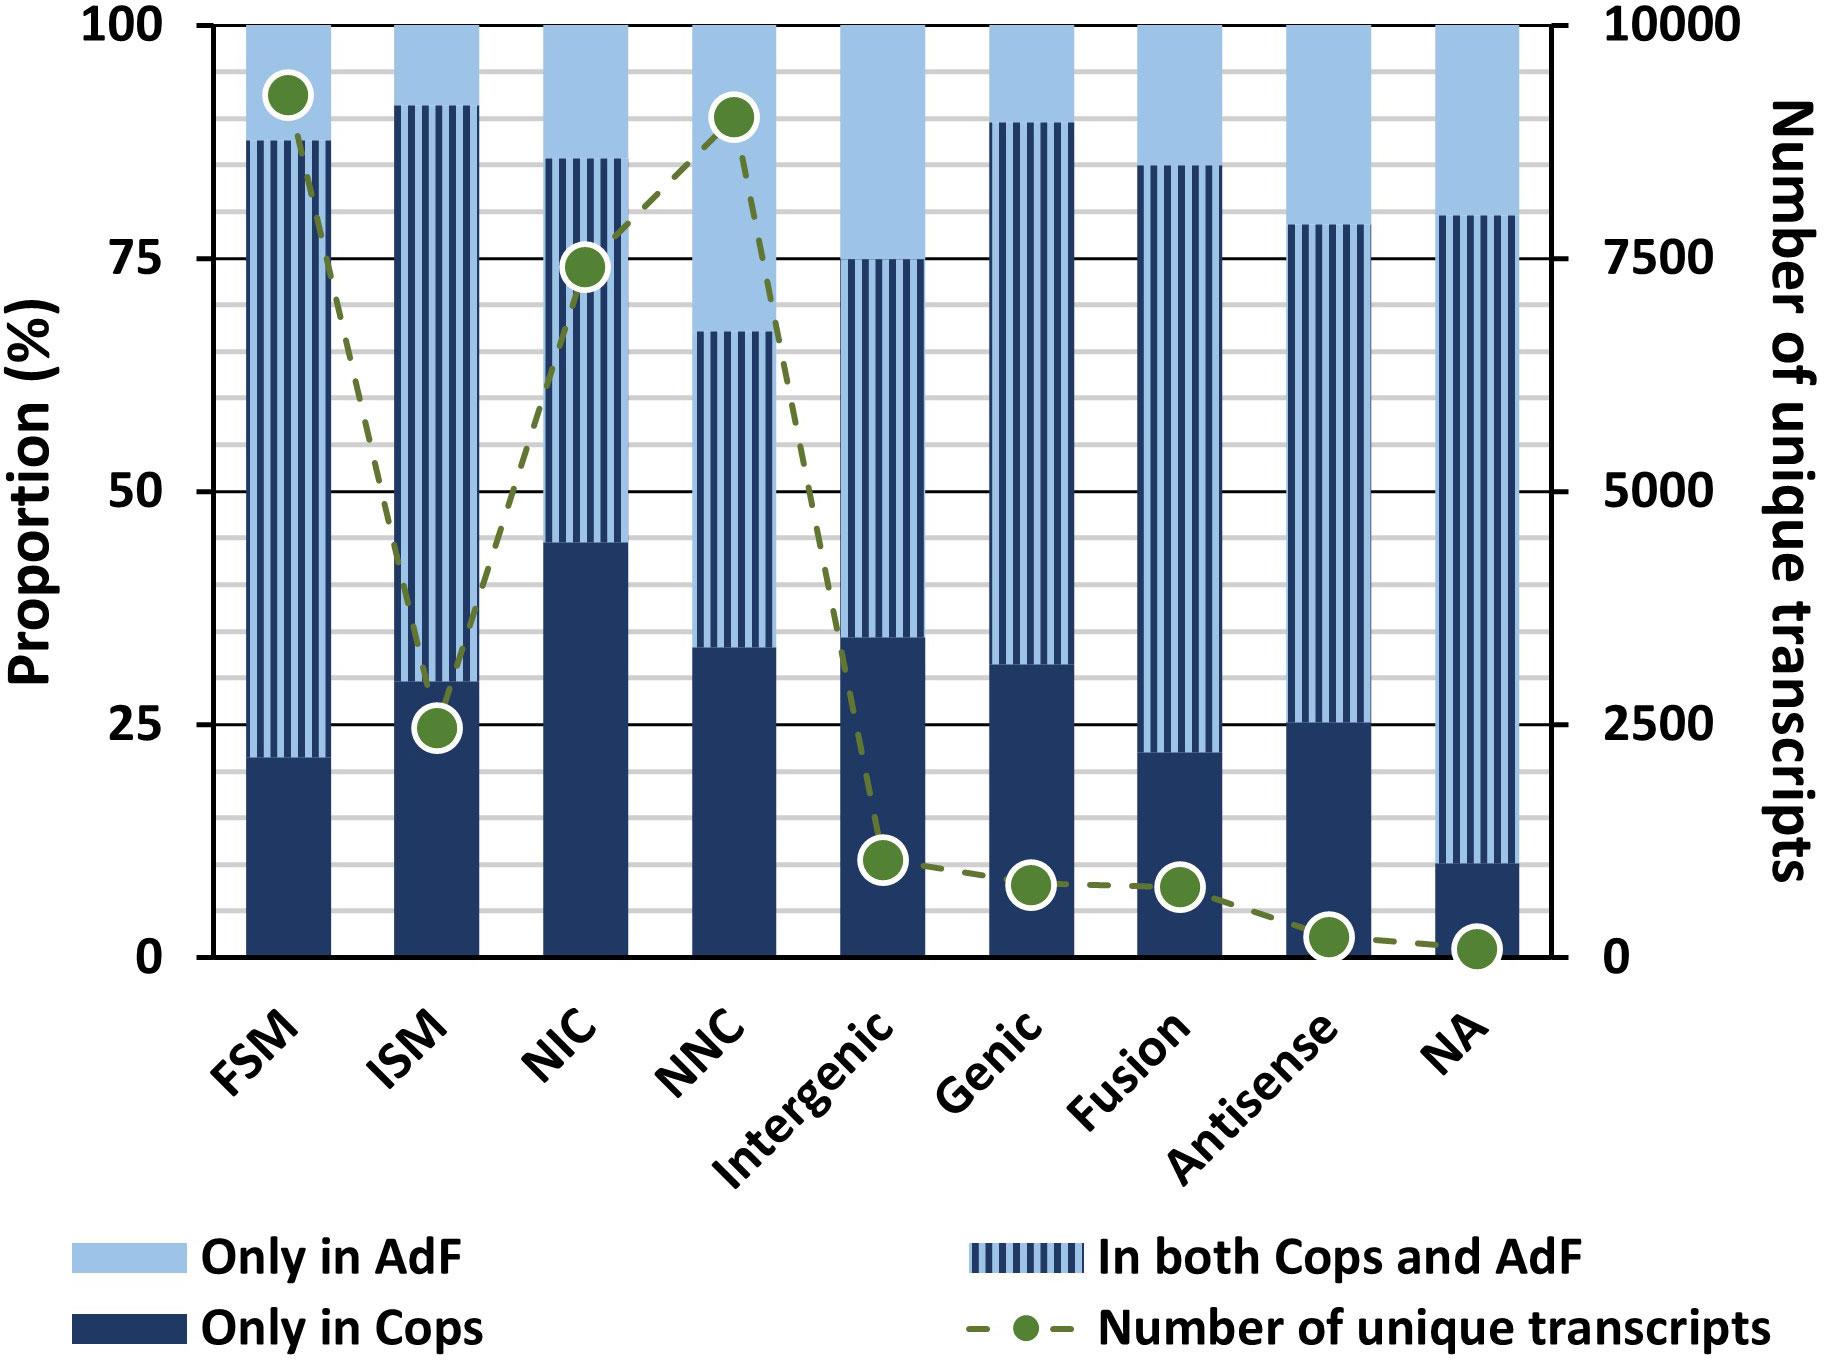
Figure 4 The proportion of transcripts classified in the structural categories that occurs only in the copepodid sample (dark blue bars), only in the adult female sample (light blue bars) or in both samples (combined-color bars) are given according to the left Y-axis. The total number of transcripts for the different categories found in each of the two samples are given as points connected with dotted lines (the Y-axis to the right). SQANTI structural categories: Full splice match (FSM): identical matches (≥ 95% sequence identity) to a predicted transcript in the genome; Incomplete splice match (ISM): partially match the reference, but differ at the 5′-end, 3′-end or both; Novel in catalog (NIC): novel isoforms with a new combination of known splice sites; Novel not in catalog (NNC): novel isoforms with at least one new splicing site; Intergenic: transcripts of novel genes lying outside the boundaries of an annotated gene; Genic: transcripts of novel genes previously predicted as introns or at an intron/exon or intergenic/exon boundary; Fusion: transcripts spanning two or more annotated loci; Antisense: transcripts antisense to a predicted reference.
Transcripts classified as full splice-match (FSM) represent identical matches (≥ 95% sequence identity) to a predicted transcript in the genome, and these data thus represent experimental validation of 9,247 predicted transcripts of the UVic_Lsal_1.2 genome. In total, transcripts mapping a known reference (FSM and ISM) accounted for 38% of the transcripts according to the SQANTI classification. Of these, 2,540 were exact reference matches with less than 50 nucleotide difference in transcription start/stop site between the transcript and the reference. Transcripts that are common for both samples (in both cops and AdF) dominate the FSM and ISM groups (66% and 62% respectively, Figure 4).
Furthermore, 16,430 (53%) of the FL transcripts were novel splice variants (isoforms) expressed from known genes (NIC and NNC). These were either novel isoforms with a new combination of known splice sites (24%, novel in catalog) or novel isoforms with at least one new splicing site (29%, novel not in catalog). Within these two groups, transcripts uniquely present in either copepodids or the AdF sample dominate (NIC: 59%, NNC: 66%), and 45% of the transcripts of the NIC category are uniquely present in copepodids. Incomplete splice matches partially match the reference, but differ at the 5′-end, 3′-end or both. This group represents 8% of the final dataset.
Transcripts of novel genes (Intergenic and Genic) make up 6% of the combined transcriptome. Within the Genic structural category (less than 3% of the combined transcriptome), all transcripts were classified as Genic genomic (covering a predicted exon and intron), and none as Genic intron (located within a predicted intron). Finally, fusion and antisense classes represented 2% and 0.7% of the transcriptome. For transcripts within the genic category there is a high prevalence of mono-exon transcripts (88%).
All transcripts of the final dataset have an FLNC count ≥ 2, and the categories incomplete splice match, antisense, genic, intergenic, and fusion have an FLNC count ≥ 5. Transcripts of the novel not in catalog category containing no non-canonical splice junctions were accepted with ≥ 2 FLNC counts, but ≥ 5 was needed for transcripts of this category with canonical splice junctions.
The 108 transcripts of the final dataset that did not successfully align to the genome using SQANTI3 received no structural annotation. The genome mapping criteria are less strict for SQANTI3 compared with cDNA Cupcake, and 94% of transcripts clustered using cogent were still classified using SQANTI3.
3.3 Functional annotation provided Gene Ontology terms and/or alternative functional descriptions of 88% of all full-length transcripts
The final FL transcriptome was subjected to further functional annotation using OmicsBox based on the GO terms and a blastp analysis of the predicted amino acid sequences. An overview of the percentage of transcripts for each annotation type is shown in Figure 5. The functional annotation was also carried out separately on the transcriptomes from each of the copepodid and adult samples. In the final mRNA transcriptome including both samples, 79% of the transcripts were successfully annotated with at least one GO term and 80% of the transcripts received a description, based on the top 20 blast hits (OmicsBox). Furthermore, 22% of the transcripts were predicted enzymes and assigned an enzyme name and Enzyme Code (OmicsBox). Altogether, 88% of the data is annotated by one or more GO terms and/or a description from OmicsBox. Functional annotations associated with each unique transcript ID are included in Supplementary File S1.1.
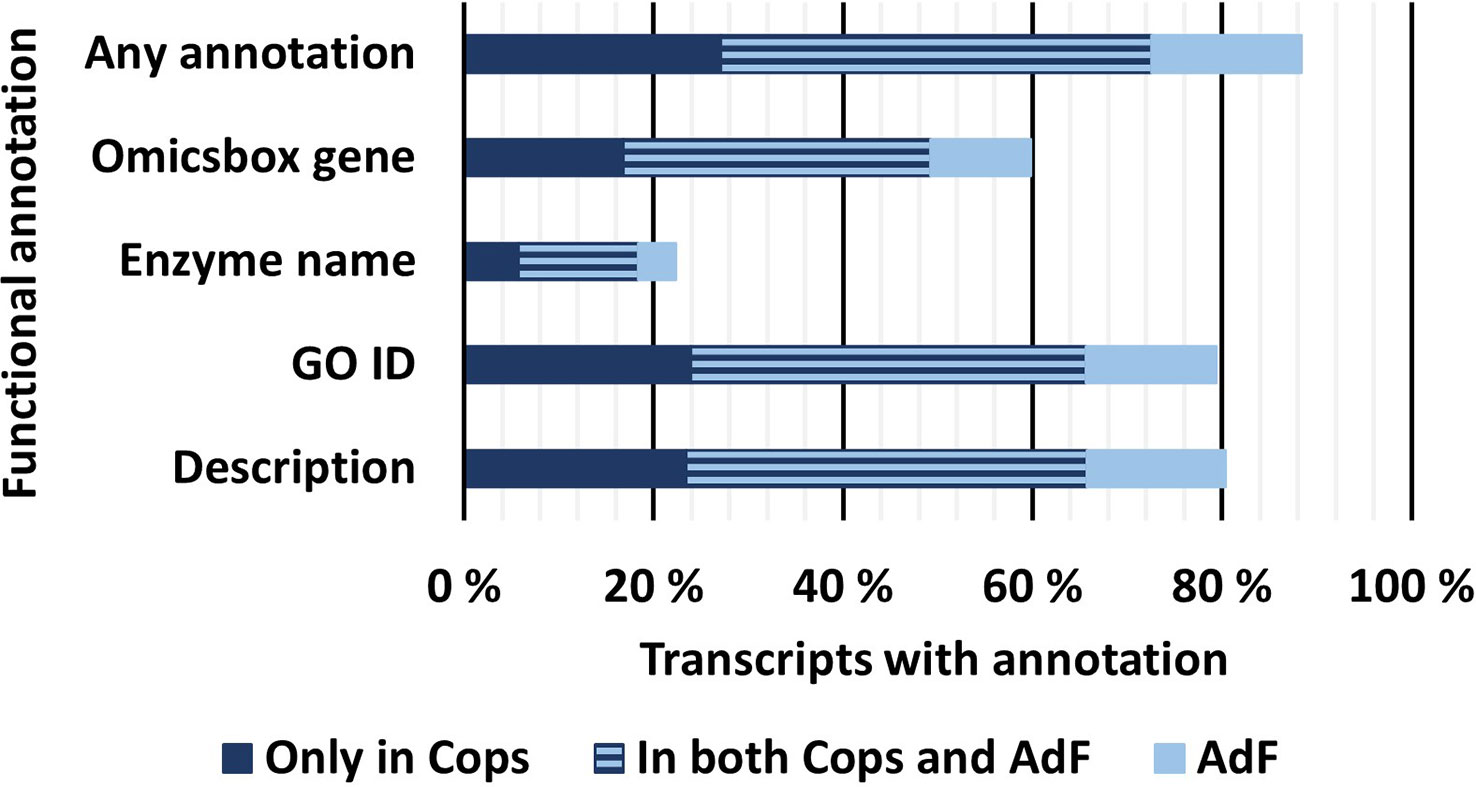
Figure 5 Percentage of transcripts in the final, FL mRNA transcriptome that received different types of functional annotations. All annotations are provided in Supplementary File S1.1. Any annotation: Transcripts that received at least one of the functional annotations mentioned below; OmicsBox Gene: Transcripts that received a gene name from OmicsBox based on the most common gene name from the top 20 blast hits in RefSeq; Enzyme name: Transcripts that were annotated as a predicted enzyme from OmicsBox; GO ID: Transcripts that received one or more GO IDs from the OmicsBox functional annotation; Description: Transcripts that received a gene description generated by OmicsBox based on natural language processing of the descriptions of the top 20 blast hits.
3.3.1 Annotation of repeat sequences and transposable elements in the final mRNA transcriptome
By expanding the RepeatMasker taxonomy database from Hexanauplia to Arthropoda, additional 501 transcripts carrying repeat sequences were identified in the final error-corrected transcriptome. Searching for repeat elements against the de novo repeat database generated for the salmon louse (Skern-Mauritzen et al., 2021), revealed 9,809 transcripts (32% of transcripts) with a match. Out of these, 69% were of an unknown category. The most abundant class of repeats identified were Class II transposable elements (25% of transcripts with identified repeats) including DNA transposons with Tc1/Mariner being the most abundant (9% of transcripts with identified repeats). Annotated Class I transposons including interspersed nuclear elements and long terminal repeats constitutes 6% of transcripts with identified repeats. Compiled lists of classifications are given in Supplementary File S1.2, and the sequences harboring repeats are also annotated in the annotation file in Supplementary File S1.1.
Within the SQANTI-annotated structural categories, the intergenic and antisense groups had the highest prevalence of annotated repeats from the de novo repeat database (87% and 70%, respectively). The full splice match category had the lowest percentage of repeats (24%) from the same database.
3.4 One-third of transcribed genes are uniquely expressed in either copepodids or the adult female sample
The final annotation of the dataset contains information of the FLNC counts for the AdF cephalothorax and the copepodid sample separately. The number of transcripts and loci uniquely expressed and overlapping in the two samples are presented in Figure 6. Overall, more unique transcript sequences were identified in the copepodid sample compared with the AdF sample. A bigger proportion was also found solely in the copepodid sample (32%) compared with the AdF sample only (19%). This is also reflected in the number of loci transcribed in copepodids only (21%) compared with the AdF only (12%). The remaining 67% of the loci are transcribed in both samples.
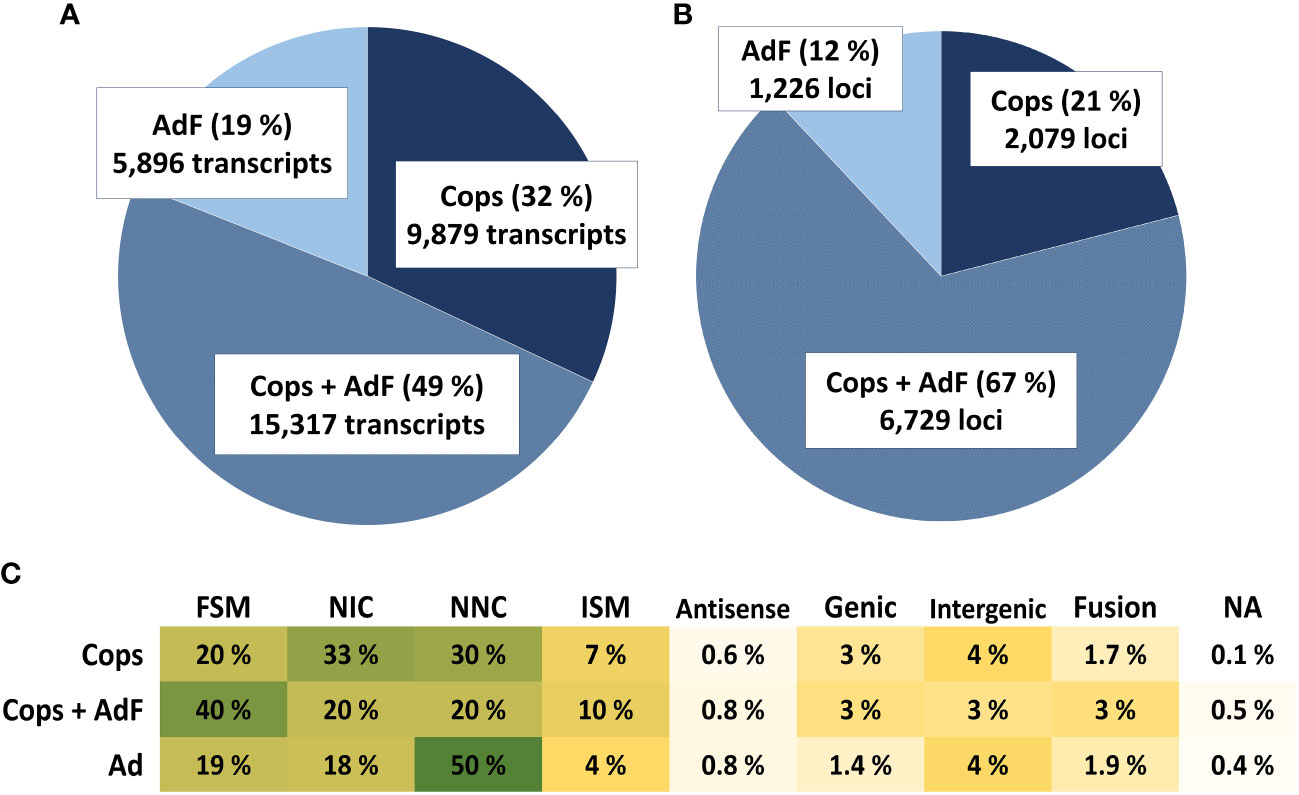
Figure 6 The pie charts show the proportion of unique transcripts (A) and unique loci (B) expressed only in the copepodid sample (dark blue), only in the adult female sample (light blue bars) or in both samples (combined-color bars). The numbers for each group and the percentages of the total are given in the pie chart. The proportion (%) of the structural categories of transcripts found in each sample exclusively or in both samples (C) are color-labeled from high proportion (dark green) to small proportion (light yellow).
The GO annotations show a similar pattern for copepodids and AdF salmon lice within the most abundant GO categories of the biological process category (Figure 7). The most dominant biological process GO term is transport, followed by protein modification process and organelle organization.
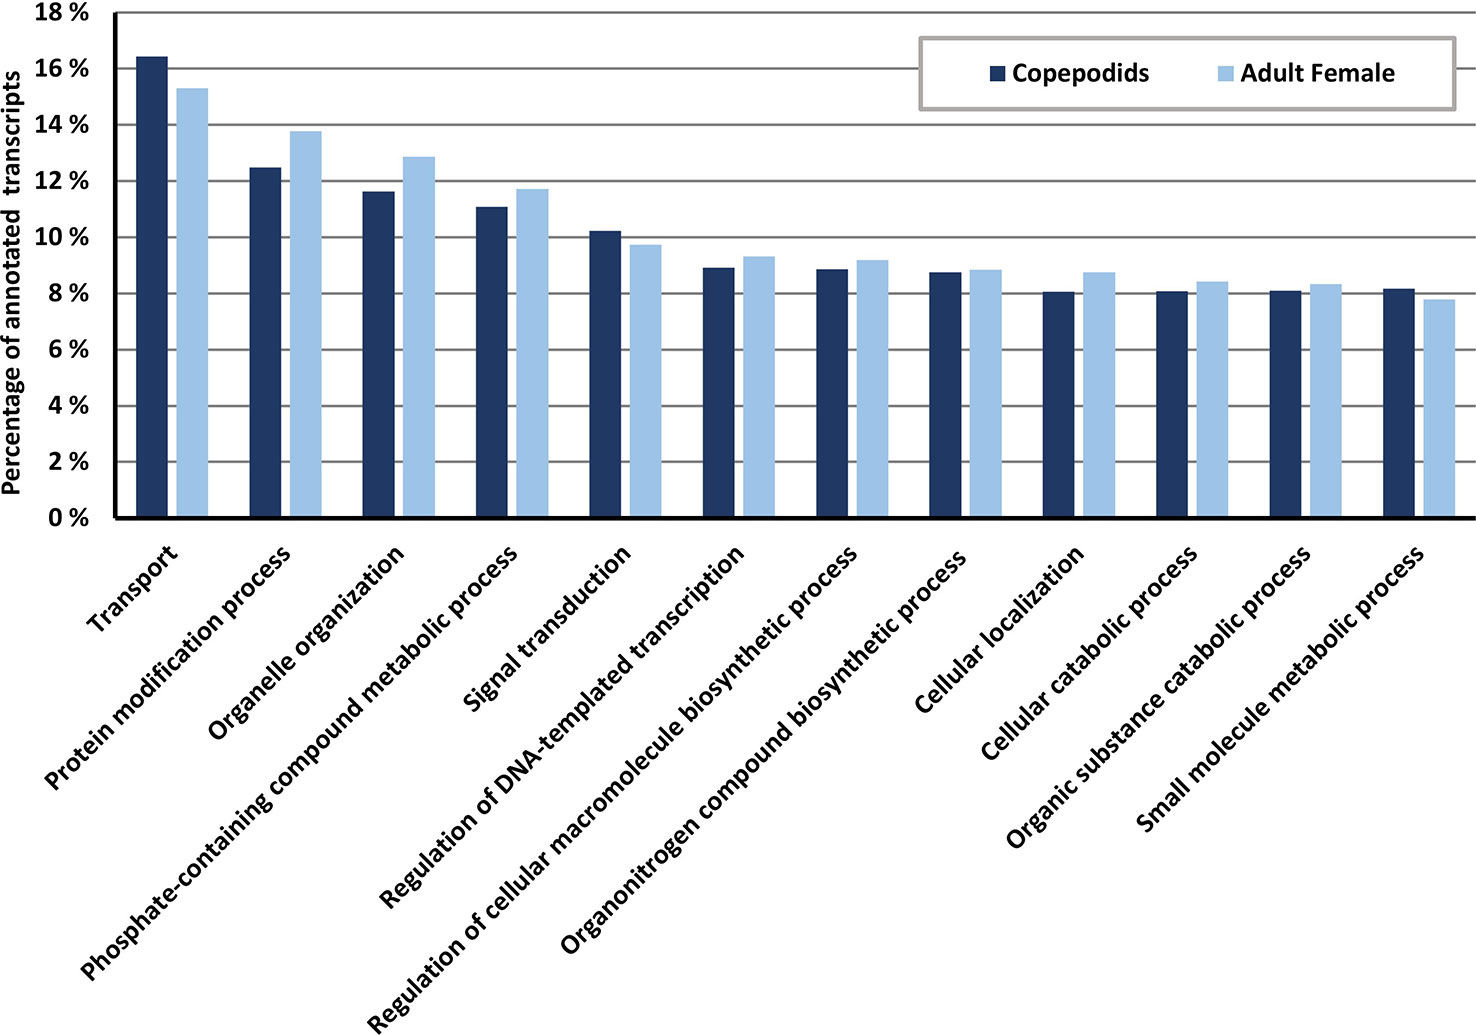
Figure 7 Distribution of GO terms within the biological process ontology for copepodids (blue) and adult female (yellow, patterned) samples given in percentage of the total number of annotated transcripts for each sample. Data collected from the OmicsBox software suite.
3.5 Most abundant transcripts constitutes a large proportion of the long-read sequencing data
The transcripts with the highest number of FLNC reads (top 10 list) are presented in Table 2, with key information added. A more extended list (top 20 list), together with all available annotations is given in Supplementary File S1.3. Table 2 is divided into top 10 lists for all transcripts from both samples, in transcripts found in the copepodids sample (Cops), in transcripts found in the AdF sample, and in transcripts found exclusively in either copepodids or the AdF. The sum of FLNC counts for the top 10 most abundant transcripts (by FLNC count) in the merged mRNA transcriptome constitutes 14% of the total number of FLNC reads covering the whole dataset. Out of the transcripts solely present in the adult sample, the total FLNC count of the top 10 most abundant transcripts (170,900) is more than three times that of the copepodid sample (52,106).
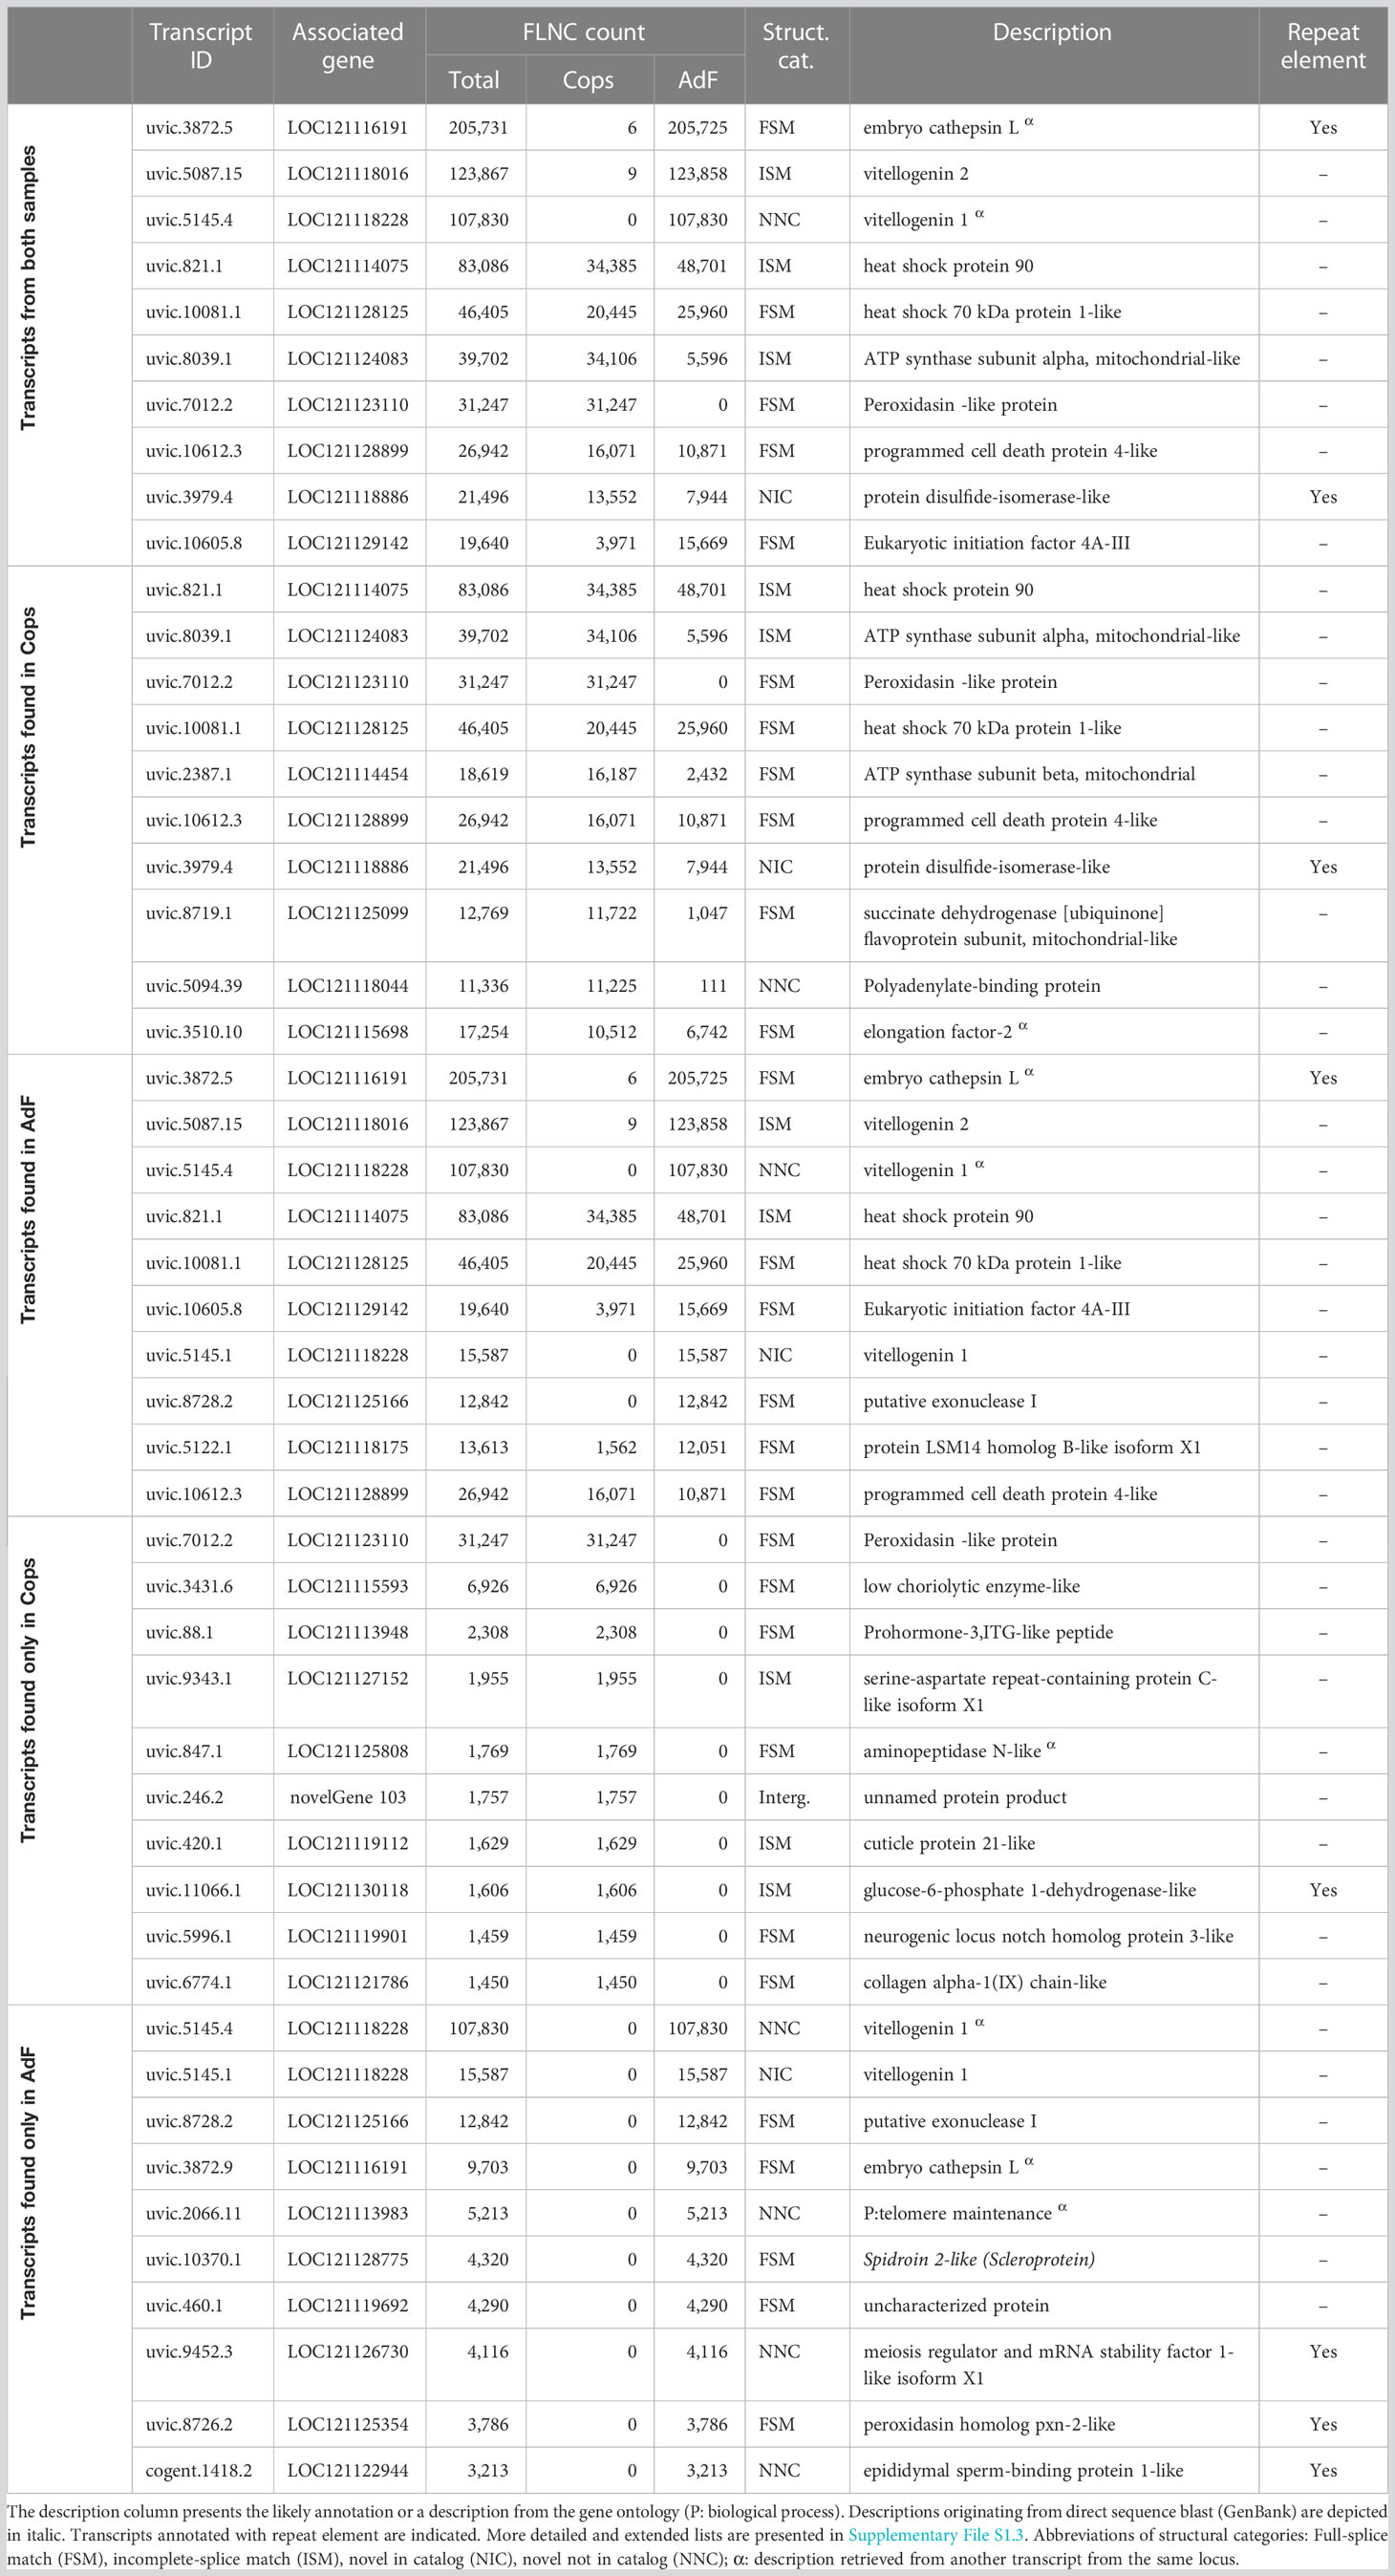
Table 2 The 10 transcripts with the highest number of FLNC reads in all transcripts, in transcripts found in the copepodids sample (Cops), in transcripts found in the adult female (AdF), and in transcripts found exclusively in either Cops or AdF.
4 Discussion
4.1 Benefits of applying hybrid error correction of single-molecule long reads in transcriptome sequencing
The transcriptome assembly presented consist of 31,092 unique transcripts originating from an AdF salmon louse and her copepodid progenies. Each transcript represents a long-read sequence originating from a single molecule, subsequently error corrected by short reads, which allows for a more accurate ORF prediction. The pipeline used was adopted from a transcriptome assembly study on the Atlantic salmon, where it was shown that the ORF size increased in 7% of the transcripts after error correction (Ramberg et al., 2021). Long-read single-molecule sequencing also constitutes the most reliable source for CDS information and gene function annotation as the complete CDS is provided within a single sequence. The single previously published transcriptome assembly for L. salmonis [HACA; Carmona-Antonanzas et al. (2015)] accepted transcripts with read coverage down to a single short read (100 nt) and a Phred score cutoff of 20 corresponding to a 1% probability of incorrect base call. Thus, the HACA transcriptome assembly would not be suitable for sensitive applications such as ORF predictions. In contrast, the high-minimum read coverage and the error correction applied to the presented FL mRNA transcriptome in the current study, ensures transcripts with high accuracy that is more suitable for such sensitive applications.
4.1.1 Number of genes
A higher number of putative genes (30,159) was reported in the HACA transcriptome assembly (Carmona-Antonanzas et al., 2015) compared with 11,473 in the current transcriptome (Table 1). The higher number of predicted genes may be a result of lower acceptance cutoff for several factors such as a lower Phred score, lower minimum transcript length and lower minimum sequencing read coverage. Furthermore, small RNA sequences identified by RepeatMasker were removed from the dataset during the transcriptome assembly pipeline (section 2.4), and these non-coding transcripts are lacking from the total number of genes. The higher ratio of shorter sequences in the HACA transcriptome compared with the current transcriptomes (Figure 3) supports this explanation for the variation in number of putative genes.
Another factor possibly affecting the estimated number of genes in the dataset is mis-priming events during cDNA synthesis. Genes with a high adenine content are prone to mis-priming of the poly-dT primer used during library preparation. Internal poly-dT priming not only leads to reverse transcription from the adenine-rich sequence but also blocks the reverse transcription from the poly-A tail (Nam et al., 2002). The result is two truncated sequences that may be removed during the pipeline due to an incomplete ORF. Such mis-priming events may also result in cDNA synthesis and subsequent sequencing of genomic DNA. Genomic DNA was removed from the RNA raw material using DNAse digestion. In the case of any remaining DNA in the sample, the sequencing of genomic contamination would result in long mono-exon transcripts with high-adenine content in the genomic sequence directly downstream of the transcript termination site. In the final transcriptome, 3% of the transcripts fit such a description (adenine content > 60%, single exon), and the removal of these transcripts would not largely affect the estimate of number of genes or transcripts.
In the RefSeq database for L. salmonis, there is also an overweight of sequences with transcript lengths less than 1,500 nucleotides (Figure 3). This may lead to a higher predicted number of genes (14,174) compared with the current FL transcriptome. The RefSeq database is a collection of transcripts solely predicted from short-read RNA datasets aligned against the UVic_Lsal_1.2 genome assembly. The discrepancy between the number of coding genes estimated from the current assembly and the predicted coding genes of the RefSeq database may thus be due to incorrect prediction based on erroneous assemblies of short reads or acceptance of splice variants with low coverage of splice junctions. An example is the splice patterns shown in Figure 8A, where the error-corrected transcripts of the presented transcriptome show a mutually exclusive splice pattern of exons 10, 11, 12, and 13, whereas in the RefSeq sequences, exons 11 and 12 are predicted together in six transcripts. As discussed by Skern-Mauritzen et al. (2021), parasites have significantly fewer genes and smaller predicted proteome sizes compared with free-living species, with a median gene number of 13,081. The 11,473 identified genes of the current transcriptome are therefore not far from the expected number, given that not all life stages are included.
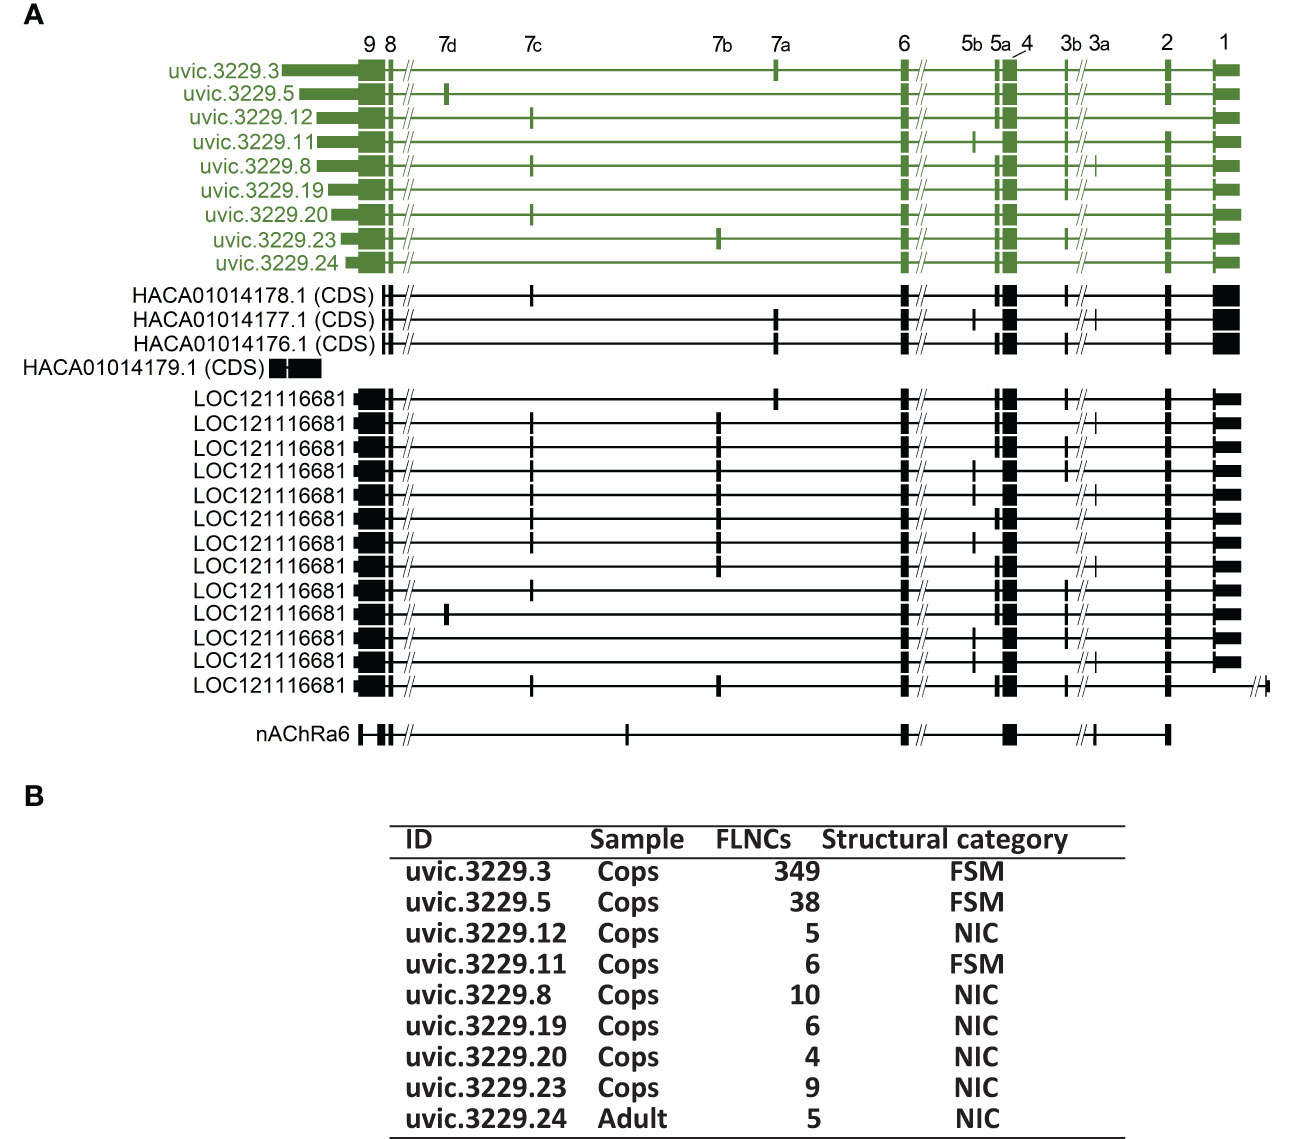
Figure 8 (A) Acetylcholine receptor subunit α7 (uvic.3229) transcripts in the final FL transcriptome compared with CDS sequences from the HACA transcriptome assembly, a RefSeq predicted gene (LOC121116681) and a RefSeq curated mRNA (nAChRa6, NM_001114302) from the red flour beetle, Trobolium castaneum (Benson et al., 2012). The figure is based on an alignment to the UVic_Lsal_1.2 genome using Blat (Kent, 2002) in the UCSC genome browser (genome.ucsc.edu). Regions where the transcript aligned (exons) are indicated with thick lines. CDS regions are indicated with wider lines compared with the 5′- and 3′-UTRs. Long introns (thin lines) are shortened and indicated with -//-. Exon numbers are indicated above. (B) Table of key transcript data of the acetylcholine receptor subunit α7 (uvic.3229) summarized from Supplementary File S1.1. ID: Transcript identification; sample: Indicates whether the sample was present with at least two FLNC reads in either the adult female sample (Adult), the copepodid sample (Cops) exclusively; FLNCs: The number of full-length non chimeric (FLNC) reads, as classified by Isoseq, that have been clustered together to support the transcript; structural category: classification given by SQANTI3 based on how well the mapping matches the existing genome annotation. FSM: full splice match; NIC: novel in catalog.
4.2 Structural variants
The SQANTI3 pipeline for structural characterization of long reads is designed to identify sequencing artifacts commonly generated by FL transcript sequencing. Here, the SQANTI3 pipeline was mainly applied to provide annotation of structural variants and isoforms, since the error correction of the single-molecule long reads by short reads results in high-accuracy transcripts and provides a greater confidence compared with the long-read sequencing alone. The additional verification by short read and FL sequences is especially important for transcripts of the antisense, genic, intergenic, and fusion groups not supported by a reference match as well as novel isoforms with non-canonical splice junctions (Tardaguila et al., 2018). An additional filter allowing only transcripts with FLNC counts ≥ 5 for the mentioned groups ensured further validation for these transcripts.
4.2.1 Intron retention may provide new information about the regulation of transcripts
Intron retention is the most predominant sub-category among the novel splice variant transcripts. Intron retention will in many cases lead to the introduction of premature termination codons and truncated ORFs. Early terminations are known to cause nonsense-mediated decay in eukaryotes, resulting from a higher distance from the termination site to the poly-A tail (Brogna and Wen, 2009). Nonsense mediated decay has also been suggested as a mechanism compensating for sub-optimal splicing in species with large intron numbers (Jaillon et al., 2008). During the past decade, intron retention has also become recognized as a method of regulation of cellular function. This includes both downregulation by targeting for nonsense-mediated decay and rapid expression via post-transcriptional splicing of the retained intron (Jacob and Smith, 2017). The study of intron retention has previously been challenging because short-read sequencing do not include information of the whole transcript, thus making it challenging to separate genomic DNA and real intron retention. This obstacle can be overcome by the use of long-read single molecule transcripts, such as provided here. Transcripts categorized as intron retention thus provides a new level of information about the regulation of transcripts in the salmon louse.
Mono-exon transcripts constitute a large proportion (88%) of the Genic category. In cases where Genic mono-exon transcripts reside from genes with multiple isoforms, the other isoforms typically have a low number of exons. These transcripts may therefore be a result of intron retention in genes with a low number of isoforms resulting in a mono-exon transcript.
4.2.2 Nested genes
A transcript of a gene located entirely within the boundaries of a host gene is called a nested gene (Assis et al., 2008; Kumar, 2009). A nested gene may either be located within the intron of a host gene or opposite of the CDS of the host gene, although the latter is rarely seen in metazoan genomes (Kumar, 2009). Nested genes are often single exon genes and are typically located on the opposite strand of the host gene (Yu et al., 2005). Transcripts that originate from nested genes would therefore be expected to be classified in the antisense or alternatively in the genic intron structural category. No transcripts of the final mRNA transcriptome were annotated in the genic intron category. In total 230 transcripts were classified in the antisense structural category, and a fraction of these are potential nested genes. However, antisense transcripts are not necessarily located completely within the boundaries of a host gene, and some of these transcripts are therefore not true nested genes. In addition, 69 of these transcripts have a downstream adenine content of 65% or higher in the genome (see Supplementary File S1.1). As previously discussed in section 4.1.1, this may indicate that these transcripts result from mis-priming events.
4.2.3 Novel isoforms and transcripts of novel genes
According to the structural categories assigned by SQANTI, 53% of the transcripts are novel splice variants of known genes. The number of transcripts per loci (Figure 2A) also gives an indication of the variety of splice variants present in the dataset. This, however, presumes that all transcripts of a locus are a true splice variant and not a nested gene. Although some transcripts in the antisense group are nested genes, they are not annotated in the same locus as the host gene (see Supplementary File S1.1). The number of transcripts per locus is therefore a solid estimate of the number of splice variants.
Only the full splice match structural group constitutes a complete reference match, and all other categories are considered novel isoforms according to the SQANTI classification (Tardaguila et al., 2018). However, novel isoforms may not be novel but simply represent (and could replace) highly similar transcripts not correctly predicted in the existing data in GenBank.
Transcripts categorized as novel, and in particular those in the novel not in catalog category has been described as “poorly expressed transcripts of known genes” (Tardaguila et al., 2018). This is also seen in the transcripts of the present dataset, for example, among transcripts annotated as encoding the α7 subunit of the nicotinic acetylcholine receptor (nAChR). The two transcripts having the highest FLNC counts were categorized as full splice match, while six out of seven transcripts with lower FLNC support were categorized as novel in catalog (see Figure 8B). The average FLNC count was also lower for the novel categories compared with the full splice match category in general. Transcripts with high FLNC support were frequently classified in the NNC group (Table 2), as seen in 50% of the transcripts only present in the AdF sample (Figure 6C). The high FLNC support thus indicates high expression levels, also for novel transcripts. It should be noted that the level of FLNC support will reflect the size of the tissue where the transcript is expressed, since the transcriptome is based on the whole organism. Transcripts present in more voluminous tissues, for example vitellogenin in the ovaries of the AdF, must be expected to have a higher FLNC support than transcripts found in less abundant tissues, such as ion channels in the nerve tissue.
4.3 Functional annotation
Successful annotation of transcripts to one or more GO terms was as high as 79% in the current study. This is substantially higher than 18.4% reported from Caligus rogercresseyi (Gallardo-Escarate et al., 2014). From the GO-annotation profiles for the biological processes in the two samples (Figure 7), it is evident that most transcripts belong to processes that are common for the two life stages.
4.3.1 A valuable resource for studying expressed repeat sequences and transposable elements
The high number of transcripts with repeated elements (9,809) retrieved by comparing the current transcriptome to the de novo repeat database of the salmon louse (Skern-Mauritzen et al., 2021) constitutes a large dataset for further studies of transposable elements in the salmon louse. Transposable elements have previously been shown to introduce resistance to anti-parasitic treatment in insects (Panini et al., 2021). Skern-Mauritzen et al. (2021) showed that around 60% of the genome of L. salmonis consists of repetitive elements with the Tc1/Mariner type of transposons being the most prevalent of the identified groups of repeats, coherent with the presented findings (see section 3.3.1).
The presence of a repeat sequence in a transcript should not lead to the rejection of the transcript from the dataset without further analysis. An example is the transcript having the highest FLNC count (uvic.3872.5, Table 2), which harbors a predicted repeat sequence. This transcript is a full splice match to an annotated transcript in the genome, and the high number of FLNCs covering this transcript further supports that this is a coding transcript. Repetitive sequences may also be located in the 5′- or 3′-UTR, thus not affecting the coding region of the transcript.
A comparable percentage of transcripts with repeat elements was identified in the copepodid sample (31%) compared with the AdF sample (29%), and there are only minor differences in the order of repeat element groups (for a compiled list, see Supplementary File S1.3). The order of the list is also comparable with the list presented in Skern-Mauritzen et al. (2021), although some differences exist, which is expected since the repeat analysis presented in Skern-Mauritzen et al. (2021) was based on repeat elements in the genome, not in the transcriptome. Consistent with the previously proposed frequency ratio of long-terminal repeat (LTR) retrotransposons in crustaceans in general (Piednoel et al., 2013) and the salmon louse in particular (Skern-Mauritzen et al., 2021), Gypsy is the most abundant LTR element relative to BEL/Pao and Copia elements.
4.4 A biological explanation to the proportion of transcripts uniquely expressed in copepodids or adult female sample
One-third of the transcribed genes are unique to either copepodids or the AdF sample. Given the biological differences of the two life stages, this is not surprising. The copepodids have the ability to locate and attach to the host, which was one of the important reasons for choosing this life stage for transcriptome sequencing. As further discussed in section 4.5, the highly expressed transcripts unique to the AdF sample is indeed dominated by genes related to oogenesis and reproduction. Highly expressed transcripts unique for the copepodids (Table 2) include a cuticle protein and a collagen chain that both may be coupled to exoskeleton formation and thus growth and development.
Although there were a higher number of raw reads from the AdF sample than from the copepodids sample, both in terms of long reads and short reads, the final error-corrected transcriptome consists of more transcripts from the copepodid sample than from the AdF sample (Figure 6A). The shift in dominance between the samples derives from the stage of the IsoSeq v3 pipeline removing sequences with unwanted primer combinations, concatemers, and sequences without poly-A tails of at least 20 nt (between CCS and FLNC steps of Figure 1). With respect to the number of loci being represented in the transcriptome, the copepodid sample dominate once again (Figure 6B). This may reflect a greater demand for flexibility as free-living and host-seeking organisms of the early life stages compared with the parasitic life stages on a host, as discussed between free-living and parasitic species (Skern-Mauritzen et al., 2021).
4.5 Abundant transcripts
The three most abundant transcripts have more than 100,000 FLNC counts each and is almost exclusively expressed in the AdF (Table 2). Several transcript variants on the top 10 list of most abundant transcripts in the AdF cephalothorax can be related to oogenesis, such as vitellogenin (uvic.5087.15 and uvic.5145.4). It is not surprising, since the ovaries of the salmon louse is situated in the cephalothorax and constitute a relatively large proportion of the body. From the transcripts only found in the AdF (last group in Table 2), the highest number of FLNC reads represented a transcript that did not receive a description from the Omicsbox annotation (uvic.5145.4). It is, however, a transcript from the same locus (LOC121118228) as number two on the list (uvic.5145.1), which is annotated as vitellogenin 1. Both transcripts represent novel splice variants, with either unknown (structural category NNC) or known splice sites (NIC). Thus, the first transcripts harbor at least one new splice site, whereas the second transcript only consist of known splice sites.
In addition to the vitellogenin transcripts, the most abundant transcript in the entire transcriptome (uvic.3872.5) may also be related to the ovaries and oogenesis. The transcript was not annotated through the pipeline. However, a blastn search against somewhat similar sequences (NCBI) identified the transcript as “possible embryo cathepsin L-associated” (99% query cover, E-value = 0.0, 98.72% identity to EF490929.1). The hit in GenBank was identified through EST sequencing of the salmon louse (Eichner et al., 2008) and was compared with the cathepsin L in Artemia (Warner et al., 2004). The Cathepsin L associated protein is essential for embryogenesis in Caenorhabditis elegans (Hashmi et al., 2002) and the salmon louse hit was associated with egg production (Eichner et al., 2008).
Peroxidasin occurs on the lists for most abundant transcripts in both samples (Table 2), although the transcripts from copepodids and the adult derive from different loci. The protein consists of peroxidase activity together with extracellular matrix motifs (Nelson et al., 1994) and are involved in the response to oxidative stress and detoxification (see GO terms for the transcripts in Supplementary File S1.1).
Another group of proteins coupled to stress induction, heat shock proteins (HSPs), are present on the top 10 list of most abundant transcripts from samples of both life stages. One of them (uvic.821.1; corresponds to EMLSAG00000010216) is known to be the temperature-inducible HSP90 (Borchel et al., 2018). Whether the high abundance in these samples is a result of sampling procedure, or if there is a generally high level of this transcript in salmon lice, remains unknown. The HSP70 on the list of most abundant transcripts (uvic.10081.1; corresponds to EMLSAG00000003638) was not mentioned as a candidate for stress tolerance by Borchel et al. (2018). However, studies in the crustacean Tigriopus californicus have shown that HSP70 is a heat stress induced gene (Kelly et al., 2017). Therefore, given the high number of FLNC counts presented for both copepodids and the AdF in the present study, it might be a suitable candidate for further studies on stressors to the salmon louse.
4.6 Transcriptome comparison by blast
The blastn analysis comparing the herein presented FL transcriptome to other transcript databases (HACA transcriptome, Ensembl cDNA and RefSeq mRNA) shows a high level of overlap of genes (Figure 9). This indicates that the majority of novel transcripts presented here are not novel genes as such but represent highly similar transcripts to transcripts not correctly predicted in GenBank. Result tables from the blast analyses are found in Supplementary File S1.4.
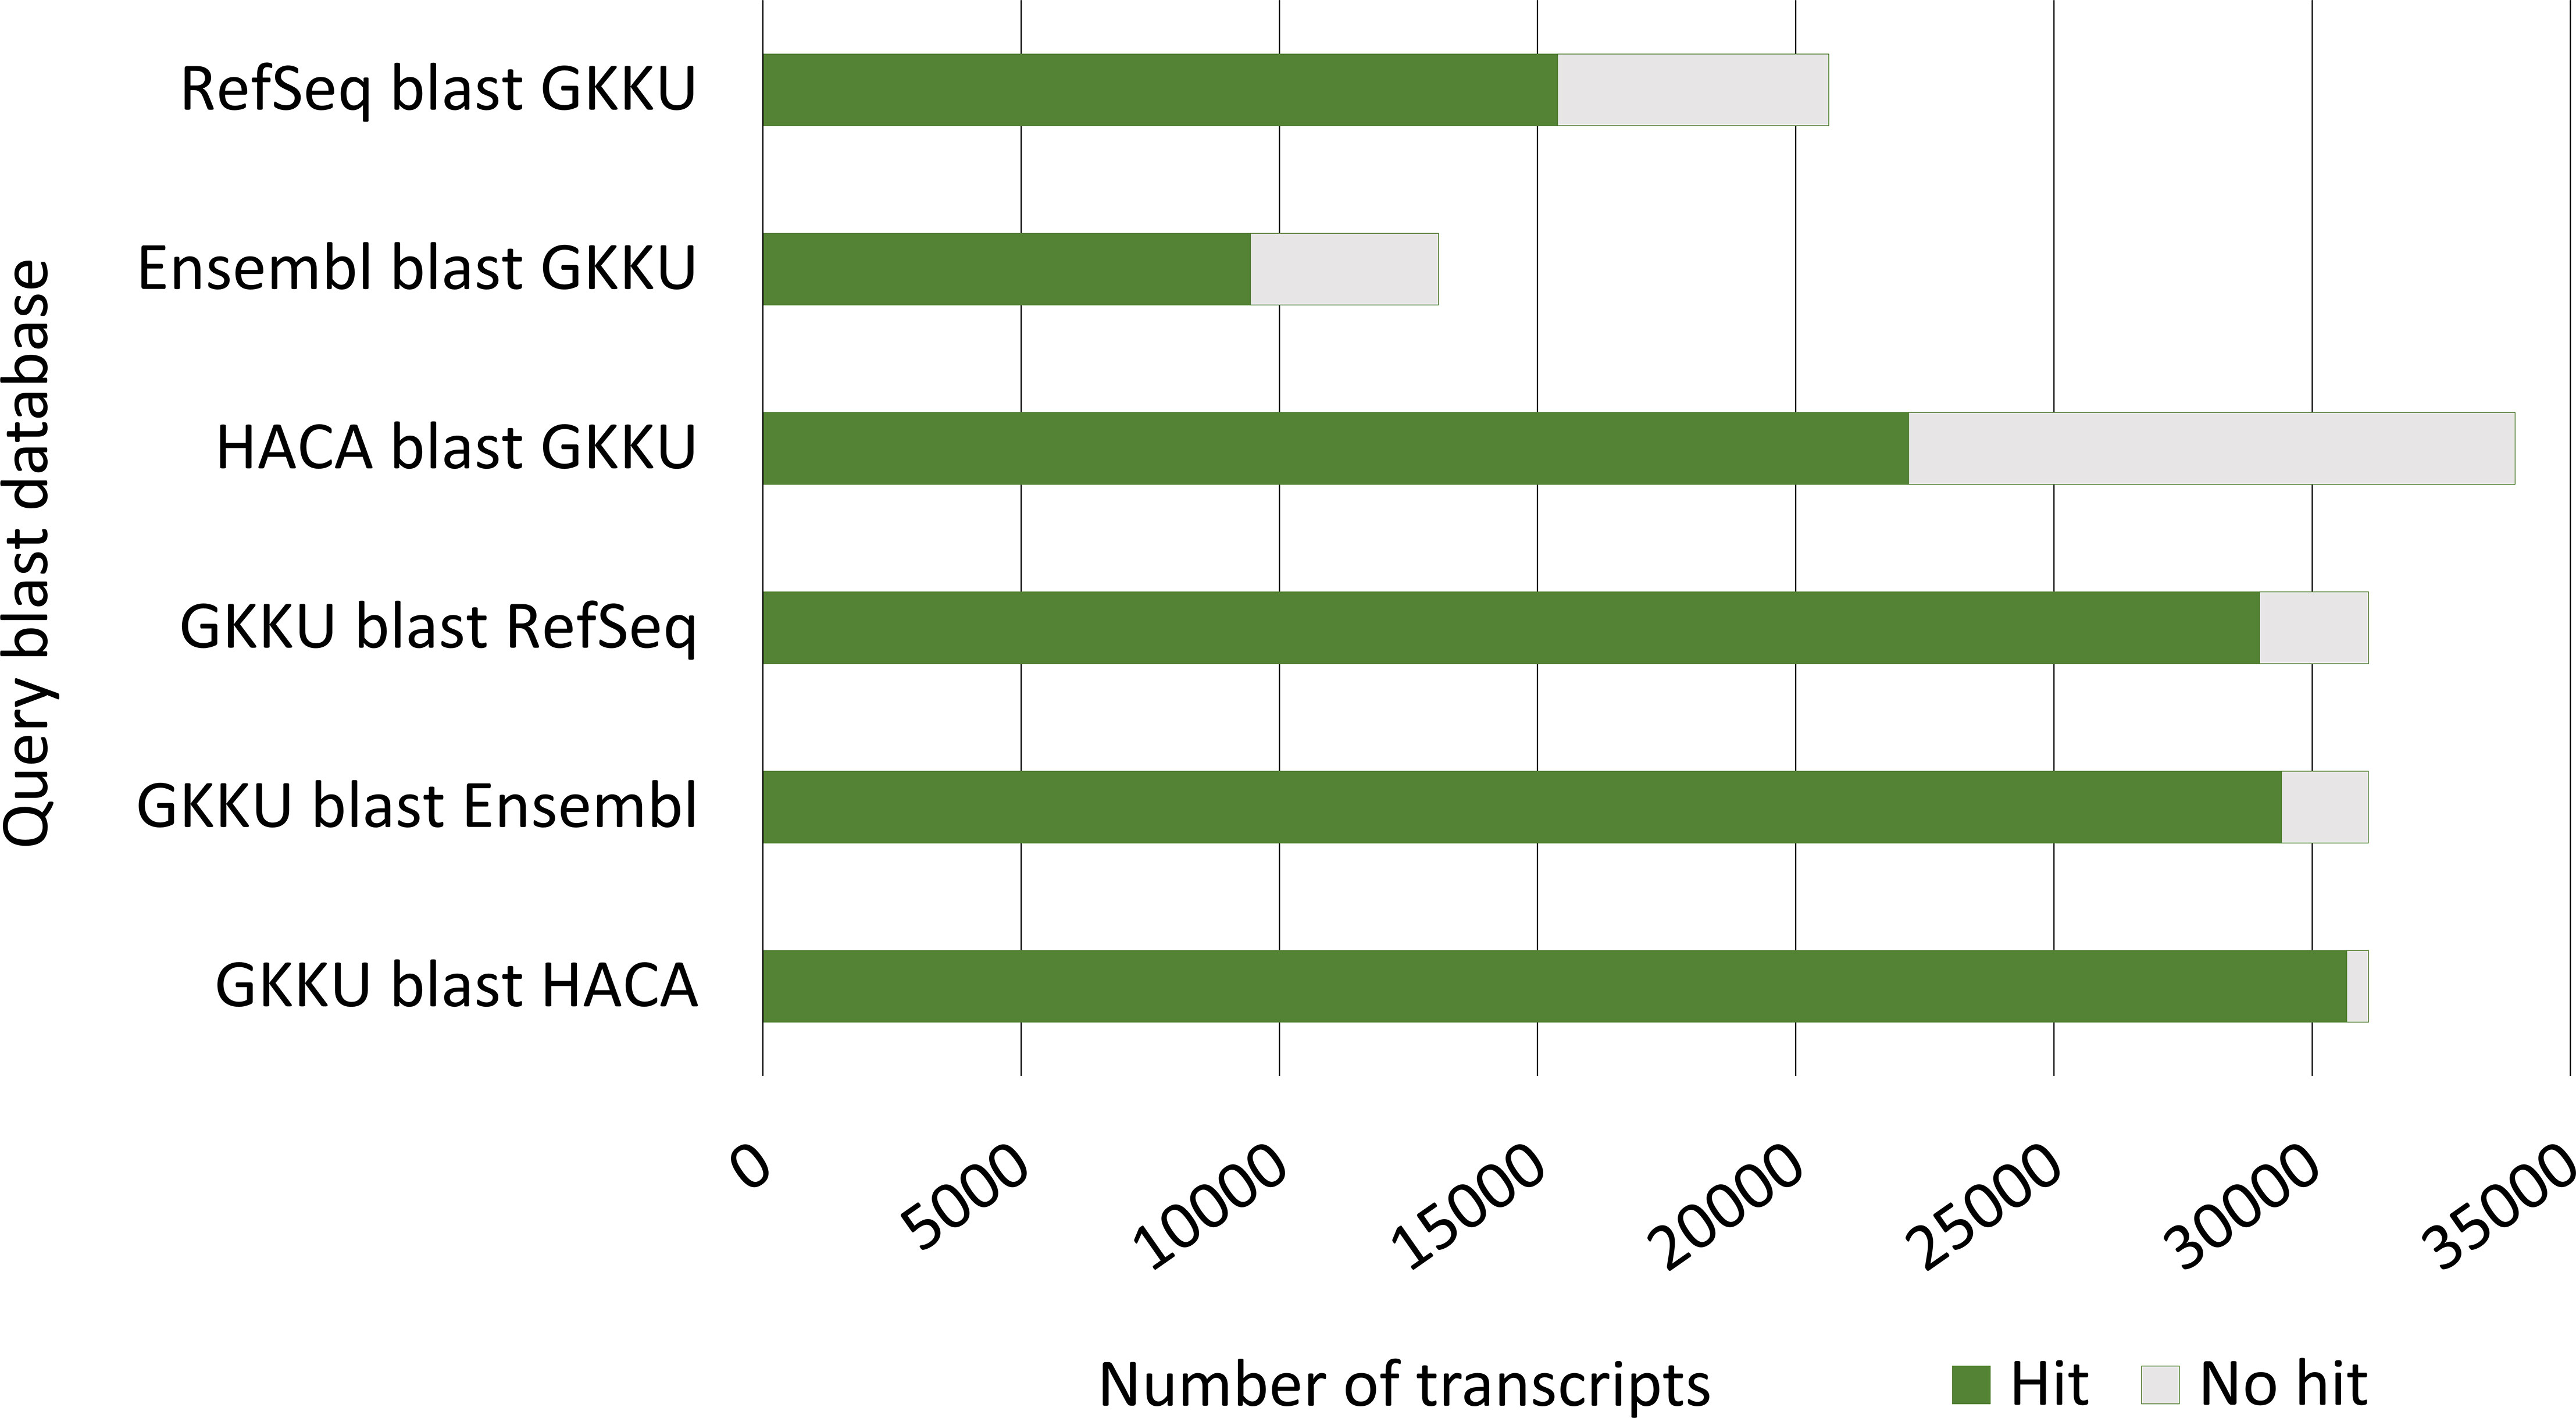
Figure 9 Number of blastn hits from the blast comparison of the current, final error-corrected mRNA transcriptome GKKU00000000 (GKKU) to the HACA00000000.1 transcriptome assembly (HACA) Carmona-Antonanzas et al. (2015), the Ensembl cDNA (Skern-Mauritzen et al., 2021; Cunningham et al., 2022) and the NCBI RefSeq mRNA O’Leary et al. (2016) from L. salmonis. The full tables of blast hits are given in Supplementary File S1.4.
Out of the transcripts that have no blast hit in either the HACA transcriptome, Ensembl cDNA or the RefSeq mRNA (Figure 9), cogent clustered transcripts constitutes 8, 21, and 31%, respectively, representing transcripts that did not align to the UVic_Lsal_1.2 genome (Joshi et al., 2022). The lower percentage for the HACA transcriptome is not surprising given that a de novo assembly approach was applied to sequences not mapping to the genome (Carmona-Antonanzas et al., 2015). The Ensembl cDNA and the RefSeq mRNA databases, however, are predicted from short reads aligning to genome assemblies and thus most cogent clustered transcripts should not be present in these datasets. The blast filter accepting hits with E-values < 10−15 may, however, also include less similar transcripts, resulting in hits for some of these transcripts.
About one-third of the transcripts in the HACA transcriptome has no significant hit in the presented mRNA transcriptome. As discussed in section 4.1.1, this may be due to the lower number of non-coding genes present in the current transcriptome resulting from removal of short RNA during library preparations and data refining of the mRNA transcriptome.
4.7 Applying the transcriptome data to a biologically relevant group of proteins: the nicotinic acetylcholine receptors
To demonstrate the applicability of the final FL transcriptome and its associated annotations, a search was performed for the pharmacologically important nicotinic acetylcholine receptors (nAChRs). The transcripts coding for nAChR subunits were extracted from the final FL transcriptome and compared with those used by Rufener et al. (2020). These were shown to express functional nAChR-subunits in the Xenopus laevis oocyte model. All nAChR subunits (α1, α2, α3, β1, and β2) were identified in the FL transcriptome. Transcripts coding for nAChR-subunits were also found in nine additional loci. In total, 32 transcripts from 14 loci were identified, the majority only in copepodids (27 transcripts in nine loci). The identification of all nAChR subunits used to functionally validate the receptors ex vivo (Rufener et al., 2020) demonstrates the completeness and accuracy of the compiled transcriptome.
The identified nAChR-subunit gene with the highest number of isoforms (uvic.3229) encodes an α7 subunit. It was further analyzed and compared with the α7 subunit from the HACA transcriptome and RefSeq sequences. Out of 13 isoforms aligning to this locus (LOC121116681), nine were annotated as “neuronal acetylcholine receptor subunit alpha-7-like”. These isoforms are presented in Figure 8A together with the comparable transcripts from the HACA transcriptome and the RefSeq sequences of this locus. The four transcripts from the HACA-transcriptome were identified as hits to at least one of the uvic.3229 isoforms in the blast analysis (E-value <10–15, see section 2.6). All 13 isoforms contain a complete CDS with the same transcription start/stop sites (indicated in Figure 8A). These transcripts exhibit a mutually exclusive splice pattern of exon 7, in contrast to the RefSeq sequence, where exons 7b and 7c are predicted to exist together.
Further information summarized from Supplementary File S1.1 for each α7 transcript is presented in Figure 8B. One isoform of the α7 (uvic.3229.24) was only identified in the female adult sample, unlike the 12 other isoforms that were solely present in the copepodids. Interestingly, this isoform lacks both exon 3 and exon 7 (Figure 8A). The comparable exon 3 of the tomato leaf miner, Tuta absoluta was found to be essential for receptor function by electrophysiological studies in X. laevis (Berger et al., 2016). This may indicate that no functionally active α7 isoform is present in the AdF salmon louse, which can be investigated by functional validation by electrophysiological studies in the X. laevis oocyte model.
4.8 Transcriptome limitations
A normal strategy for transcriptome assemblies from larger animals is to use samples of various tissues of interest (Chen et al., 2017; Yin et al., 2019; Ramberg et al., 2021). Such a strategy is challenging for the 8–18 mm AdF salmon louse and, even more so, for the copepodid life stage. In both cases, material from quite a few individuals would be necessary to retrieve enough RNA material for tissue-specific expression, where each individual would have to be micro-dissected. Especially for sparse tissues, such as nervous tissue, the precise micro-dissection would also be challenging. As a result of whole body-segment RNA extraction (as the cephalothorax of the AdF), transcripts originating from more abundant tissues such as ovaries and muscle tissue will dominate the RNA samples.
Few transcripts longer than 6,000 nt are found in the final error-corrected transcriptome. For longer transcripts, the life time of the polymerase may become limiting, and the sequence accuracy will be lower for longer sequences due to fewer passes (Rhoads and Au, 2015). Low-expressed long transcripts may therefore be under-represented in the final dataset. RNA molecules are also prone to degradation, and any degradation of fragments during the library preparation will affect the number of single-molecule FL sequences from PacBio sequencing. Although control steps prior to sequencing on both long- and short-read platforms revealed high RNA quality of both samples, and measures to reduce RNA degradation was implemented in all steps, some loss of longer transcripts cannot be excluded. Long RNAs are prone to fragmentation from the mechanic forces applied during homogenization of the robust salmon louse. Nevertheless, the length distribution pattern of the transcripts from the salmon louse are less skewed toward shorter transcripts than transcripts from other transcript databases for the salmon louse (Figure 3).
The sample size used for the presented transcriptome (n = 1 in each group) does not allow for the comparison of transcript expression between the groups (cops and AdF), although the FLNC count for a transcript in each sample indicate the expression level. With a more statistically powerful dataset, that is, more samples per group, a more thorough evaluation of expression levels and the association between expression level and transcriptome characteristics could be performed. For instance, it would be interesting to investigate if there is an association between expression levels and the number of splice variants for individual loci or how the functional categories may be expressed at different levels in the selected life stages.
4.9 Potential applications of the error-corrected transcriptome
The presented single-molecule error-corrected mRNA transcriptome provides a new standard for short-read RNA mapping for differential expression studies. The separate assemblies for the copepodids and the AdF samples provide a unique basis for the study of differential expression of genes encoding isoforms specific for the two life stages. Full-length transcripts offer the most reliable prediction of CDS, which are used for the functional annotation in this study (Supplementary File S1.1). This represents a source for further studies of gene pathways and enrichment analysis if applied in expression studies.
Since the presented method used to generate the FL transcriptome for salmon louse has already been applied on the Atlantic salmon, which is the main salmon louse host, comparable transcriptomes exist and allows for studies on host-parasite interactions. In addition, the comparable transcriptomes facilitates identifying targets for antiparasitic treatments with high efficacy on the salmon louse and low toxicity to the host. The high accuracy of reads also allows for studies of epigenetic control of gene expression through response elements located in the 3′-UTRs (Ramberg and Andreassen, 2021). Furthermore, long-read linking information could help improve contig assemblies of the L. salmonis genome.
The FL transcriptome (TSA accession GKKU00000000) represents a HQ transcriptome resource that may be further used as reference in expression studies, for SNP mining, and for predicting and determination of the biological effect of differences in gene (or isoform) expression between the copepodids and AdFs. The additional functional annotation of 88% of transcripts allows for identification of gene families of particular interest and for exploration of gene networks and enrichment analysis following expression studies.
Data availability statement
The datasets presented in this study can be found in online repositories. The names of the repository/repositories and accession number(s) can be found below: BioProject, PRJNA937046.
Ethics statement
The animal study was reviewed and approved by the Norwegian Animal Research Authority (ID 26020).
Author contributions
SAH, MJB, TEH, BH and RA contributed to conception and design of the study and interpretation of the results. SAH performed formal analysis and investigation, and wrote the first draft of the manuscript. SR did a major part of the development and implementation of the analysis pipeline and contributed to the annotation and interpretation of the analysis results. NL contributed to laboratory work and figure preparation. MJB, NL, TEH and RA wrote sections of the manuscript. MJB had main supervision and project administration responsibilities. All authors contributed to the article and approved the submitted version.
Funding
The study was funded by the Norwegian University of Life Sciences (PhD project SCRAPS) and the Norwegian Research Council (NFR325190/E40, 319756/E40). RA and SR were funded by the Norwegian Research Council (280839/E40).
Acknowledgments
We thank Lars Hamre and Per Gunnar Espedal (University of Bergen) for providing the salmon lice samples. Advice given by Ave Tooming-Klunderud (University of Oslo) was a great help when discussing the choice of approach for PacBio sequencing. Magnus C. Harr contributed with appreciated input on the downstream data processing in Unix and Python platforms.
Conflict of interest
The authors declare that the research was conducted in the absence of any commercial or financial relationships that could be construed as a potential conflict of interest.
Publisher’s note
All claims expressed in this article are solely those of the authors and do not necessarily represent those of their affiliated organizations, or those of the publisher, the editors and the reviewers. Any product that may be evaluated in this article, or claim that may be made by its manufacturer, is not guaranteed or endorsed by the publisher.
Supplementary material
The Supplementary Material for this article can be found online at: https://www.frontiersin.org/articles/10.3389/fmars.2023.1167402/full#supplementary-material
Abbreviations
AdF, Adult female; CCS, Circular consensus sequence; CDS, Coding sequence; Cops, Copepodids; EC, Error-corrected; FL, Full-length; FLNC, Full-length non-chimeric; FSM, Full splice match (SQANTI structural category); GO, Gene ontology; HQ, High-quality; ISM, Incomplete splice match (SQANTI structural category); nAChR, Nicotinic acetylcholine receptor; NIC, Novel in catalog (SQANTI structural category); NNC, Novel not in catalog (SQANTI structural category); ORF, Open reading frame; UTR, Untranslated region.
References
Aaen S., Horsberg T. (2016). A screening of multiple classes of pharmaceutical compounds for effect on preadult salmon lice Lepeophtheirus salmonis. J. Fish Dis. 39, 1213–1223. doi: 10.1111/jfd.12463
Andrews S., Krueger F., Segonds-Pichon A., Biggins L., Krueger C., Wingett S. (2012). Babraham bioinformatics. Available at: http://www.bioinformatics.babraham.ac.uk/projects/fastqc (Accessed 2022)
Assis R., Kondrashov A. S., Koonin E. V., Kondrashov F. A. (2008). Nested genes and increasing organizational complexity of metazoan genomes. Trends Genet. 24, 475–478. doi: 10.1016/j.tig.2008.08.003
Benson D. A., Cavanaugh M., Clark K., Karsch-Mizrachi I., Lipman D. J., Ostell J., et al. (2012). GenBank. Nucleic Acids Res. 41, D36–D42. doi: 10.1093/nar/gks1195
Berger M., Puinean A. M., Randall E., Zimmer C. T., Silva W. M., Bielza P., et al. (2016). Insecticide resistance mediated by an exon skipping event. Mol. Ecol. 25, 5692–5704. doi: 10.1111/mec.13882
BioBam (2019). OmicsBox-Bioinformatics made easy. Available at: https://www.biobam.com/omicsbox/ (Accessed 2022)
Borchel A., Heggland E. I., Nilsen F. (2021). The transcriptomic response of adult salmon lice (Lepeophtheirus salmonis) to reduced salinity. Comp. Biochem. Physiol. Part D: Genomics Proteomics 37, 100778. doi: 10.1016/j.cbd.2020.100778
Borchel A., Komisarczuk A. Z., Nilsen F. (2022). Sex differences in the early life stages of the salmon louse Lepeophtheirus salmonis (copepoda: caligidae). PloS One 17, e0266022. doi: 10.1371/journal.pone.0266022
Borchel A., Komisarczuk A. Z., Rebl A., Goldammer T., Nilsen F. (2018). Systematic identification and characterization of stress-inducible heat shock proteins (HSPs) in the salmon louse (Lepeophtheirus salmonis). Cell Stress Chaperones 23, 127–139. doi: 10.1007/s12192-017-0830-9
Brogna S., Wen J. (2009). Nonsense-mediated mRNA decay (NMD) mechanisms. Nat. Struct. Mol. Biol. 16, 107–113. doi: 10.1038/nsmb.1550
Carmona Antoñanzas G., Carmichael S. N., Heumann J., Taggart J. B., Gharbi K., Bron J. E., et al. (2015). A survey of the ATP-binding cassette (ABC) gene superfamily in the salmon louse (Lepeophtheirus salmonis). PloS One 10, e0137394. doi: 10.1371/journal.pone.0137394
Chen S.-Y., Deng F., Jia X., Li C., Lai S.-J. (2017). A transcriptome atlas of rabbit revealed by PacBio single-molecule long-read sequencing. Sci. Rep. 7, 1–10. doi: 10.1038/s41598-017-08138-z
Cunningham F., Allen J. E., Allen J., Alvarez-Jarreta J., Amode M. R., Armean I. M., et al. (2022). Ensembl 2022. Nucleic Acids Res. 50, D988–D995. doi: 10.1093/nar/gkab1049
Eichner C., Dondrup M., Nilsen F. (2018). Rna sequencing reveals distinct gene expression patterns during the development of parasitic larval stages of the salmon louse (Lepeophtheirus salmonis). J. 711 Fish Dis. 41, 1005–1029. doi: 10.1111/jfd.12770
Eichner C., Frost P., Dysvik B., Jonassen I., Kristiansen B., Nilsen F. (2008). Salmon louse (Lepeophtheirus salmonis) transcriptomes during post molting maturation and egg production, revealed using EST-sequencing and microarray analysis. BMC Genomics 9, 1–15. doi: 10.1186/1471-2164-9-126
Feng S., Xu M., Liu F., Cui C., Zhou B. (2019). Reconstruction of the full-length transcriptome atlas using PacBio Iso-Seq provides insight into the alternative splicing in Gossypium australe. BMC Plant Biol. 19, 1–16. doi: 10.1186/s12870-019-1968-7
Fu L., Niu B., Zhu Z., Wu S., Li W. (2012). CD-HIT: accelerated for clustering the next-generation sequencing data. Bioinformatics 28, 3150–3152. doi: 10.1093/bioinformatics/bts565
Freedman A. H., Gaspar J. M., Sackton T. B. (2020). Short paired-end reads trump long single-end reads for expression analysis. BMC Bioinform. 21 (1), 1–11. doi: 10.1186/s12859-020-3484-z
Gallardo-Escaráte C., Valenzuela-Munóz V., Nunéz-Acuná G. (2014). Rna-seq analysis using de novo transcriptome assembly as a reference for the salmon louse Caligus rogercresseyi. PloS One 9, 722 e92239. doi: 10.1371/journal.pone.0092239
Götz S., García-Gómez J. M., Terol J., Williams T. D., Nagaraj S. H., Nueda M. J., et al. (2008). High-throughput functional annotation and data mining with the Blast2GO suite. Nucleic Acids Res. 36, 3420–3435. doi: 10.1093/nar/gkn176
Haas B. (2015) Transdecoder 5.5.0. Available at: https://github.com/TransDecoder/TransDecoder/wiki (Accessed 2022).
Haas B. J., Papanicolaou A., Yassour M., Grabherr M., Blood P. D., Bowden J., et al. (2013). De novo transcript sequence reconstruction from rna-seq using the trinity platform for reference generation and analysis. Nat. Protoc. 8, 1494–1512. doi: 10.1038/nprot.2013.084
Hamre L. A., Eichner C., Caipang C. M. A., Dalvin S. T., Bron J. E., Nilsen F., et al. (2013). The salmon louse Lepeophtheirus salmonis (copepoda: caligidae) life cycle has only two chalimus stages. PloS One 8, e73539. doi: 10.1371/journal.pone.0073539
Hamre L. A., Glover K. A., Nilsen F. (2009). Establishment and characterisation of salmon louse (Lepeophtheirus salmonis (krøyer 1837)) laboratory strains. Parasitol. Int. 58, 451–460. doi: 10.1016/j.parint.2009.08.009
Hashmi S., Britton C., Liu J., Guiliano D. B., Oksov Y., Lustigman S. (2002). Cathepsin L is essential for embryogenesis and development of Caenorhabditis elegans. J. Biol. Chem. 277, 3477–3486. doi: 10.1074/jbc.M106117200
Heggland E. I., Dondrup M., Nilsen F., Eichner C. (2020). Host gill attachment causes blood-feeding by the salmon louse (Lepeophtheirus salmonis) chalimus larvae and alters parasite development and transcriptome. Parasites Vectors 13, 1–18. doi: 10.1186/s13071-020-04096-0
Helgesen K., Horsberg T. (2013). Single-dose field bioassay for sensitivity testing in sea lice, l epeophtheirus salmonis: development of a rapid diagnostic tool. J. Fish Dis. 36, 261–272. doi: 10.1111/jfd.12053
Hubley R., Finn R. D., Clements J., Eddy S. R., Jones T. A., Bao W., et al. (2016). The dfam database of repetitive DNA families. Nucleic Acids Res. 44, D81–D89. doi: 10.1093/nar/gkv1272
Huntzinger E., Izaurralde E. (2011). Gene silencing by micrornas: contributions of translational repression and mRNA decay. Nat. Rev. Genet. 12, 99–110. doi: 10.1038/nrg2936
Jacob A. G., Smith C. W. (2017). Intron retention as a component of regulated gene expression programs. Hum. Genet. 136, 1043–1057. doi: 10.1007/s00439-017-1791-x
Jaillon O., Bouhouche K., Gout J.-F., Aury J.-M., Noel B., Saudemont B., et al. (2008). Translational control of intron splicing in eukaryotes. Nature 451, 359–362. doi: 10.1038/nature06495
Jones P., Binns D., Chang H.-Y., Fraser M., Li W., McAnulla C., et al. (2014). InterProScan 5: genome-scale protein function classification. Bioinformatics 30, 1236–1240. doi: 10.1093/bioinformatics/btu031
Joshi J., Flores A.-M., Christensen K. A., Johnson H., Siah A., Koop B. F. (2022). An update of the salmon louse (Lepeophtheirus salmonis) reference genome assembly. G3 12, jkac087. doi: 10.1093/g3journal/jkac087
Kelly M. W., Pankey M. S., DeBiasse M. B., Plachetzki D. C. (2017). Adaptation to heat stress reduces phenotypic and transcriptional plasticity in a marine copepod. Funct. Ecol. 31, 398–406. doi: 10.1111/1365-2435.12725
Kent W. J. (2002). BLAT–the BLAST-like alignment tool. Genome Res. 12, 656–664. Available at: https://github.com/FelixKrueger/TrimGalore (Accessed 2022).
Kumar A. (2009). An overview of nested genes in eukaryotic genomes. Eukaryotic Cell 8, 1321–1329. doi: 10.1128/EC.00143-09
Li W., Jaroszewski L., Godzik A. (2001). Clustering of highly homologous sequences to reduce the size of large protein databases. Bioinformatics 17, 282–283. doi: 10.1093/bioinformatics/17.3.282
Martin M. (2011). Cutadapt removes adapter sequences from high-throughput sequencing reads. EMBnet J. 17, 10–12. doi: 10.14806/ej.17.1.200
Marx V. (2023). Method of the year: long-read sequencing. Nat. Methods 20, 6–11. doi: 10.1038/s41592-022-01730-w
Nam D. K., Lee S., Zhou G., Cao X., Wang C., Clark T., et al. (2002). Oligo (dt) primer generates a high frequency of truncated cDNAs through internal poly (a) priming during reverse transcription. Proc. Natl. Acad. Sci. 99, 6152–6156. doi: 10.1073/pnas.092140899
Nelson R. E., Fessler L., Takagi Y., Blumberg B., Keene D., Olson P., et al. (1994). Peroxidasin: a novel enzyme-matrix protein of Drosophila development. EMBO J. 13, 3438–3447. doi: 10.1002/j.1460-2075.1994.tb06649.x
O’Leary N. A., Wright M. W., Brister J. R., Ciufo S., Haddad D., McVeigh R., et al. (2016). Reference sequence (RefSeq) database at NCBI: current status, taxonomic expansion, and functional annotation. Nucleic Acids Res. 44, D733–D745. doi: 10.1093/nar/gkv1189
PacBio (2022) Isoseq v3: scalable de novo isoform discovery. Available at: https://github.com/PacificBiosciences/IsoSeq (Accessed 2022).
Panini M., Chiesa O., Troczka B. J., Mallott M., Manicardi G. C., Cassanelli S., et al. (2021). Transposon-mediated insertional mutagenesis unmasks recessive insecticide resistance in the aphid Myzus persicae. Proc. Natl. Acad. Sci. 118, e2100559118. doi: 10.1073/pnas.2100559118
Piednoël M., Donnart T., Esnault C., Graça P., Higuet D., Bonnivard E. (2013). Ltr-retrotransposons in R. exoculata and other crustaceans: the outstanding success of GalEa-like copia elements. PloS One 8, e57675.
Puglia G. D., Prjibelski A. D., Vitale D., Bushmanova E., Schmid K. J., Raccuia S. A. (2020). Hybrid transcriptome sequencing approach improved assembly and gene annotation in Cynara cardunculus (L.). BMC Genomics 21, 1–17. doi: 10.1186/s12864-020-6670-5
Ramberg S., Andreassen R. (2021). MicroSalmon: a comprehensive, searchable resource of predicted microRNA targets and 3'UTR cis-regulatory elements in the full-length sequenced atlantic salmon transcriptome. Non-coding RNA 7, 61. doi: 10.3390/ncrna7040061
Ramberg S., Høyheim B., Østbye T.-K. K., Andreassen R. (2021). A de novo full-length mRNA transcriptome generated from hybrid-corrected PacBio long-reads improves the transcript annotation and identifies thousands of novel splice variants in Atlantic salmon. Front. Genet. 12, 656334. doi: 10.3389/fgene.2021.656334
Rhoads A., Au K. F. (2015). PacBio sequencing and its applications. Genomics Proteomics Bioinf. 13, 278–289. doi: 10.1016/j.gpb.2015.08.002
Rufener L., Kaur K., Sarr A., Aaen S. M., Horsberg T. E. (2020). Nicotinic acetylcholine receptors: ex-vivo expression of functional, non-hybrid, heteropentameric receptors from a marine arthropod, Lepeophtheirus salmonis. PloS Pathog. 16, e1008715. doi: 10.1371/journal.ppat.1008715
Salmela L., Rivals E. (2014). LoRDEC: accurate and efficient long read error correction. Bioinformatics 30, 3506–3514. doi: 10.1093/bioinformatics/btu538
Skern-Mauritzen R., Malde K., Eichner C., Dondrup M., Furmanek T., Besnier F., et al. (2021). The salmon louse genome: copepod features and parasitic adaptations. Genomics 113, 3666–3680. doi: 10.1016/j.ygeno.2021.08.002
Smit A., Hubley R., Green P. (2013) Repeatmasker open-4.0. Available at: http://repeatmasker.org/ (Accessed 2022).
Tardaguila M., de la Fuente L., Marti C., Pereira C., Pardo-Palacios F. J., Del Risco H., et al. (2018). SQANTI: extensive characterization of long-read transcript sequences for quality control in full-length 804 transcriptome identification and quantification. Genome Res. 28, 396–411. doi: 10.1101/gr.222976.117
Tedersoo L., Tooming-Klunderud A., Anslan S. (2018). PacBio metabarcoding of fungi and other eukaryotes: errors, biases and perspectives. New Phytol. 217, 1370–1385. doi: 10.1111/nph.14776
Tseng E. (2020) Cogent: coding genome reconstruction tool. Available at: https://github.com/Magdoll/Cogent (Accessed 2022).
Warner A. H., Pullumbi E., Amons R., Liu L. (2004). Characterization of a cathepsin L-associated protein in Artemia and its relationship to the FAS-I family of cell adhesion proteins. Eur. J. Biochem. 271, 4014–4025. doi: 10.1111/j.1432-1033.2004.04338.x
Wenger A. M., Peluso P., Rowell W. J., Chang P.-C., Hall R. J., Concepcion G. T., et al. (2019). Accurate circular consensus long-read sequencing improves variant detection and assembly of a human genome. Nat. Biotechnol. 37, 1155–1162. doi: 10.1038/s41587-019-0217-9
Yin Z., Zhang F., Smith J., Kuo R., Hou Z.-C. (2019). Full-length transcriptome sequencing from multiple tissues of duck, Anas platyrhynchos. Sci. Data 6, 1–9. doi: 10.1038/s41597-019-0293-1
Keywords: salmon lice, transcriptome, long-read sequencing, full-length mRNA, PacBio Iso-seq, Illumina sequencing, aquaculture, RNA sequencing
Citation: Hansen SAH, Ramberg S, Lekanova N, Høyheim B, Horsberg TE, Andreassen R and Bakke MJ (2023) De novo high-accuracy transcriptomes from long-read sequencing reveals a wide variety of novel splice variants in copepodids and adult female salmon lice (Lepeophtheirus salmonis). Front. Mar. Sci. 10:1167402. doi: 10.3389/fmars.2023.1167402
Received: 16 February 2023; Accepted: 22 May 2023;
Published: 04 July 2023.
Edited by:
Armin Sturm, University of Stirling, United KingdomReviewed by:
Cristian Gallardo-Escárate, University of Concepcion, ChileMbaye Tine, Gaston Berger University, Senegal
Copyright © 2023 Hansen, Ramberg, Lekanova, Høyheim, Horsberg, Andreassen and Bakke. This is an open-access article distributed under the terms of the Creative Commons Attribution License (CC BY). The use, distribution or reproduction in other forums is permitted, provided the original author(s) and the copyright owner(s) are credited and that the original publication in this journal is cited, in accordance with accepted academic practice. No use, distribution or reproduction is permitted which does not comply with these terms.
*Correspondence: Sine Alise Hartvigsen Hansen, sine.alise.hartvigsen.hansen@nmbu.no