Biogeographic distribution patterns of the bacterial and archaeal communities in two seamounts in the Pacific Ocean
 Ning-Hua Liu
 Jun Ma
 Si-Qi Lin1
  Kui-Dong Xu
 Yu-Zhong Zhang
 Qi-Long Qin
 Xi-Ying Zhang
- 1State Key Laboratory of Microbial Technology, Marine Biotechnology Research Center, Shandong University, Qingdao, China
- 2Chinese Academy of Sciences (CAS) Key Laboratory of Marine Ecology and Environmental Sciences, Institute of Oceanology, Chinese Academy of Sciences, Qingdao, China
- 3Laboratory of Marine Organism Taxonomy and Phylogeny, Shandong Province Key Laboratory of Experimental Marine Biology, Center for Ocean Mega-Science, Institute of Oceanology, Chinese Academy of Sciences, Qingdao, China
- 4College of Marine Life Sciences, and Frontiers Science Center for Deep Ocean Multispheres and Earth System, Ocean University of China, Qingdao, China
- 5Laboratory for Marine Biology and Biotechnology, Pilot National Laboratory for Marine Science and Technology, Qingdao, China
Seamounts are important components of seafloor topography and have a significant influence on the biogeographic distribution of marine microorganisms. However, current studies on the biogeographic distribution patterns of microorganisms in the ocean around seamounts are still inadequate. This study investigated the bacterial and archaeal communities present in the water column at various depths around the Kocebu and M5 seamounts located in the western Pacific Ocean using 16S rRNA gene high-throughput sequencing. The analyses showed that microbial communities had different alpha diversities and species compositions in samples from the same depth, and disruption of vertical stratification of microbes was observed in deep water layers at both seamounts. The stochastic processes dominated the microbial community assembly around two seamounts, for the Kocebu Seamount, drift accounted for 34.99% and 64.85% in the bacterial and archaeal community assembly processes, respectively; while the corresponding values for the M5 Seamount were 14.07% and 58.65%. Despite the low explanatory power of environmental variables for microbial communities, dissolved inorganic nitrogen was the most significant factor influencing the microbial community structure in seawater around seamounts. Overall, our results revealed that the presence of Kocebu and M5 seamounts enhance the vertical mixing of microbial communities in the surrounding seawater, and stochastic processes dominate microbial community assembly. Considering the numerous seamounts in the global ocean, the impacts of seamounts on marine ecosystems and biogeochemical cycles may have been underestimated.
1 Introduction
Seamounts are undersea mountains with summits below the surface of the water, which are widespread and prominent features of underwater ocean topography with estimated numbers up to 200,000 on Earth (Supplementary Figure 1) (Wessel et al., 2010; Yesson et al., 2011). Seamounts provide various habitats and environmental conditions for benthic organisms (Clark et al., 2010). In addition, seamounts significantly influence global ocean circulation patterns and generally facilitate seawater mixing, providing more nutrients for marine plankton and thus making seamounts “hotspots” of marine life, which is known as the “seamount effect” (de Forges et al., 2000; Morato et al., 2010; Rogers, 2018; Voosen, 2022).
Microorganisms represent the most diverse and abundant form of life on the planet and play crucial roles in biogeochemical cycles in oceanic and terrestrial environments (Falkowski et al., 1998; Doney et al., 2012). Although the ocean represents a contiguous aquatic environment, the biogeographical distribution of microorganisms in the ocean varies significantly and is influenced by many factors, such as latitude, depth, temperature, regional blooms, and other environmental variables (Chow and Suttle, 2015; Sunagawa et al., 2015; Cao et al., 2020; Aalto et al., 2022; Richter et al., 2022). Previous studies have indicated that the biogeographical distribution of marine microorganisms can be influenced by seamounts, which are mainly characterized by increased biomass and enhanced mixing (Mendonca et al., 2012; Djurhuus et al., 2017; Sun et al., 2020; Dai et al., 2022; Zhao et al., 2022). However, there is a lack of studies on the biogeographical distribution of microorganisms in seawater around seamounts.
Community assembly at any given environment is primarily driven by diversification, dispersal, selection and drift (random events). They are the important components of stochastic and deterministic processes in the microbial community assembly (Fargione et al., 2003; Chave, 2004; Chow and Suttle, 2015; Zhou and Ning, 2017). Stochastic and deterministic processes co-drive the marine microbial community assembly, and different taxa may be structured by different processes (Livermore and Jones, 2015; Sunagawa et al., 2015; Logares et al., 2020; Ward et al., 2021; Milke et al., 2022; Zhao et al., 2022; Zhu et al., 2022). The complex hydrological environment (including upwelling, turbulence, internal waves, mesoscale ocean eddies and other physical ocean phenomena) around seamounts can enhance the diversity and dynamics of microbial communities (Lavelle, 2006; Lavelle and Mohn, 2010; Read and Pollard, 2017; van Haren et al., 2017; Vic et al., 2019). Therefore, studying the effects of seamounts on the distribution of microbial communities in the seawater around them will improve our understanding of the microbial community assembly process across small spatial scales in ocean.
Although much interest has been generated by the studies of microbial community associated with seamounts, our understanding of the microbiology of seamounts is still in its infancy (Emerson and Moyer, 2010; Rogers, 2018). To better understand the influence of water-column hydrodynamics associated with seamounts on microbial community structure and dynamics, two different seamounts (the Kocebu Seamount and the M5 Seamount) were chosen as targets for this study (Figure 1). Through high-throughput sequencing and analysis of bacterial and archaeal 16S rRNA gene, the biogeographic distribution patterns and possible community assembly mechanisms of microorganisms in the water surrounding these two seamounts were explored.
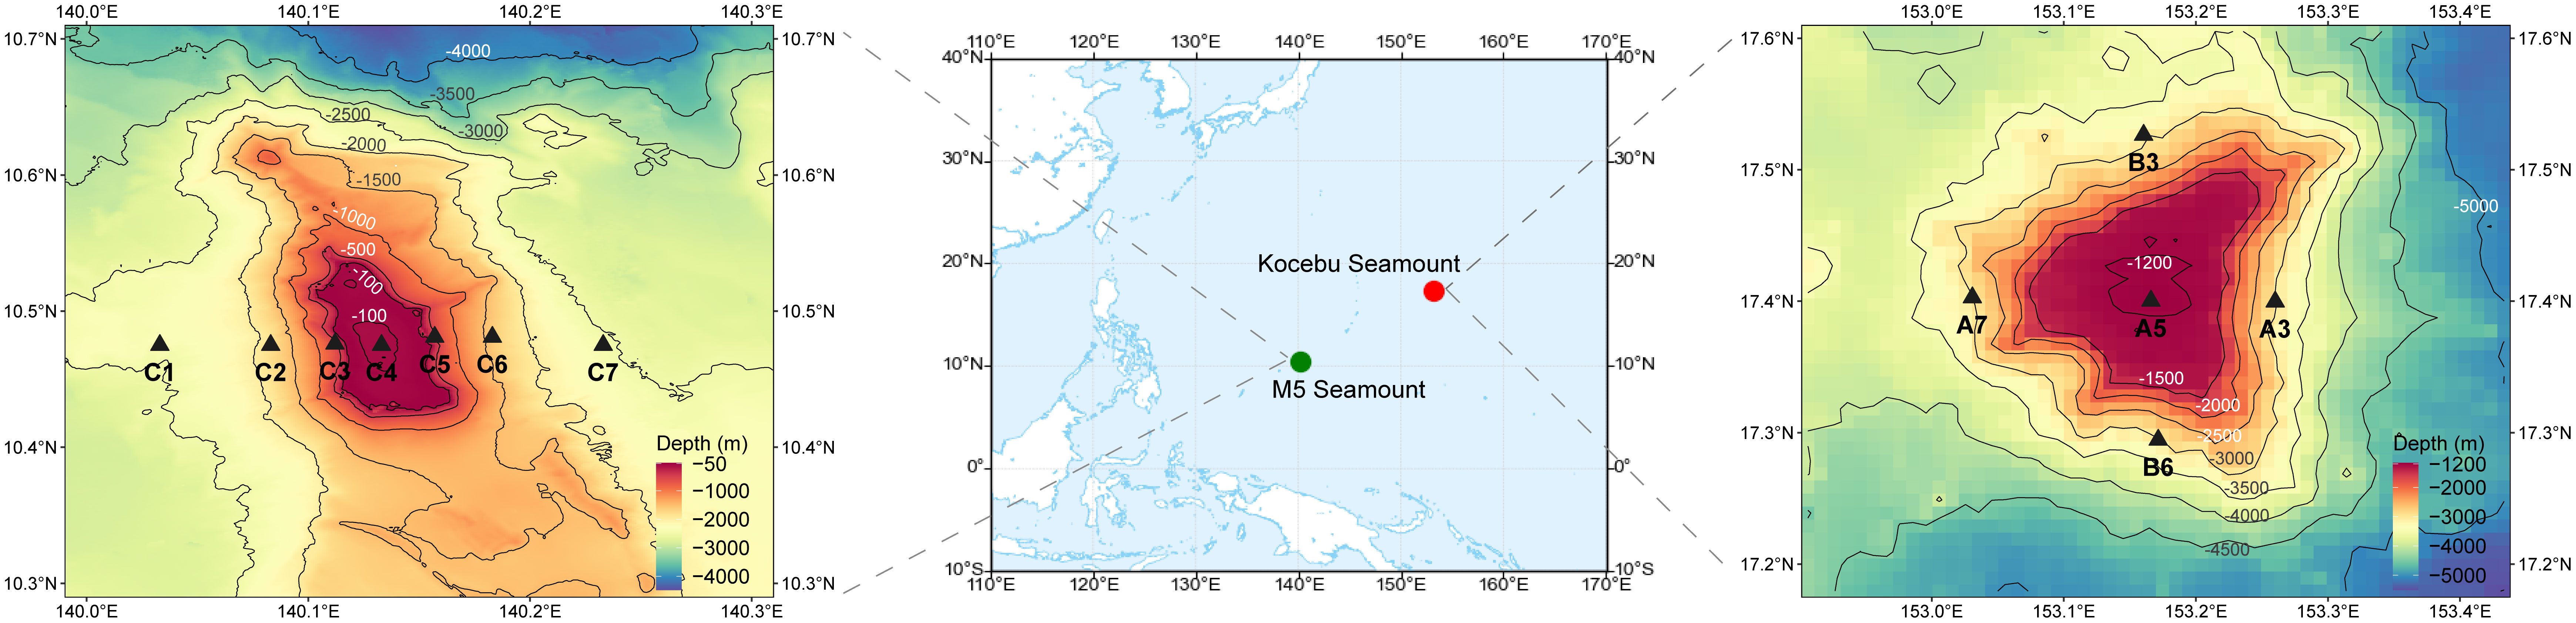
Figure 1 Sampling sites and topographic maps of the M5 Seamount and Kocebu Seamount. Thirty-eight and fifty-five samples at various depths were collected from the Kocebu Seamount and M5 Seamount, respectively. Detailed sampling information was shown in Supplementary Table S1.
2 Materials and methods
2.1 Sample and environmental data collection
The Kocebu Seamount (153.16° E, 17.40° N) is located west of the Mariana Trench and is part of the Magellan Seamounts. The Kocebu Seamount is a typical deep guyot, with a summit area of approximately 188 km2, a peak depth of 1,195 m, and a seamount height of 4,300 m. Thirty-eight samples from five sites (A3, A5, A7, B3, B6) were collected from the Kocebu Seamount during the “Kexue” 201802 cruise in March 2018 (Figure 1). Details of each sample are shown in Supplementary Table 1, and the mean depth of the deep chlorophyll maximum (DCM) layer in Kocebu Seamount is 161 m.
The M5 Seamount (140.11° E, 10.48° N) is located on the Caroline Seamounts and is situated southwest of the Mariana Trench. The M5 Seamount is a shallow seamount, a peak depth of 50 m, with a notch at the summit and a seamount height of 2,500 m. Fifty-five samples from seven sites (C1, C2, C3, C4, C5, C6, C7) were collected from the M5 Seamount during the “Kexue” 201902 cruise in June 2019 (Figure 1). Details of each sample are shown in Supplementary Table 1, and the mean depth of DCM layer in M5 Seamount is 107.5 m.
Niskin bottles (KC-Denmark, Denmark) were used to collect seawater samples at various pre-set depths (details of sampling depth for each sample are shown in Supplementary Table 1). CTD (conductivity-temperature-depth system, Sea-bird SBE911, USA) was used to determine the temperature and salinity of the seawater at each depth. The concentrations of nutrients, including NO3-N, NO2-N, PO4-P, SiO3-Si, NH4-N, DIC (dissolved inorganic carbon), TOC (total organic carbon), TN (total nitrogen), TP (total phosphorus) and chlorophyll-a (Chl a), were measured in accordance with the National Specification for Oceanographic Survey (GB12763.6-2007, China). For each sample, 5 L of seawater was filtered onto a 0.22-μm pore-size membrane (Millipore Corporation, Billerica, MA, USA). Then, the membranes were quickly frozen in liquid nitrogen and stored at -80°C until DNA extraction.
2.2 DNA extraction and sequencing
Total nucleic acids were extracted using a PowerWater® DNA Isolation Kit (MOBIO, USA) following the manufacturer’s protocol. The V4-V5 hypervariable regions of bacterial 16S ribosomal RNA (rRNA) genes were amplified using a barcoded sequencing primer 515F (5’-GTGCCAGCMGCCGCGGTAA-3’) and 907R (5’-CCGTCAATTCMTTTRAGTTT-3’), while the V4-V5 hypervariable regions of archaeal 16S rRNA genes were amplified using a primer 524F (5’-TGYCAGCCGCCGCGGTAA-3’) and 958R (5’-YCCGGCGTTGAVTCCAATT-3’). All of these amplicons from different samples were sequenced using the Illumina MiSeq PE300 sequencing platform at Frasergen (Wuhan, China).
2.3 Sequencing data processing and statistical analyses
Sequenced reads were mainly processed by QIIME2 (qiime2-2020.8) (Bolyen et al., 2019), with the following steps: (i) all 16S rRNA sequencing reads were demultiplexed and quality-filtered by dada2 (Callahan et al., 2016); (ii) the operational taxonomic units (OTUs) were clustered with a 97% similarity cutoff by VSEARCH (Rognes et al., 2016), and OTUs with relative abundance below 0.001% were removed; (iii) all OTUs were randomly subsampled to ensure an equal number of sequences in each sample by the “Vegan” package in R (Dixon, 2003); (iv) the rooted tree was computed by QIIME2 with command “align-to-tree-mafft-fasttree”; (v) feature sequences were annotated by feature classifiers, which were trained with special primers base on the Greengenes (Release 13.8) 16S rRNA gene database (DeSantis et al., 2006). The feature table, taxonomy data and rooted tree data were exported from QIIME2 with “qza” format for subsequent analysis.
Data visualization and statistical analyses were mainly performed using the “MicrobiotaProcess” (Xu et al., 2023) package in R: (i) the rarefaction curves of samples were obtained by resampling to demonstrate the saturation of the each sample with “ggrarecurve” function; (ii) the alpha diversity indices (Chao1, Shannon-Wiener index, observe OTU, Pielou’s evenness) for each sample were calculated with “get_alphaindex” function and analysis of variance (ANOVA) was employed to assess the differences among samples from depth groups; (iii) principal component analysis (PCA) was performed on community composition dissimilarities (Bray-Curtis distance) that were based on the Hellinger-transformed bacterial and archaeal OTU matrices with “get_pca” function; Permutational MANOVA (adonis) in “Vegan” package in R was used to indicate the bacterial and archaeal community differences between samples at different depths. The correlation analysis of environmental factors and microbial community composition was performed by the “linkET” package in R. The hierarchical partitioning method was used to determine the contribution of environmental factors to community structure via the “rdacca.hp” package in R with “rdacca.hp” function (method = “dbRDA”) (Lai et al., 2022). The β-nearest taxon index (βNTI) and bray-curtis-based raup-crick (RCbray) based on null model were calculated to assess the community assembly processes with “microeco” package in R, using the “trans_nullmodel” function (with the “feature-table” and “rooted-tree”) (Liu et al., 2021). Other R packages used in this study are listed in the Supplementary Materials.
2.4 Data availability
Sequencing data were archived at National Centre for Biotechnology Information (NCBI) under the BioProject PRJNA903284. Scripts related to the amplicon analysis process and results visualization are available at https://github.com/liuninghua521/Amplicon-analysis-and-visualization.
3 Result
3.1 Environmental characteristics of two seamounts
The Kocebu Seamount is a typical deep guyot, while the M5 Seamount is a typical shallow seamount with a straight-line distance of approximately 1,600 km between them. The general trend in the variation of multiple environmental factors (except NH4-N) with depth was similar for both seamounts (Figure 2). The concentrations of DIC (dissolved inorganic carbon), TOC (total organic carbon) and TN (total nitrogen) in Kocebu Seamount were higher than those in M5 Seamount, while the concentrations of TP (total phosphorus) in M5 Seamount were higher than those in Kocebu Seamount (Wilcoxon’s rank-sum test, P < 0.05). The concentrations of TN, TP, and NH4-N varied markedly among samples at the same depth for the two seamounts.
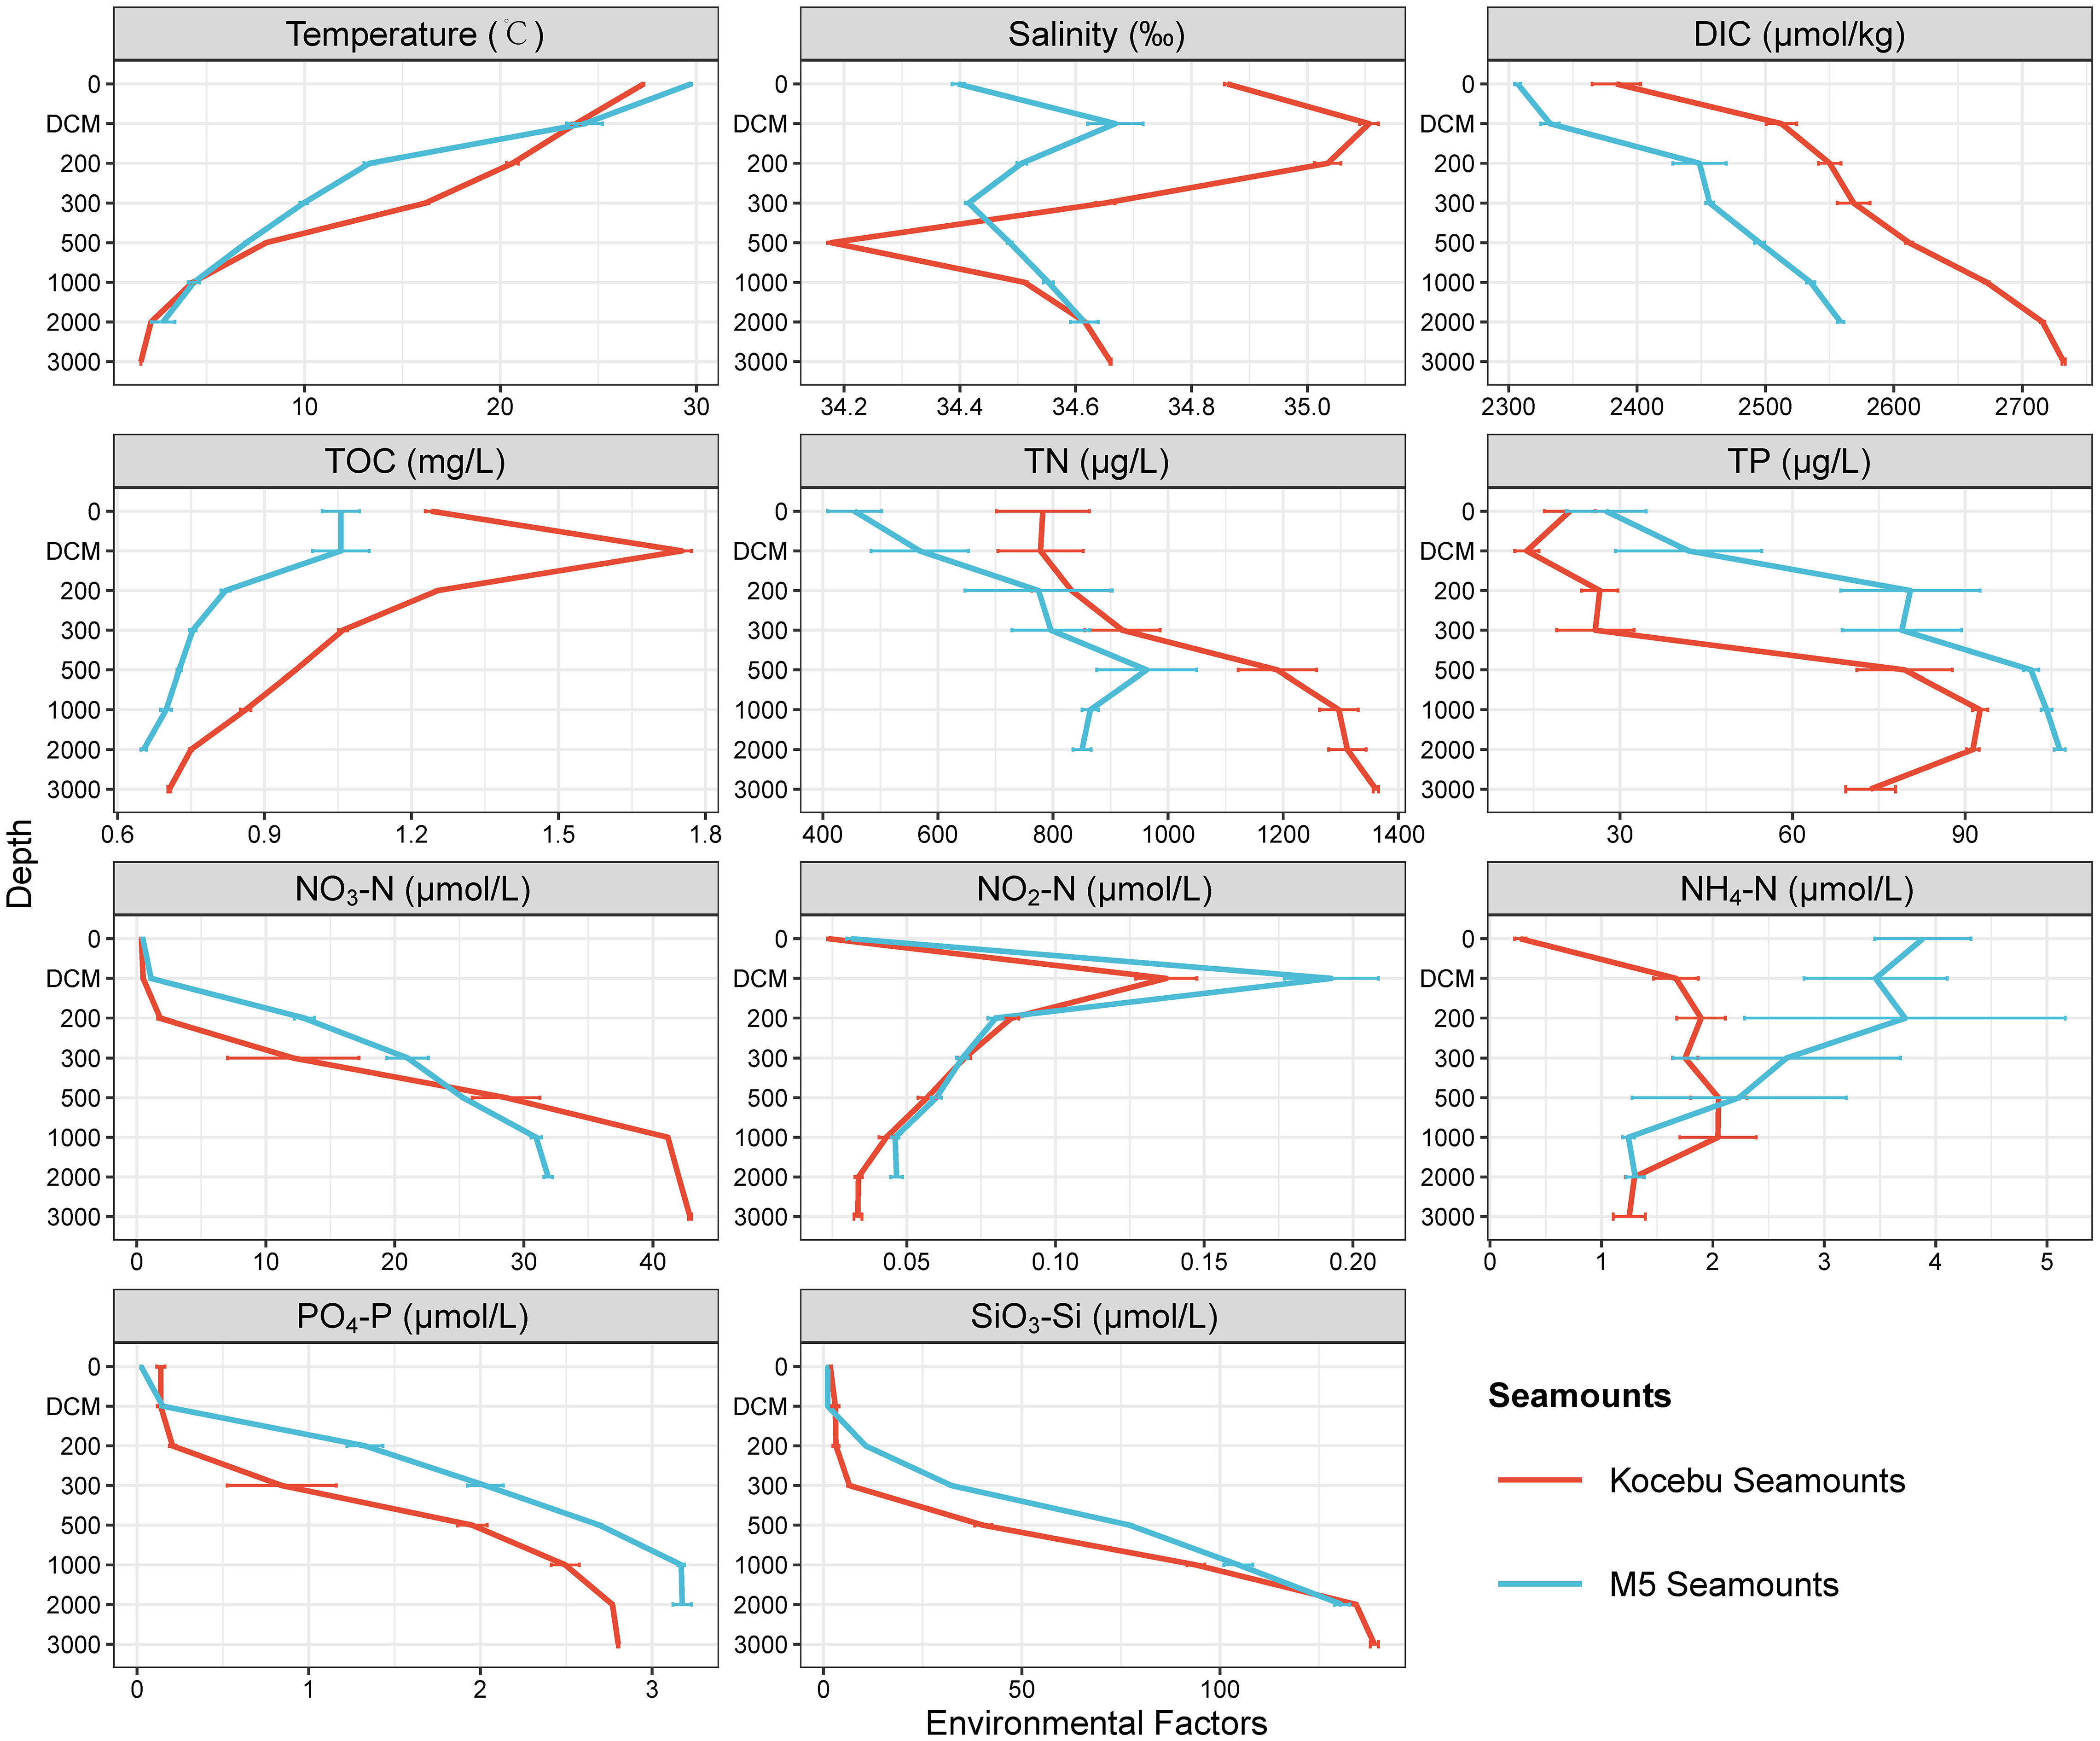
Figure 2 Environmental factors of seawater samples from different depth layers of the two seamounts. Red lines indicate the mean value of samples from the Kocebu Seamount, blue lines indicate mean value of samples from the M5 Seamount, the error bar represents standard deviation of samples from different sites at the same depth. “DIC”, “TOC”, “TN” and “TP” refer to “dissolved inorganic carbon”, “total organic carbon”, “total nitrogen” and “total phosphorus”, respectively. The mean depth of the deep chlorophyll maximum (DCM) layer in Kocebu Seamount is 161 m, and the mean depth of DCM layer in M5 Seamount is 107.5 m.
The Kocebu Seamount was located at the edge position of the Western Pacific Warm Pool and the M5 Seamount was located at the core of Western Pacific Warm Pool (Gan and Wu, 2011; Sun et al., 2013). According to the T-S diagram (T-temperature, S-salinity of sea water, Supplementary Figure 2) and related reports (Hu et al., 2015; Ma et al., 2020), the water masses in Kocebu Seamount region can be divided into North Pacific Tropical Water (NPTW, 0-200 m), North Pacific Intermediate Water (NPIW, 250-600 m), and deep water (DW, >700 m); while for the M5 Seamount, they are Surface Water (SW, 0-50 m), NPTW (75-150 m), NPIW (200-800 m), and DW (>1000 m) (Ma et al., 2023).
Besides, previous studies have investigated the hydrological environment around the Kocebu Seamount and the M5 Seamount in detail by examining the physical processes and the nutrient distribution characteristics of each seamount, respectively (Dai et al., 2020; Ma et al., 2021; Dai et al., 2022). Analyses in these studies revealed that isotherms or isohalines were uplifted to varying degrees at different water depths, and that the average concentrations of most biogenic elements were generally higher at sites near the summits than those at sites far from the two seamounts. In addition, analyses also found that the currents showed disorderly flows below 500 m water depth at the Kocebu Seamount and below 100 m water depth at the M5 Seamount. Analysis in these studies revealed that both seamounts exhibited “seamount effects”.
3.2 α-Diversity of bacterial and archaeal community
A total of 4,814 bacterial OTUs and 446 archaeal OTUs were recovered from the Kocebu Seamount samples, and a total of 4,793 bacterial OTUs and 2,033 archaeal OTUs were recovered from the M5 Seamount samples. The observed OTU rarefaction curves of bacterial and archaeal community were saturated for samples from both seamounts (Supplementary Figure 3).
The Chao1 index was used to indicate the richness of the bacterial and archaeal communities at different water depths (Figure 3). Both seamounts had the minimum Chao1 richness in the surface (0 m) layer, while the maximum richness occurred at different depths; the deep layers had higher mean Chao1 richness than the upper layers, and the variation of Chao1 richness among samples at the same depth was also higher in the deep layers than in the upper layers. Similar patterns were also observed in the Shannon-Wiener index and Pielou’s evenness index from samples of both seamounts (Supplementary Figure 4). And the bacterial and archaeal Chao1 richness varied with depth differently in the same seamount. For instance, Chao1 richness of archaea increased with water depth at the Kocebu Seamount, but this trend was not observed for bacteria. Analysis of variance (ANOVA) showed a significant difference (P < 0.05) in the Chao1 index between most water layers.
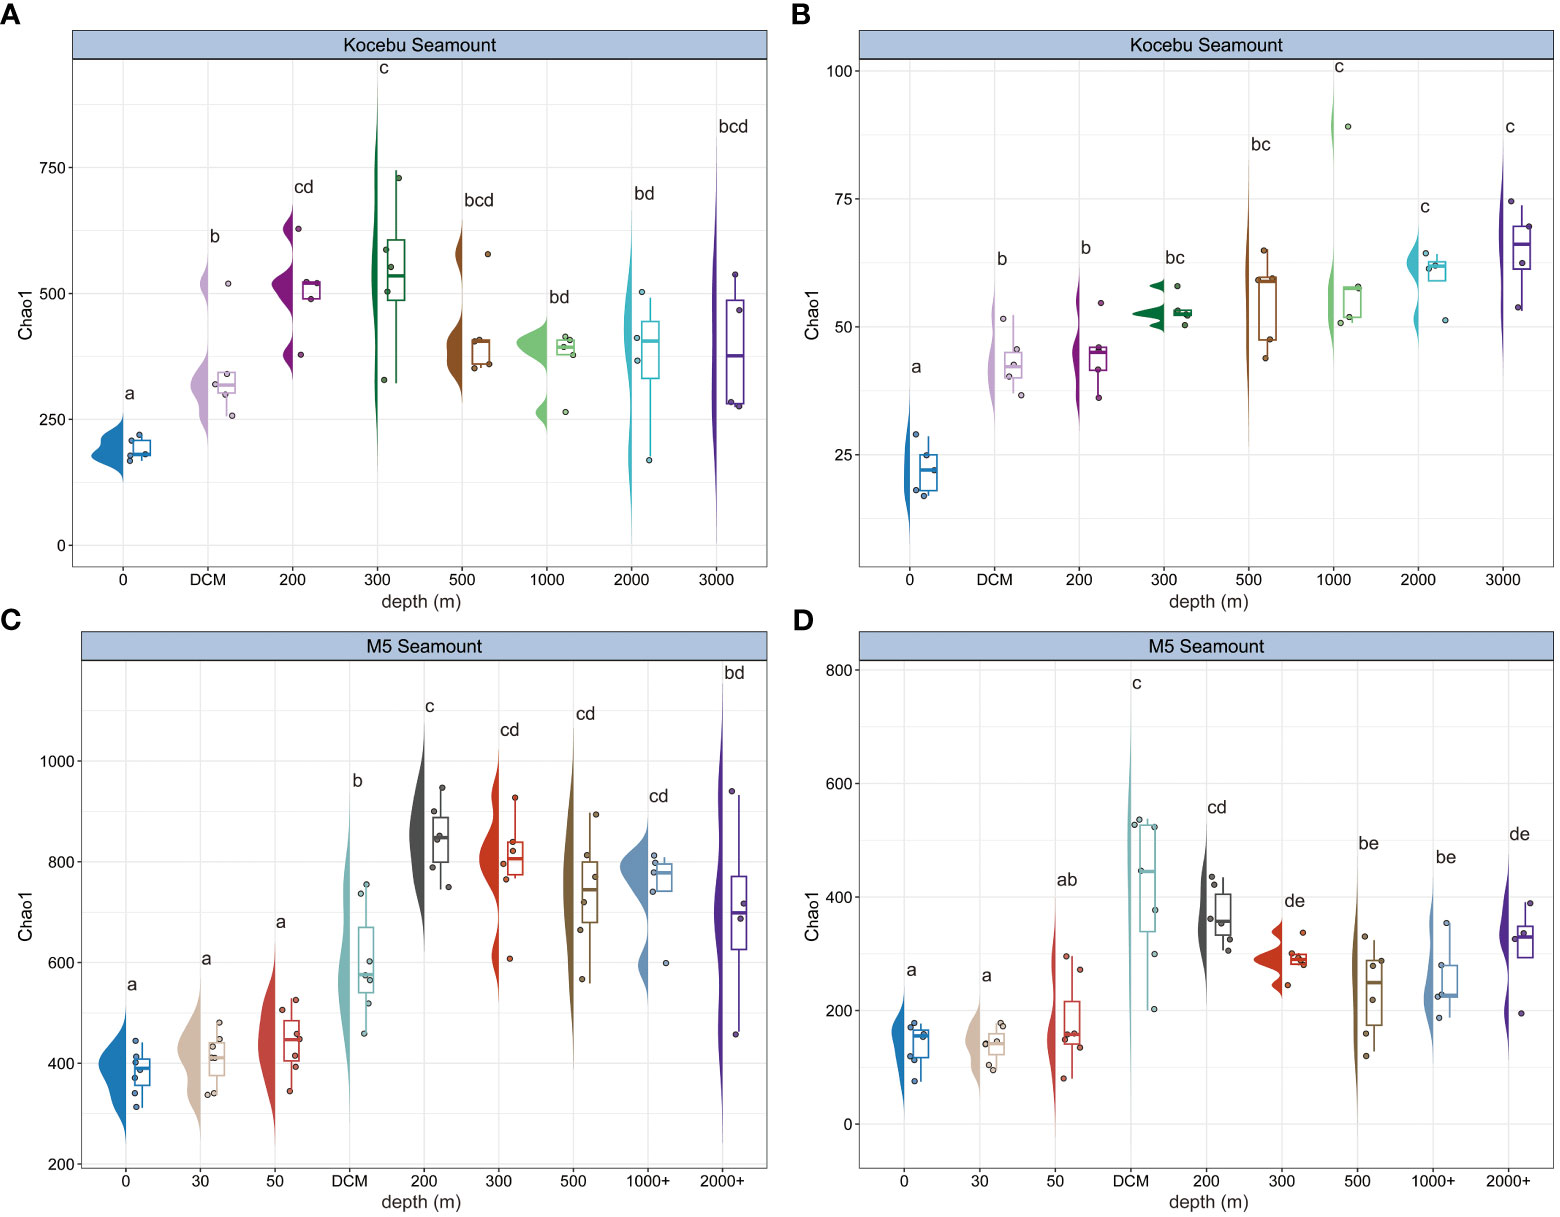
Figure 3 Chao1 richness along the sampling depth range for bacterial (A, C) and archaeal (B, D) community from samples in the seawater around two seamounts. Letter(s) above the box was used to indicate significant differences among water layers based on ANOVA, the same letter(s) indicates no significant difference between groups. The mean depth of the deep chlorophyll maximum (DCM) layer in Kocebu Seamount is 161 m, and the mean depth of DCM layer in M5 Seamount is 107.5 m.
3.3 Bacterial and archaeal community composition
The community composition of samples from the two seamounts was analyzed at the phylum level for Bacteria and at the genus level for Archaea. Overall, our results of microbial community composition agreed with previous studies (Sun et al., 2020; Zhao et al., 2022). For Bacteria (Figures 4A, B), Proteobacteria (Pseudomonadota) and Cyanobacteria (above the DCM layer) were the dominant phyla. The relative abundance of Proteobacteria increased with water depth, with average relative abundances ranging from 27.6% to 71.0% and from 48.2% to 84.4% in samples from the Kocebu and M5 Seamounts, respectively. For Archaea (Figures 4C, D), genera belonging to Marine Group II (39.32%, 40.43%), Nitrosopumilus (24.69%, 28.36%), genera belonging to Marine Group III (19.87%, 10.55%) and genera belonging to Cenarchaeaceae (11.32%, 20.20%) were the dominant archaeal genera in samples from both the Kocebu and M5 Seamounts. Furthermore, there were differences in species composition between sites with the same depth horizontally (Supplementary Figure 6). In summary, the dominant bacterial phylum and archaeal genera were similar, but their relative abundances varied greatly among different samples, even within the same depth.
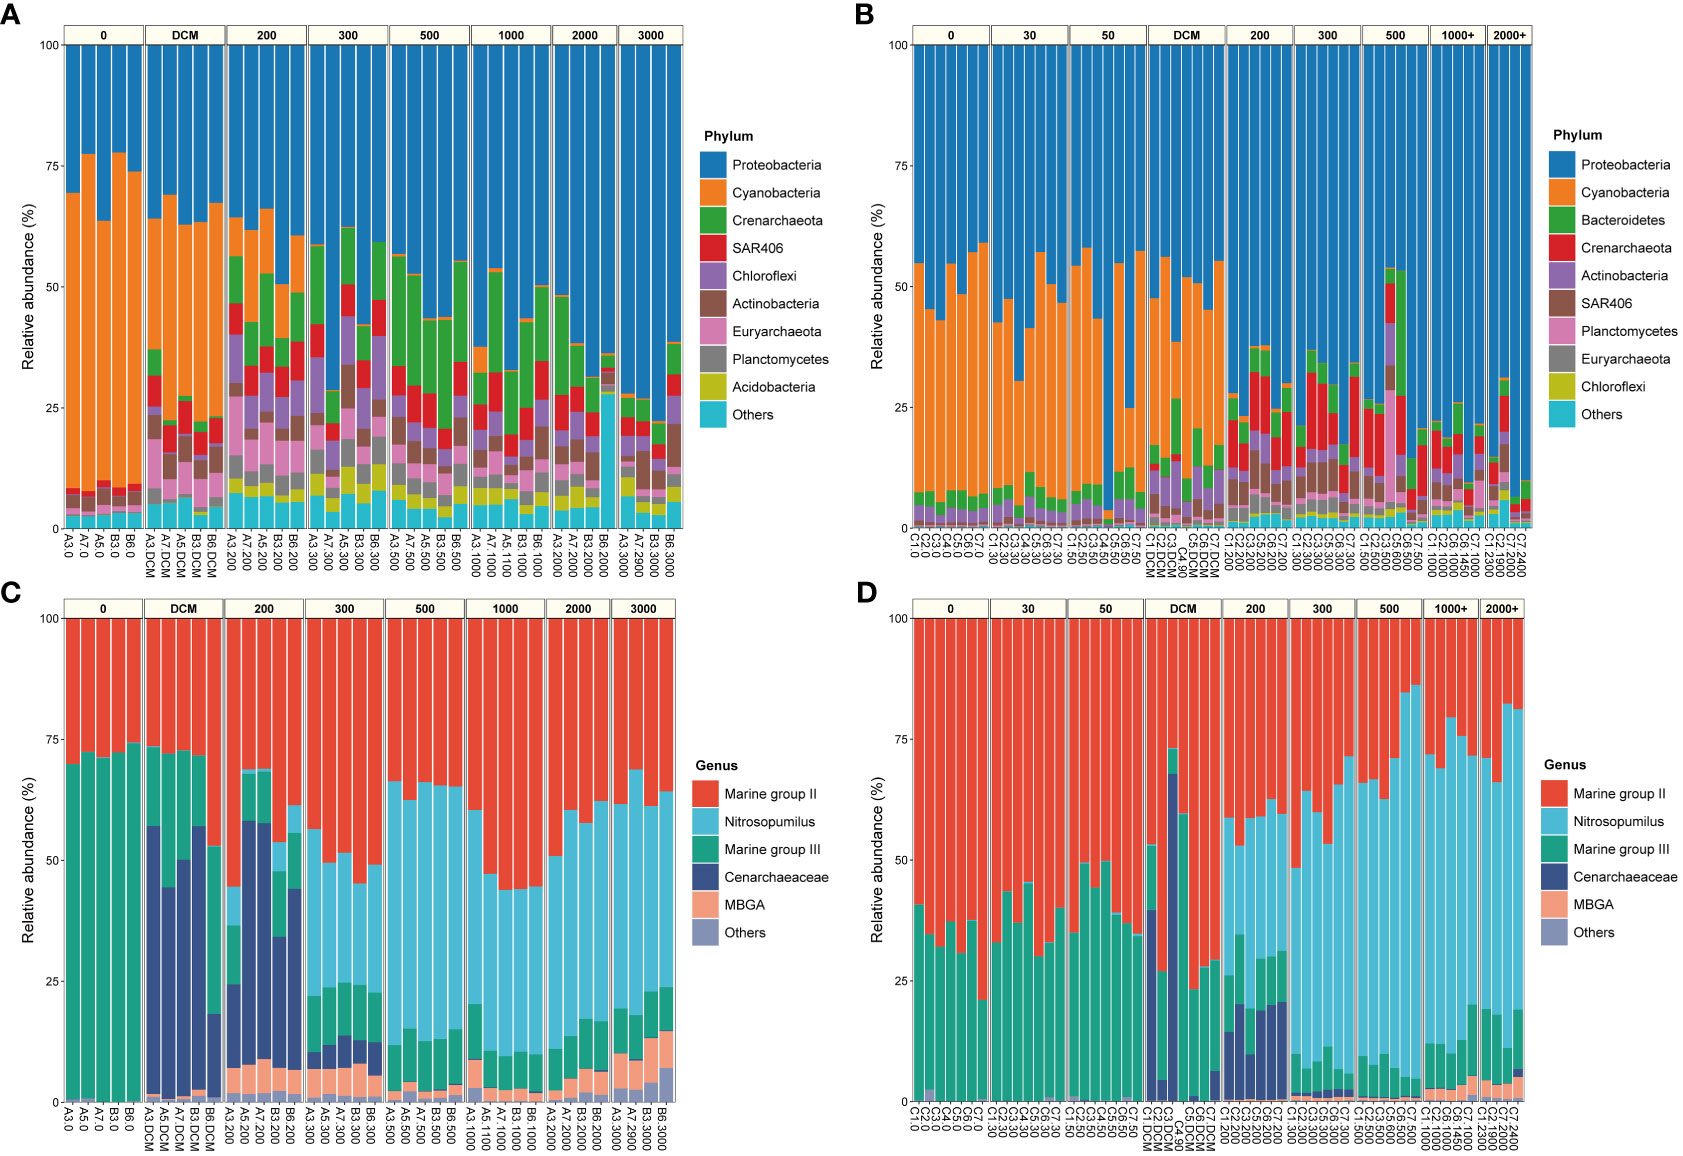
Figure 4 The community composition and relative abundance of bacteria at phylum-level and archaea at genus-level of samples in seawater around the Kocebu Seamount (A, C) and the M5 Seamount (B, D). Marine group II, g:un_f:Marine group II; Marine group III, g:un_f:Marine group III; Cenarchaeaceae, g:un_f:Cenarchaeaceae; MBGA, g:un_c:MBGA. The mean depth of the deep chlorophyll maximum (DCM) layer in Kocebu Seamount is 161 m, and the mean depth of DCM layer in M5 Seamount is 107.5 m.
3.4 β-Diversity of bacterial and archaeal community
Principal component analysis (PCA) revealed that the samples from the 0 m, DCM, 200 m, 300 m and 500 m layers in the Kocebu Seamount were distinct from each other, but showed similarity among samples from other layers (Figures 5A, B). For the M5 Seamount, the 200 m layer was a boundary that divided the samples into two groups: one group consisted of samples from the 0 m, 30 m, 50 m, and DCM layers, and the other group comprised samples from the rest of the depths. (Figures 5C, D). Permutational MANOVA (adonis) based on Bray-Curtis distance matrices demonstrated that bacterial and archaeal communities differed significantly among samples at different depths overall (P < 0.05). Based on the results of PCA analysis, the samples from each seamount were divided into upper and deep layers for a further adonis test. The results showed that the effect of depth stratification on the differences between bacterial and archaeal communities was weaker in deep-water samples (Supplementary Table 2). These results indicated that deep water microbial communities were more similar to each other than to those from upper waters in the vertical direction. Considering that the distances from the summit to the sea surface of the Kocebu Seamount and M5 seamount were 1,195 m and 30 m respectively, these results suggested that the seamounts disrupted the vertical stratification of the microbial communities in the seawater below their summits.
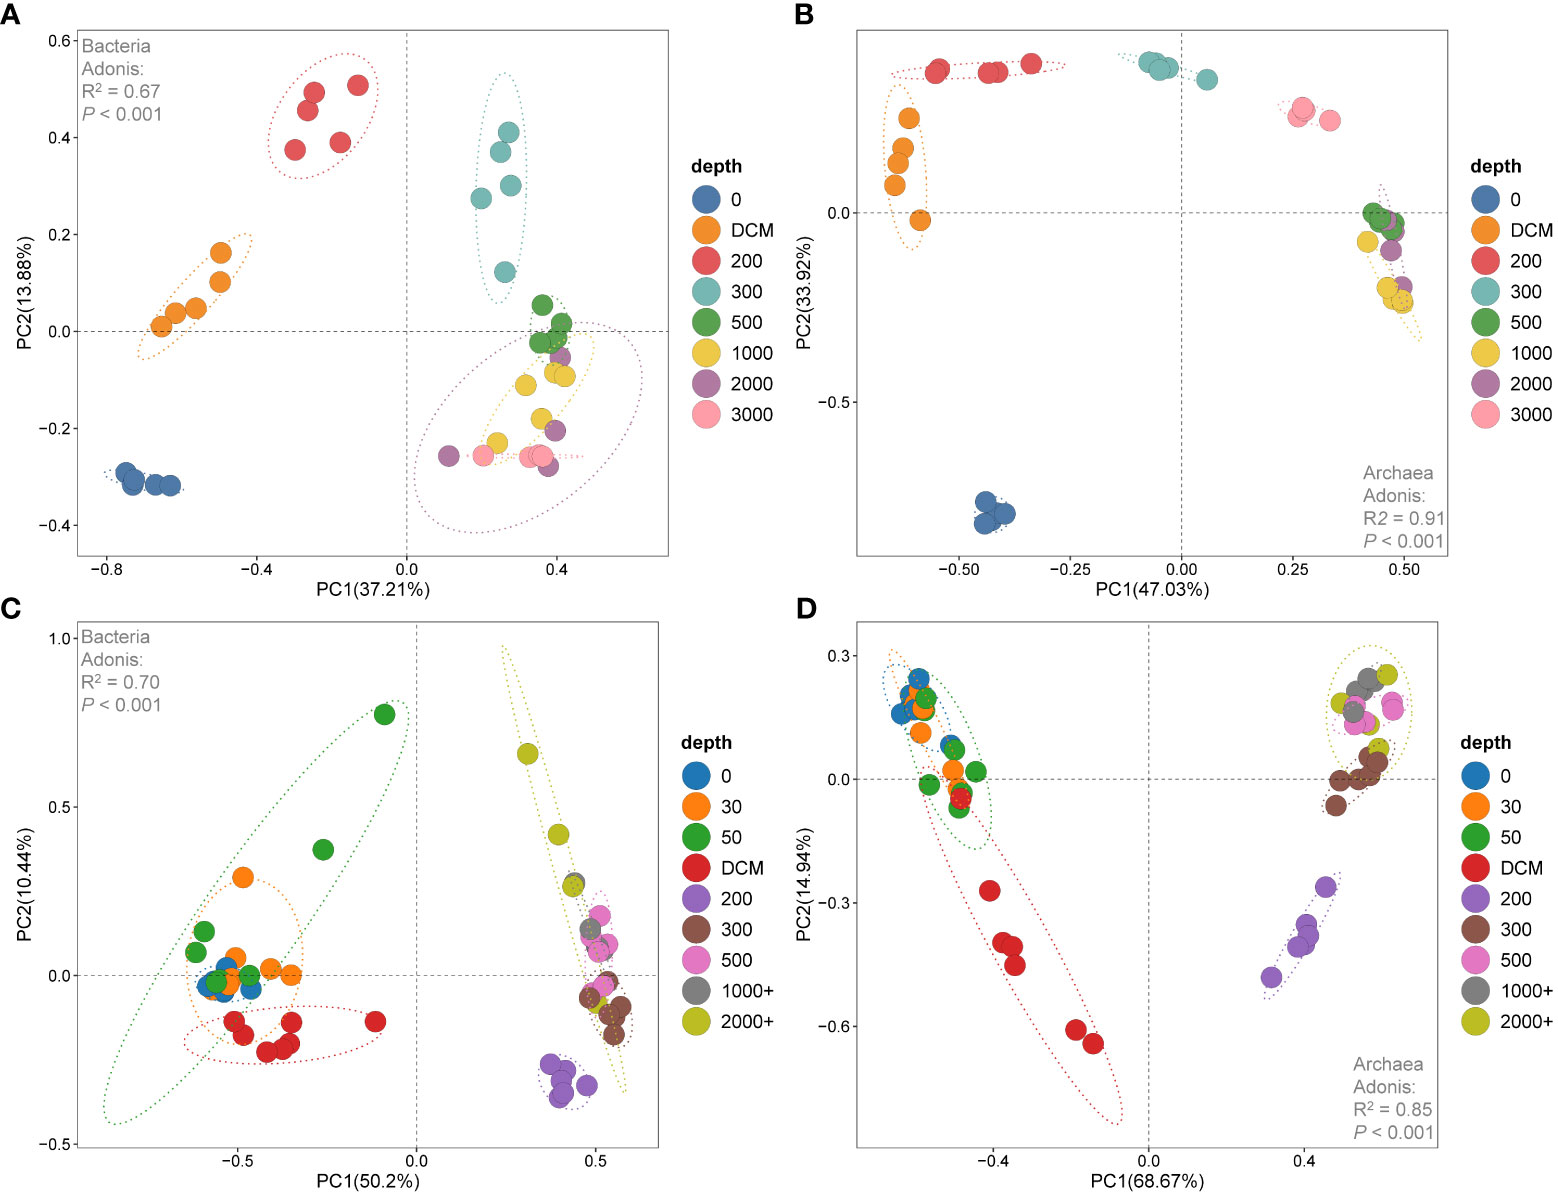
Figure 5 Plots of the principal component analysis (PCA) of samples in water around the Kocebu Seamount (A, B) and the M5 Seamount (C, D). Principal component analysis (PCA) was performed on community composition dissimilarities (Bray-Curtis distance) that were based on the hellinger-transformed bacterial and archaeal OTU matrices in the seamounts. The mean depth of the deep chlorophyll maximum (DCM) layer in Kocebu Seamount is 161 m, and the mean depth of DCM layer in M5 Seamount is 107.5 m.
3.5 Shared OTUs between samples at same depth
The shared OTUs among samples from the same depth of each seamount were analyzed to investigate how the seamounts affect the microbial composition at the horizontal level. The proportions of shared OTUs among the samples at the same depth were negatively correlated with the water depth on the Kocebu Seamount (Figures 6A, B), indicating that the similarity of bacterial and archaeal communities decreased in deep water. The highest (39.00%) and lowest (12.75%) proportions of shared bacterial OTUs were observed in samples from 200 m and 2000 m depths on the Kocebu Seamount. However, on the M5 Seamount, the proportions of shared archaeal OTUs increased with depth and the proportion of shared bacterial OTUs showed no significant correlation with depth (Figures 6C, D). The highest (44.38%) and lowest (22.82%) proportions of shared archaeal OTUs were observed in samples from 2000 m and DCM (100 m) layers on the M5 Seamount, respectively. Besides, the relationship of Bray-Curtis distance in the bacterial and archaeal community with depths in samples from both seamounts displayed a similar pattern (Supplementary Figure 7). Despite the different results observed for the samples from the two seamounts, these results indicated that seamounts can influence the horizontal microbial composition at a small geographic scale around them, which might be attributed to the fact that seamounts can alter the horizontal and vertical currents around them.
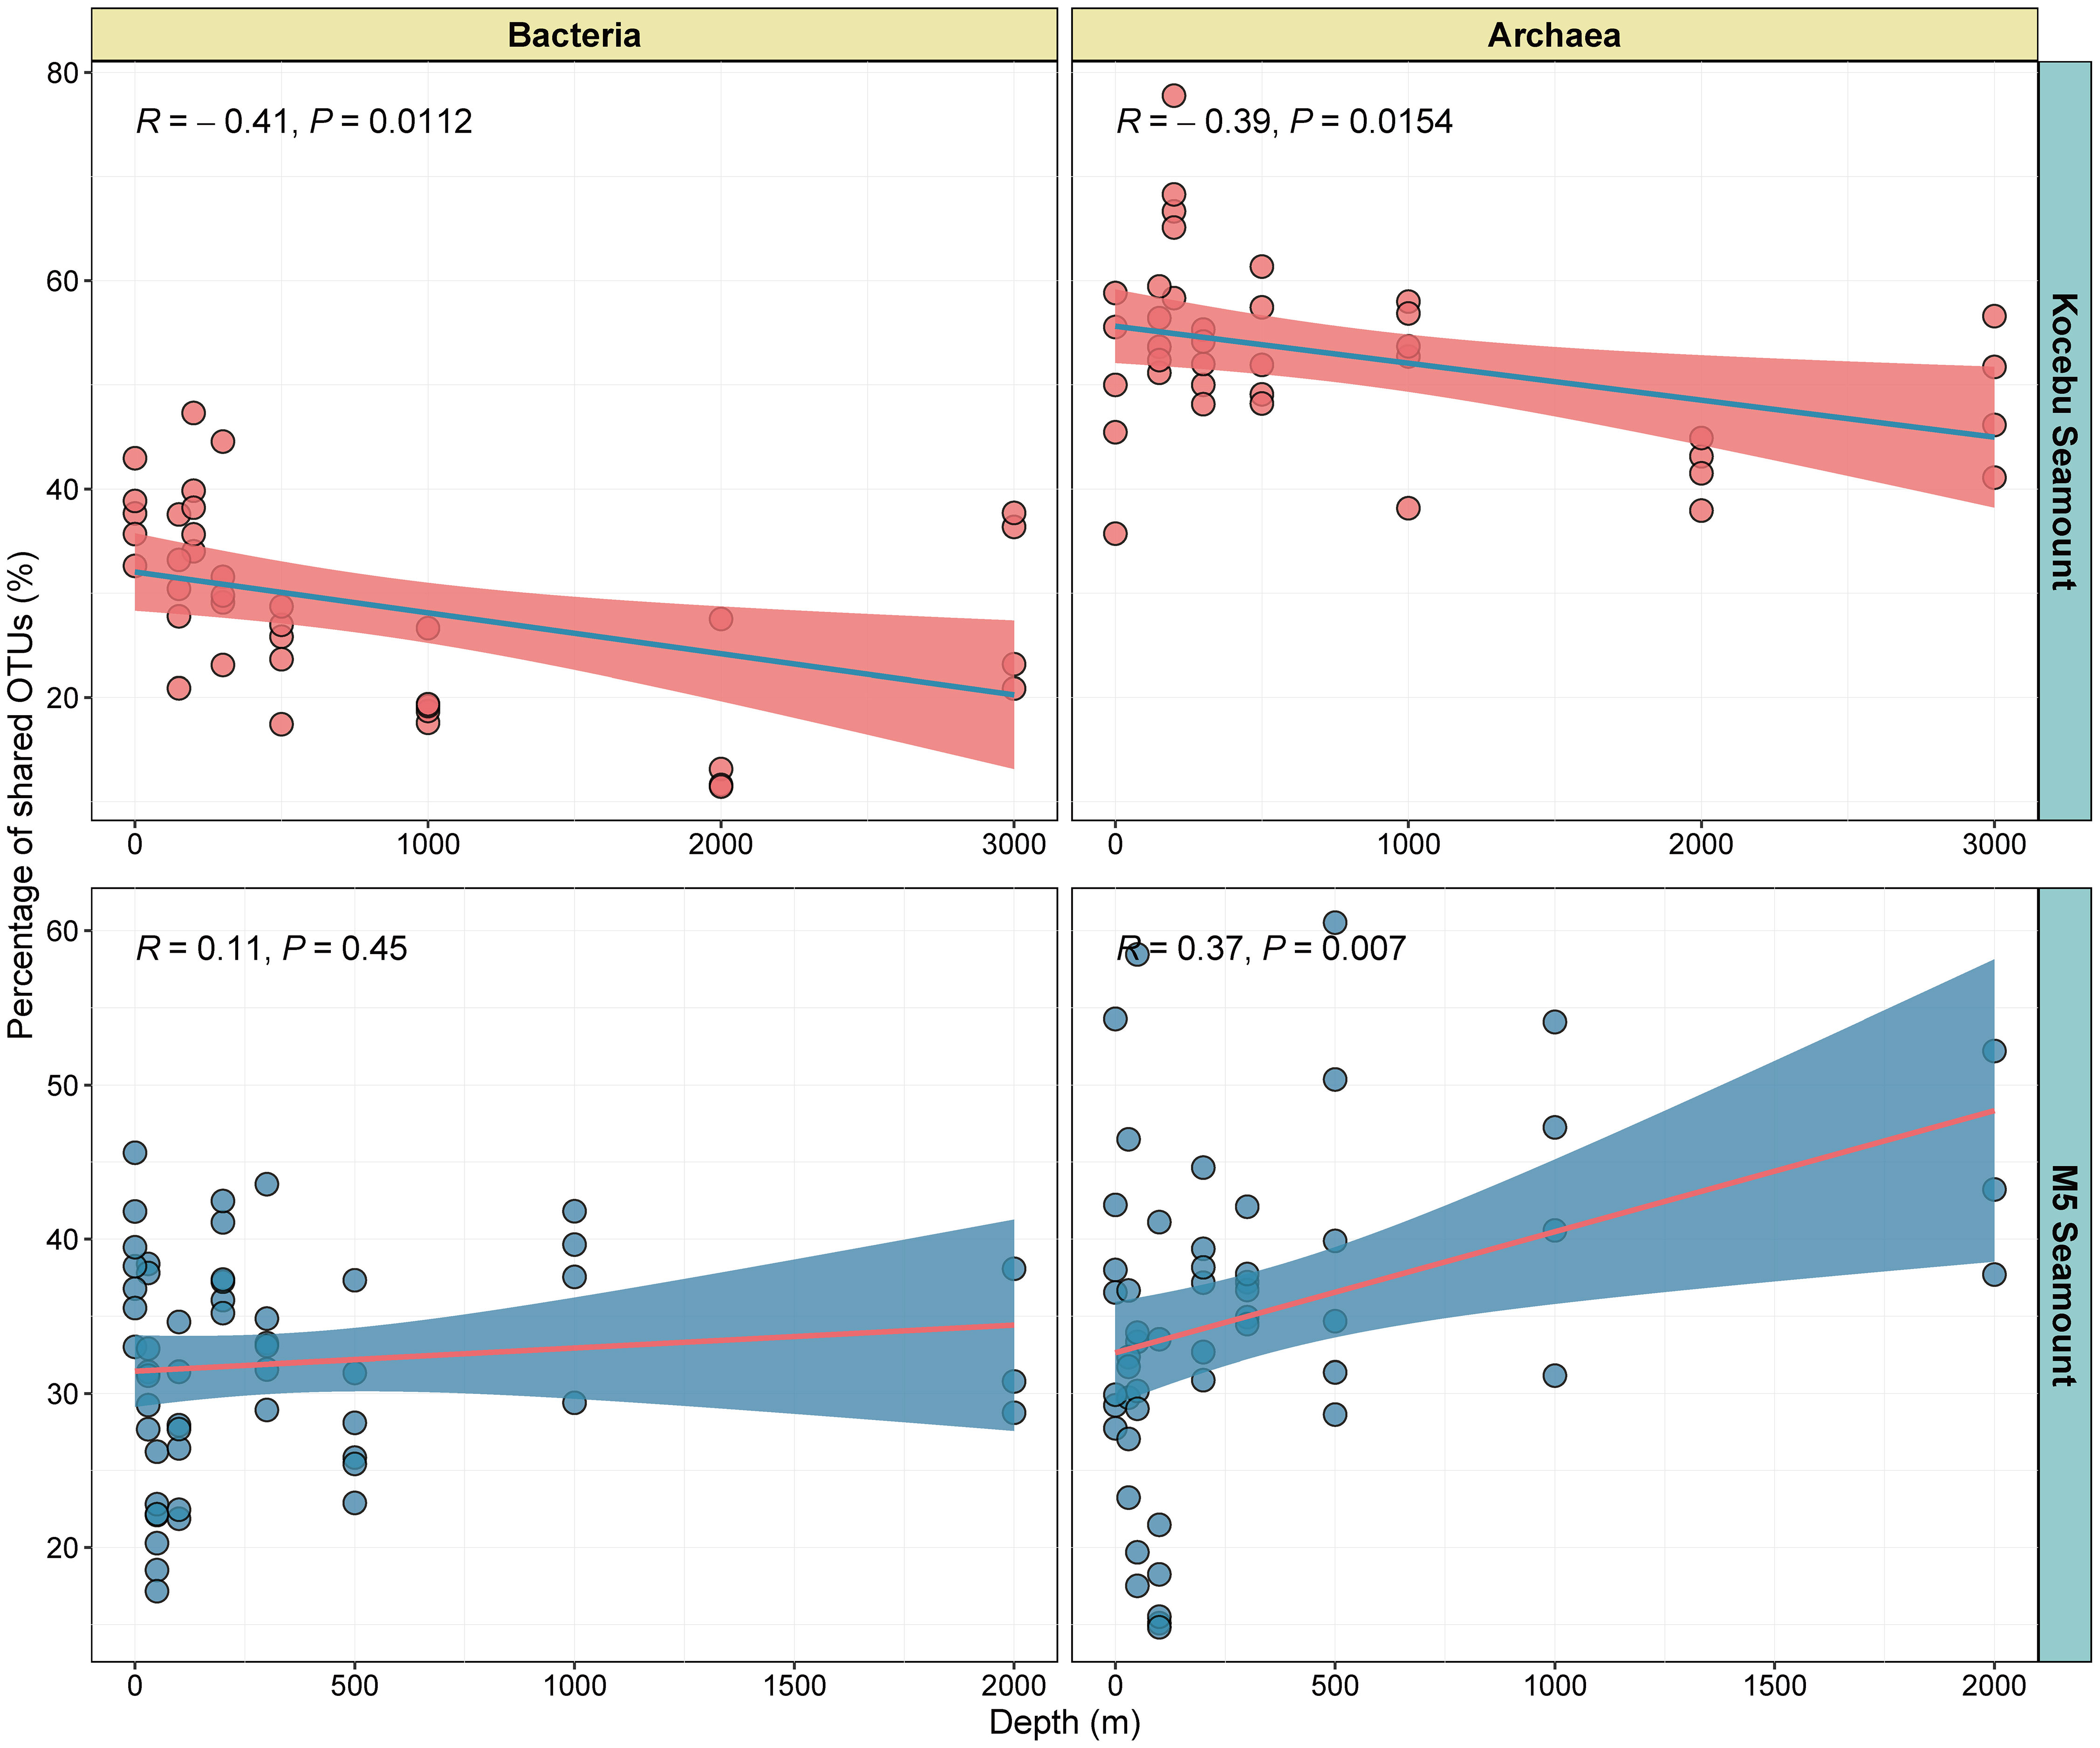
Figure 6 The relationship of shared OTUs in the bacterial and archaeal community with depths in samples from seawater around the Kocebu Seamount and M5 Seamount. Each dot indicates the proportion of shared OTUs among samples from the same depth of each seamount.
3.6 Bacterial and archaeal community assembly processes in the two seamounts
The null model for microbial community composition is a method to test the assembly processes of microbial communities by constructing a hypothetical model that assumes the distribution of species in a community is completely random, and then comparing it with the observed community (Chase et al., 2011; Stegen et al., 2012). The βNTI and RCbray based on the null model were used to quantify the relative contribution of each ecological process in the assembly of bacterial and archaeal communities from seawater samples collected around two seamounts (Figures 7A–E). Deterministic processes, indicated by |βNTI| > 2, include variable selection (when different environmental factors select for different taxa) and homogeneous selection (when the same environmental factor selects for the same taxa across sites), while stochastic processes, indicated by |βNTI| < 2, mainly refer to dispersal limitation (when the dispersal of taxa is restricted by geographic distance or barriers), homogenizing dispersal (when the dispersal of taxa is enhanced by environmental similarity or connectivity) and drift (when the abundance of taxa is influenced by random events) (Stegen et al., 2012; Dini-Andreote et al., 2015; Zhou and Ning, 2017). The results showed the stochastic processes dominate the microbial community assembly in the seawater around both seamounts, and the stochastic processes had a greater effect on the assembly of archaeal communities than on that of bacterial communities. For the Kocebu and the M5 Seamounts, the drift process accounted for 68.85% and 58.65% in the archaeal community assembly, respectively; but only accounted for 34.99% and 14.07% in the bacterial community assembly, respectively. Although the variable selection accounted for 47.07% in the bacterial community assembly on the M5 Seamount, the stochastic processes (52.92%) still dominated over the deterministic processes (47.08%) in shaping the bacterial community structure.
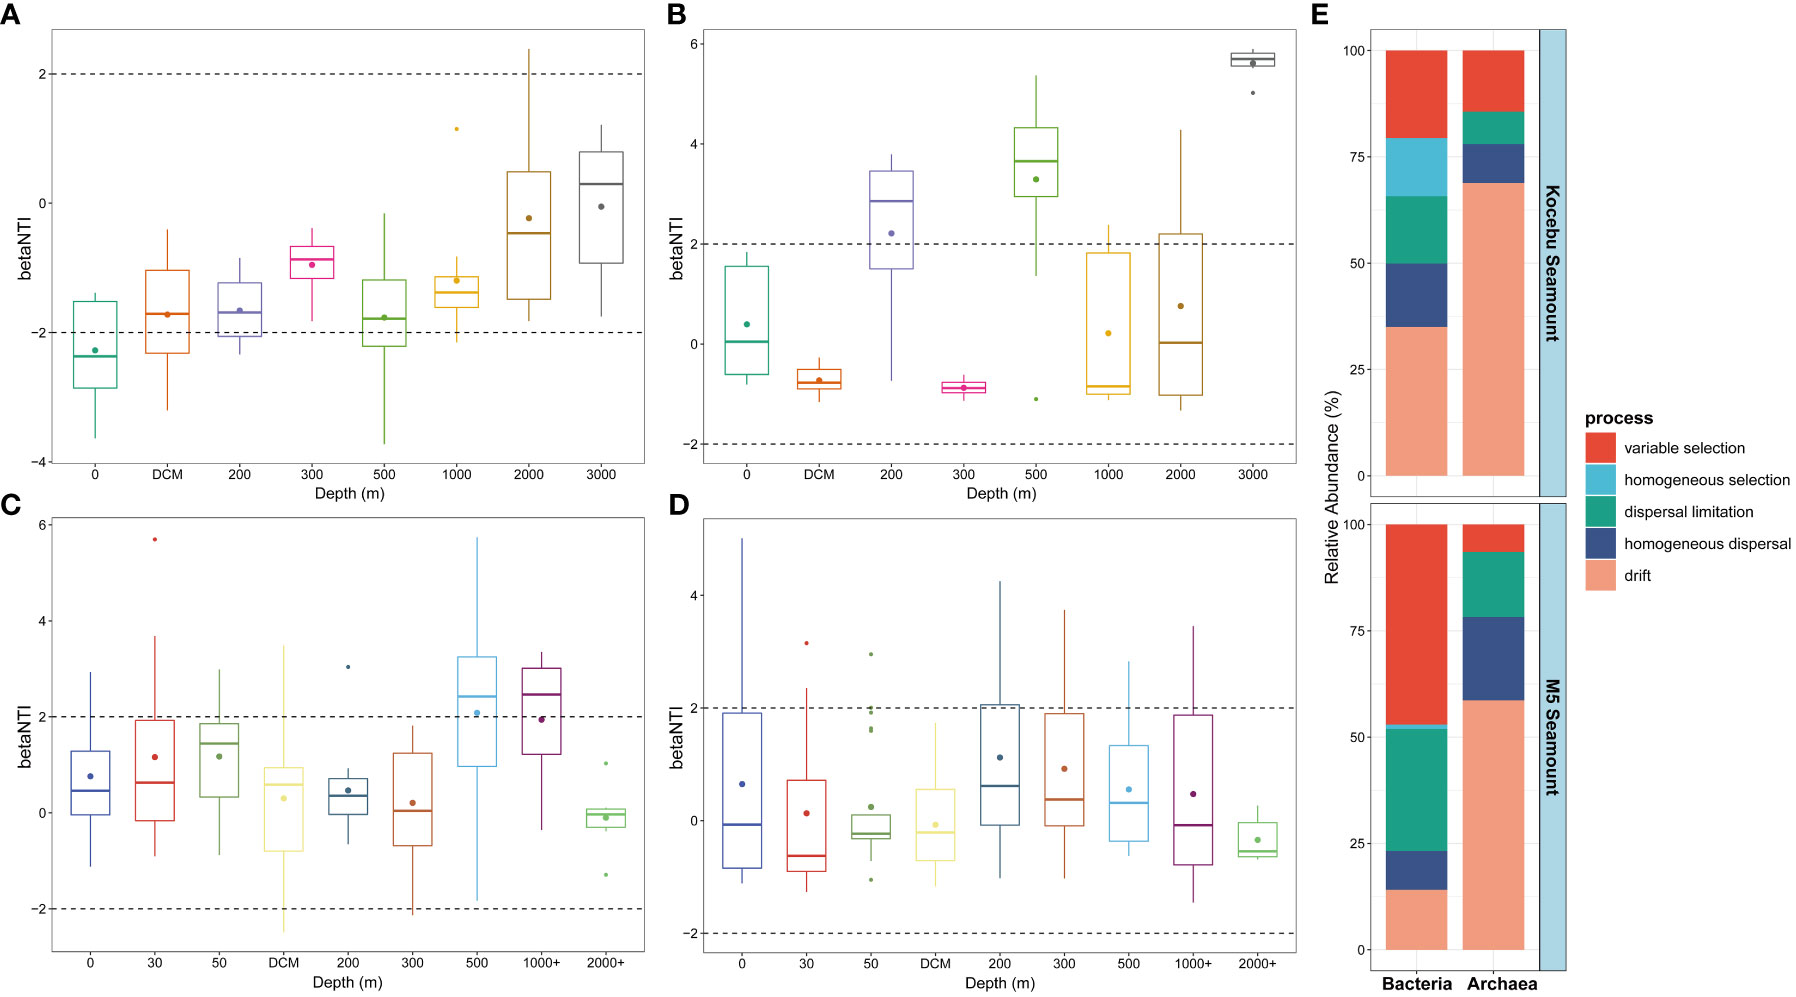
Figure 7 Bacterial and archaeal community assembly processes of seawater samples around the two seamounts. β-nearest taxon index (βNTI) of bacterial (A, C) and archaeal (B, D) community at different depths of the two seamounts. Contributions of ecological assembly processes of bacterial and archaeal communities of the two seamounts (E). The mean depth of the deep chlorophyll maximum (DCM) layer in Kocebu Seamount is 161 m, and the mean depth of DCM layer in M5 Seamount is 107.5 m.
3.7 Environmental drivers of the variation of community composition
Pearson correlation analysis showed a significant correlation between most of the environmental variables measured (except for NH4-N and NO2-N in the Kocebu Seamount, and NH4-N in the M5 Seamount) in the water surrounding two seamounts (P < 0.05). The Mantel test indicated that environmental variables (except for NO2-N in the M5 Seamount) had different and significant effects on the bacterial and archaeal communities (P < 0.05; Figures 8A, B). Significant collinearity was observed among the multiple environmental variables, then the hierarchical partitioning theory was applied to estimate the importance of each explanatory variable for bacterial and archaeal communities. Hierarchical partitioning calculates the variable importance from all subset models, which will avoid the influence of calculation order on results (Lai et al., 2022). Despite the low explanation of environmental variables for microbial communities, the analysis showed that NH4-N and NO2-N (both belonging to dissolved inorganic nitrogen) were the most important environmental variables affecting the variation of microbial communities around the M5 Seamount and Kocebu Seamount, respectively (Figures 8C–F). The above analyses showed that stochastic processes primarily dominated the assembly processes of the bacterial and archaeal communities of the two seamounts (Figure 7), which was consistent with the low explanation of the changes in microbial communities by environmental variables.
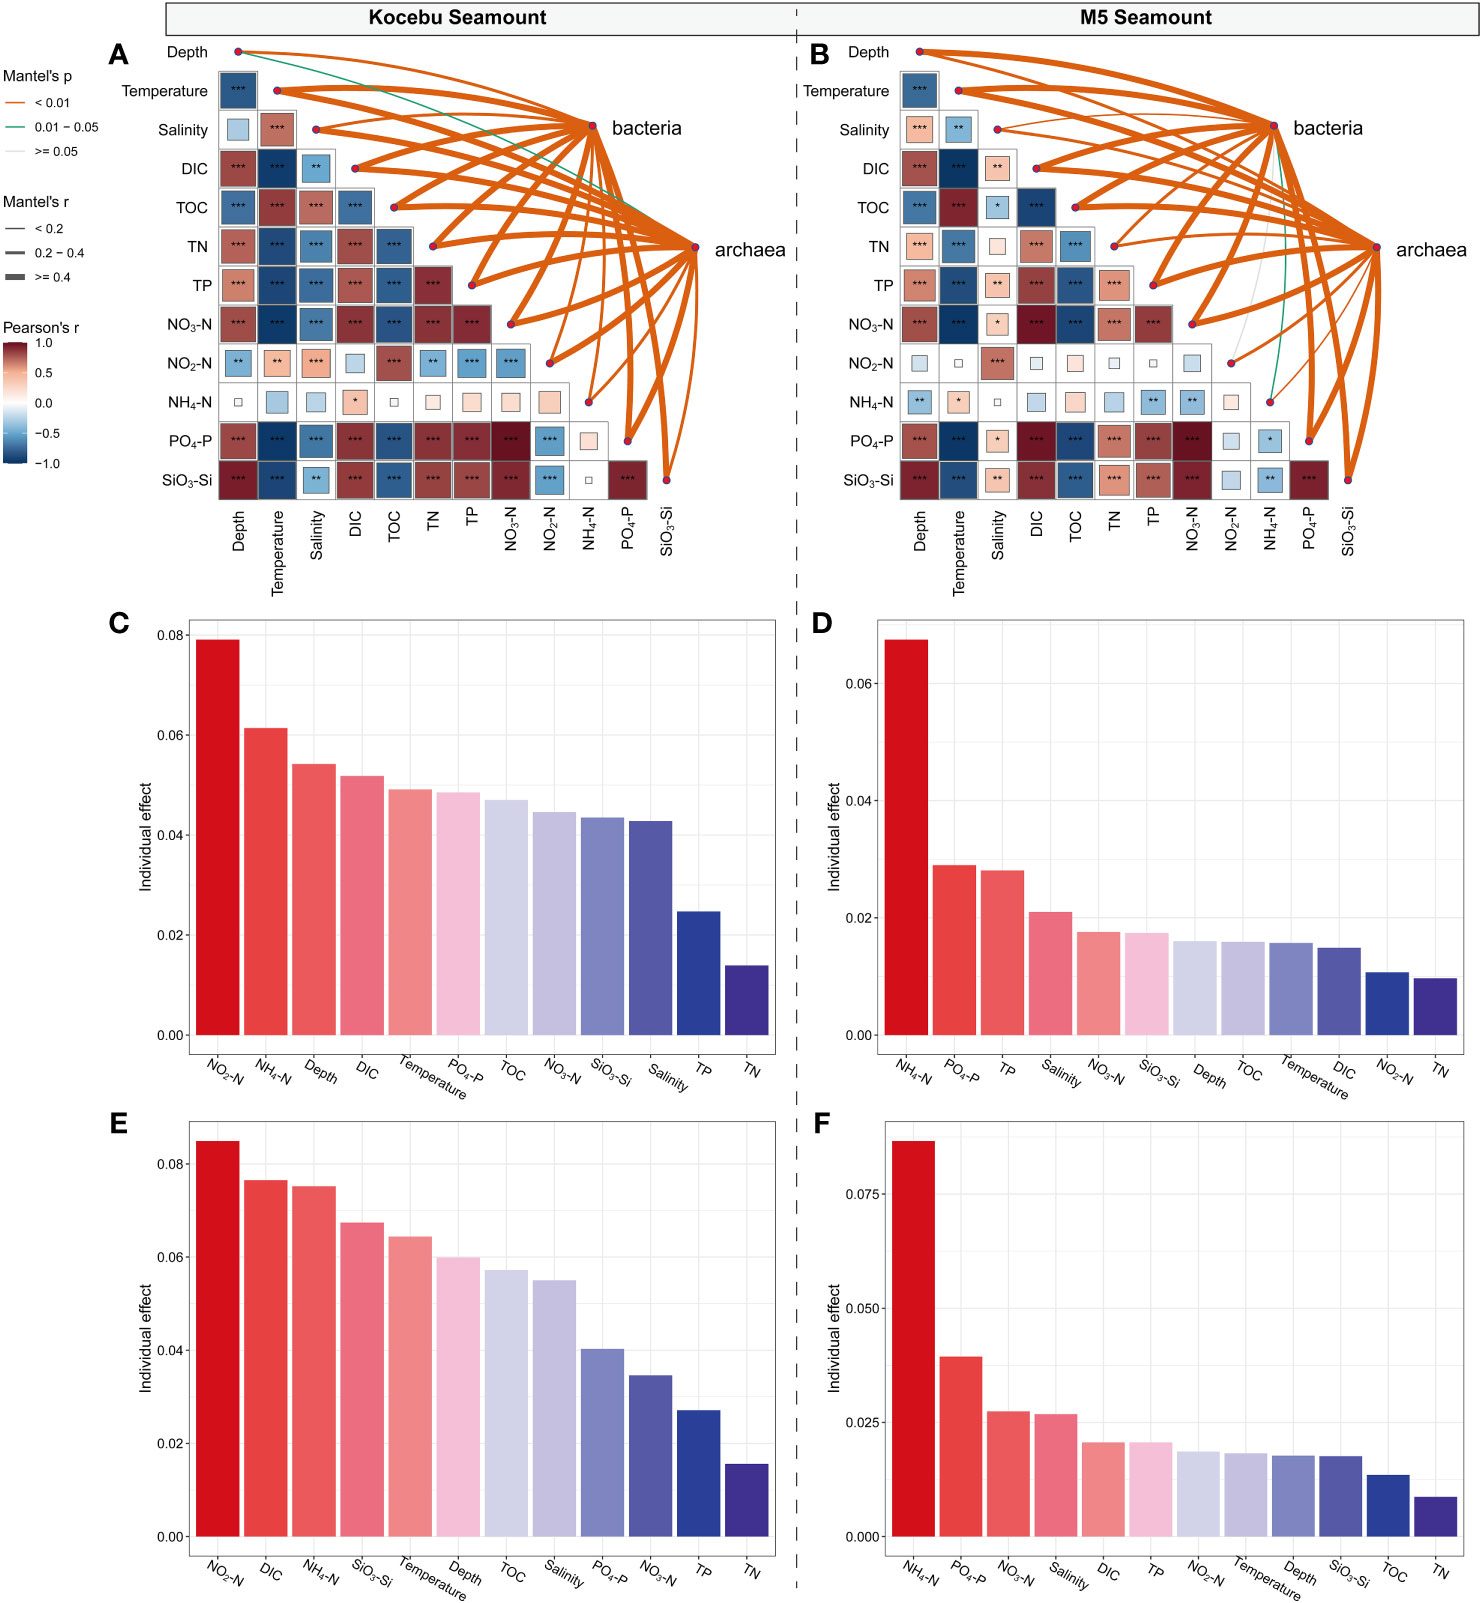
Figure 8 Environmental drivers of the variation of the bacterial and archaeal community compositions in seawater around two seamounts. (A, B) Correlation analysis of environmental factors and microbial community composition. The bacterial and archaeal community composition was related to each environmental factor by partial Mantel tests. Edge width corresponds to the Mantel’s r statistic for the corresponding distance correlations, and edge color denotes the statistical significance based on 999 permutations. Pairwise comparisons of environmental factors are shown, with a color gradient denoting Spearman’s correlation coefficients, “*” refers to P value < 0.050; “**” refers to P value < 0.010; “***” refers to P value < 0.001. (C–F) Individual effect of each explanatory variable for bacterial and archaeal communities, respectively.
This observation was different from the previous studies which indicated that temperature was generally considered to be the main factor influencing the biogeographic distribution of marine microorganisms (Rodriguez-Martinez et al., 2013; Swan et al., 2013; Sunagawa et al., 2015; Dlugosch et al., 2022). Considering that DIN is closely linked to marine primary productivity and it is common to observe an increase in primary productivity around seamounts (Misic et al., 2012; Bristow et al., 2017), it is plausible that DIN has the most important effect on the microbial communities in the two seamounts.
4 Discussion
The ocean is the largest aquatic ecosystem on the planet. Because of the vast heterogeneity of the marine environment, the distribution of microorganisms varies significantly across the global ocean (Ghiglione et al., 2012; Chow and Suttle, 2015; Sunagawa et al., 2015; Cao et al., 2020). It is currently widely accepted that the global dispersal potential of microbes and subsequent environmental selection may represent a mechanism driving microbial biogeographic patterns (Brown et al., 2014; Ward et al., 2021). Ocean current transport thus essentially acts as a conveyor belt, with environmental and biological effects occurring during transport leading to the emergence of differences in the geographic distribution of microbial organisms in the ocean (Richter et al., 2022). Seamounts account for 20% of the global seafloor surface area (Supplementary Figure 1), and represent the most significant topographic impediment to the circulation of currents beneath the sea surface and contribute significantly to the mixing of seawater between different depths, thus forming a complex hydrographic environment around them (Genin, 2004; Read and Pollard, 2017). Consequently, seamounts are an important part in the study of the marine microbial biogeographic distribution that cannot be ignored.
4.1 Biogeographic distribution patterns of microorganisms in seawater around seamounts
Many studies have shown that microbial communities in the open ocean vary geographically with distance, but this usually involves distances of at least thousands of kilometers (Livermore and Jones, 2015; Wang et al., 2020; Shao et al., 2022). Only when different water masses meet do significant differences of microbial communities emerge at closer distances (Agogue et al., 2011; Djurhuus et al., 2017). However, in the horizontal direction, we found that some samples from the same depth had different microbial community composition (Figure 4) and α-diversity (Figure 3, Supplementary Figure 4, 5) for the Kocebu and M5 Seamount. This difference was more pronounced between the deeper samples, which were more influenced by seamounts. For instance, the proportion of shared bacterial and archaeal OTUs was negatively correlated with the water depth at the Kocebu Seamount (Figure 6). These results suggested that the communities of bacteria and archaea in samples from the same depths around seamounts varied significantly even at small geographical scales (the maximum distance between samples from Kocebu Seamount was less than 26 km).
Generally, in the open ocean without seamounts, the microbial community varies significantly with depth, and a vertical stratification of microbial community is present at different water depths. (Agogue et al., 2011; Shao et al., 2022). Nevertheless, our analyses showed that the microbial community composition dissimilarities in samples from the Kocebu Seamount below the summit depth varied less vertically and those in the M5 Seamount could even be split into two groups vertically (Figure 5). In addition, previous studies have shown that different water masses potentially harbor distinct microbial communities (Pernice et al., 2015; Djurhuus et al., 2017). Despite the presence of different water masses at various depths in the Kocebu Seamount and M5 Seamount regions, the microbial community composition exhibited only marginal differences between certain deep water masses that were strongly influenced by the seamounts (Supplementary Figure 8). These results indicate that there is significant vertical mixing of seawater around the two seamounts, which results in a disruption of the vertical stratification of bacterial and archaeal communities of the surrounding seawater.
Taken together, our results suggest that the biogeographic distribution pattern of microorganisms in seawater around seamounts is characterized by enhanced vertical mixing and increased variation between deeper samples.
4.2 Community assembly process of seamount microorganisms
Both deterministic and stochastic processes played essential roles in the community assembly of marine microbial communities (Livermore and Jones, 2015; Sunagawa et al., 2015; Logares et al., 2020; Ward et al., 2021; Milke et al., 2022; Zhao et al., 2022; Zhu et al., 2022). Environmental selection imposed strong constraints on the microbial global dispersal (Ward et al., 2021), which means that deterministic processes dominated the microbial community assembly at large/global scales (Logares et al., 2020). On the contrary, this study indicated that stochastic processes (primarily the drift process) dominated the microbial community assembly in the two seamounts (Figure 7, Supplementary Figure 9). The upwelling, turbulence, internal waves, mesoscale ocean eddies and other events resulting from the interaction of ocean currents with seamounts will usually enhance the vertical mixing of water mass (Lavelle, 2006; Lavelle and Mohn, 2010; Read and Pollard, 2017; Vic et al., 2019), resulting in the complex hydrographic environment around the seamounts (Ma et al., 2021; Dai et al., 2022). Thus, the influence of stochastic process on the microbial community may be more primary than that of environmental factors. Such a result is also consistent with the low explanatory power of the environmental factors on the variation in microbial communities (Figure 8). A previous study indicated that deterministic processes had a major impact on the community assembly of bacteria, fungi and protists in the Kocebu Seamount (Zhao et al., 2022), which was contrary to our conclusion. A possible explanation for the discrepancy is that our sampling stations are closer to the seamounts than theirs, thus the effect of stochastic processes may be more pronounced.
As the results of the analysis for the two seamounts in this study demonstrated, the bacterial and archaeal communities in the seawater around the two seamounts exhibited different patterns of variation with depth. The vertical mixing of microbial communities was remarkably enhanced around the two seamounts and stochastic processes dominated the microbial community assembly. However, the huge number of seamounts is one of the main features of the submarine topography. The distance of the seamount summit from sea level, the shape structure and extension direction of the seamount, and the oceanic circulation in the region where the seamount is located determine the different hydrological environment around seamounts. Therefore, different seamounts may have different effects on the microbial communities in the surrounding seawater. Besides, a suitable control group in the non-seamount areas around a seamount would be very helpful, which was not obtained during the cruise of this study. In summary, a more comprehensive and comparative study on the microbial communities and their assembly processes across a greater type of seamounts is needed to understand how seamounts affect the biogeography of marine microorganisms.
5 Conclusion
By sequencing and analyzing the bacterial and archaeal 16S rRNA amplicons from a total of 93 seawater samples around two seamounts in the western Pacific Ocean, this study aimed to investigate to what extent do the seamounts affect the structure and dynamics of surrounding microbial communities (Emerson and Moyer, 2010)? The results showed the two seamounts in this study had a significant impact on the biogeographic distribution of microorganisms: the presence of seamounts could promote the vertical mixing of microorganisms, and stochastic processes dominate the microbial community assembly in seawater around the seamounts. The vertical mixing of microorganisms was enhanced by seamounts that impeded the horizontal transport of ocean currents. Considering the tremendous number of seamounts in the ocean and the general stratification of marine microorganisms, seamounts may have a more significant influence on the biogeographic distribution of global marine microorganisms.
Data availability statement
The original contributions presented in the study are publicly available. This data can be found here: https://www.ncbi.nlm.nih.gov/, BioProject PRJNA903284.
Author contributions
N-HL carried out the seawater sample collection and processing, statistical analysis, original manuscript writing, and participated in the research of references. JM provided environmental data. S-QL participated in the revision of the manuscript. K-DX and Y-ZZ participated in study designing and manuscript revising. Q-LQ and X-YZ participated in study designing, manuscript revising and provided funding support. All authors contributed to the article and approved the submitted version.
Funding
This work was supported by the National Science Foundation of China (grants 92251303, 91851205, 42276102, 42076229), the National Key Research and Development Program of China (2022YFC2807500, 2021YFA0909600), the Fundamental Research Funds for the Central Universities (202172002, 202041011), Major Scientific and Technological Innovation Project (MSTIP) of Shandong Province (2019JZZY010817), the Program of Shandong for Taishan Scholars (tspd20181203).
Acknowledgments
We thank the crews of the R/V KeXue for their support in sample collection.
Conflict of interest
The authors declare that the research was conducted in the absence of any commercial or financial relationships that could be construed as a potential conflict of interest.
Publisher’s note
All claims expressed in this article are solely those of the authors and do not necessarily represent those of their affiliated organizations, or those of the publisher, the editors and the reviewers. Any product that may be evaluated in this article, or claim that may be made by its manufacturer, is not guaranteed or endorsed by the publisher.
Supplementary material
The Supplementary Material for this article can be found online at: https://www.frontiersin.org/articles/10.3389/fmars.2023.1160321/full#supplementary-material
References
Aalto N. J., Schweitzer H. D., Krsmanovic S., Campbell K., Bernstein H. C. (2022). Diversity and selection of surface marine microbiomes in the atlantic-influenced arctic. Front. Microbiol. 13. doi: 10.3389/fmicb.2022.892634
Agogue H., Lamy D., Neal P. R., Sogin M. L., Herndl G. J. (2011). Water mass-specificity of bacterial communities in the North Atlantic revealed by massively parallel sequencing. Mol. Ecol. 20 (2), 258–274. doi: 10.1111/j.1365-294X.2010.04932.x
Bolyen E., Rideout J. R., Dillon M. R., Bokulich N. A., Abnet C. C., Al-Ghalith G. A., et al. (2019). Reproducible, interactive, scalable and extensible microbiome data science using QIIME 2. Nat. Biotechnol. 37 (8), 852–857. doi: 10.1038/s41587-019-0209-9
Bristow L. A., Mohr W., Ahmerkamp S., Kuypers M. M. M. (2017). Nutrients that limit growth in the ocean. Curr. Biol. 27 (11), R474–R478. doi: 10.1016/j.cub.2017.03.030
Brown M. V., Ostrowski M., Grzymski J. J., Lauro F. M. (2014). A trait based perspective on the biogeography of common and abundant marine bacterioplankton clades. Mar. Genomics 15, 17–28. doi: 10.1016/j.margen.2014.03.002
Callahan B. J., McMurdie P. J., Rosen M. J., Han A. W., Johnson A. J., Holmes S. P. (2016). DADA2: High-resolution sample inference from Illumina amplicon data. Nat. Methods 13 (7), 581–583. doi: 10.1038/nmeth.3869
Cao S., Zhang W., Ding W., Wang M., Fan S., Yang B., et al. (2020). Structure and function of the Arctic and Antarctic marine microbiota as revealed by metagenomics. Microbiome 8 (1), 47. doi: 10.1186/s40168-020-00826-9
Chase J. M., Kraft N. J. B., Smith K. G., Vellend M., Inouye B. D. (2011). Using null models to disentangle variation in community dissimilarity from variation in α-diversity. Ecosphere 2 (2), 1–11. doi: 10.1890/es10-00117.1
Chave J. (2004). Neutral theory and community ecology. Ecol. Lett. 7 (3), 241–253. doi: 10.1111/j.1461-0248.2003.00566.x
Chow C. E., Suttle C. A. (2015). Biogeography of viruses in the sea. Annu. Rev. Virol. 2 (1), 41–66. doi: 10.1146/annurev-virology-031413-085540
Clark M. R., Rowden A. A., Schlacher T., Williams A., Consalvey M., Stocks K. I., et al. (2010). The ecology of seamounts: structure, function, and human impacts. Ann. Rev. Mar. Sci. 2, 253–278. doi: 10.1146/annurev-marine-120308-081109
Dai S., Zhao Y., Li X., Wang Z., Zhu M., Liang J., et al. (2020). The seamount effect on phytoplankton in the tropical western Pacific. Mar. Environ. Res. 162, 105094. doi: 10.1016/j.marenvres.2020.105094
Dai S., Zhao Y., Li X., Wang Z., Zhu M., Liang J., et al. (2022). Seamount effect on phytoplankton biomass and community above a deep seamount in the tropical western Pacific. Mar. pollut. Bull. 175, 113354. doi: 10.1016/j.marpolbul.2022.113354
de Forges B. R., Koslow J. A., Poore G. C. (2000). Diversity and endemism of the benthic seamount fauna in the southwest Pacific. Nature 405 (6789), 944–947. doi: 10.1038/35016066
DeSantis T. Z., Hugenholtz P., Larsen N., Rojas M., Brodie E. L., Keller K., et al. (2006). Greengenes, a chimera-checked 16S rRNA gene database and workbench compatible with ARB. Appl. Environ. Microbiol. 72 (7), 5069–5072. doi: 10.1128/aem.03006-05
Dini-Andreote F., Stegen J. C., van Elsas J. D., Salles J. F. (2015). Disentangling mechanisms that mediate the balance between stochastic and deterministic processes in microbial succession. Proc. Natl. Acad. Sci. U.S.A. 112 (11), E1326–E1332. doi: 10.1073/pnas.1414261112
Dixon P. (2003). VEGAN, a package of R functions for community ecology. J. Vegetation Sci. 14 (6), 927–930. doi: 10.1111/j.1654-1103.2003.tb02228.x
Djurhuus A., Boersch-Supan P. H., Mikalsen S.-O., Rogers A. D. (2017). Microbe biogeography tracks water masses in a dynamic oceanic frontal system. R. Soc. Open Sci. 4 (3). doi: 10.1098/rsos.170033
Dlugosch L., Poehlein A., Wemheuer B., Pfeiffer B., Badewien T. H., Daniel R., et al. (2022). Significance of gene variants for the functional biogeography of the near-surface Atlantic Ocean microbiome. Nat. Commun. 13 (1), 456. doi: 10.1038/s41467-022-28128-8
Doney S. C., Ruckelshaus M., Duffy J. E., Barry J. P., Chan F., English C. A., et al. (2012). Climate change impacts on marine ecosystems. Ann. Rev. Mar. Sci. 4, 11–37. doi: 10.1146/annurev-marine-041911-111611
Emerson D., Moyer C. (2010). Microbiology of seamounts: Common patterns observed in community structure. Oceanography 23 (01), 148–163. doi: 10.5670/oceanog.2010.67
Falkowski P. G., Barber R. T., Smetacek V. V. (1998). Biogeochemical controls and feedbacks on ocean primary production. Science 281 (5374), 200–207. doi: 10.1126/science.281.5374.200
Fargione J., Brown C. S., Tilman D. (2003). Community assembly and invasion: an experimental test of neutral versus niche processes. Proc. Natl. Acad. Sci. U.S.A. 100 (15), 8916–8920. doi: 10.1073/pnas.1033107100
Gan B., Wu L. (2011). Possible origins of the western pacific warm pool decadal variability. Adv. Atmospheric Sci. 29 (1), 169–176. doi: 10.1007/s00376-011-0193-6
Genin A. (2004). Bio-physical coupling in the formation of zooplankton and fish aggregations over abrupt topographies. J. Mar. Syst. 50 (1-2), 3–20. doi: 10.1016/j.jmarsys.2003.10.008
Ghiglione J. F., Galand P. E., Pommier T., Pedros-Alio C., Maas E. W., Bakker K., et al. (2012). Pole-to-pole biogeography of surface and deep marine bacterial communities. Proc. Natl. Acad. Sci. U.S.A. 109 (43), 17633–17638. doi: 10.1073/pnas.1208160109
Hu D., Wu L., Cai W., Gupta A. S., Ganachaud A., Qiu B., et al. (2015). Pacific western boundary currents and their roles in climate. Nature 522 (7556), 299–308. doi: 10.1038/nature14504
Lai J., Zou Y., Zhang J., Peres-Neto P. R. (2022). Generalizing hierarchical and variation partitioning in multiple regression and canonical analyses using the rdacca.hp R package. Methods Ecol. Evol. 13 (4), 782–788. doi: 10.1111/2041-210x.13800
Lavelle J. W. (2006). Flow, hydrography, turbulent mixing, and dissipation at Fieberling Guyot examined with a primitive equation model. J. Geophysical Research-Oceans 111 (C7). doi: 10.1029/2005jc003224
Lavelle J. W., Mohn C. (2010). Motion, commotion, and biophysical connections at deep ocean seamounts. Oceanography 23 (1), 90–103. doi: 10.5670/oceanog.2010.64
Liu C., Cui Y., Li X., Yao M. (2021). microeco: an R package for data mining in microbial community ecology. FEMS Microbiol. Ecol. 97 (2). doi: 10.1093/femsec/fiaa255
Livermore J. A., Jones S. E. (2015). Local-global overlap in diversity informs mechanisms of bacterial biogeography. ISME J. 9 (11), 2413–2422. doi: 10.1038/ismej.2015.51
Logares R., Deutschmann I. M., Junger P. C., Giner C. R., Krabberod A. K., Schmidt T. S. B., et al. (2020). Disentangling the mechanisms shaping the surface ocean microbiota. Microbiome 8 (1), 55. doi: 10.1186/s40168-020-00827-8
Ma J., Li X., Song J., Wen L., Wang Q., Xu K., et al. (2023). The effects of seawater thermodynamic parameters on the oxygen minimum zone (OMZ) in the tropical western Pacific Ocean. Mar. pollut. Bull. 187, 114579. doi: 10.1016/j.marpolbul.2023.114579
Ma J., Song J., Li X., Wang Q., Yuan H., Li N., et al. (2021). Analysis of differences in nutrients chemistry in seamount seawaters in the Kocebu and M4 seamounts in Western Pacific Ocean. J. Oceanology Limnology 39 (5), 1662–1674. doi: 10.1007/s00343-020-0239-7
Ma J., Song J., Li X., Yuan H., Li N., Duan L., et al. (2020). Control factors of DIC in the Y3 seamount waters of the Western Pacific Ocean. J. Oceanology Limnology 38 (4), 1215–1224. doi: 10.1007/s00343-020-9314-3
Mendonca A., Aristegui J., Vilas J. C., Montero M. F., Ojeda A., Espino M., et al. (2012). Is there a seamount effect on microbial community structure and biomass? The case study of Seine and Sedlo seamounts (northeast Atlantic). PLoS One 7 (1), e29526. doi: 10.1371/journal.pone.0029526
Milke F., Wagner-Doebler I., Wienhausen G., Simon M. (2022). Selection, drift and community interactions shape microbial biogeographic patterns in the Pacific Ocean. ISME J. 16 (12), 2653–2665. doi: 10.1038/s41396-022-01318-4
Misic C., Bavestrello G., Bo M., Borghini M., Castellano M., Harriague A. C., et al. (2012). The "seamount effect" as revealed by organic matter dynamics around a shallow seamount in the Tyrrhenian Sea (Vercelli Seamount, western Mediterranean). Deep-Sea Res. Part I-Oceanographic Res. Papers 67, 1–11. doi: 10.1016/j.dsr.2012.04.012
Morato T., Hoyle S. D., Allain V., Nicol S. J. (2010). Seamounts are hotspots of pelagic biodiversity in the open ocean. Proc. Natl. Acad. Sci. U.S.A. 107 (21), 9707–9711. doi: 10.1073/pnas.0910290107
Pernice M. C., Giner C. R., Logares R., Perera-Bel J., Acinas S. G., Duarte C. M., et al. (2015). Large variability of bathypelagic microbial eukaryotic communities across the world’s oceans. ISME J. 10 (4), 945–958. doi: 10.1038/ismej.2015.170
Read J., Pollard R. (2017). An introduction to the physical oceanography of six seamounts in the southwest Indian Ocean. Deep-Sea Res. Part Ii-Topical Stud. Oceanography 136, 44–58. doi: 10.1016/j.dsr2.2015.06.022
Richter D. J., Watteaux R., Vannier T., Leconte J., Fremont P., Reygondeau G., et al. (2022). Genomic evidence for global ocean plankton biogeography shaped by large-scale current systems. Elife 11, e78129. doi: 10.7554/eLife.78129
Rodriguez-Martinez R., Rocap G., Salazar G., Massana R. (2013). Biogeography of the uncultured marine picoeukaryote MAST-4: temperature-driven distribution patterns. ISME J. 7 (8), 1531–1543. doi: 10.1038/ismej.2013.53
Rogers A. D. (2018). The biology of seamounts: 25 years on. Adv. Mar. Biol. 79, 137–224. doi: 10.1016/bs.amb.2018.06.001
Rognes T., Flouri T., Nichols B., Quince C., Mahe F. (2016). VSEARCH: a versatile open source tool for metagenomics. PeerJ 4, e2584. doi: 10.7717/peerj.2584
Shao Q., Sun D., Fang C., Feng Y., Wang C. (2022). Biodiversity and biogeography of abundant and rare microbial assemblages in the western subtropical pacific ocean. Front. Microbiol. 13. doi: 10.3389/fmicb.2022.839562
Stegen J. C., Lin X., Konopka A. E., Fredrickson J. K. (2012). Stochastic and deterministic assembly processes in subsurface microbial communities. ISME J. 6 (9), 1653–1664. doi: 10.1038/ismej.2012.22
Sun Q., Song J., Li X., Yuan H., Ma J., Wang Q. (2020). Bacterial vertical and horizontal variability around a deep seamount in the Tropical Western Pacific Ocean. Mar. pollut. Bull. 158, 111419. doi: 10.1016/j.marpolbul.2020.111419
Sun Y., Sun D.-Z., Wu L., Wang F. (2013). Western pacific warm pool and ENSO asymmetry in CMIP3 models. Adv. Atmospheric Sci. 30 (3), 940–953. doi: 10.1007/s00376-012-2161-1
Sunagawa S., Coelho L. P., Chaffron S., Kultima J. R., Labadie K., Salazar G., et al. (2015). Ocean plankton. Structure and function of the global ocean microbiome. Science 348 (6237), 1261359. doi: 10.1126/science.1261359
Swan B. K., Tupper B., Sczyrba A., Lauro F. M., Martinez-Garcia M., Gonzalez J. M., et al. (2013). Prevalent genome streamlining and latitudinal divergence of planktonic bacteria in the surface ocean. Proc. Natl. Acad. Sci. U.S.A. 110 (28), 11463–11468. doi: 10.1073/pnas.1304246110
van Haren H., Hanz U., de Stigter H., Mienis F., Duineveld G. (2017). Internal wave turbulence at a biologically rich Mid-Atlantic seamount. PLoS One 12 (12), e0189720. doi: 10.1371/journal.pone.0189720
Vic C., Garabato A. C. N., Green J. A. M., Waterhouse A. F., Zhao Z. X., Melet A., et al. (2019). Deep-ocean mixing driven by small-scale internal tides. Nat. Commun. 10 (1), 2099. doi: 10.1038/s41467-019-10149-5
Voosen P. (2022). Undersea mountains help stir up oceans. Science 375 (6587), 1324–1325. doi: 10.1126/science.abq1703
Wang Z. B., Sun Y. Y., Li Y., Chen X. L., Wang P., Ding H. T., et al. (2020). Significant bacterial distance-decay relationship in continuous, well-connected southern ocean surface water. Microb. Ecol. 80 (1), 73–80. doi: 10.1007/s00248-019-01472-x
Ward B. A., Cael B. B., Collins S., Young C. R. (2021). Selective constraints on global plankton dispersal. Proc. Natl. Acad. Sci. U.S.A. 118 (10), e2007388118. doi: 10.1073/pnas.2007388118
Wessel P., Sandwell D., Kim S.-S. (2010). The global seamount census. Oceanography 23 (01), 24–33. doi: 10.5670/oceanog.2010.60
Xu S., Zhan L., Tang W., Wang Q., Dai Z., Zhou L., et al. (2023). MicrobiotaProcess: A comprehensive R package for deep mining microbiome. Innovation (Camb) 4 (2), 100388. doi: 10.1016/j.xinn.2023.100388
Yesson C., Clark M. R., Taylor M. L., Rogers A. D. (2011). The global distribution of seamounts based on 30 arc seconds bathymetry data. Deep-Sea Res. Part I-Oceanographic Res. Papers 58 (4), 442–453. doi: 10.1016/j.dsr.2011.02.004
Zhao R., Zhao F., Zheng S., Li X., Wang J., Xu K. (2022). Bacteria, protists, and fungi may hold clues of seamount impact on diversity and connectivity of deep-sea pelagic communities. Front. Microbiol. 13. doi: 10.3389/fmicb.2022.773487
Zhou J., Ning D. (2017). Stochastic community assembly: Does it matter in microbial ecology? Microbiol. Mol. Biol. Rev. 81 (4), e00002-17. doi: 10.1128/MMBR.00002-17
Keywords: seamounts, bacterial community, archaeal community, microbial biogeographic distribution, stochastic processes
Citation: Liu N-H, Ma J, Lin S-Q, Xu K-D, Zhang Y-Z, Qin Q-L and Zhang X-Y (2023) Biogeographic distribution patterns of the bacterial and archaeal communities in two seamounts in the Pacific Ocean. Front. Mar. Sci. 10:1160321. doi: 10.3389/fmars.2023.1160321
Received: 07 February 2023; Accepted: 28 August 2023;
Published: 11 September 2023.
Edited by:
Alex David Rogers, REV Ocean, NorwayReviewed by:
Li Ning, Key Laboratory of Ocean Circulation and Waves, Institute of Oceanology, Chinese Academy of Sciences (CAS), ChinaZhao-Ming Gao, Chinese Academy of Sciences (CAS), China
Copyright © 2023 Liu, Ma, Lin, Xu, Zhang, Qin and Zhang. This is an open-access article distributed under the terms of the Creative Commons Attribution License (CC BY). The use, distribution or reproduction in other forums is permitted, provided the original author(s) and the copyright owner(s) are credited and that the original publication in this journal is cited, in accordance with accepted academic practice. No use, distribution or reproduction is permitted which does not comply with these terms.
*Correspondence: Qi-Long Qin, qinqilong@sdu.edu.cn; Xi-Ying Zhang, zhangxiying@sdu.edu.cn