Rapid changes in the surface carbonate system under complex mixing schemes across the Bering Sea: a comparative study of a forward voyage in July and a return voyage in September 2018
 Wei Yang
 Yingxu Wu
 Wei-Jun Cai
 Zhangxian Ouyang
 Yanpei Zhuang1
  Liqi Chen
 Di Qi
Di Qi- 1Polar and Marine Research Institute, College of Harbor and Coastal Engineering, Jimei University, Xiamen, China
- 2School of Marine Science and Policy, University of Delaware, Newark, DE, United States
Regulated by the rapid changes in temperature, mixing, and biological production during warm seasons, the surface carbonate system in the Bering Sea is subject to significant spatial-temporal variability. However, the seasonal evolution of the carbon cycle and its controls are less clear due to the lack of observations. Here, we present the carbonate data collected during a forward voyage in July and a return voyage in September 2018 across the Bering Sea. For both voyages, we show distinct dissolved inorganic carbon versus total alkalinity (DIC-TA) relationships and partial pressure of CO2 (pCO2) distribution patterns in the Southern Basin (54-57°N), the Northern Basin (57-59°N), the Slope (59-61°N), the Shelf (61-64°N), and the Bering Strait (>64°N). In the Southern Basin, the Northern Basin, and the Slope, surface water was a two end-member mixing of Rainwater and Bering Summer Water (BSW) during the forward voyage and a two end-member mixing of North Pacific Surface Water (NPSW) and BSW during the return voyage. As a result, the observed DIC was almost consistent with the conservative mixing line, with a slight DIC addition/removal of -8.6~5.8 µmol kg-1, suggesting low biological production/respiration during both voyages. Seasonally, the higher factions of NPSW featuring low pCO2 during the return voyage dominated the pCO2 drawdown from July to September in the Southern Basin and the Slope. On the Shelf, the surface water was a two end-member mixing of plume water from the Anadyr River and BSW during both voyages, but the decreased DIC consumption via biological production from 59.9 ± 25.8 µmol kg-1 to 34.8 ± 14.0 µmol kg-1 contributed to the pCO2 increase from July to September. In the Bering Strait, the coastal area was characterized by the influence of plume water from the Anadyr River in July and the coastal upwelling in September. The high biological production in plume water made a strong CO2 sink during the forward voyage, while the upwelling of carbon-enriched subsurface water with minor DIC consumption made the coastal ecosystem a strong CO2 source during the return voyage. In different geographical regions, the observed seawater pCO2 was much lower than the overlying atmospheric CO2, resulting in a net CO2 sink with fluxes of -2.1~-14.0 mmol m-2 d-1 and -2.5~-11.6 mmol m-2 d-1, respectively, during the forward and return voyages.
Highlights
1. The mixing of NPSW featuring low pCO2 dominated the pCO2 drawdown from July to September in the Southern Basin and the Slope.
2. pCO2 in the Bering Strait was dominated by the strong biological production in July and the coastal upwelling in September.
3. High DIC consumption via biological production made the Bering Shelf a strong CO2 sink during both voyages.
1 Introduction
In the global carbon cycle, current anthropogenic activities, mainly the burning of fossil fuels, cement production, and change in land use practices, release 10.2 ± 0.8 Gt C yr-1 (1 Gt C=1015 g C) into the atmosphere. The ocean is a principal sink of anthropogenic CO2, with an uptake of 3.0 ± 0.4 Gt C yr-1 or 26% of the total released (Friedlingstein et al., 2022). Among the different oceanic ecosystems, coastal areas and marginal seas are of great importance in CO2 uptake, transport, and transformation. It contributes up to 10-20% of global CO2 sinks, 14-30% of oceanic primary production (PP), and ~80% of organic matter burial (Cai et al., 2006; Chen and Borges, 2009; Dai et al., 2013). Recently, Dai et al. (2022) synthesized the air-sea CO2 fluxes in coastal oceans and marginal systems from the global scale, and their result suggested a CO2 uptake of 0.25 ± 0.05 Gt C yr-1. Generally, the air-sea CO2 fluxes in marginal systems show a latitudinal distribution pattern with CO2 sources in tropical and subtropical areas and CO2 sinks in arctic and subarctic ecosystems (Dai et al., 2013; Dai et al., 2022). In high-latitudinal marginal seas, such as the Chukchi Sea, the Bering Sea, and the Ross Sea, low temperature and high biological production make the surface water a strong CO2 sink (Bates et al., 2011; DeJong and Dunbar, 2017; Ouyang et al., 2021).
The Bering Sea, located in the subarctic Pacific Ocean, is one of the largest marginal seas in the world (Figure 1) (Takahashi, 2005). Over the past two decades, the air-sea CO2 fluxes and their controlling processes on the Bering Sea Shelf have been documented (e.g., Chen et al., 2004; Bates et al., 2011; Cross et al., 2014). During warm seasons, i.e., from April in mid-spring to October in early fall (Cross et al., 2014), high biological production in shelf water consumes dissolved inorganic carbon (DIC). The DIC deficit enables the surface seawater to take up the atmospheric CO2, and a strong CO2 sink is subsequently observed (Chen et al., 2004; Cross et al., 2014). Although most of the shelf water is a CO2 sink, several hotspots with high sea surface pCO2 and CO2 sources have been observed on the Shelf, which is due to the upwelling of carbon-enriched subsurface water (Chen et al., 2014). The strong CO2 outgassing in the upwelling area balances the uptake of CO2 and leads to a decrease in CO2 sinks (e.g., Chen et al., 2004; Wang et al., 2022). Overall, the Shelf is still an annual CO2 sink (Bates et al., 2011; Chen et al., 2014; Cross et al., 2014; Song et al., 2016; Sun et al., 2020). Early studies suggested that during summer, the Bering Sea Basin is a CO2 sink (Chen et al., 2014; Sun et al., 2020).
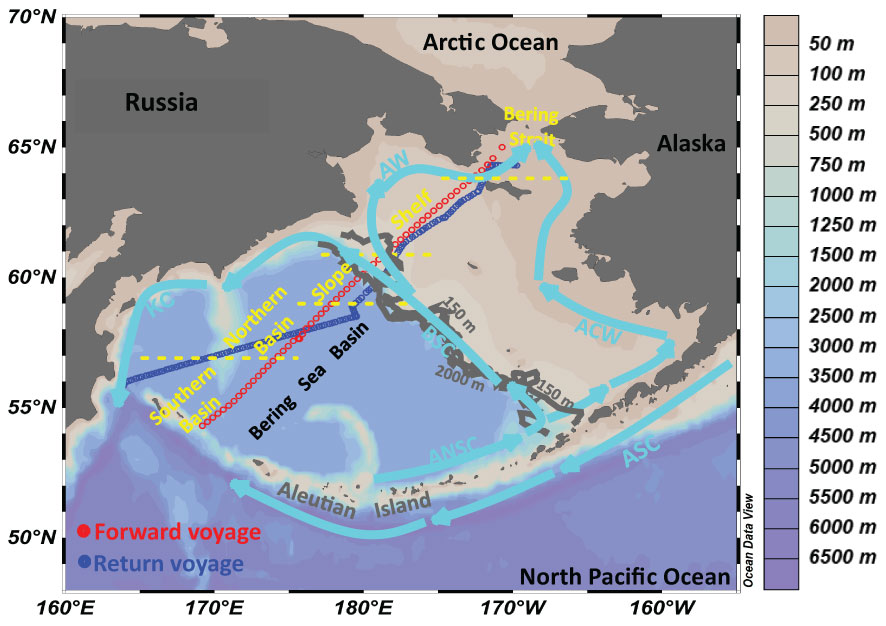
Figure 1 Geographic settings in the Bering Sea. Light blue arrows denote the current, modified from Detlef et al. (2020); Fransson et al. (2006), and Song et al. (2016). Also shown are the underway measurements during the forward voyage in July (red circles) and the return voyage in September (blue circles). KC, Kamchatka Current; ANSC, Aleutian North Slope Current; BSC, Bering Slope Current; ASC, Alaskan Stream Current; ACW, Alaskan Coastal Water; AW, Anadyr Water
However, most of the field observations reported to date are located on the Bering Sea Shelf (e.g., Bates et al., 2011; Cross et al., 2014; Wang et al., 2022), and few studies have been conducted across the Bering Sea, from the Southern Basin to the Bering Strait, which limits the comprehensive assessment of air-sea CO2 fluxes in this high-latitude marginal sea. More importantly, hydrographic and biological features, such as the sea surface temperature (SST), wind speed, and chlorophyll a concentration in the Bering Sea show strong temporal variabilities (Cross et al., 2014; Sun et al., 2020), which affect the temporal distributions of seawater pCO2 at the surface and, subsequently, the air-sea CO2 fluxes. Most studies have only reported the carbonate dynamics in a single month (mainly in June and July during the summer season), and their differences and the underlying controlling processes between different months have rarely been documented. In summer, the rapid changes in temperature and biological production in the Bering Sea significantly alter the surface carbonate parameters in short time scales (Cross et al., 2014), showing different distribution patterns. In order to gain a comprehensive understanding of the spatial and temporal distributions of sea surface pCO2, here, we report the surface carbonate chemistry dynamics across the basin and the shelf of the Bering Sea in July and September. The surface CO2 dynamics and controlling processes were assessed during both months to identify the main seasonal differences.
2 Materials and methods
2.1 Study area
The Bering Sea, located in the northern hemisphere (51-66°N and 160°E-158°W), represents the gateway between the Pacific and the Arctic Ocean. It is surrounded by Siberia in the west, Alaska in the east, and the Aleutian archipelago in the south, with an area and volume of 2.29×10⁶ km2 and 3.75×10⁶ km3, respectively (Figure 1) (Fransson et al., 2006; Bates et al., 2011; Song et al., 2016; Wang et al., 2022).
In the Bering Sea, the surface circulation system is largely controlled by the North Pacific (Figure 1). The Alaskan Stream Current (ASC), flowing into the Bering Sea from the North Pacific via several passages (e.g., Unimak Pass, Amchitka Pass, and Near Strait in the Aleutian Island Chain), is the most important surface water influencing the Southern Bering Sea (Song et al., 2016; Sun et al., 2020; Sun et al., 2021). Along the northern side of Aleutian Island, the Aleutian North Slope Current (ANSC), derived from the Kamchatka Current (KC), is the major surface water mass (Fransson et al., 2006). On the Shelf, the ASC is divided into three branches. A portion of it flows northwestwards and, together with the KC, flows southwards out of the Bering Sea along the west coast (Song et al., 2016; Detlef et al., 2020). A branch flows eastwards, together with the ANSC, joins the Bering Slope Current (BSC) at ~167°W, and flows northwards over the Shelf (Fransson et al., 2006). The others flow eastwards and northwards along the Alaskan and form the Alaskan Coastal Water (ACW) (Bates et al., 2011; Mathis et al., 2011; Wang et al., 2022). Along the Slope, a portion of BSC flows northwards to form the Anadyr Current (AC), and the rest joins the KC and flows out of the Bering Sea through the Kamchatka Strait (Song et al., 2016; Detlef et al., 2020). In the basin area, ANSC, BSC, and KC constitute a gyre, and the water properties are relatively stable due to the minor influence of the currents and water exchange (Song et al., 2016; Sun et al., 2020).
2.2 Sampling and analyses
In this study, carbonate parameters across the Bering Sea were obtained from the forward voyage in July (7.27-7.29) and the return voyage in September (9.8-9.11) during the 9th Chinese National Arctic Research Expedition (CHINARE) in 2018 (Figure 1). During both voyages, samples of temperature, salinity, pCO2, and pH were collected from an intake on the port side of the ship at 4 m depth. Meteorological data, including wind speed, wind direction, and barometric pressure, were collected using an onboard weather station (VAISALA Corporation, Helsinki, Finland). Sea surface temperature (SST) and sea surface salinity (SSS) were obtained from an underway pumping system, which was equipped with conductivity-temperature-pressure (CTD, SBE-21, SeaBird Co.) (Wu et al., 2021). pCO2 was measured with a non-dispersive infrared analyzer in the equilibrated headspace gas by an underway CO2 monitoring system, which was calibrated with four certified gas standards (CO2 gas concentrations of 244.25, 366.86, 420.56, and 546.98 µmol mol-1) every 3 h (Ouyang et al., 2021; Wu et al., 2021; Qi et al., 2022). The accuracy of CO2 measurements is within ±2 µatm (Pierrot et al., 2009; Chen et al., 2015). pH was measured by an advanced spectrophotometric loop flow analyzer for high-precision seawater pH (LFA-pH), with an accuracy of 0.001 ± 0.002 (Cao et al., 2021).
We used this simultaneously collected high-resolution underway pCO2 and pH dataset to examine the physical and biogeochemical processes controlling sea surface pCO2 and the air-sea CO2 flux. To facilitate this, we also calculated seawater DIC and TA from pCO2 and pH with CO2SYS (version 1.1) (van Heuven et al., 2011). The dissociation constants for carbonic acid and bisulfate were taken from Dickson (1990) and Lueker et al. (2000), respectively, and the total borate-salinity relationship was taken from Lee et al. (2010). Overall, the uncertainties of calculated DIC and TA were ±8 µmol kg-1 (Wu et al., 2021). The discrete DIC and TA samples from the sea surface were also collected and measured for data comparison and show almost consistent results (Wu et al., 2021). Wu et al. (2021) reported the distributions of SST, SSS, and pCO2 from East Asia to the Arctic Ocean based on the underway measurements during both voyages. Variabilities and controlling processes of ocean acidification (OA) metrics (pH, [H+], Ωarag) in the Bering Sea were presented and discussed in their study, while the CO2 fluxes, the DIC and TA dynamics, and their controlling processes were not reported and discussed.
Net community production (NCP) is a widely used indicator in evaluating the metabolic status of seawater (Bates et al., 2011; Ouyang et al., 2021). In this study, NCP was calculated following the method of Ouyang et al. (2021), which has been validated in the Western Arctic Ocean with data from the same cruise. The calculations were based on the fact that the major atmospheric gases O2 and Ar have similar physical properties but different responses to biological processes. In surface water, water mass mixing and biological production/respiration may change the O2 concentrations, while Ar is biologically inert, and its concentrations are controlled by physical processes alone. Therefore, the ratio of oxygen to argon (O2/Ar) has been developed as a proxy for NCP in seawater (Ouyang et al., 2021). Firstly, we quantified the changes in O2/Ar ratio caused by the biological forcing Δ(O2/Ar) as (O2/Ar)meas/(O2/Ar)sat-1, where (O2/Ar)meas is the ratio of dissolved gases measured in the water and (O2/Ar)sat is the ratio of the equilibrium saturated concentrations. Subsequently, the sea-to-air flux of biological oxygen (O2-bioflux) can be calculated based on the Δ(O2/Ar), the gas transfer velocity of oxygen (kO2, calculated following the method of Wanninkhof (2014)), the saturated concentration of O2, and the density of the water parcel. Finally, the bio-flux of oxygen can be equivalently converted to carbon via the quotient O2-bioflux/PQ (mmol C m-2 d-1), where PQ is the photosynthetic quotient of 1.4 (Laws, 1991).
2.3 Air-sea CO2 flux estimation
Here, we quantified the air-sea CO2 fluxes, F (mmol m-2 d-1), based on Takahashi et al. (2009), as below:
where k is the gas transfer velocity (m d-1), α is the solubility of CO2 (mol kg-1 atm-1; Weiss, 1974), and ΔpCO2 is the difference between surface oceanic and atmospheric pCO2 (µatm).
The gas transfer velocity k related to wind speed was calculated based on the Wanninkhof (2014) empirical function, as:
where U10 is wind speed measured using an onboard weather station every 2 minutes and corrected to 10 m. Sc is the Schmidt number for CO2, which was calculated using the equations of Wanninkhof (2014):
where t is the temperature in °C. During the cruise, the wind speed was collected at approximately 25 m above the sea surface, which is subsequently corrected to a height of 10 m using an equation derived from Large and Pond (1981):
where Z is the height (m) of the wind sensor, Uz is the wind speed recorded by the wind sensor, Cd10 is the drag coefficient of 0.0011, and 0.4 is von Karman’s constant.
2.4 Quantification of DIC dynamics with a two end-member mixing model
We quantified the DIC dynamics mediated by mixing and biological production using a two end-member mixing model, as described in Yang et al. (2021). In a two end-member mixing model, the mixing scheme was established with TA as the conservative tracer:
where TAx is the calculated TA of the surface water samples, TA1 and TA2 are the TA of different end-members, and F1 and F2 are the respective fractional contributions by different end-members.
The concentration of DIC from the conservative mixing of these two different end-members (DICcons) can be predicted as:
Finally, in a two end-member mixing model, the DIC difference between calculated DIC (DICcal) and conservative values (DICcons) was obtained (defined as ΔDIC), as:
where positive/negative values indicate non-conservative addition/removal of DIC from other different sources/processes.
2.5 Quantifying controls of temporal variabilities of sea surface pCO2
The dynamics of sea surface pCO2 are modulated by multiple components (T, temperature; S, salinity; TA, total alkalinity; DIC, dissolved inorganic carbon) (Yang et al., 2021; Qi et al., 2022). Here, we decomposed the temporal variability of pCO2 into different drivers with a first-order Taylor-series deconvolution approach (Kwiatkowski and Orr, 2018; Qi et al., 2022):
where dVpCO2 is the change in pCO2. ∂VpCO2/∂T, ∂VpCO2/∂S, ∂VpCO2/∂DIC, and ∂VpCO2/∂TA are the partial derivatives of different parameters, which were estimated based on the observed data, assuming a 1‰ change (e.g., increase) on the relative parameters while keeping the other parameters constant (following Orr et al., 2015). Taking the estimation of ∂VpCO2/∂TA, for example, the initial pCO2,t=0=f(T0, S0, DIC0, TA0) from CO2SYS stimulation, the changed pCO2,t=1= f(T0, S0, DIC0, TA1), where TA1 = 1.001×TA0; thus, ∂VpCO2/∂TA=(pCO21-pCO20)/(TA1-TA0).
3 Results
3.1 Hydrographic setting
Figures 2–5 show the T-S diagram and the spatial distributions of each parameter during the observation, suggesting the impacts from coastal upwelling, river plumes, and other water masses. The Bering Sea can be divided into three domains with different water depths, including an extensive continental shelf (<150 m) and a slope (150-2000 m) in the east and a deep basin (>2000 m) in the west (see the different domains in Figure 1) (Chen et al., 2004; Sun et al., 2020; Sun et al., 2021; Wang et al., 2022). Moreover, we observed distinct hydrographic features in the basin area, with a boundary at 57°N (please see the different pCO2 distributions in section 3.2). Thus, for ease of description, we divided the Bering Sea into five different sub-regions in this study: the Southern Basin (at a latitude of 54-57°N), the Northern Basin (at a latitude of 57-59°N), the Slope (at a latitude of 59-61°N), the Shelf (at a latitude of 61-64°N), and the Bering Strait (at a latitude of >64°N) (Figure 3).
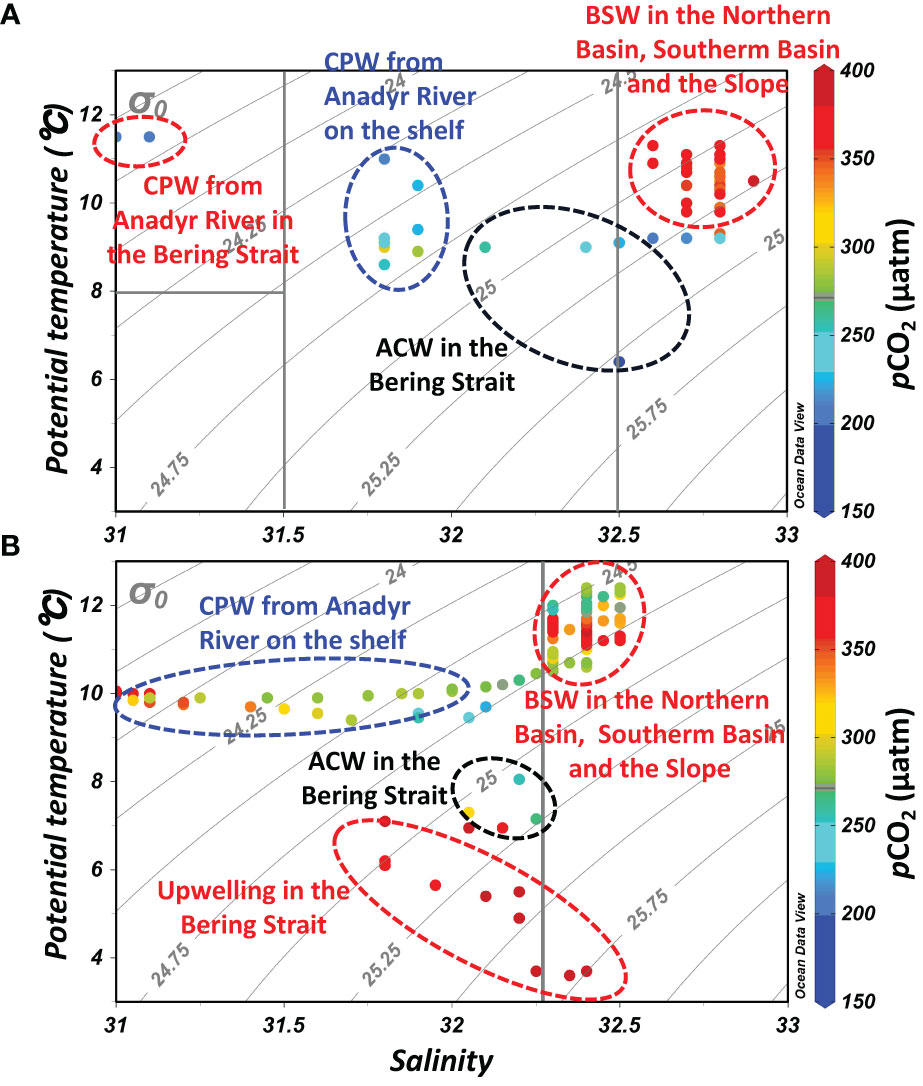
Figure 2 Relationships between potential temperature (θ, °C) and salinity (T-S diagram) in the Bering Sea during July (A) and September (B). Also shown are the water masses of the Coastal Plume Water from the Anadyr River (CPW, T>8 °C, S<31.5) in July and September, the Alaskan Coastal Water (ACW, T>3 °C, 31.5<S<32.5), and the Bering Summer Water (BSW, T>3 °C, 32.5<S) during both months (Itoh et al., 2015; Song et al., 2016; Wang et al., 2022), and the upwelling in September. Note that the temperature and salinity boundaries are not precise.
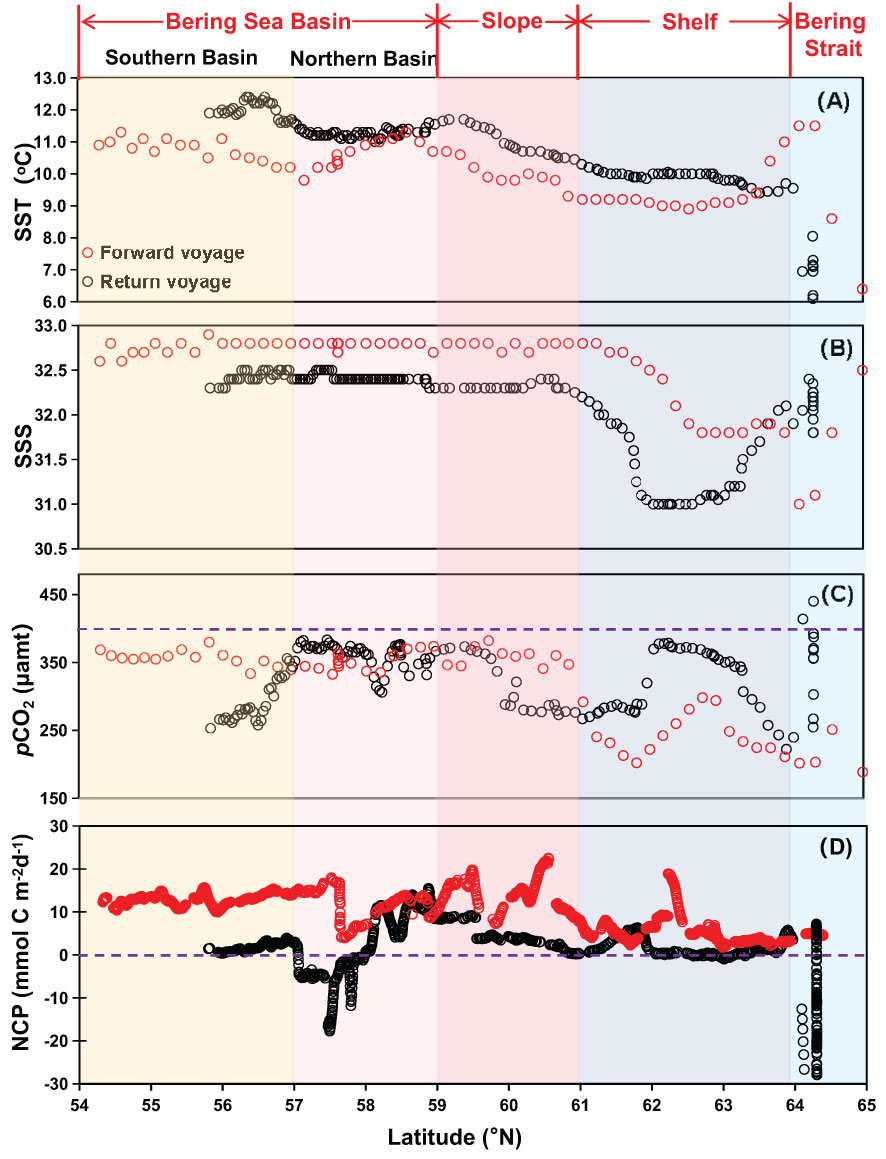
Figure 3 Latitudinal distribution of (A) temperature, SST (°C), (B) salinity, SSS, (C) partial pressure of CO2, pCO2 (µatm), and (D) net community production, NCP (mmol C m-2d-1) during the forward voyage in July (red circles) and the return voyage in September (black circles). The blue dashed line in (C) indicates the average atmospheric pCO2 level of 395 μatm during the cruise; in (D), it indicates the NCP of 0 mmol C m-2d-1. Regions from 54°N to 57°N (the Southern Basin) and from 57°N to 59°N (the Northern Basin) are merged as the Bering Sea Basin.
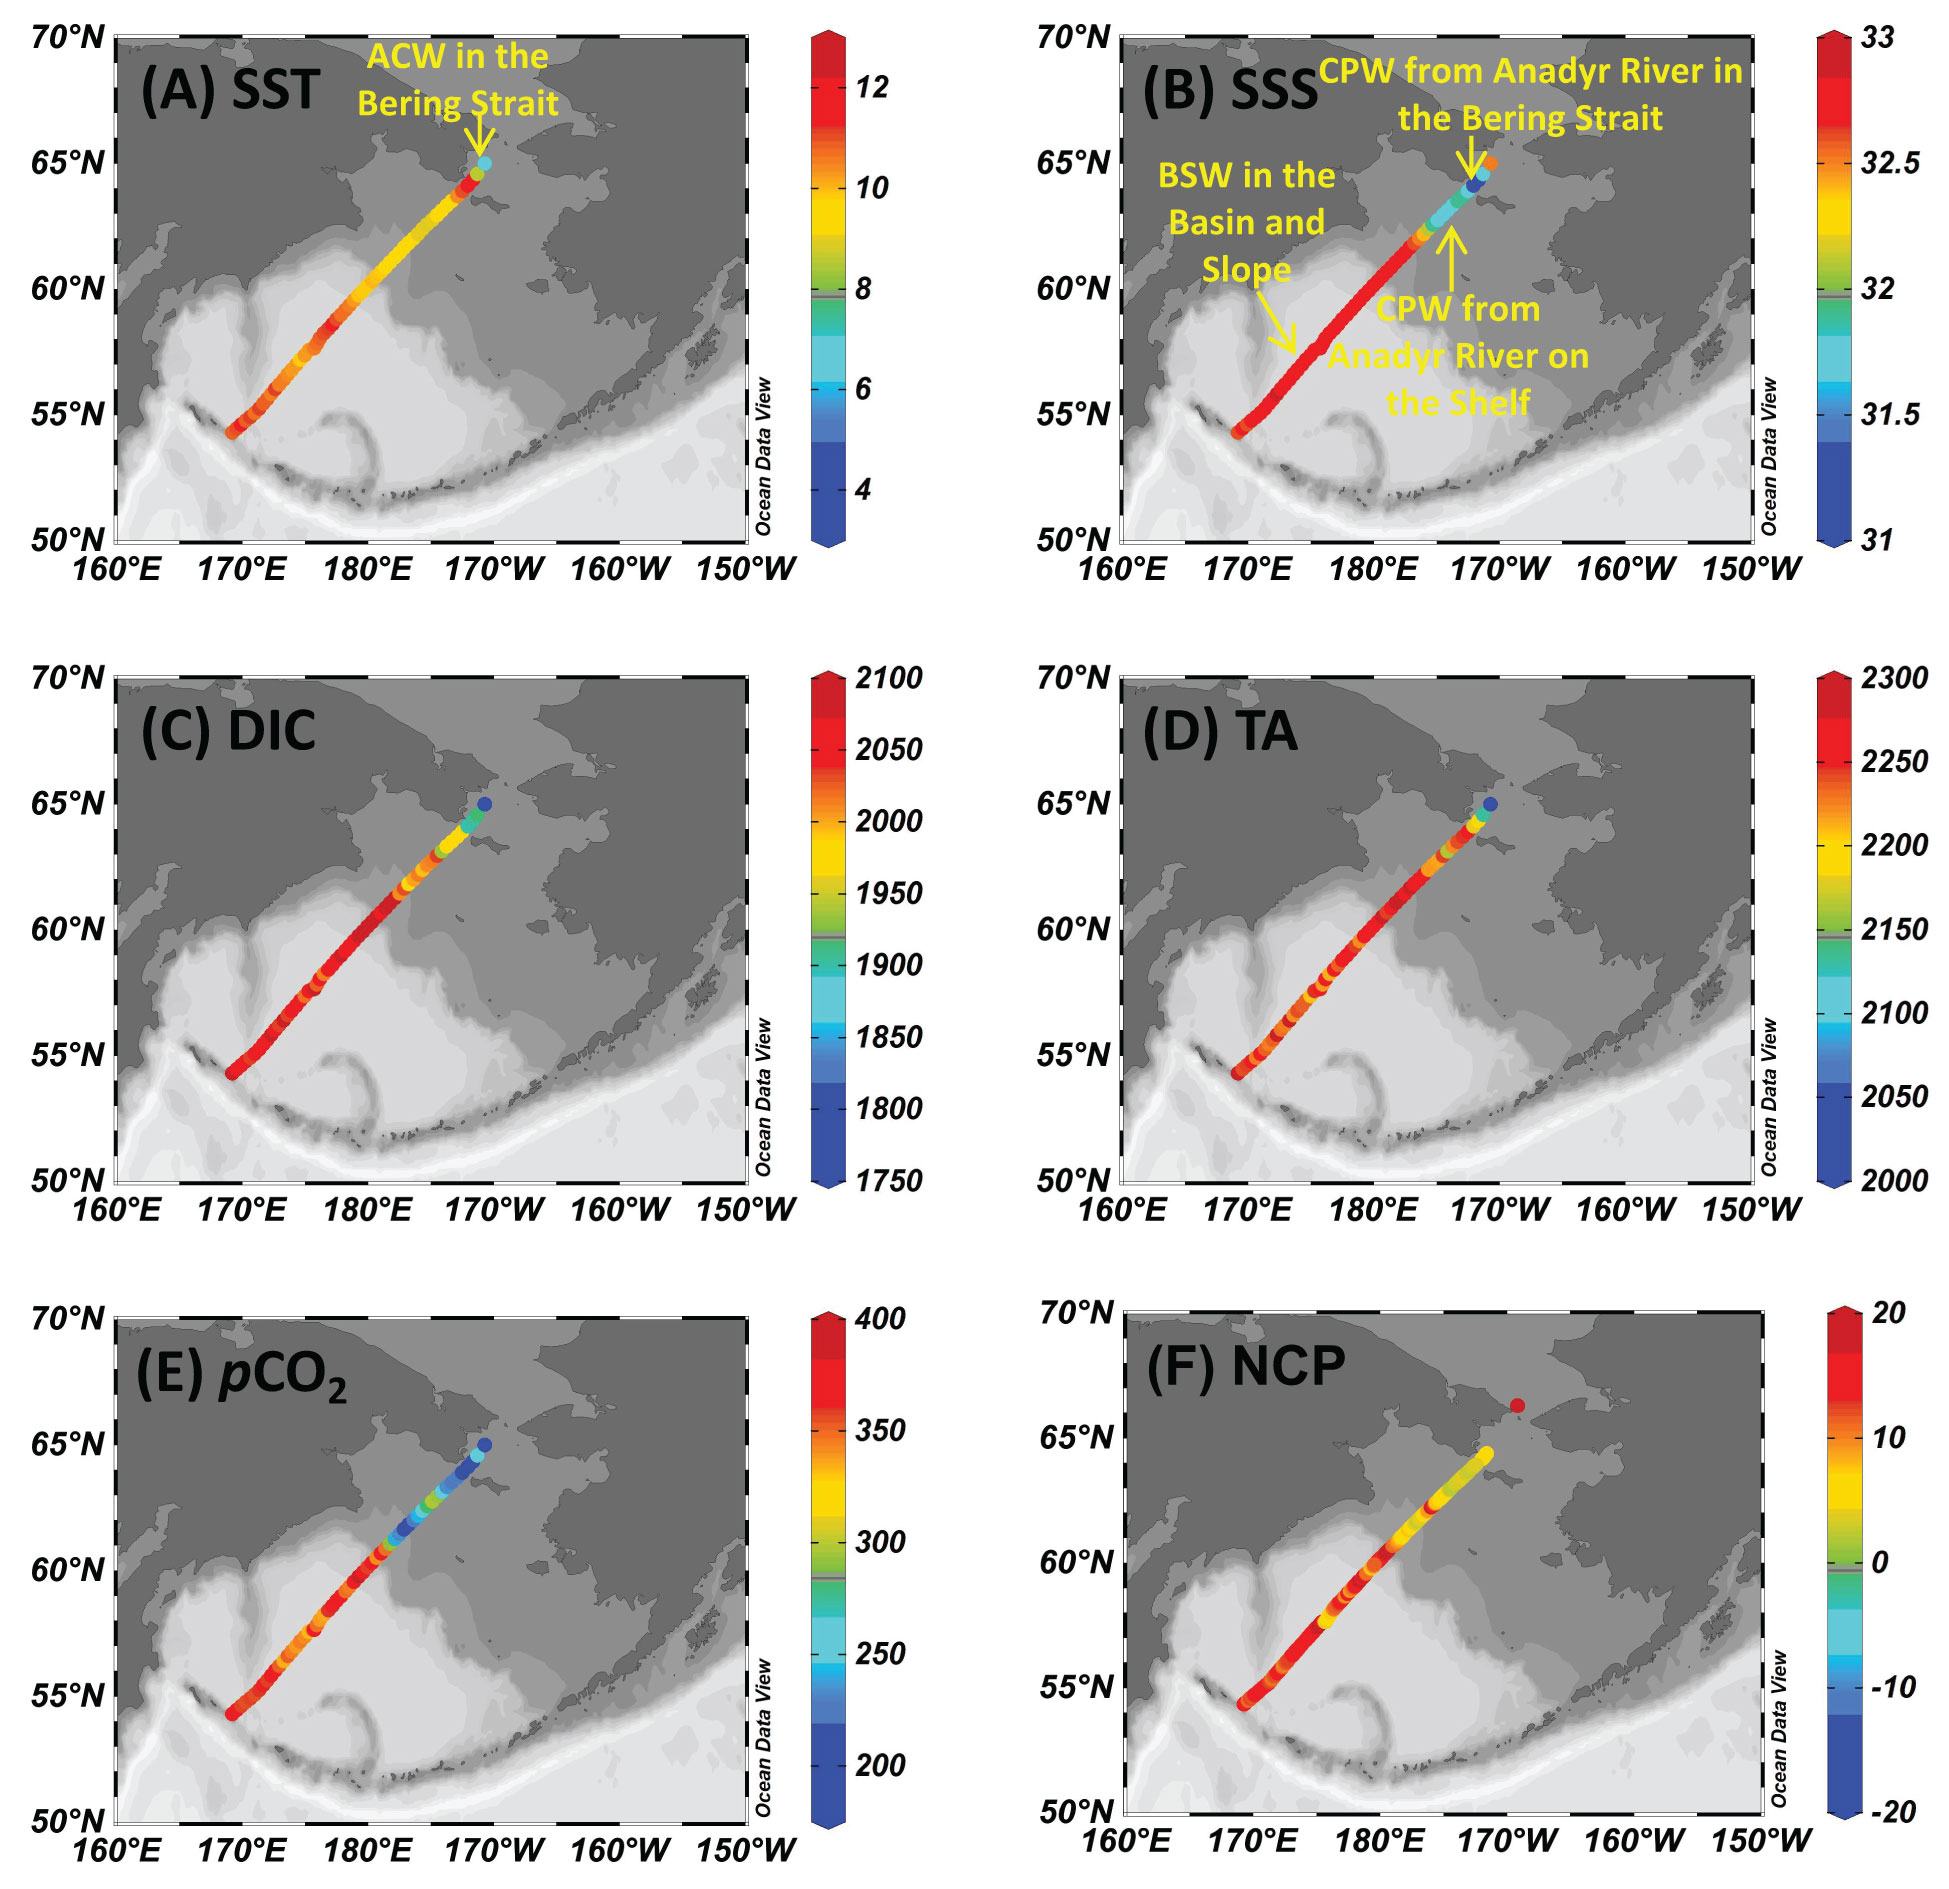
Figure 4 Sea surface distribution of (A) temperature, SST (°C), (B) salinity, SSS, (C) dissolved inorganic carbon, DIC (µmol kg-1), (D) total alkalinity, TA (µmol kg-1), (E) partial pressure of CO2, pCO2 (µatm), and (F) net community production, NCP (mmol C m-2d-1) during the forward voyage in July.
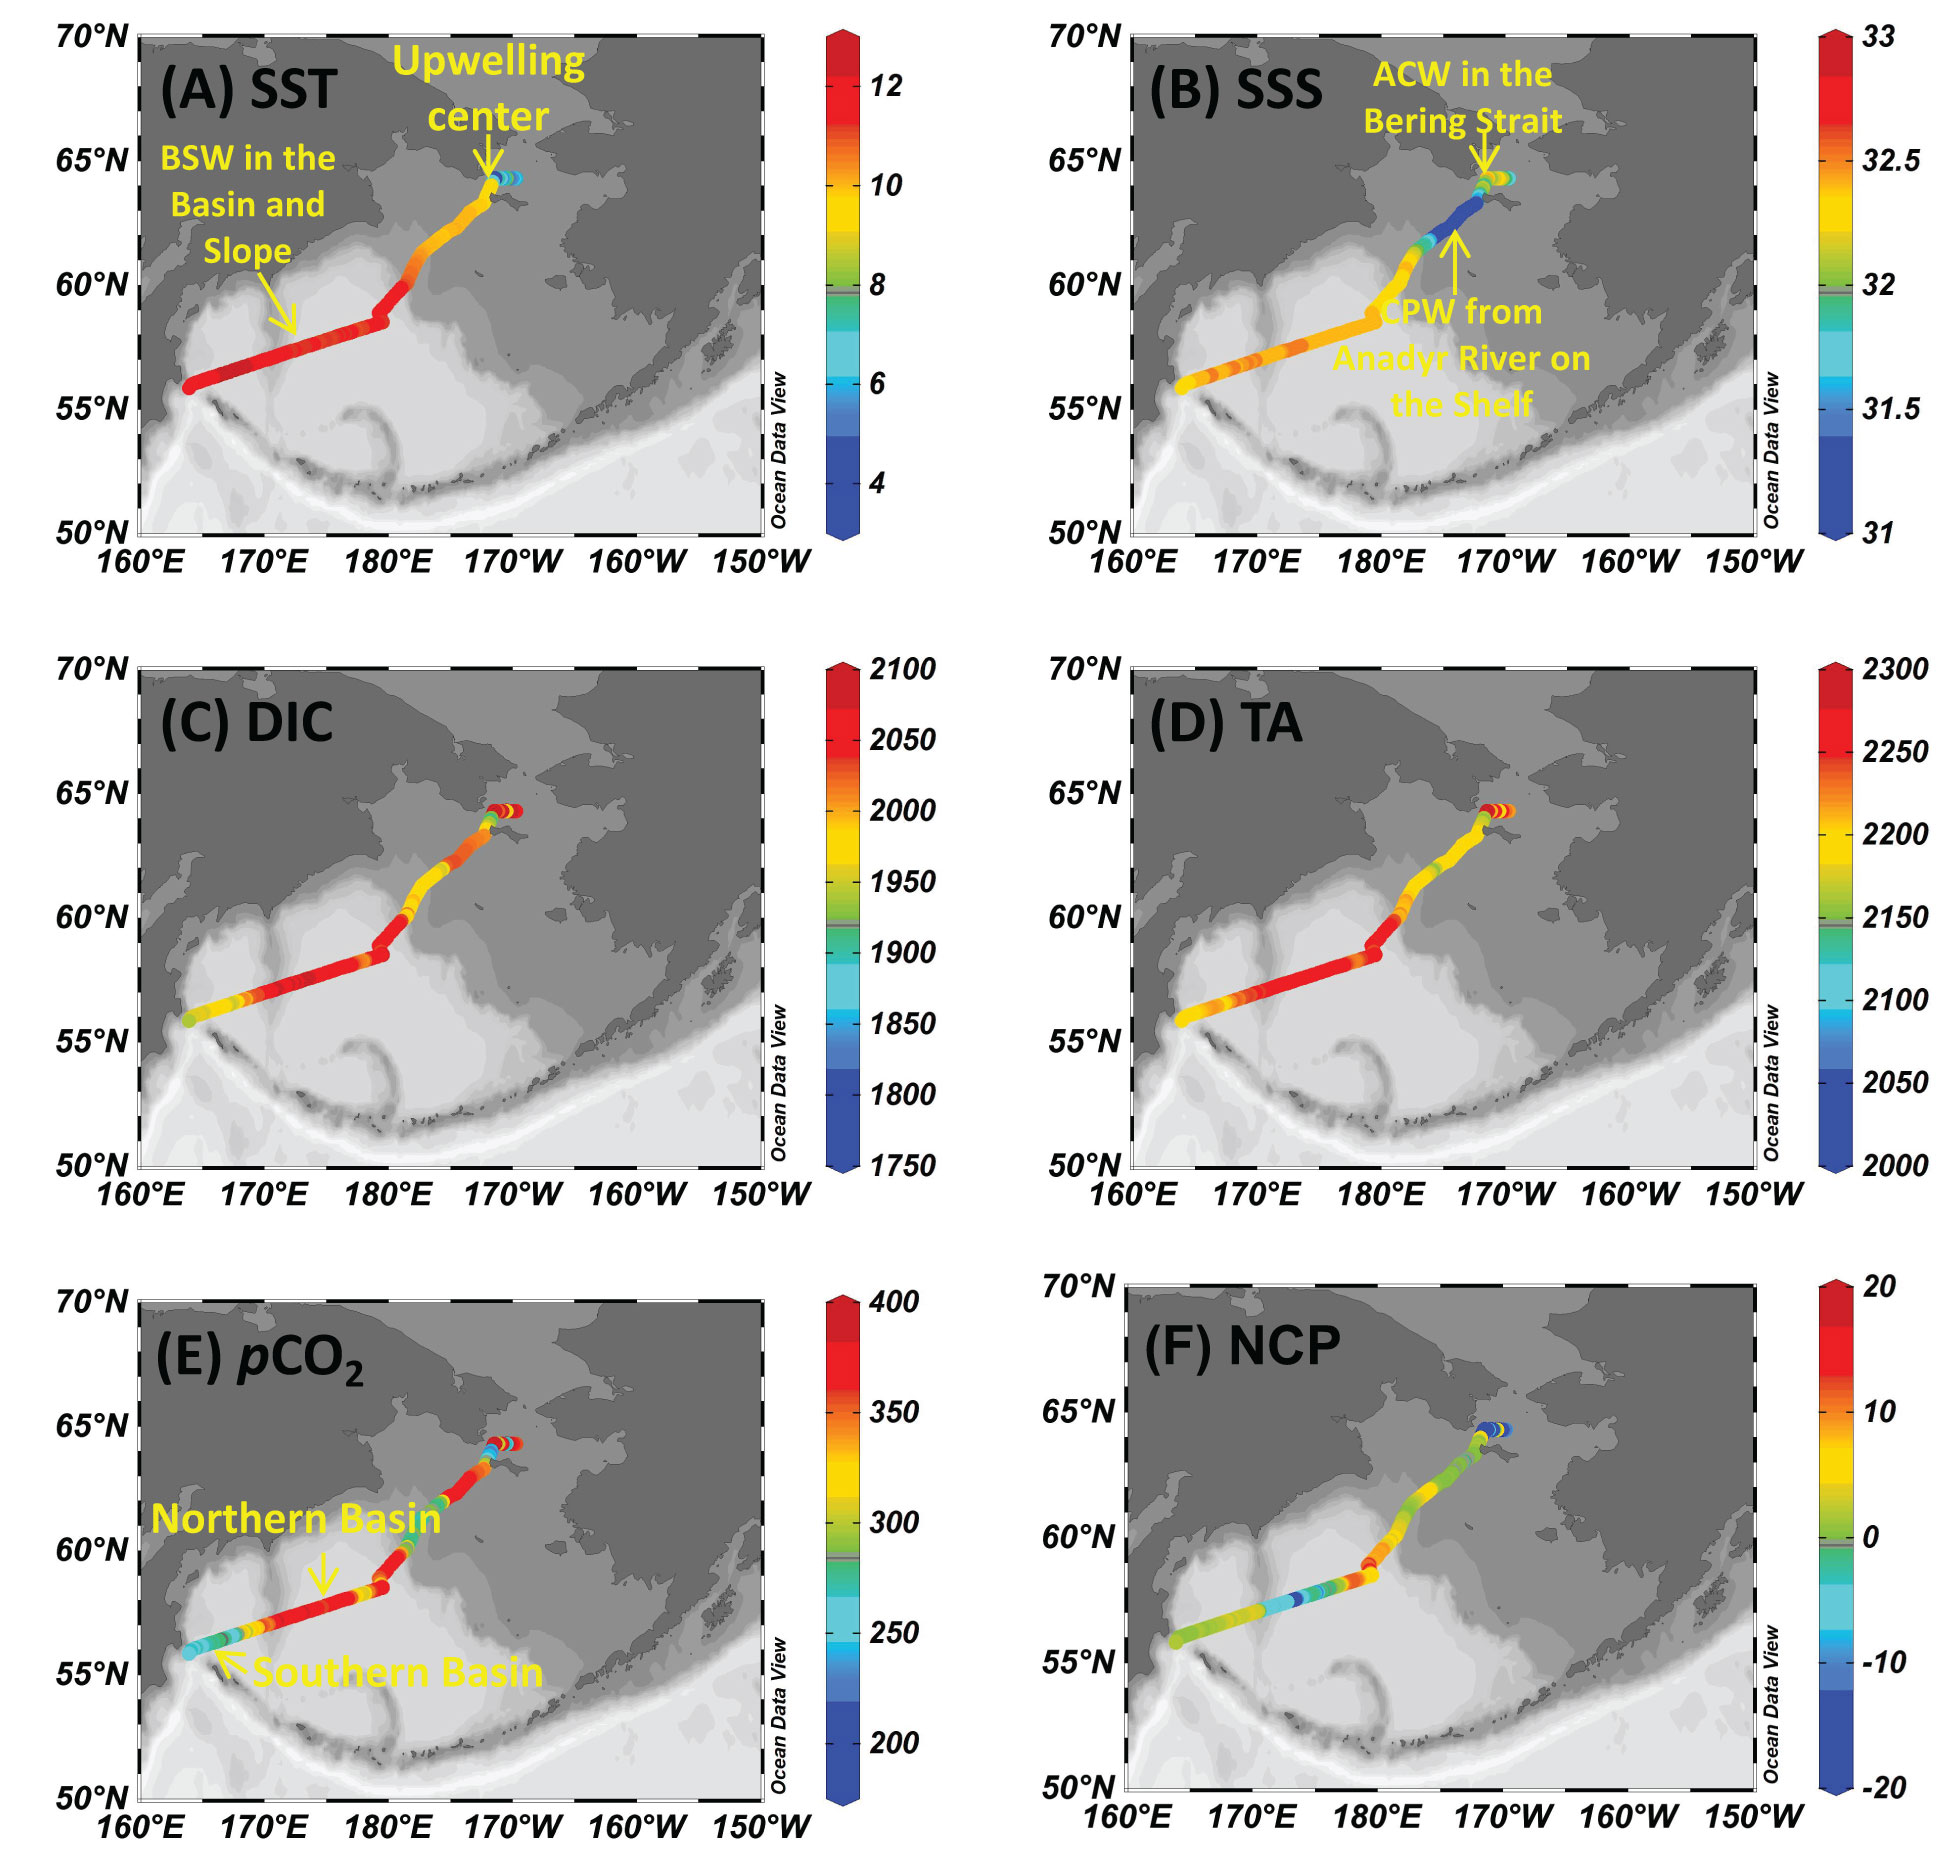
Figure 5 Sea surface distribution of (A) temperature, SST (°C), (B) salinity, SSS, (C) dissolved inorganic carbon, DIC (µmol kg-1), (D) total alkalinity, TA (µmol kg-1), (E) partial pressure of CO2, pCO2 (µatm), and (F) net community production, NCP (mmol C m-2d-1) during the return voyage in September.
In July, the influence of Bering Summer Water (BSW) featuring high SST and SSS was observed in the Southern Basin, the Northern Basin, and the Slope (Wang et al., 2022). In these three sub-regions, temperature and salinity varied within a narrow range of 9.8-11.3 °C and 32.6-32.9, respectively (Figures 2A, 4B). In nearshore areas of the Bering Strait and the adjacent offshore Shelf, the influence of a water mass featuring high SST (>11.0 °C) and low SSS (<31.2) was detected (Figures 2A, 4A). Sun et al. (2020) and Sun et al. (2021) also reported relatively low salinity water on the offshore Shelf during a summer cruise in 2010, which was mainly influenced by ice-melt water. However, there was almost no ice in the winter of 2017-2018 (see the ice concentrations in Figure S1), and the influence of ice-melt water might be minimal during this cruise. Influenced by the Anadyr River runoff, Pipko et al. (2017) reported a salinity of 30-32 in the Gulf of Anadyr during the warm season, which was almost consistent with the results of Dudarev et al. (2015). Thus, the surface water on the Shelf was probably diluted by the Coastal Plume Water (CPW) from the Anadyr River. In the western Bering Strait, regulated by the mixing of Alaskan Coastal Water (ACW, T>3 °C, 31.5<S<32.5), SST in offshore surface water continuously decreased, while SSS gradually increased to ~32.3 (Itoh et al., 2015; Song et al., 2016; Wang et al., 2022; Figures 3A, B).
In September, similar to the observations in July, the influence of BSW featuring high SST (10.9-12.4 °C) and SSS (32.3-32.5) was also observed in the Southern Basin, the Northern Basin, and the Slope, while the influence of ACW featuring low temperatures (<9 °C) was also observed in the Bering Strait. On the Shelf, the influence of CPW featuring low temperatures and salinity, with values of 9.4-10.9 °C and 31.0-32.4, respectively, was also detected in September (Figures 2B, 3A). In contrast to July, the coastal area in the western Bering Strait was influenced by the upwelling, which was evidenced by the low temperature (<5.0 °C) and relatively high salinity (>32) at the surface (Figures 2B, 3A), as previously documented by Chen et al. (2014).
3.2 Surface distributions of carbonate parameters
Surface distributions of DIC, TA, pCO2, and NCP during both voyages are shown in Figures 4 and 5. In July, DIC and TA in the Southern Basin, the Northern Basin, and the Slope showed a similar distribution pattern, with average values of 2056 ± 13 µmol kg-1 and 2245 ± 12 µmol kg-1, which were much higher than those of the Shelf (1991 ± 15 µmol kg-1 for DIC and 2237 ± 19 µmol kg-1 for TA). Associated with low salinity, extremely low DIC and TA were observed in the Bering Strait, both in the coastal area and offshore, which was probably attributable to the mixing of CPW from the Anadyr River and the influence of ACW (Wang et al., 2022). pCO2 decreased from 380 µatm in the Southern Basin and Northern Basin to 180 µatm in the Bering Strait. NCP in the Southern Basin and Northern Basin (13 mmol C m-2d-1) was slightly higher than in waters in the Bering Strait and the Shelf (8 mmol C m-2d-1).
In September, DIC and TA showed different distribution patterns in the Northern Basin and Southern Basin. High DIC and TA values were observed in the Northern Basin and the upwelling system, while low values were detected in the Southern Basin, the Slope, and the Shelf (Figures 5C, D). On the contrary, pCO2 was patchily distributed with low values (<300 µatm) in the Southern Basin and the Slope and high values (>350 µatm) in the other sub-regions (Figure 5E). The lowest NCP was observed in the western Bering Strait (Figure 5F).
4 Discussion
4.1 pCO2 and air-sea CO2 flux in different sub-regions and a comparison with other studies
Referencing the atmospheric pCO2 of 393-398 µatm (averaged 395 µatm), the average pCO2 gradient between the surface water and the overlying atmosphere, i.e., ΔpCO2, was -34~-216 µatm in all sub-regions (Table 1), suggesting an overall CO2 sink during both voyages across the Bering Sea. In July, surface water in the plume area of the Western Bering Strait was highly under-saturated with respect to the atmosphere, followed by the Shelf. In September, although super-saturation in upwelling was observed at nearshore stations in the Western Bering Strait (Figure 3C), the average ΔpCO2 was ~-51 µatm. During the return voyage, the influence of upwelling was limited to the coastal area, and the CO2 sinking offshore overwhelmed the CO2 outgassing in the upwelling center. Thus, the Bering Sea Strait acts as a CO2 sink in the fall, which is rather different from the findings of Sun et al. (2020). In the Southern Basin, the Northern Basin, and the Slope, the air-sea ΔpCO2 was ~-50 µatm (Table 1), which is similar to the result of Chen et al. (2014).
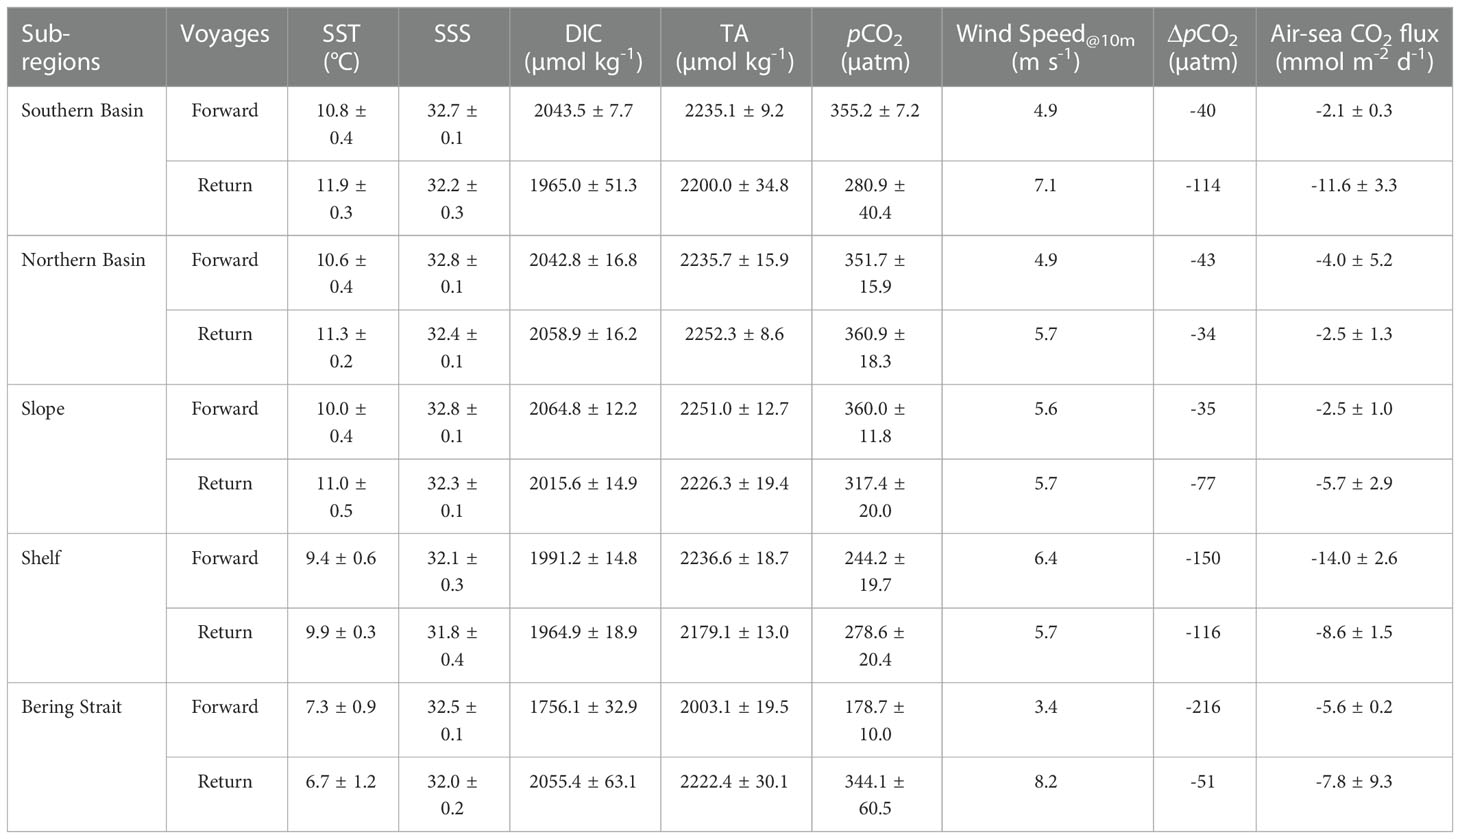
Table 1 Summary of average water properties and the air-sea CO2 fluxes in different sub-regions.
Following the method described in section 2.3, we estimated the air-sea CO2 flux during both voyages, and the results are summarized in Table 1. The instantaneous air-sea CO2 fluxes ranged from -2.1~-14.0 mmol m-2 d-1 in July and -2.5~-11.6 mmol m-2 d-1 in September (Table 1, negative values represent a CO2 sink). The stronger CO2 sinks in the Southern Basin, the Shelf, and the Bering Strait was probably attributable to the higher wind speed and low ΔpCO2 values (Table 1). Some studies have also reported the CO2 flux in the Bering Sea during warm seasons, and our estimated result was almost consistent with the result of Sun et al. (2020) (-2.1~-18.9 mmol m-2 d-1 in different sub-regions across the Bering Sea with underway measurements in July 2010), Chen et al. (2014) (-5.1~-16.3 mmol m-2 d-1 in different sub-regions across the Bering Sea with underway measurements in July 2008), and Cross et al. (2014) (-7.48 mmol m-2 d-1 on the Shelf with data downloaded from different data sets) but was much lower than that of Bates et al. (2011) (-22 ± 3 mmol m-2 d-1 on the Shelf with data obtained from field observations using a multiple linear regression (MLR) method).
4.2 Processes controlling DIC dynamics during July and September
As shown in sections 3.1 and 3.2, the dynamics of the carbonate system during both voyages were largely controlled by the mixing of different water masses, including BSW in the Southern Basin, the Northern Basin, and the Slope and the CPW, ACW, and the coastal upwelling in the western Bering Strait. We then adopted a DIC-TA diagram (Figure 6) to distinguish different processes (e.g., physical mixing and biological activities) affecting the carbonate system.
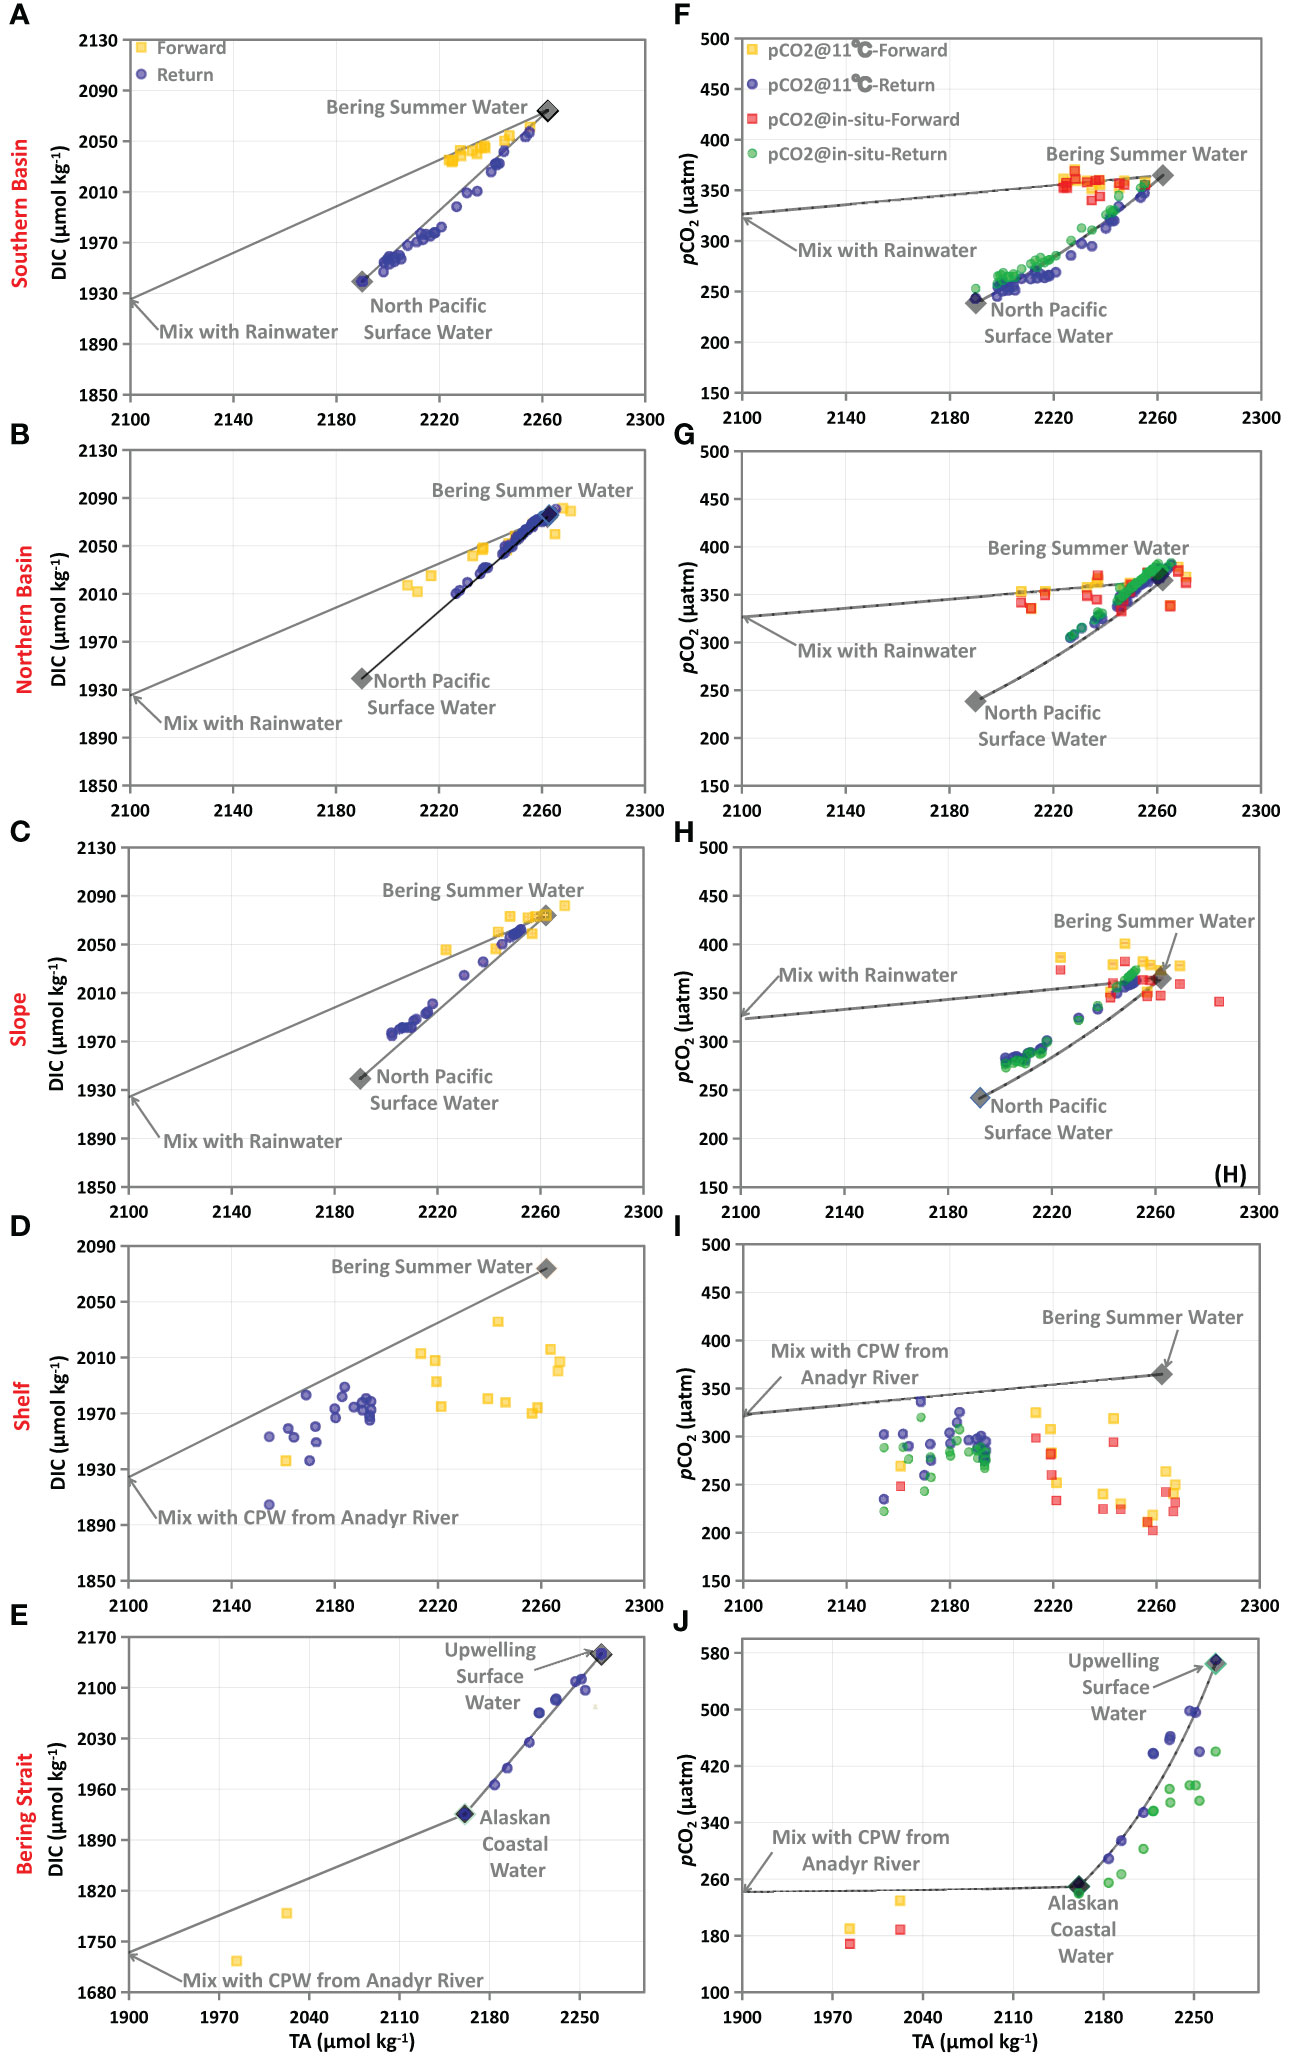
Figure 6 DIC-TA (left column) and pCO2-TA (right column) relationships in the Southern Basin (A, F), the Northern Basin (B, G), the Slope (C, H), the Shelf (D, I), and the Bering Strait (E, J) during both voyages. In all panels, gray diamonds are end-members, and their values are summarized in Table 2. Solid lines represent the hypothetical conservative mixing lines between different end-members. pCO2@11°C represents pCO2 normalized to 11 °C, following Wanninkhof et al. (2022), and 11 °C is the average SST in the Bering Sea Basin during both voyages.
In the Southern Basin and Northern Basin, surface water in July during the forward voyage was likely to be a two end-member mixing of BSW and a low salinity or freshwater end-member (Figures 6A, B). In the basin area, the sea surface is completely ice-free during all seasons (see the ice concentration in Figure S1), and the influence of ice-melt might be minimal. In addition, as documented by Song et al. (2016), the influence of river water discharge is minor in the basin area. Thus, the freshwater end-member here is probably influenced by a water mass other than ice-melt water and river water. In a complex carbonate system, the TA-S relationship has been used for a long time to differentiate water masses in coastal ecosystems and open oceans (Yang et al., 2021). Here, we further plotted the TA-S relationships in the Bering Sea Basin with data downloaded from the World Ocean Circulation Experiment (WOCE) program, surveying the WOCE section P14N in 2007 (Expocode 49NZ20071008). As a result, TA and salinity in the surface mixed layer (upper 75 m) of the Bering Sea Basin show a statistically significant positive relationship with an intercept of ~40 µmol kg-1 (not shown in the Figure). The intercept was much lower than the freshwater end-member of coastal rivers (such as the Anadyr River (Table 2; Pipko et al., 2017)), which further confirms the minor influence of river water discharge in the basin area. While the negligible intercept was almost consistent with the rainwater, which has zero solutes with TA of ~0 µmol kg-1 (Dai et al., 2013). Therefore, the surface water in the basin area was probably diluted by rainwater with zero solutes during warm seasons, and a two end-member mixing of BSW and Rainwater was assumed (Figures 6A, B). Using end-members summarized in Table 2, the non-conservative portion of DIC (ΔDIC) was 5.6 ± 2.2 µmol kg-1 and 5.8 ± 4.6 µmol kg-1, respectively, for the Southern Basin and Northern Basin, suggesting a slight DIC removal. The positive NCP values in Figures 3D and 4F also confirm the net biological consumption in July.
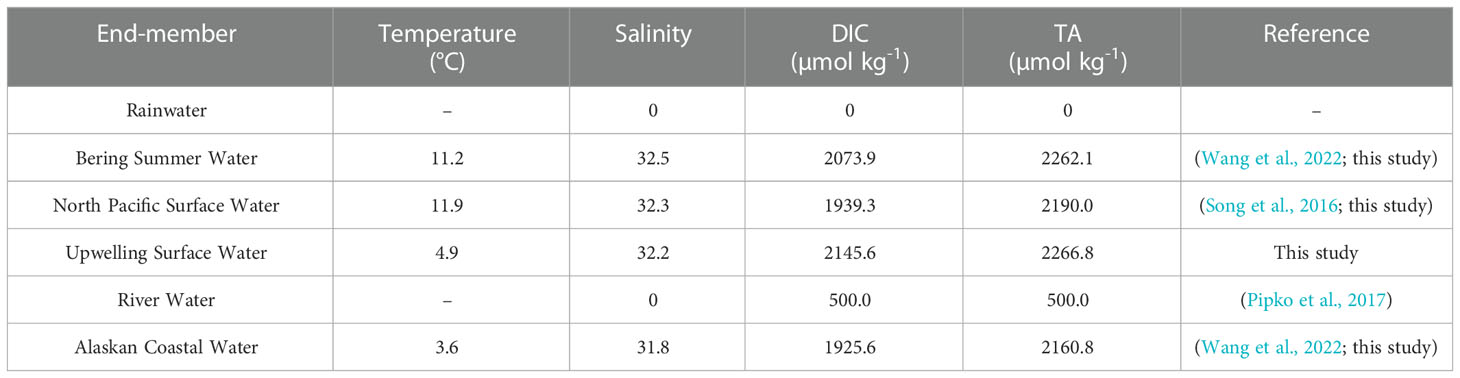
Table 2 Summary of end-member values used in the two end-member mixing models in different sub-regions of the Bering Sea.
In September, the lowest TA values were observed in the Southern Basin, off the Aleutian Island, which was probably influenced by the North Pacific Surface Water (NPSW) flowing into the Bering Sea via the several passages in the Aleutian Island Chain (Song et al., 2016). Thus, the surface water was probably a two end-member mixing of BSW and NPSW (Figures 6A, B). Following the method described in section 2.3 and the end-members summarized in Table 2, the ΔDIC was estimated as 6.9 ± 4.3 µmol kg-1 in the Southern Basin and -3.4 ± 1.8 µmol kg-1 in the Northern Basin. The low ΔDIC values in the Southern Basin suggest a low DIC consumption via biological production, which was further confirmed by the low Chlorophyll a concentration in Figure S2B and the NCP values of almost zero (Figures 3D, 4F). Previous studies have also documented that the Southern Bering Sea Basin is typically a high-nutrient, low-chlorophyll (HNLC) region with low biological production (Chen et al., 2004; Bates et al., 2011; Cross et al., 2014), while the slight negative ΔDIC and NCP (Figures 3D, 4F) values in the Northern Basin suggest a DIC addition via the decomposition of organic matter in early fall. Sun et al. (2020) also estimated the DIC consumption in the basin area with cruise data obtained during the summer of 2010, and their result suggested a DIC removal of 75 ± 7 µmol kg-1 via biological production (ΔDICbio in the Bering Sea Basin, BSB, in their study), which was, however, much higher than our estimates. The difference in the ΔDIC values of Sun et al. (2020) and our calculations suggest the significant inter-annual variability of the surface water, which stresses the need for greater spatial and temporal resolutions of field observation.
Similar to observations in the basin area, the slope water in July during the forward voyage was likely a two end-member mixing of BSW and Rainwater, while it was mixed with BSW and NPSW in September during the return voyage (see the different mixing schemes in Figure 6C). As a result, the observed DIC was almost consistent with the conservative mixing line, with a minor influence of biological consumption/respiration in both months. Using the end-members summarized in Table 2, the ΔDIC was estimated as -1.1 ± 6.8 µmol kg-1 in July and -8.6 ± 2.4 µmol kg-1 in September, suggesting the near metabolic balance during the forward voyage and a slight net heterotrophy during the return voyage.
On the Shelf, the sea surface was influenced by the CPW from the Anadyr River in both months. Thus, the surface water during both voyages was most likely to be a two end-member mixing of River Water (RW) and BSW (Figure 6D). As a result, the observed DIC was much lower than the conservative mixing line, suggesting a high DIC consumption via phytoplankton production. Using the end-members shown in Table 2, the estimated DIC removal (ΔDIC) was 59.9 ± 25.8 µmol kg-1 and 34.8 ± 14.0 µmol kg-1, respectively, during the July and September voyages, indicating strong biological consumption and CO2 removal during both months. During the cruise, the Chlorophyll a concentrations being relatively higher than in the basin area also confirmed the higher biological production on the Shelf (Figure S2). The highest DIC removal of 122 ± 45 µmol kg-1 was also reported on the Shelf by Sun et al. (2020) (ΔDICbio in the remaining region, RR, in their study), which was, however, much higher than our estimates. In the Bering Sea, the highest DIC consumption on the Shelf was probably sustained by the high nutrient supply from the Bering Slope Current (BSC) and other water masses (Chen et al., 2004; Bates et al., 2011; Cross et al., 2014). On the Bering Shelf, BSC contains relatively high nutrient concentrations accumulated from the remineralization of sinking particles (Grebmeier et al., 2015; Cross et al., 2018; Wang et al., 2022), and the influence of eddies and upwelling upwardly transports the nutrient-enriched subsurface water and levels up their concentrations at the surface (Song et al., 2016). Field observations have suggested that the algal bloom makes the coastal area along the continental shelf break a fertile region, the so-called “Green Belt”, where primary and secondary production is approximately 60% higher than that over the adjacent shelf and approximately 260% higher than in the basin (Okkonen et al., 2004; Mathis et al., 2010).
In the Bering Strait, surface water was influenced by the plume water from the Anadyr River in July and the coastal upwelling in September. Sustained by the high nutrient supply from local rivers, high biological production was observed in estuaries of the Yukon River and the Kush Yanukovich River at 63°N and 60°N, respectively, on the Alaska coast (Mathis et al., 2011; Cross et al., 2014; Wang et al., 2022), while the biological production/respiration in the plume area and the upwelling system in the western Bering Strait has been rarely reported. In this study, the surface water in the plume area was probably a two end-member mixing of River Water (RW) from the Anadyr River and ACW with significant DIC removal (Figure 6E), while the offshore surface water in the upwelling system was probably a two end-member mixing of ACW and surface water in the upwelling center (referred to as the Upwelling Surface Water, USW) with negligible DIC uptake (Figure 6E). Quantitative analysis suggested that there was a DIC removal of 54.2 ± 18.7 µmol kg-1 in the plume area, and a slight DIC addition of 2.1 ± 11.8 µmol kg-1 in the upwelling system. The negative NCP values in Figures 3D and 5F also suggest the decomposition of organic matter in the upwelling system. Sun et al. (2020) suggested a DIC removal of 44 ± 16 µmol kg-1 in the Western Bering Strait, which is similar to our calculations. But the DIC consumption/regeneration in the upwelling system was not observed and discussed in their study.
4.3 Processes controlling the spatial differences of sea surface pCO2
As shown in Figures 4E and 5E, the distributions of sea surface pCO2 showed high spatial variability, with the lowest values (<200 μatm) in the plume water and the highest values (>400 μatm) in the upwelling center in the Bering Strait. Offshore, pCO2 varied within the range of ~250-400 μatm. In July, high SST, SSS, and pCO2 were observed in the Southern Basin, the Northern Basin, and the Slope, while low SST, SSS, and pCO2 were observed on the Shelf (Figure 4). In September, although SST and SSS exhibited their high values both in the Southern Basin, the Northern Basin, and the Slope, pCO2 in the Southern Basin and the Slope was lower than in the Northern Basin (Figure 5). The different SST-pCO2 and SSS-pCO2 relationships suggest different controlling processes. In order to identify the effects of mixing, biological production, and temperature on the pCO2 dynamics, relationships between pCO2 and TA (pCO2-TA) were plotted (right panels in Figure 6). pCO2@11°C is normalized to 11 °C following the method of Wanninkhof et al. (2022), where 11 °C is the average SST in the Bering Sea Basin during both voyages.
As shown in Figures 6F-J, solid lines represent the hypothetical conservative mixing lines between different end-members, which was simulated using CO2SYS (version 1.1) (van Heuven et al., 2011). In the Northern Basin and Southern Basin, pCO2@11°C was almost consistent with the conservative mixing lines during both voyages (Figure 6F, G), suggesting that the pCO2 dynamics were mainly controlled by the water mass mixing with negligible influence of temperature effects and biological consumption/respiration. In the Slope, similar to the basin water, pCO2 measurements during both months were consistent with pCO2@11°C, which were slightly higher than the conservative values. On the contrary, associated with the high DIC consumption, pCO2@11°C on the Shelf was much lower than the conservative mixing line, while pCO2@11°C was similar to the observed in situ values (Figure 6I). Thus, the pCO2 dynamics were mainly controlled by mixing in the Slope and the DIC consumption via biological production on the Shelf. In the Western Bering Strait, the high DIC consumption in the coastal plume water makes the pCO2@11°C much lower than the conservative mixing line, and the low SST in high latitude areas would further draw down the sea surface pCO2 (Figure 6J). In the upwelling system, pCO2@11°C was consistent with the conservative mixing line, with negligible influence of biological consumption, while the low SST in the upwelling center made the observed pCO2 lower than pCO2@11°C (Figure 6J).
Air-sea CO2 fluxes may also contribute to the pCO2 dynamics in surface water. If pCO2 measurements are higher (lower) than the air pCO2, the sea surface acts as a CO2 source (sink), resulting in a decrease (increase) of DIC and seawater pCO2. During both voyages, the CO2 sinks in all sub-regions leveled up the sea surface DIC and subsequently, the pCO2, and their influence has been included in the DIC removal (ΔDIC) and the pCO2 biological drawdown in Figure 6. ΔDIC in this study is only a conservative estimate as air-sea CO2 flux will counteract the DIC deficit (Sun et al., 2020).
4.4 Processes controlling the pCO2 dynamics from July to September
As shown in section 4.3, the dynamics of sea surface pCO2 in the Southern Basin, the Northern Basin, the Slope, and the upwelling system in the Bering Strait were mainly controlled by the mixing of different water masses, while it was regulated by the mixing and biological production on the Shelf. Here, we take the Slope and the Shelf as examples to examine how pCO2 responds to different environmental changes from July to September (see section 2.5), and the result is shown in Figure 7.
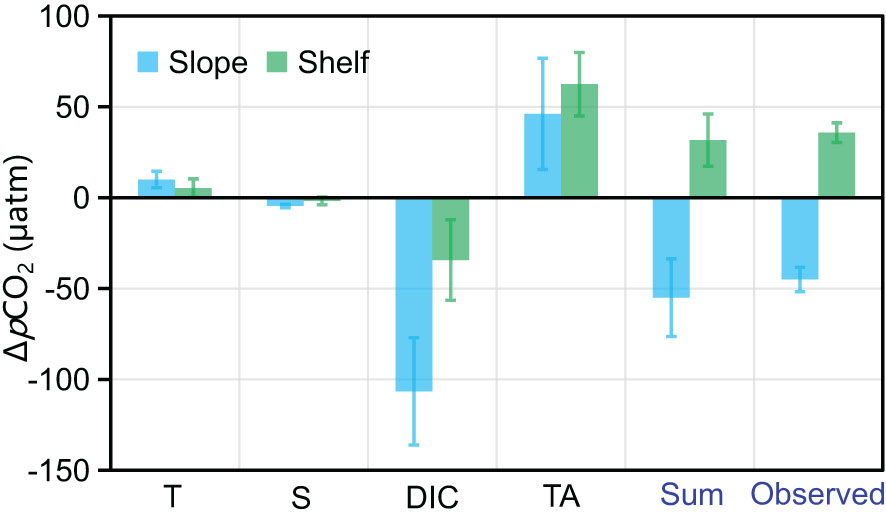
Figure 7 The quantification of each driver on temporal dynamics of sea surface pCO2 in the Slope of the Bering Sea (A) and the Shelf (B). ‘Sum’ is the accumulative effect from T, S, DIC, and TA, and ‘observed’ is the observed pCO2 change from July to September.
From July to September, SST increased from 10.0 ± 0.4 °C to 11.0 ± 0.5 °C in the Slope and from 9.4 ± 0.6 °C to 9.9 ± 0.3 °C on the Shelf (Table 1). Wanninkhof et al. (2022) suggested that pCO2 increases exponentially with increasing temperature at 4.13% °C-1. The increased SST would contribute partly to the increased pCO2 from 244.2 ± 19.7 µatm to 278.6 ± 20.4 µatm on the Shelf, while the seawater pCO2 in the Slope somehow decreased from 360.0 ± 11.8 µatm to 317.4 ± 20.0 µatm (Table 1), which was mainly regulated by the non-temperature effect.
As shown in Figure 7, DIC and TA are the dominant drivers for the pCO2 variabilities in the Slope, and the salinity effect is negligible. From July to September, a DIC and TA drawdown of ~49.2 µmol kg-1 and ~24.7 µmol kg-1 was observed (Table 1), which was probably attributable to the dilution of NPSW in September. With the ∂VpCO2/∂DIC and ∂VpCO2/∂TA of ~2.2 per µmol kg-1 and -1.8 µatm per µmol kg-1, we demonstrated that the changes in DIC and TA would draw down and increase the pCO2 by ~106.6 µatm and ~46.1 µatm, respectively, while the increased SST would increase pCO2 by ~9.8 µatm with the ∂VpCO2/∂T of ~9.8 µatm per °C. Overall, the pCO2 drawdown regulated by the mixing of low pCO2 NPSW overwhelmed the pCO2 increase via the temperature effect, and a pCO2 drawdown was thus observed. On the Shelf, with the mixing of plume water from the Anadyr River and the decreased biological production in September, DIC and TA decreased by ~26.3 µmol kg-1 and ~57.5 µmol kg-1 (Table 1), respectively, which jointly leveled up the pCO2 by ~28.1 µatm, dominating the pCO2 increase from July to September, while the contributions of temperature and salinity effects were minor (Figure 7).
5 Concluding remarks
We investigated the surface carbonate system during a forward voyage in July and a return voyage in September 2018 across the Bering Sea. SST, SSS, and sea surface pCO2 show significant spatial-temporal variability between these two voyages, which was mainly controlled by the mixing of different water masses. In the Southern Basin, the Northern Basin, and the Slope, the non-conservative portion of DIC was relatively low, and the surface carbonate system was mainly controlled by a two end-member mixing of Rainwater and BSW during the forward voyage and a two end-member mixing of NPSW and BSW during the return voyage. From July to September, higher factions of NPSW featuring low pCO2 were observed in the Southern Basin and the Slope during the return voyage, and a pCO2 drawdown of ~40-75 µatm was observed. On the Shelf, the surface water was a two end-member mixing of plume water from the Anadyr River and BSW during both voyages. Characterized by the high biological consumption, we observed low DIC and low pCO2 during both voyages. From July to September, the increased sea surface pCO2 on the Shelf was dominated by the decreased DIC biological consumption. In the Bering Strait, with the influence of plume water in July and the coastal upwelling in September, the coastal water was a CO2 sink during the forward voyage and a CO2 source during the return voyage. In different geographic regions, the surface water during both voyages was a net CO2 sink with fluxes of -2.1~-14.0 mmol m-2 d-1 and -2.5~-11.6 mmol m-2 d-1, respectively. This study highlights the rapid changes in the surface carbonate system under complex mixing schemes across the Bering Sea. In order to gain a comprehensive understanding of the carbon cycle in high-latitude marginal ecosystems, greater spatiotemporal resolution of field observations is needed.
Data availability statement
The raw data supporting the conclusions of this article will be made available by the authors, without undue reservation.
Author contributions
ZO contributed to the sampling and data measurement. YW contributed to quality control and data synthesis. WY and DQ analyzed the data and drafted the manuscript. All authors participated in the discussion of the data, interpretations, and manuscript revision.
Funding
This work was funded by the National Natural Science Foundation of China (41941013, 42176230), the National Key Research and Development Program of China (2019YFE0114800, 2019YFC1509101), Key Deployment Project of Centre for Ocean Mega-Research of Science, CAS (Grant No. COMS2020Q12), and Independent Research Projects of the Southern Marine Science and Engineering Guangdong Laboratory (Zhuhai) (SML2021SP306).
Acknowledgments
The authors express their sincere gratitude to the crews of the 9th Chinese National Arctic Research Expedition on board R/V Xuelong for their support as well as the Chinese National Arctic and Antarctic Data Center.
Conflict of interest
The authors declare that the research was conducted in the absence of any commercial or financial relationships that could be construed as a potential conflict of interest.
Publisher’s note
All claims expressed in this article are solely those of the authors and do not necessarily represent those of their affiliated organizations, or those of the publisher, the editors and the reviewers. Any product that may be evaluated in this article, or claim that may be made by its manufacturer, is not guaranteed or endorsed by the publisher.
Supplementary material
The Supplementary Material for this article can be found online at: https://www.frontiersin.org/articles/10.3389/fmars.2023.1107646/full#supplementary-material
Supplementary Figure 1 | Surface distributions of ice concentration in different months of 2017-2018 (from NASA’s Goddard Earth Sciences Data and Information Service Center, https://disc-beta.gsfc.nasa.gov/giovanni/).
Supplementary Figure 2 | Surface distributions of time-averaged Chlorophyll a concentration (mg m-3) with a resolution of 8-daily 4 km during the sampling time in July (A) and September (B) (from NASA’s Goddard Earth Sciences Data and Information Service Center, https://disc-beta.gsfc.nasa.gov/giovanni/).
References
Bates N., Mathis J., Jeffries M. A. (2011). Air-sea CO2 fluxes on the Bering Sea shelf. Biogeosciences 8, 1237–1253. doi: 10.5194/bg-8-1237-2011
Cai W. J., Dai M. H., Wang Y. C. (2006). Air-sea exchange of carbon dioxide in ocean margins: a province based synthesis. Geophys. Res. Lett. 33, L12603. doi: 10.1029/2006GL026219
Cao L., Qi D., Li Q., Yang B., Zhang Y., Zhang S., et al. (2021). Spectrophotometric loop flow analyzer for high-precision measurement of seawater pH. Talanta 224, 121775. doi: 10.1016/j.talanta.2020.121775
Chen C. T. A., Borges A. V. (2009). Reconciling opposing views on carbon cycling in the coastal ocean: continental shelves as sinks and near-shore ecosystems as sources of atmospheric CO2. Deep-Sea Res. Pt. II. 56, 578–590. doi: 10.1016/j.dsr2.2009.01.001
Chen B., Cai W. J., Chen L. (2015). The marine carbonate system of the Arctic ocean: assessment of internal consistency and sampling considerations, summer 2010. Mar. Chem. 176, 174–188. doi: 10.1016/j.marchem.2015.09.007
Chen L., Gao Z., Sun H., Chen B., Cai W. J. (2014). Distributions and air-sea fluxes of CO2 in the summer Bering Sea. Acta Oceanol. Sin. 33, 1–8. doi: 10.1007/s13131-014-0483-9
Chen L., Gao Z., Wang W., Yang X. (2004). Characteristics of pCO2 in surface water of the Bering abyssal plain and their effects on carbon cycle in the western Arctic ocean. Sci. China Ser. D. 47, 1035–1044. doi: 10.1360/03yd0010
Cross J. N., Mathis J. T., Frey K. E., Cosca C. E., Danielson S. L., Bates N. R., et al. (2014). Annual sea-air CO2 fluxes in the Bering Sea: insights from new autumn and winter observations of a seasonally ice-covered continental shelf. J. Geophys. Res. Oceans. 119, 6693–6708. doi: 10.1002/2013JC009579
Cross J. N., Mathis J. T., Pickart R. S., Bates N. R. (2018). Formation and transport of corrosive water in the pacific Arctic region. Deep-Sea Res. Pt II. 152, 67–81. doi: 10.1016/j.dsr2.2018.05.020
Dai M., Cao Z., Guo X., Zhai W., Liu Z., Yin Z., et al. (2013). Why are some marginal seas sources of atmospheric CO2? Geophys. Res. Lett. 40, 2154–2158. doi: 10.1002/grl.50390
Dai M., Su J., Zhao Y., Hofmann E., Cao Z., Cai W. J., et al. (2022). Carbon fluxes in the coastal ocean: synthesis, boundary processes and future trends. Annu. Rev. Earth Planet. Sci. 50, 593–626. doi: 10.1146/annurev-earth-032320-090746
DeJong H., Dunbar R. B. (2017). Air-sea CO2 exchange in the Ross Sea, Antarctica. J. Geophys. Res. 122, 8167–8181. doi: 10.1002/2017JC012853
Detlef H., Sosdian S. M., Kender S., Lear C. H., Hall I. R. (2020). Multi-elemental composition of authigenic carbonates in benthic foraminifera from the eastern Bering Sea continental margin (International ocean discovery program site U1343). Geochimica Cosmochimica Acta 268, 1–21. doi: 10.1016/j.gca.2019.09.025
Dickson A. G. (1990). Standard potential of the reaction: AgCl(s)+12H2(g)=Ag(s)+HCl(aq), and the standard acidity constant of the ion in synthetic sea water from 273.15 to 318.15 K. J. Chem. Thermodyn. 22, 113–127. doi: 10.1016/0021-9614(90)90074-Z
Dudarev O., Charkin A., Pipko I., Pugach S., Kosmach D., Chernykh D., et al. (2015). Biogeochemical studies of the system “Anadyr river-Bering sea” during the summer of 2013. Oceanology 55, 777–779. doi: 10.1134/S0001437015050033
Fransson A., Chierici M., Nojiri Y. (2006). Increased net CO2 outgassing in the upwelling region of the southern Bering Sea in a period of variable marine climate between 1995 and 2001. J. Geophys. Res. Oceans. 111, C08008. doi: 10.1029/2004JC002759
Friedlingstein P., Jones M. W., O’ Sullivan M., Andrew R. M., Bakke D. C. E., Hauck J., et al. (2022). Global carbon budget 2021. Earth Syst. Sci. Data. 14, 1917–2005. doi: 10.5194/essd-14-1917-2022
Grebmeier J. M., Bluhm B. A., Cooper L. W., Danielson S. L., Arrigo K. R., Blanchard A. L., et al. (2015). Ecosystem characteristics and processes facilitating persistent macrobenthic biomass hotspots and associated benthivory in the pacific Arctic. Prog. Oceanogr. 136, 92–114. doi: 10.1016/j.pocean.2015.05.006
Itoh M., Pickart R. S., Kikuchi T., Fukamachi Y., Ohshima K. I., Simizu D., et al. (2015). Water properties, heat and volume fluxes of pacific water in Barrow canyon during summer 2010. Deep-Sea Res. Pt I. 102, 43–54. doi: 10.1016/j.dsr.2015.04.004
Kwiatkowski L., Orr J. C. (2018). Diverging seasonal extremes for ocean acidification during the twenty-first century. Nat. Clim Change. 8, 141–145. doi: 10.1038/s41558-017-0054-0
Large W., Pond S. (1981). Open ocean momentum flux measurements in moderate to strong winds. J. Phys. Oceanogr. 11, 324–336. doi: 10.1175/1520-0485(1981)011<0324:OOMFMI>2.0.CO;2
Laws E. (1991). Photosynthetic quotients, new production and net community production in the open ocean. Deep-Sea Res. Pt A. 38 (1), 143–167. doi: 10.1016/0198-0149(91)90059-O
Lee K., Kim T. W., Byrne R. H., Millero F. J., Feely R. A., Liu Y. M. (2010). The universal ratio of boron to chlorinity for the north pacific and north Atlantic oceans. Geochim Cosmochim Ac. 74, 1801–1811. doi: 10.1016/j.gca.2009.12.027
Lueker T. J., Dickson A. G., Keeling C. D. (2000). Ocean pCO2 calculated from dissolved inorganic carbon, alkalinity, and equations for K1 and K2: validation based on laboratory measurements of CO2 in gas and seawater at equilibrium. Mari Chem. 70, 105–119. doi: 10.1016/S0304-4203(00)00022-0
Mathis J. T., Cross J. N., Bates N. R. (2011). Coupling primary production and terrestrial runoff to ocean acidification and carbonate mineral suppression in the eastern Bering Sea. J. Geophys. Res. 6, C02030. doi: 10.1029/2010JC006453
Mathis J. T., Cross J. N., Bates N. R., Bradley Moran S., Lomas M. W., Mordy C. W., et al. (2010). Seasonal distribution of dissolved inorganic carbon and net community production on the Bering Sea shelf. Biogeosciences 7, 1769–1787. doi: 10.5194/bg-7-1769-2010
Okkonen S. R., Schmidt G. M., Cokelet E. D., Stabeno P. J. (2004). Satellite and hydrographic observations of the Bering sea ‘green belt’. Deep-Sea Res. II. 51, 1033–1051. doi: 10.1016/S0967-0645(04)00099-2
Orr J. C., Epitalon J. M., Gattuso J. P. (2015). Comparison of ten packages that compute ocean carbonate chemistry. Biogeosciences 12, 1483–1510. doi: 10.5194/bg-12-1483-2015
Ouyang Z., Qi D., Zhong W., Chen L., Gao Z., Lin H., et al. (2021). Summertime evolution of net community production and CO2 flux in the western Arctic ocean. Global Biogeochem Cy 35, e2020GB006651. doi: 10.1029/2020GB006651
Pierrot D., Neill C., Sullivan K., Castle R., Wanninkhof R., Lüger H., et al. (2009). Recommendations for autonomous underway pCO2 measuring systems and data-reduction routines. Deep-Sea Res. II. 56, 512–522. doi: 10.1016/j.dsr2.2008.12.005
Pipko I., Pugach S., Luchin V., Francis O., Savelieva N., Charkin A., et al. (2017). Surface CO2 system dynamics in the gulf of anadyr during the open water season. Continent. Shelf Res. 217, 104371. doi: 10.1016/j.csr.2021.104371
Qi D., Wu Y., Chen L., Cai W. J., Ouyang Z., Zhang Y., et al. (2022). Rapid acidification of the Arctic chukchi Sea waters driven by anthropogenic forcing and biological carbon recycling. Geophys Res. Lett. 49, 2021GL097246. doi: 10.1029/2021GL097246
Song X., Bai Y., Cai W. J., Chen C. T. A., Pan D., He X., et al. (2016). Remote sensing of sea surface pCO2 in the Bering sea in summer based on a mechanistic semianalytical algorithm (MeSAA). Remote Sens. 8, 558. doi: 10.3390/rs8070558
Sun H., Gao Z., Di Q., Chen B., Chen L., Cai W. (2020). Surface seawater partial pressure of CO2 variability and air-sea CO2 fluxes in the Bering Sea in July 2010. Cont Shelf Res. 193, 104031. doi: 10.1016/j.csr.2019.104031
Sun H., Gao Z., Zhao D., Sun X., Chen L. (2021). Spatial variability of summertime aragonite saturation states and its influencing factor in the Bering Sea. Adv. Clim Chang Res. 12, 508–516. doi: 10.1016/j.accre.2021.04.001
Takahashi K. (2005). The Bering Sea and paleoceanography. Deep-Sea Res. II. 52, 16–18. doi: 10.1016/j.dsr2.2005.08.003
Takahashi T., Sutherland S. C., Wanninkhof R., Sweeney C., Feely R. A., Chipman D. W., et al. (2009). Climatological mean and decadal change in surface ocean pCO2, and net sea-air CO2 flux over the global oceans. Deep-Sea Res. II. 56 (8-10), 554–577. doi: 10.1016/j.dsr2.2008.12.009
van Heuven S., Pierrot D., Rae J. W. B., Lewis E., Wallace D. W. R. (2011). MATLAB program developed for CO2 system calculations (Oak Ridge, Tennessee: Carbon Dioxide Information Analysis Center, Oak Ridge National Laboratory, U.S. Department of Energy).
Wang H., Lin P., Pickart R. S., Cross J. N. (2022). Summer surface CO2 dynamics on the Bering sea and eastern chukchi sea shelves from 1989 to 2019. J. Geophys. Res. Oceans. 127, e2021JC017424. doi: 10.1029/2021JC017424
Wanninkhof R. (2014). Relationship between wind speed and gas exchange over the ocean revisited. Limnol Oceanogr. Methods 12, 351–362. doi: 10.4319/lom.2014.12.351
Wanninkhof R., Pierrot D., Sullivan K., Mears P., Barbero L. (2022). Comparison of discrete and underway CO2 measurements: inferences on the temperature dependence of the fugacity of CO2 in seawater. Mari Chem. 247, 104178. doi: 10.1016/j.marchem.2022.104178
Weiss R. F. (1974). Carbon dioxide in water and seawater: the solubility of a non-ideal gas. Mar. Chem. 2, 203–215. doi: 10.1016/0304-4203(74)90015-2
Wu Y., Qi D., Ouyang Z., Cao L., Feely R. A., Lin H., et al. (2021). Contrasting controls of acidification metrics across environmental gradients in the north pacific and the adjunct Arctic ocean: insight from a transregional study. Geophys. Res. Lett. 48, e2021GL094473. doi: 10.1029/2021GL094473
Keywords: Bering Sea, partial pressure of CO2 (pCO2), spatial variability, temporal dynamics, air-sea CO2 flux, controlling processes
Citation: Yang W, Wu Y, Cai W-J, Ouyang Z, Zhuang Y, Chen L and Qi D (2023) Rapid changes in the surface carbonate system under complex mixing schemes across the Bering Sea: a comparative study of a forward voyage in July and a return voyage in September 2018. Front. Mar. Sci. 10:1107646. doi: 10.3389/fmars.2023.1107646
Received: 25 November 2022; Accepted: 10 April 2023;
Published: 02 May 2023.
Edited by:
Marta Álvarez, Spanish Institute of Oceanography (IEO), SpainReviewed by:
Keyhong Park, Korea Polar Research Institute, Republic of KoreaYan Bai, Ministry of Natural Resources, China
Copyright © 2023 Yang, Wu, Cai, Ouyang, Zhuang, Chen and Qi. This is an open-access article distributed under the terms of the Creative Commons Attribution License (CC BY). The use, distribution or reproduction in other forums is permitted, provided the original author(s) and the copyright owner(s) are credited and that the original publication in this journal is cited, in accordance with accepted academic practice. No use, distribution or reproduction is permitted which does not comply with these terms.
*Correspondence: Di Qi, qidi@jmu.edu.cn