Massive nutrients offshore transport off the Changjiang Estuary in flooding summer of 2020
 Qianwen Sun1,2
  Dewang Li2,3,4*
  Bin Wang2,4
  Zhongsheng Xu1,2 Yanyi Miao2,5 Hua Lin2
  Haiyan Jin1,2,5,6 Zhibing Jiang2 Jiangning Zeng1,2,5,7
  Feng Zhou7
  Jianfang Chen2,7*
- 1Ocean College, Zhejiang University, Zhoushan, China
- 2Key Laboratory of Marine Ecosystem Dynamics, Second Institute of Oceanography, Ministry of Natural Resources, Hangzhou, China
- 3Observation and Research Station of Yangtze River Delta Marine Ecosystems, Ministry of Natural Resources, Zhoushan, China
- 4Donghai Laboratory, Zhoushan, China
- 5School of Oceanography, Shanghai Jiaotong University, Shanghai, China
- 6Key Laboratory of Tropical Marine Ecosystem and Bioresources, Fourth Institute of Oceanography, Ministry of Natural Resources, Beihai, China
- 7State Key Laboratory of Satellite Ocean Environment Dynamics, Second Institute of Oceanography, Ministry of Natural Resources, Hangzhou, China
Flood events significantly increase water discharges and terrigenous material inputs to coastal waters. Riverine nutrients in the Changjiang Estuary are transported by the dispersion of Changjiang Diluted Water (CDW) plumes and detached low-salinity water patches. However, the effects of flooding on nutrient offshore transports have not been well explored. Here, we present the nutrient conditions in the Changjiang Estuary and adjacent East China Sea in the historical flooding year 2020. Comparisons of nutrient distributions between flooding years, drought year and non-flooding years were also made. Our results showed that nitrate flux from the Changjiang River in August 2020 was 1.5 times that of the multi-year averaged flux in non-flooding years. Enormous riverine nutrient input resulted in much higher nutrient concentrations in the outer estuary than those in non-flooding years. In addition, a detached low-salinity water patch was observed, which made the salinity of the northern estuary even lower than that in the historical flooding year 1998. Surface dissolved inorganic nitrate (DIN) level in the low-salinity water patch was even ~16 times of that at nearby station in the drought year 2006. While phosphate (PO43−) concentrations were less than 0.1 μmol L−1 east of 123°E, which was probably caused by intensive biological uptake, as indicated by a high Chlorophyll a (Chl a) concentration (29.08 μg L−1). The depleted PO43− and high N/P of the low-salinity water patch suggested PO43− limitation even under flood conditions. A three end-member mixing model was adopted to identify the contributions of the CDW end-member (CDWend-member) and biological process to nutrient distributions. Our model results showed that the nutrient contribution of the CDWend-member to the estuary (122–124°E, 31–32.5°N) in flooding year 2020 was over double that in drought year 2006. Model-derived biological DIN uptake was as high as 24.65 μmol L−1 at the low-salinity water patch. Accordingly, the estimated net community production was 566–1131 mg C m−2 d−1 within the euphotic zone. The offshore transport of a low-salinity, high-DIN water patch during flooding could probably have a significant influence on biogeochemical cycles in the broad shelf, and even the adjacent Japan Sea.
1 Introduction
The East China Sea (ECS) is a marginal sea of the Northwest Pacific Ocean. The primary production in the ECS can be over 1 g C m−2 d−1, which is much higher than that in the South China Sea (Ning et al., 2004; Zhang et al., 2016). The strong biological carbon production and winter cooling sustain a strong air–sea carbon sink of 1320 Tg C yr−1 (Guo et al., 2015; Song et al., 2018). Also, it feeds food chains, supporting one of most important fishing grounds in the world (Gong et al., 2011; Saba et al., 2021; Zhang and Tang, 2022). Such high carbon production consumes massive nutrients, which are supplied by major currents in the ECS: the Kuroshio, the Taiwan Warm Current (TWC), and the Changjiang Diluted Water (CDW) (Su, 2001; Ichikawa and Beardsley, 2002; Zhou et al., 2009). The Kuroshio and TWC are the major nutrient sources for the broad ECS shelf (Chen, 1996a), whereas in the Changjiang Estuary, the Changjiang River is the major source of nutrients (Liu et al., 2009; Shen et al., 2012).
The Changjiang Estuary has the highest primary production in the ECS (Ning et al., 1988; Zhang et al., 2019). The nutrient sources supporting carbon production include riverine nutrient input (Chen et al., 2009), upwelled nutrients (Wang and Wang, 2007), Taiwan Warm Current nutrients (Shi et al., 2014), atmospheric deposition (Zhang et al., 2007a; Chen and Huang, 2021), and groundwater discharge (Wang et al., 2018). Among them, the riverine nutrients are the most important nutrient sources in the Changjiang Estuary (Zhang et al., 2019). Massive nutrients are transported to the Changjiang Estuary when the Changjiang runoff reaches its maximum in summer (Wang et al., 1983; Chen, 2009). Nitrate concentrations always exceed 100 μmol L−1 at the estuary mouth (around 121.9°E, 31°N). The high nutrient levels of the Changjiang River are diluted by the oligotrophic Kuroshio Surface Water, forming sharp nutrient gradients in surface waters of the estuary (Zhang et al., 2007b). In the broad ESC shelf, intruding Kuroshio Subsurface Waters contribute a large amount of nutrients, especially for phosphate (Chen, 1996). East of the turbidity maximum zone, algal bloom triggered by nutrient transport reduces nitrate concentrations to less than 20 μmol L−1 around 123°E, 31°N–32°N, and to only 1 μmol L−1 east of 124°E, 31°N–32°N (Chen et al., 2010; Wang et al., 2011; Zhang et al., 2020). In the plume water zone, except for algal bloom (Zhou et al., 2008; Wang et al., 2017a), riverine nutrient transports also contribute to the strong air–sea carbon sink (Zhai et al., 2013; Guo et al., 2015), as well as serious bottom hypoxia (Chen et al., 2007; Wang et al., 2017b). Thus, the mixing and extension of CDW (defined as waters with salinity ≤31) are important in regulating the biogeochemical cycles in the Changjiang Estuary (Pu, 1983; Wei et al., 2021a; Liu et al., 2021).
The Changjiang nutrient flux is largely controlled by river water flux (Shen, 1997). Flood events occurred in 1998 (Wang et al., 2002), 2010, 2012, 2016, and 2020 (Changjiang Water Resources Commission, 2022) in the Changjiang catchment, which carried enormous amount of freshwater into the Changjiang Estuary. Under flooding conditions, the CDW extended further east (Bai et al., 2014), and elevated nutrient levels were observed beyond 124°E, 31°N (Wang et al., 2003). Flooding has significant influence on the export of anthropogenic materials and coastal ecosystem (Liu et al., 2011). In a high-discharge year, coastal phytoplankton biomass significantly increased compared with that in normal years over the shelf (Gong et al., 2011). Additionally, the occurrence of extreme weather conditions appeared to increase, resulting in frequent flood events (Hirabayashi et al., 2013).
During the CDW extension, low-salinity water detachment in the Changjiang Estuary was observed in July 1986 (Chen et al., 2008), July 1997 (Lie et al., 2003), and August 2006 (Xuan et al., 2012), driven by southeasterly wind and tide. Moreover, Wei et al. (2021b) found offshore detached CDW may contribute to the formation of a local hypoxic center with low pH. The physical mechanisms of CDW detachment were examined by field observation and model simulation (Moon et al., 2010; Xuan et al., 2012). However, how the flooding event and CDW detachment influenced nutrient offshore transport, as well as its biogeochemical influences, were not well understood.
In this paper, we present how salinity and nutrient distributions were influenced by a historic flooding event in the Changjiang Estuary. The combined effects of flooding and CDW detachment on nutrients offshore transport in the Changjiang Estuary are discussed by comparing the nutrient status in flooding years with that in drought year and non-flooding years. We also adopted a three end-member mixing model to semi-quantitatively identify the contributions of CDW end-member (CDWend-member) to high nutrients in the estuary, and its biological implications based on model-derived net community production (NCP).
2 Data and methods
2.1 Field observation
A cruise was conducted on R/V Runjiang I in the Changjiang Estuary from 17 August to 30 August 2020 (Figures 1A, B). Water samples were collected by a 10-L Rossette hydrophore fitted with a Sea-Bird 917 conductivity-temperature-depth (CTD) recorder. Nutrient and chlorophyll a (Chl a) samples were collected from Niskin bottles attached to the CTD rosette.
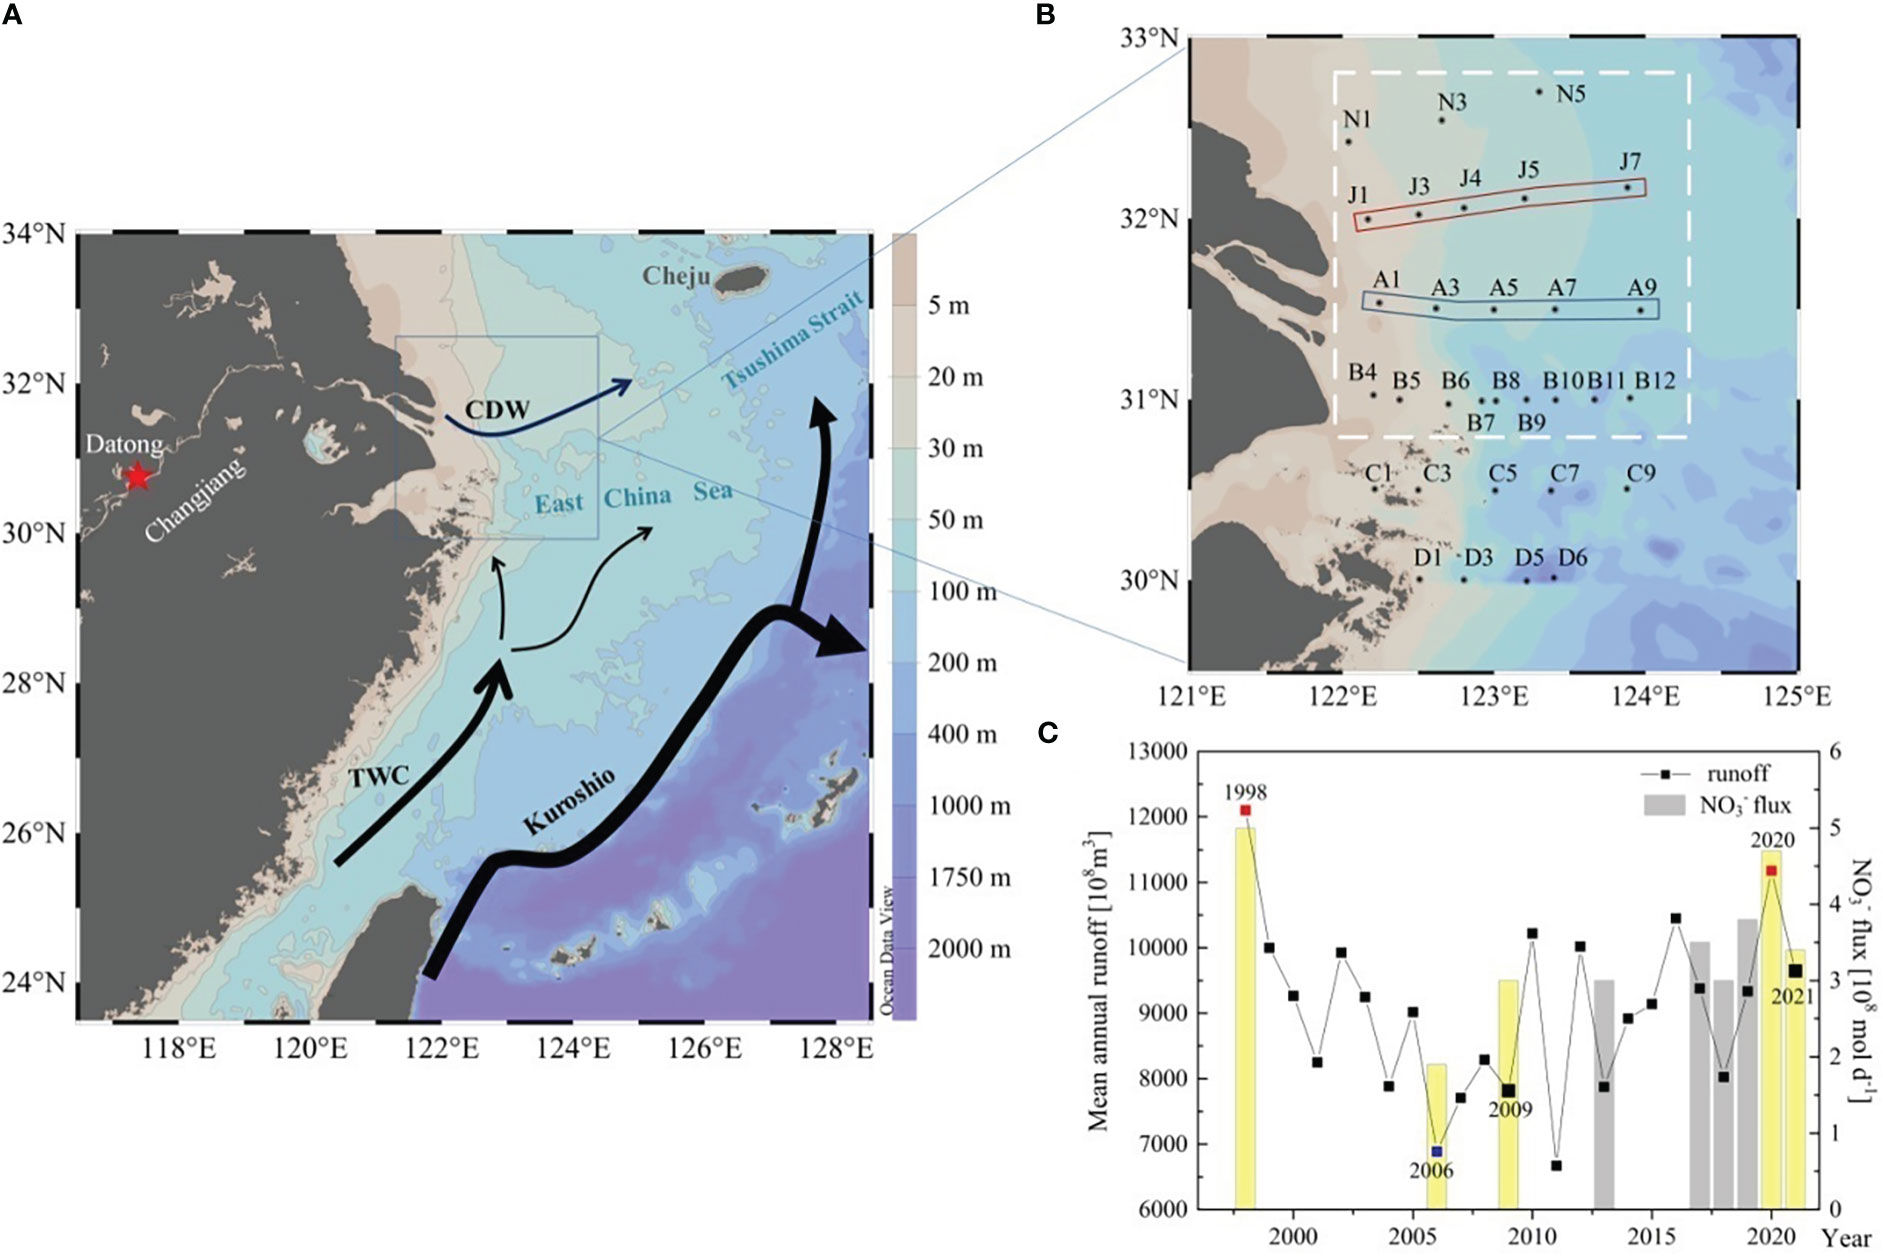
Figure 1 (A) Schematic of the circulation in the East China Sea (modified from Zhou et al., 2015) and (B) sampling stations of our cruise. (C) The mean annual Changjiang runoff from 1998 to 2021, and the average monthly flux of NO3− in the summer of flooding periods (2020, 1998), non-flooding periods (2009, 2021 and other years), and in drought year 2006. The arrows in (A) indicate the Kuroshio, the TWC (Taiwan Warm Current), and the CDW (Changjiang Diluted Water). The red star shows the location of Datong Hydrological Gauge Station. The polygons in (B) show two transects (J and A) selected to compare the vertical salinity profile. The red dots in (C) denoted the flooding years (2020, 1998) for the Changjiang runoff. And blue dots indicate drought year 2006, and black dots indicate non-flooding year (2009, 2021) we chose to compare.
The mean monthly Changjiang discharge in July and August of 2020 was 72,722 m3 s−1 and 60,600 m3 s−1, respectively, which were higher than the 58,871 m3 s−1 and 44,423 m3 s−1 in July and August of 2019. The mean annual runoff was 11180 × 108 m3 in 2020, which was 1.2 times that (9266 × 108 m3) of the previous five years (from 2015 to 2019) (Figure 1C). Discharge data were collected at the Datong Hydrological Gauge Station (117.62°E, 30.76°N), which were typically used to represent the Changjiang discharge (Changjiang Water Resources Commission, 2022). The Datong Hydrographic Gauge Station is located in the lower reach of the Changjiang River—about 624 km upstream from the river mouth.
2.2 Chemical analysis and nutrients flux estimation
Dissolved inorganic nutrient samples were filtered by 0.45 μm cellulose acetate filters and stored frozen for later laboratory analysis. Concentrations of nitrate (NO3−), nitrite (NO2−), ammonium (NH4+), phosphate (PO43−), and silicate [Si(OH)4] were measured with an Auto Discrete Chemical Analyzer (Smartchem 600, AMS Alliance, Italy) in the laboratory by colorimetric methods, as described by Grasshoff et al. (1999). The detection limits for NO3−, NO2−, NH4+, PO43−, and silicate were 0.02 μmol L−1, 0.02 μmol L−1, 0.30 μmol L−1, 0.03 μmol L−1, and 0.20 μmol L−1, respectively. The precisions of NO3−, NO2−, NH4+, PO43−, Si(OH)4 measurements were ±0.1, ± 0.02, ± 0.1, ± 0.03, ± 0.18 μmol L−1, respectively. In this study, the sum of NH4+, NO2−, and NO3− was considered as dissolved inorganic nitrogen (DIN). Chl a samples were filtered on a GF/F filter and stored at −20 °C, they were extracted with 10 mL of 90% acetone and measured using a Turner Designs 10-AU fluorometer according to the fluorometric acidification procedure. The detection limits and precisions of Chl a measurement are 0.025 μg L−1 and 5%, respectively. Total suspended matter (TSM, mg L−1) samples were filtered through pre-weight GF/F filters and rinsed with Milli-Q waters
In this study, the average monthly fluxes of NO3− from the Changjiang entering the estuary were calculated as follows:
where F is the Changjiang nutrients flux (mol d―1) (NO3−, PO43−, Si(OH)4), C is the average concentration (μmol L−1) of nutrients in the Datong Hydrological Gauge Station (salinity=0), and Q is the average monthly discharge (m3 d−1) of the Changjiang measured in the Datong Hydrological Gauge Station. The concentrations of NO3−, PO43−, and Si(OH)4 (C ) were 91.89, 0.74 and 115.70 μmol L−1 in August 2020. The average discharge (Q ) of 2020 was 60,600 m3 s−1, which was equivalent to 5.2 × 10⁹ m3 d−1. Hence, the flux (F ) of NO3−, PO43−, and Si(OH)4 in August 2020 were 4.8, 0.03, and 6.0 × 10⁸ mol d−1, as calculated by Equation 1.
2.3 End-member mixing model and NCP estimation
A three end-member mixing model was constructed to estimate the nutrient contributions of different water masses, and to distinguish the biological process-induced changes from the physical mixing process. Potential temperature and salinity (θ-S) were used to identify the characteristics of three water masses in the study area (Supplemental Figure 1, Gong et al., 1995; Cao et al., 2011). The mixing model was based on mass balance equations for potential temperature and salinity as follows:
where f1 , f2 , and f3 are the fractions of the end-members; θ1 , θ2 , and θ3 are the potential temperature of the three end-members; s1 , s2 , and s3 are the salinities of the three end-members, respectively; and θ and S are the potential temperature and salinity of the samples.
The conservative nutrient concentrations by mixing of the end-member (NUTmix) can then be calculated as follows:
where NUT1 , NUT2 , and NUT3 are the nutrient concentrations of the three end-members, respectively. NUT is the nutrient concentration of the specific water sample, and ΔNUT is the difference between NUT and NUTmix , which reflects the amount of nutrients produced (positive) or removed (negative) associated with biological processes (Han et al., 2012). ΔNUT is used to estimate the biological carbon uptake (NCPDIN ) in the euphotic zone according to Equation 7 (Wang et al., 2014a).
where IΔDIN is the inventory in the whole box calculated by Δ DIN data from 22 stations at transects B, A, J, and N (according to Wang et al., 2014a). RC/N is the carbon to DIN stoichiometric ratio, which is assumed to be 6.6 in this study (Redfield et al., 1963). The area (A) in this study mainly covers the CDW (transects B, A, J, and N are covered, as seen in the white dashed rectangle in Figure 1), which coincides with the boundaries used by Wang et al. (2014a). The euphotic zone depth (Zeu) is defined as a water depth with >1% available surface photosynthetic radiation, which is estimated from multi-year summer observational averaged data (Zeu is defined as 7.7 m) (Li et al., 2021). The residence time (τDIN ) is calculated to be about 5–10 d, based on the trajectories of drifting buoys in the Changjiang Estuary (Zhang et al., 2020).
3 Results
3.1 Salinity distributions in the Changjiang Estuary in August 2020
The extension of the CDW was observed during the cruise in August 2020. The CDW (S ≤31) widely distributed over the Changjiang Estuary and extended to outside the estuary under flooding conditions (Figure 2A). The salinity of surface waters was less than 31 in the whole study area, except for a few stations of transect C and transect D. Along the CDW extension, the main body of CDW mainly spread along transects J and A, and a low-salinity water patch (S ≤20) separated from the main body of the CDW along 122.5°E at station J3, with an area of ~120 km × 40 km covering stations J4, J5, and J7 (Figure 2A). As for the vertical profile, the CDW (S ≤31) occupied the space from nearly the surface to a depth of 15 m. At stations J1 and A1, the salinity of the entire water column were less than 31 (Figures 2B, C).
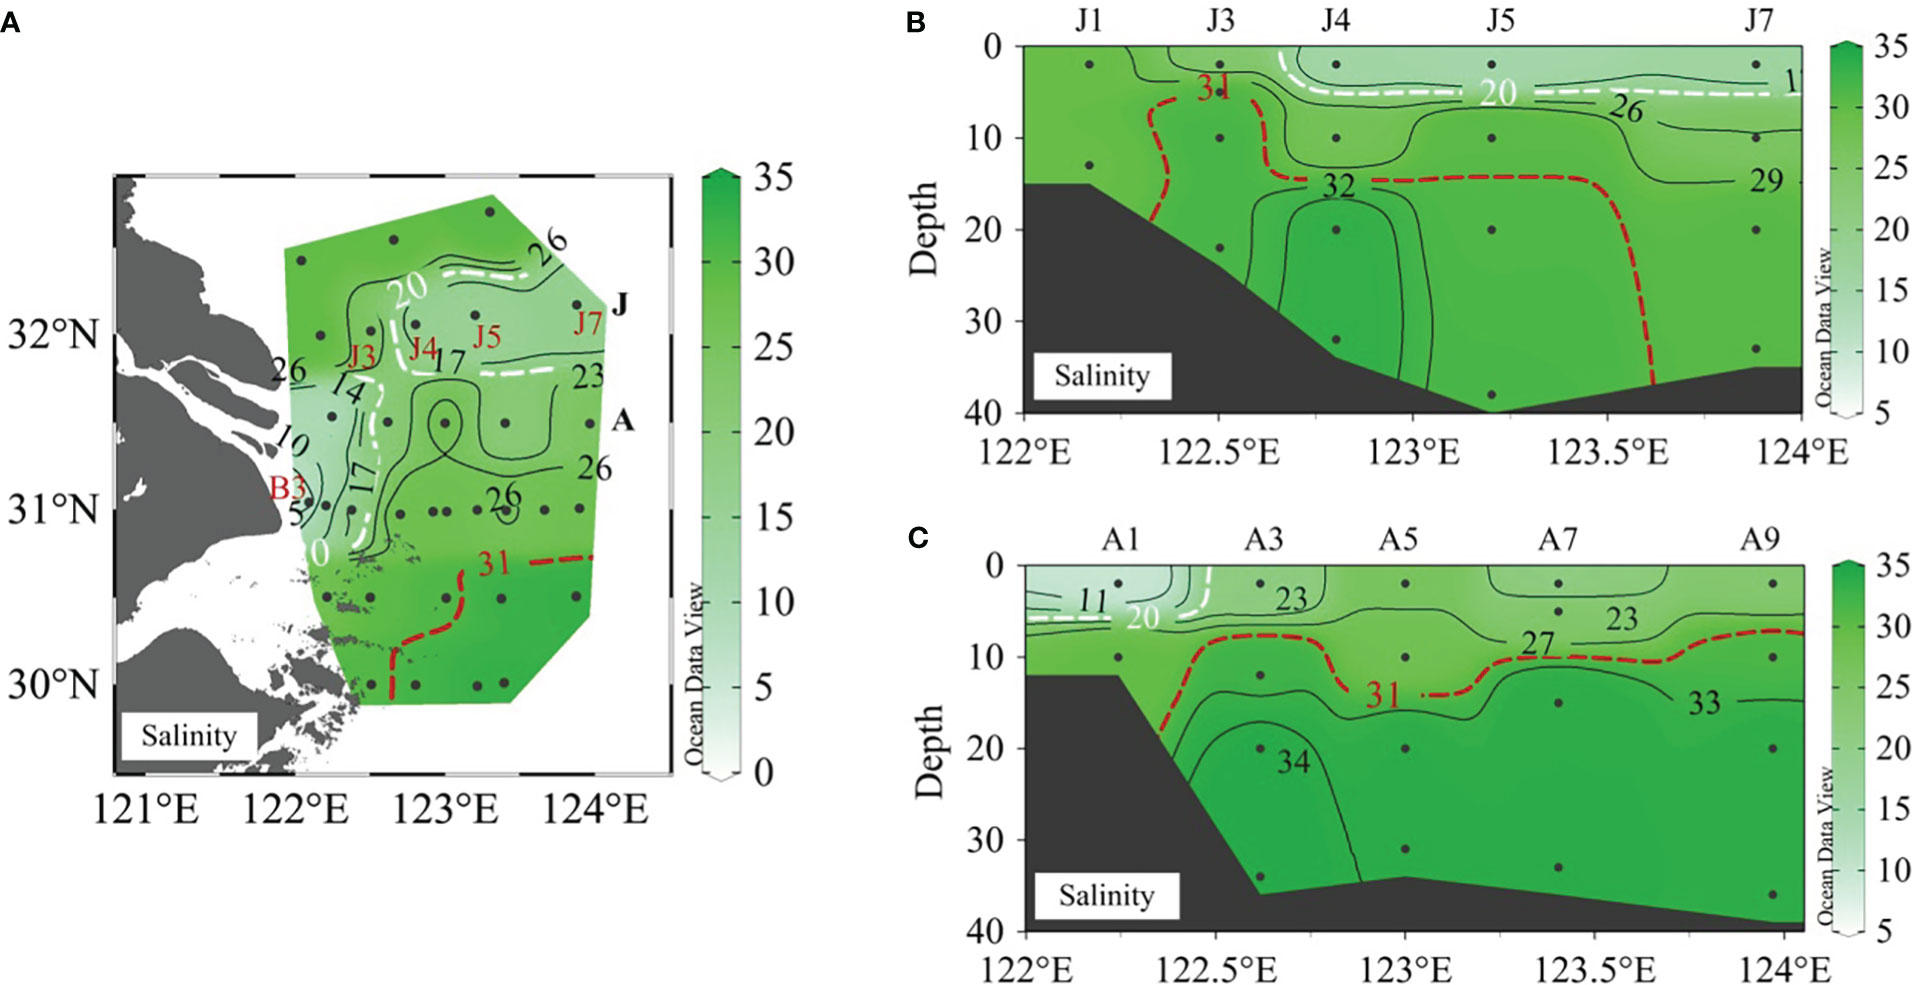
Figure 2 Distribution of (A) surface salinity and vertical profiles of salinity along (B) transect J and (C) transect A. The locations of transects J and A are denoted in (A). The 31-isohaline (red dashed lines) indicates the boundary of the Changjiang Diluted Water. The 20-isohaline (white dashed lines) is the boundary of the low-salinity water patch.
3.2 Nutrients and Chl a distribution in the Changjiang Estuary
The surface nutrient distributions exhibited a tongue-like shape in the estuary, which was consistent with the distribution pattern of salinity. At the estuary mouth, nutrient levels were extremely high. The surface DIN, PO43−, and Si(OH)4 were 88.70 μmol L−1, 1.55 μmol L−1, and 102.30 μmol L−1 at B3, respectively. These values sharply decreased to 2.60 μmol L−1, 0.03 μmol L−1, and 2.70 μmol L−1, respectively, to the south of the study area, which had a salinity of ~31. The extremely high nutrient concentrations in B3 were probably caused by inflow of the Changjiang. The relatively low nutrient and high salinity in the south area indicated that the Changjiang’s influence decreased.
At station J7 of low-salinity water patch, the surface DIN and Si(OH)4 were 22.92 μmol L−1 and 23.80 μmol L−1, respectively. While, the surface PO43− decreased to less than 0.10 μmol L−1 (Figures 3A–C). Chl a concentrations in the low-salinity patch were high. The Chl a at station J3, J5 were 28.53 μg L−1 and 29.62 μg L−1, respectively (Figure 3D). The high Chl a and low phosphate in the patch indicated that the CDW nutrients could trigger significant phytoplankton bloom. The total sediment matter (TSM) was extremely high over a narrow area of estuary, where Chl a was relatively low, regardless of high nutrient concentration (Figures 3D, E). The high nutrients but low Chl a condition was probably caused by light limitation of algal growth.
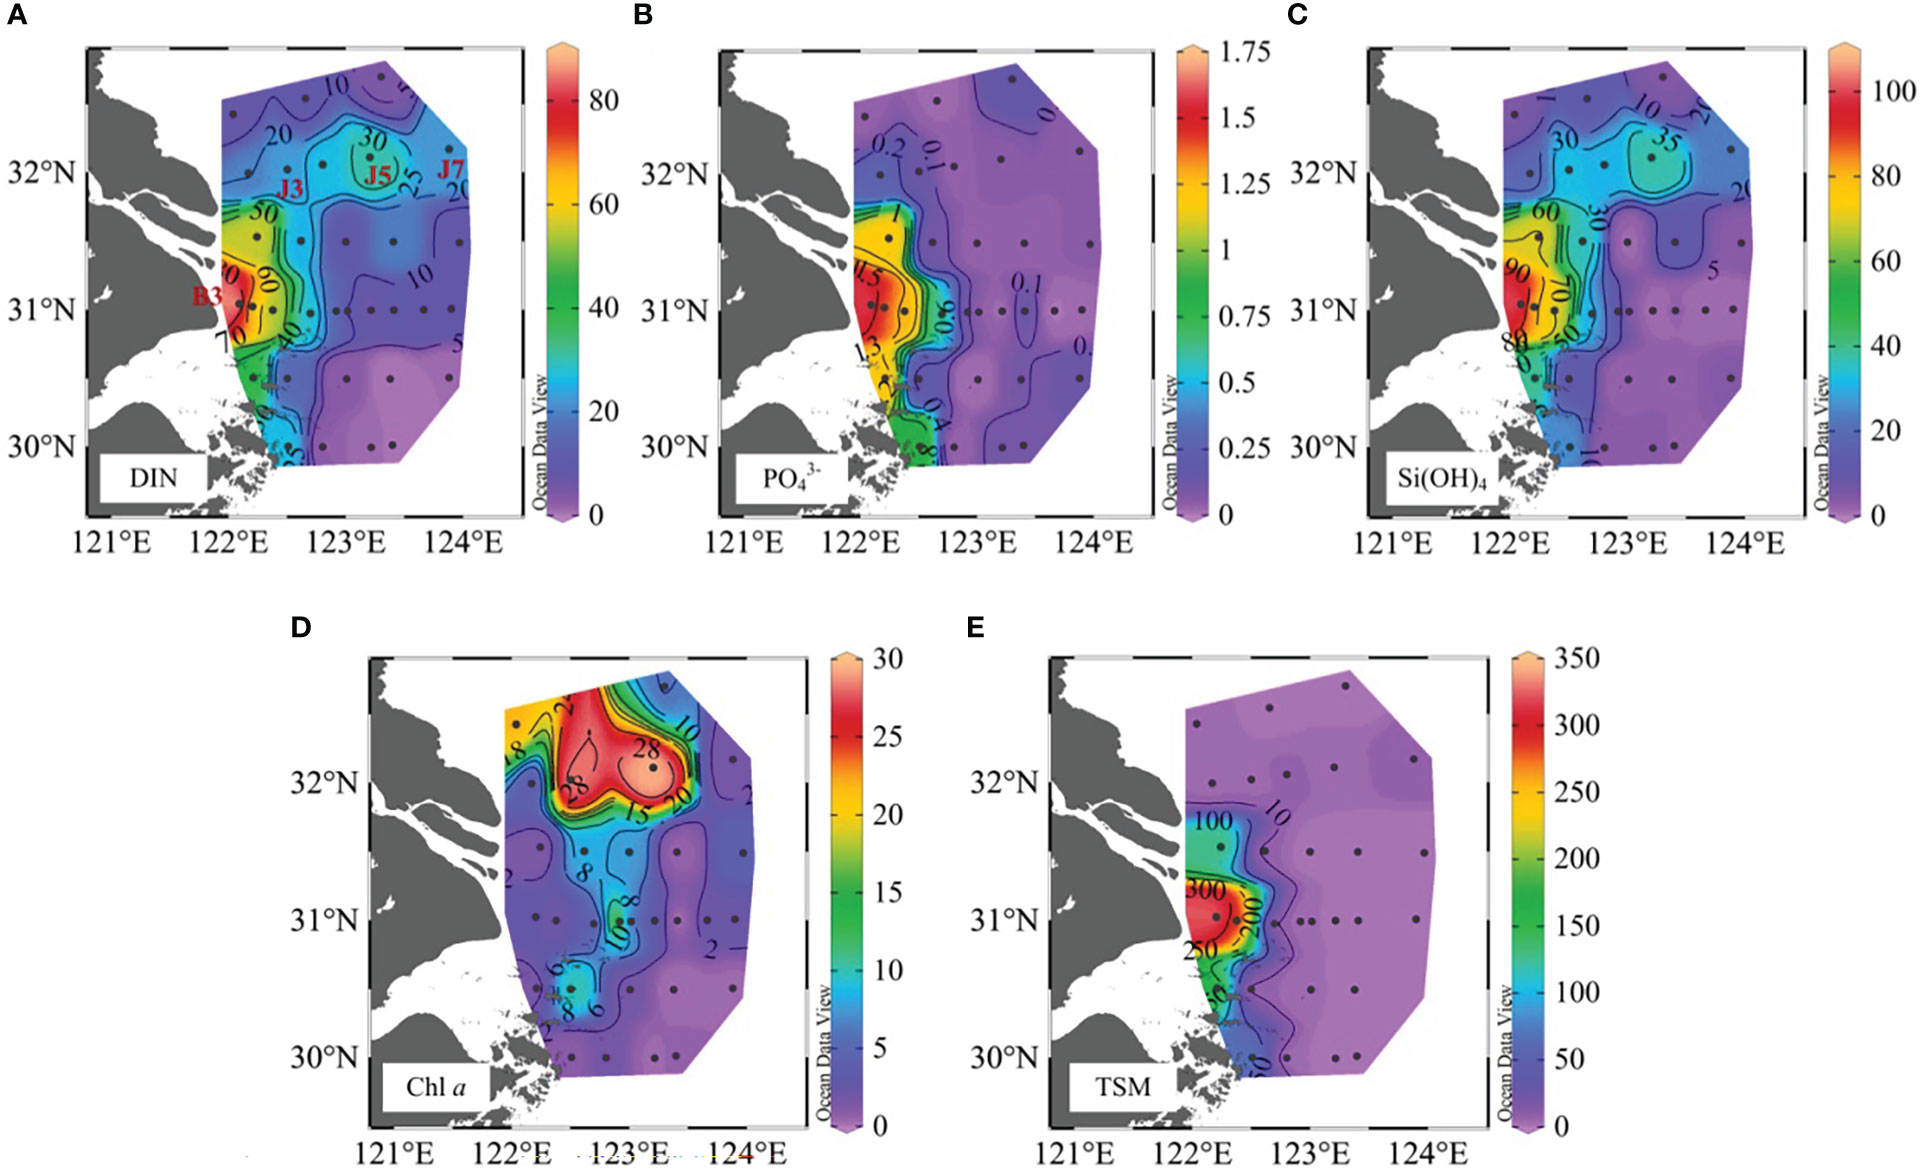
Figure 3 The surface distributions of (A) dissolved inorganic nitrogen (DIN, the sum of NO3−, NH4+, and NO2−), (B) phosphate, (C) silicate, (D) Chl a and (E) total suspended matter (TSM).
4 Discussion
4.1 Nutrients offshore transport in flooding and non-flooding year
In this study, observation results of the Changjinag Estuary in drought year 2006, non-flooding years (August 2009 and August 2021) and in flooding years (August 1998 and August 2020) are compared to reveal the difference of CDW extension and its effects on nutrient transport.
A salinity of 31 is typically used as a threshold in defining CDW (Pu, 1983). In our cruise area, as the boundary of 31 isohaline was not observed, a salinity of 26 was defined as the core zone of CDW (CDWcore) (Mao et al., 1963). Such a definition was also used by Beardsley et al. (1985); Zhou et al. (2009) and Li et al. (2021). The 26 isohaline (white dashed line in Figure 4C) of the CDWcore in 2020 reached a farther easterly distance than that in drought year and non-flooding years (white dashed line in Figures 4E, G, I), which was similar to that reported by Gong et al. (2011). The monthly averaged discharge for the flooding period was 60600 m3 s−1 in August 2020, as recorded at the Datong Hydrological Gauge Station, which is ~1.5 times the multi-year mean discharge in non-flooding years (August 2013, 2017, 2018, 2019 and 2021) (Changjiang Water Resources Commission, 2022). It is reasonable that flooding intensified the CDWcore expansion by increasing the Changjiang runoff discharge, which was also observed in the Mississippi River plume and the Pearl River plume (Shi and Wang, 2009; Ren et al., 2020).
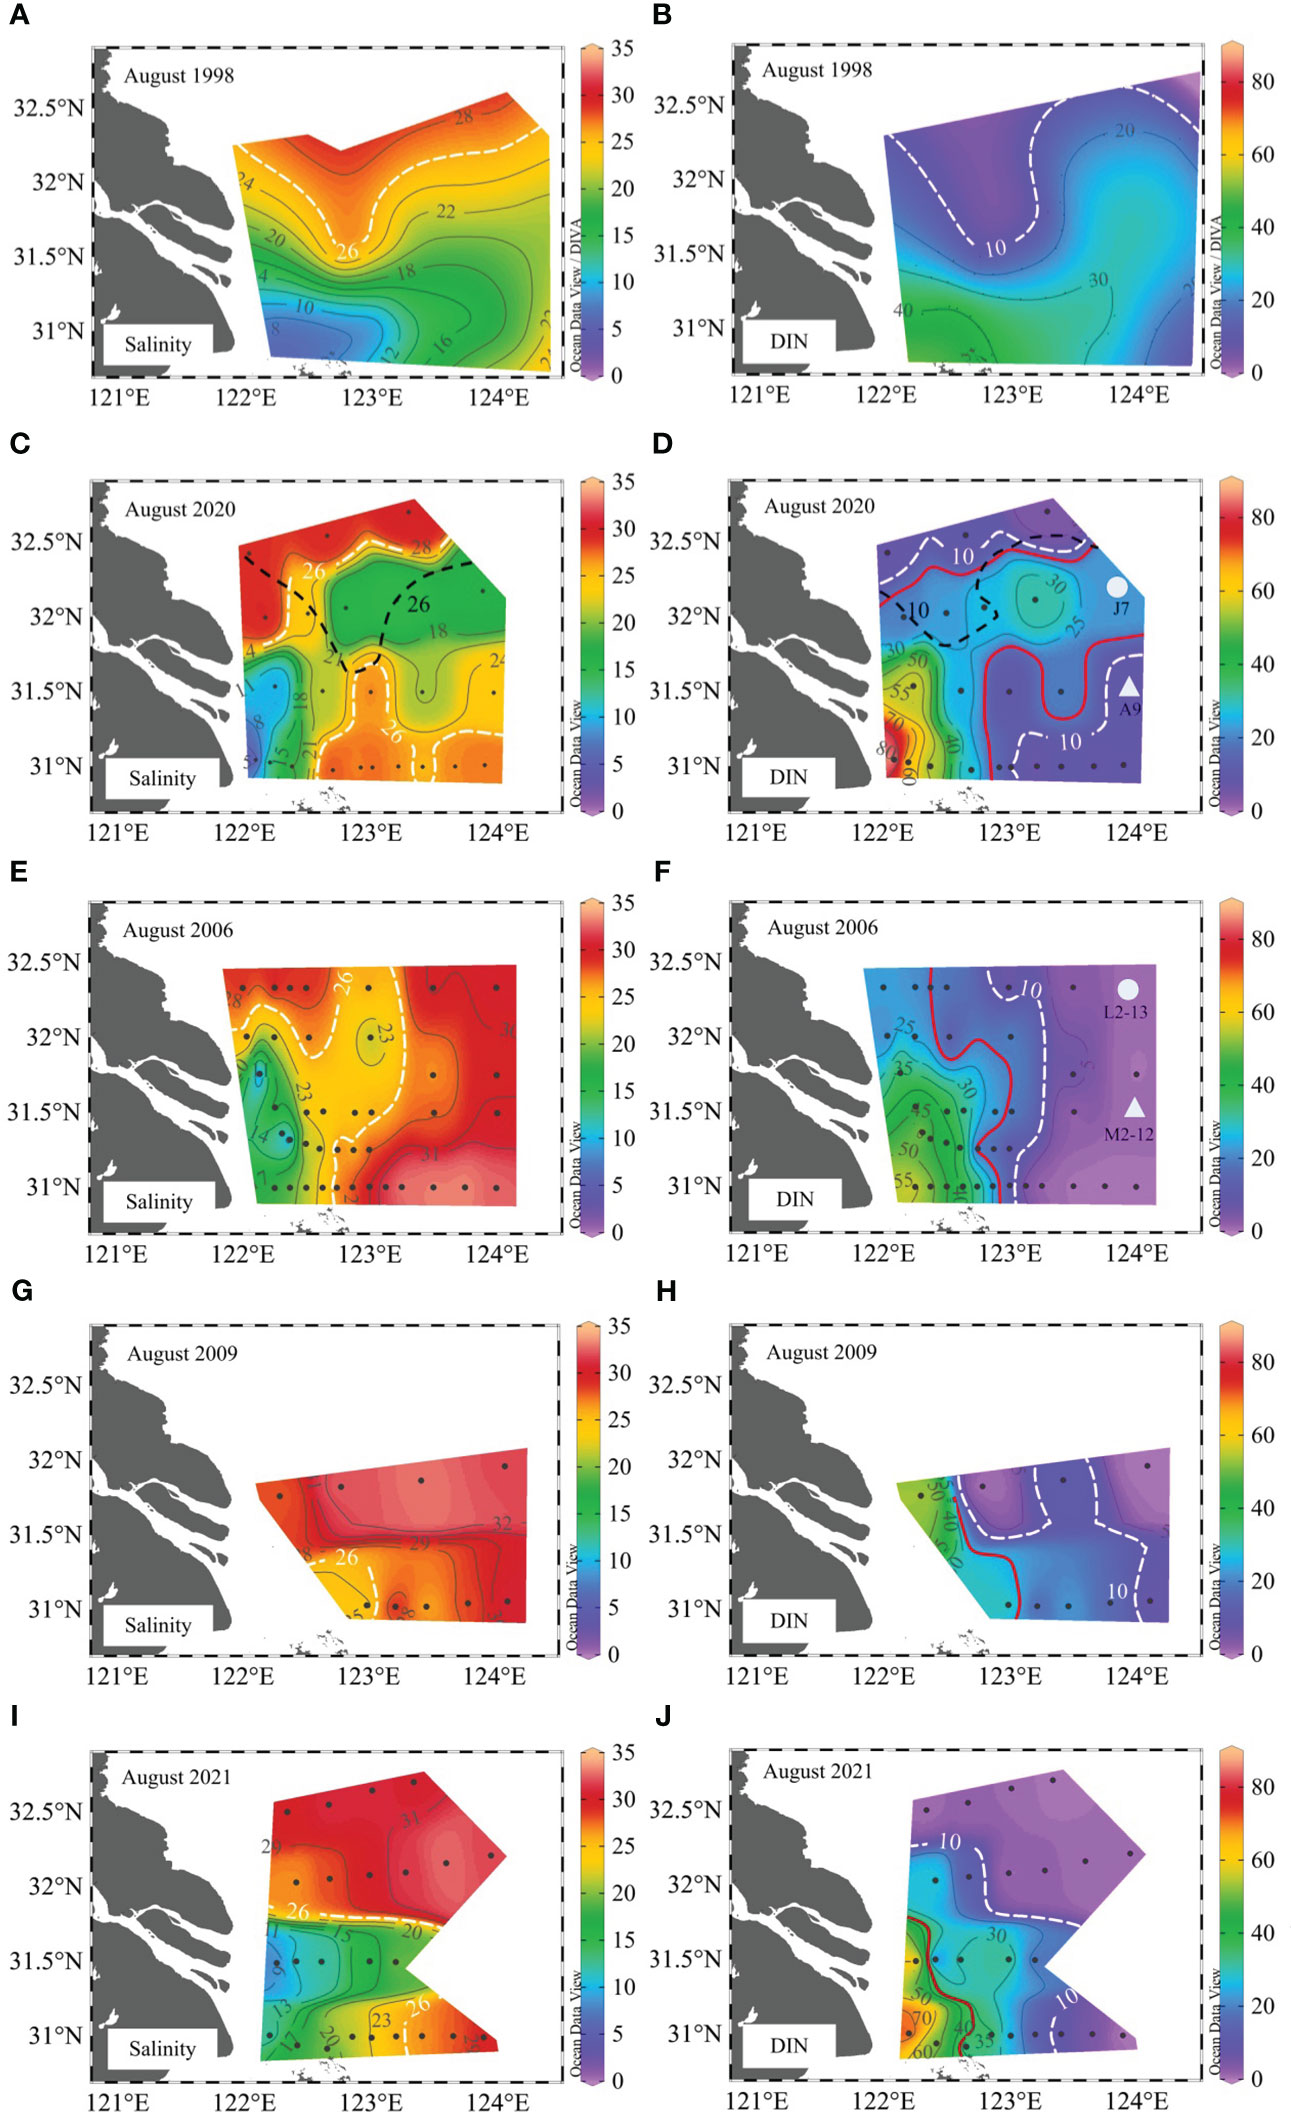
Figure 4 Surface distributions of (A) salinity and (B) DIN in August 1998 (modified from Wang et al., 2003), (C) salinity and (D) DIN in August 2020, (E) salinity and (F) DIN in August 2006, (G) salinity and (H) DIN in August 2009, (I) salinity and (J) DIN in August 2021. The red lines indicate the location of the DIN front, which is defined as where the maximum horizontal DIN gradient existed. The white dashed lines indicate the 26 isohaline (left panel) and the 10 μmol L−1 isoline of DIN (right panel), and the black dashed lines in (A) and (B) indicate the 26 isohaline and 10 μmol L−1 isoline of DIN in August 1998. The DIN concentration is plotted at the outer station of two main transects in (D) and (F). The DIN data in 2006 and 2009 were obtained from Wang (2014b) and Chen et al. (2011), respectively.
In addition, a low-salinity water patch (S ≤20) separated from the main body of the CDWcore. The area of the low-salinity water patch bound by the 20 isohaline in 2020 was ~102 km × 40 km, which was much larger than that in 2006 (33 km × 16 km) (Xuan et al., 2012). The monthly averaged discharge in August 2020 was ~2.4 times that in 2006, which suggested that increased runoff input under the flooding conditions resulted in a larger area of low-salinity water patch. Compared with the salinity of 1998, although the CDWcore covered a larger area in 1998 than in 2020, the 26 isohaline in 2020 moved farther north than that in 1998 (Figures 4C, A). In addition, the mean monthly discharge in August 1998 was 77332 m3 s−1, which exceeded the water flux in 2020 (Changjiang Water Resources Commission, 2022). Previous studies showed that the northeastward extension of the CDW is resulted by south wind and northward intrusion of the Taiwan Warm Current (Chang and Isobe, 2003). While, the complex and dynamic nature of the Changjiang estuary made it hard to clarify the reason for different extension behaviors of the Changjiang Dillluted Water in 1998 and 2020. Unlike the characteristics of CDW extension in 1998, low-salinity water detachment occurred in 2020, and the CDW extended northeasterly in the form of a low-salinity water patch. The detachment of plume waters had been frequently observed in the CDW (Lie et al., 2003; Chen et al., 2008; Wei et al., 2021b), which was attributed to the influence of wind and current (Xuan et al., 2012). Detachment could be more favorable for offshore spreading compared with spreading of the main body of CDW (Xuan et al., 2021), which can explain the more northerly 26 isohaline in 2020 than in 1998.
However, the concentration of NO3− at Changjiang Datong Hydrological Gauge Station in August 2020 (91.89 μmol L−1) was similar to the multi-year mean value (99.50 μmol L−1) in non-flooding years (August 2013, 2017, 2018, 2019 and 2021). The flux of NO3− (4.8 × 10⁸ mol d−1) in August 2020 calculated by Equation 1 was 1.4 times higher than the mean value in non-flooding years (3.3 × 10⁸ mol d−1). The fluxes of PO43− and Si(OH)4 also increased, which were 1.6 and 1.4 times higher than the mean value in non-flooding years, respectively. It suggested that flooding increased the nutrient fluxes into the Changjiang Estuary.
Typically, nutrient levels decrease along the salinity gradient of the CDW and undergo rapid depletion after passing through the turbidity maximum zone (Zhang et al., 2007b; Chen et al., 2010). Nutrients of surface waters around 122.5°E decreased rapidly, DIN was ~10 μmol L−1 in the vicinity of 123°E, 31–32°N in Figure 4F, in the vicinity of 123.5–124°E, 31–32°N in Figures 4H, J, and other non-flooding years (Liu et al., 2016; Xu et al., 2019). However, in this study, we found the waters near 124°E, 32°N could still maintain high levels of DIN and Si(OH)4 (22.92 μmol L−1 and 23.80 μmol L−1 at station J7, respectively), which converged at the low-salinity water patch in August 2020 (Figure 3). A high DIN concentration of 30.67 μmol L−1 was observed outside the 123°E, 32°N region in flooding years (Figure 4D), whereas it was 15–20 μmol L−1 around 123°E, 31–32°N in non-flooding years (Figures 4H, J), which suggested that flooding changed the distribution of DIN and Si(OH)4 in the Changjiang Estuary. Such high levels of nutrients offshore transport was rarely reported (Wei et al., 2021b). As the CDW plume spread, the 10 μmol L−1 isoline of DIN in 2020 (white dashed line in Figure 4D) extended farther to the outer estuary compared to that in 2006, 2009 and 2021 (white dashed line in Figures 4F, H, J). The DIN concentration in 2020 was about 25.0–30.0 μmol L−1, located at the 10.0 μmol L−1 isoline of DIN in 2006. The distribution of Si(OH)4 was consistent with that of DIN (Figure 3C). In the flooding year of 1998, extremely high nutrient levels in the estuary and shelf waters were also observed Figure 4B which were similar to those in our study (Wang et al., 2003). It suggested that the high DIN and Si(OH)4 offshore transport under flooding conditions could not be a coincidence.
A DIN front existed at the perimeter of the ~17 μmol L−1 isoline and extended to 124°E, 31.5–32°N in 2020 (red line in Figure 4D), whereas that in drought year 2006 existed around 123°E, 31.5–32°N, which coincided with the front of Si(OH)4. Ocean front is typically a region characterized by an anomalous maximum in the horizontal gradient of some water property (e.g., temperature, salinity, nitrate) (Largier, 1993). In this study, DIN front is the location with the largest horizontal DIN gradient. A DIN front was also observed in Chen (2009) in the vicinity of the ~4 μmol L−1 isoline, which existed at the ~8 μmol L−1 isoline of DIN (123–124°E, 31.5–32°N) (Ye et al., 2020). In addition, a turbidity front was located west of 123°E, 31–32°N in 2020 (Figure 3E), which suggested the DIN front under the flooding conditions moved offshore beyond the turbidity maximum zone and extended farther than that in non-flooding years. Apart from flooding, such offshore extension of the nutrient fronts could also be partly attributed to low-salinity water detachment, as inferred from salinity distributions (Figures 4C, D).
To further verify the impact of low-salinity water detachment during flooding on the offshore transport of nutrients, we compared the DIN concentration of detached low-salinity water in 2020 with those of nearby station in 2006 (transects J and A). We found that the surface DIN concentrations at the detached low-salinity water patch and offshore stations affected by CDW extension (stations J7 and A9) were 22.92 μmol L−1 and 9.00 μmol L−1 (~177 km and ~190 km away from the coast) in 2020, respectively. These values were approximately 16 times and 6 times those at nearby stations in 2006 (1.40 μmol L−1 at station L2-13 and 1.40 μmol L−1 at station M2-12), respectively. Furthermore, the 30 μmol L−1 isoline of DIN in 2020 was observed farther north relative to 1998, suggesting that detachment of low-salinity water patch possibly facilitated the northerly transport of nutrients (Wei et al., 2021b). Therefore, the high DIN and silicate offshore transports were the combined result of flooding and detachment, and it was hard to tell one influence from the other.
Unlike nitrate, PO43− was depleted in the low-salinity patch. Low PO43− concentrations were observed east of 123°E. The PO43− front was also located at 123°E (Figure 3B). The PO43− distributions were similar to previously reported results for flooding (Wang et al., 2003), non-flooding periods (Chen et al., 2011) and drought year (Wang et al., 2014a). The PO43− should also be transported farther northeast, as indicated by the low salinity and high DIN distribution east of 123°E. Two reasons may explain the low PO43− but high DIN we observed. Firstly, the Chl a concentration in the high-DIN/low-salinity patch was as high as 29.62 mg m−3. Strong biological uptakes of PO43− by phytoplankton probably reduce PO43− significantly (Tseng et al., 2014). As the riverine N/P ratio was as high as 60, excess DIN still existed. Secondly, PO43− in the turbid estuary could be removed by particle adsorption (Shen et al., 2008). Such PO43− adsorption capacity was strong at low salinity (<6), but it decreased with increasing salinity (Meng et al., 2015). The complicated mixing/adsorption behavior of PO43− makes it hard to evaluate the contribution of inorganic PO43− adsorption on PO43− transport. The high DIN low PO43− situation (N/P=307) also suggested limited PO43− levels in the Changjiang Estuary, even with the strong nutrient transport as a result of flooding, which will be discussed in detail in section 4.3
4.2 Water mass contribution to nutrients in low-salinity water patch
The distribution of nutrients is mainly controlled by water mixing and biological processes along horizontal and vertical gradients, especially in the euphotic zone of the CDW. In this study, a three end-member mixing model is used to determine the contributions of different water masses to nutrient levels, and to distinguish the changes in nutrient levels induced by biological processes from those induced by physical mixing processes. We identified three water masses from potential temperature-salinity figure (Supplemental Figure 1): The Changjiang Diluted Water, the colder Outer-shelf Deep Water (ODW), and the Outer-shelf Surface Water (OSW)—are the same as those used by Wang et al. (2014a) and Li et al. (2016).
The characteristics of the three water masses mentioned above are listed in Table 1. The CDW end-member (CDWend-member) data were obtained by averaging potential temperatures, salinity, and nutrients at the estuarine stations (122–122.5°E, 30.7–31.7°N). The OSW end-member (OSWend-member) data were obtained by averaging parameters for offshore stations (123–124°E, 31°N) influenced by Kuroshio Surface Water and TWC Surface Water. The ODW end-member (ODWend-member) data were obtained by averaging samples from either TWC bottom waters or Kuroshio Subsurface Water (123.5–124°E, 30–30.5°N) (Chen et al., 1995). The uncertainties of the nutrient deviation at stations (caused by uncertainties of parameters in the three end-members) were estimated using error propagation formulas (Taylor, 1997). In this study, the DIN deviation uncertainties [δ(ΔDIN)] varied from 1.14 to 2.66 μmol L−1 for stations in the euphotic zone. The Si(OH)4 deviation uncertainties [δ(ΔSi (OH)4)] varied from 1.34 to 3.71 μmol L−1 for stations in the euphotic zone. The solar heating will influence sea surface temperature, which produces bias in our model. The diurnal sea surface temperature in the East China Sea shelf in summer is in an order of 0.7–1.2°C (Tu et al., 2016), which is the upper limit of surface heating effect. In our model, even we assumed potential temperature uncertainties of 1.2°C (Supplemental Table 1), nutrient uptake uncertainties created was less than the relative standard deviation of nutrient uptake values (Supplemental Table 1). Therefore, the model result could be used to clarify the magnitude of nutrient uptake by phytoplankton.
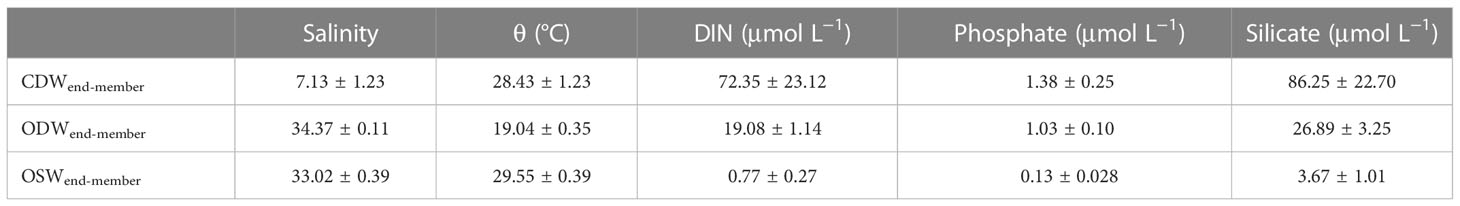
Table 1 Summary of the end-member values adopted in the three end-member mixing model.
The results of our model showed that the CDWend-member was the main water mass regulating nutrients at the low-salinity water patch (123.5°E–124°E, 31.6°N–32.3°N), with a mean fraction of 0.67 (Figure 5). The mean contributions of CDWend-member to DIN, PO43−, and Si(OH)4 were 48.23 μmol L−1, 0.92 μmol L−1, and 57.50 μmol L−1, respectively, at the low-salinity water patch. In contrast, the contributions of CDWend-member to DIN, PO43−, and Si(OH)4 in similar regions in the summer of 2006 (drought year) were only 22.60 μmol L−1, 0.41 μmol L−1, and 22.60 μmol L−1, respectively (Wang et al., 2014a). It suggested that CDWend-member under flooding conditions contributed over twice as many nutrients compared to that under non-flooding conditions. Outside the estuary, CDWend-member still played a dominant role in providing high nutrient levels. Even in the far east, the contributions of CDWend-member to DIN, PO43−, and Si(OH)4 in the surface waters were 47.03 μmol L−1, 0.90 μmol L−1, and 56.06 μmol L−1 at station J7, respectively. Furthermore, the fraction of ODWend-member was 0.82 in the water column from ~17 m to the bottom water (Figures 2B, 5B), which contributed 15.65 μmol L−1, 0.84 μmol L−1, and 22.05 μmol L−1 to DIN, PO43−, and Si(OH)4, respectively. The ODW brought benthic nutrients to refuel the water column at station J4, which could also consume oxygen and contribute to severe hypoxia in the ECS.
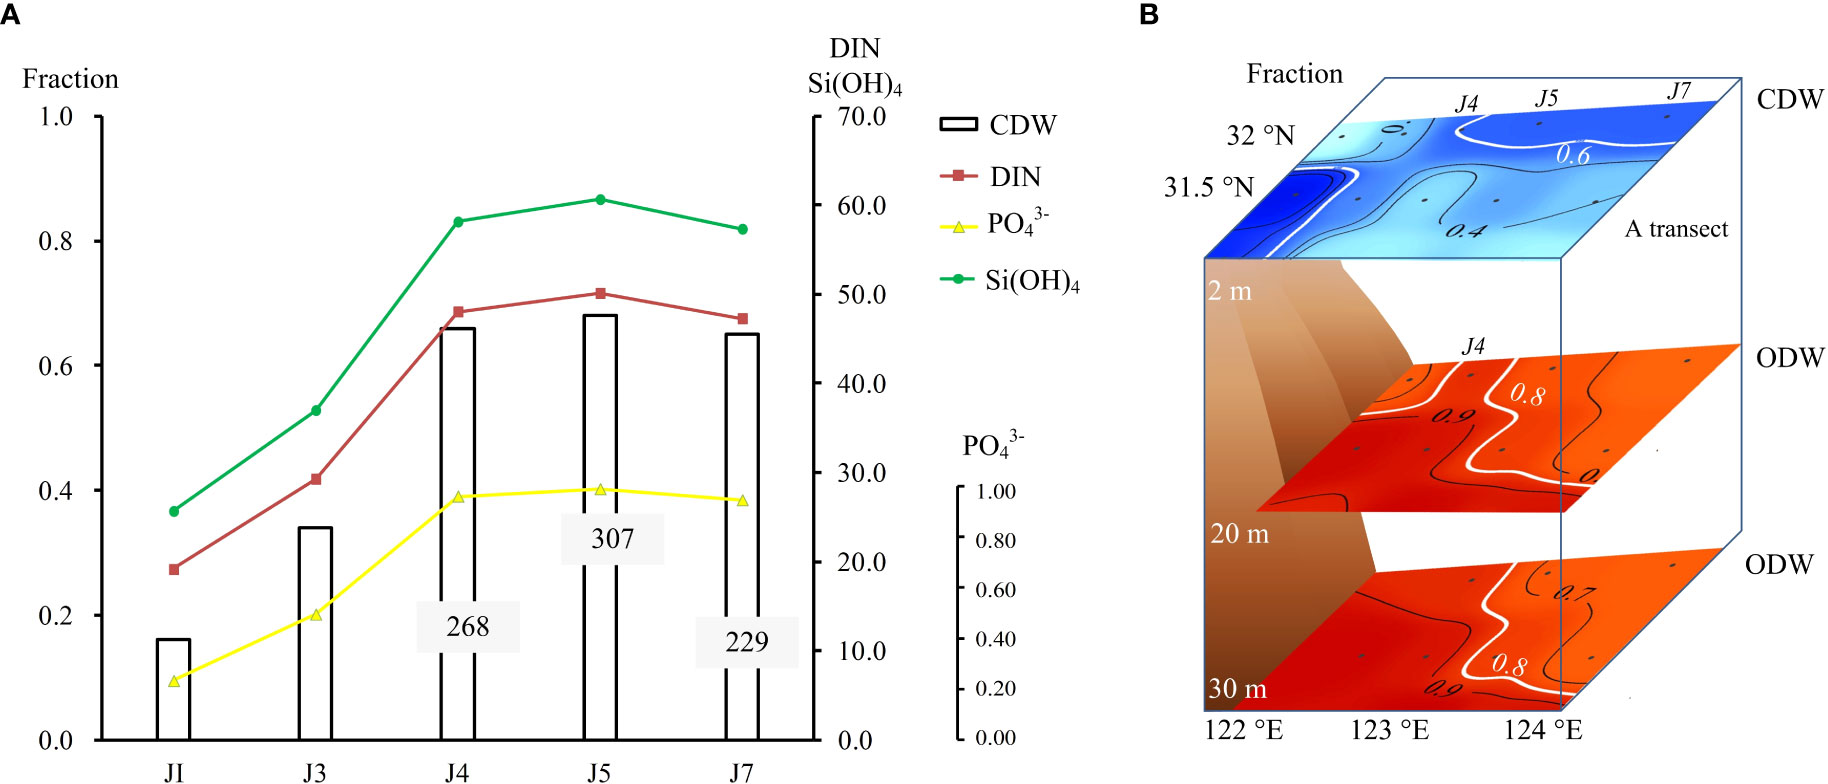
Figure 5 (A) The water mass contribution (fraction) of CDWend-member (blank column) and the concentrations of DIN (red line), PO43− (yellow line), and Si(OH)4 (green line) contributed by CDWend-member along transect J The gray rectangles indicate the N/P ratio of stations J4, J5, and J7 in the surface water. (B) The fraction distribution of CDWend-member in the surface water (blue palette) and ODWend-member in the bottom water (red palette).
4.3 Nutrients uptake and NCP assessment within the euphotic zone
In the dynamic Changjiang Estuary, even the single water end-members could have difference ages (Gao and Zong, 2021). And it is hard to distinguish them in our end-member model. Thus the nutrient uptake we calculated represents its accumulations during the residence times in the estuary. According to the end-member mixing model, the values of ΔDIN and ΔSi (OH)4 were negative at the surface water, which suggested phytoplankton uptake of nutrients. The high Chl a of surface waters at J5 (29.62 mg m−3) also validated a strong nutrient uptake. Our model also showed that the minimum ΔNUT values (maximum absolute value) were distributed at the low-salinity water patch, which demonstrated that the nutrient delivery in flooding years indeed triggered strong phytoplankton blooms (Figures 6, 7). The model-derived biological DIN uptake was as high as 24.65 μmol L−1 at the low-salinity water patch. We examined the NCP in the eutrophic zone based on Equation 7, using the model-derived biological DIN uptake. The inventory deviation of DIN (IΔDIN) was 2.0 × 10¹² mmol, which was calculated by using Zeu and ΔDIN concentration. The residence time (τDIN) was 5–10 d. When τDIN was 10 d, NCPΔDIN was 566 mg C m−2 d−1, as calculated by Equation 7, and when τDIN was 5 d, NCPΔDIN was 1131 mg C m−2 d−1. Our estimated biological carbon uptake (assessed by NCP) in the eutrophic zone was 566–1131 mg C m−2 d−1, whereas the NCP derived from DIN in 2006 was 465 mg C m−2 d−1 (Wang et al., 2014a), the NCP derived from Δ Si(OH)4 is similar to that calculated based on ΔDIN. In 2020, the NCPΔSi(OH)4 is 933–1867 mg C m−2 d−1, which was also higher than that in 2006 (626 mg C m−2 d−1), which suggested that the detachment of CDWend-member in flooding years probably increased the rate of biological carbon uptake.
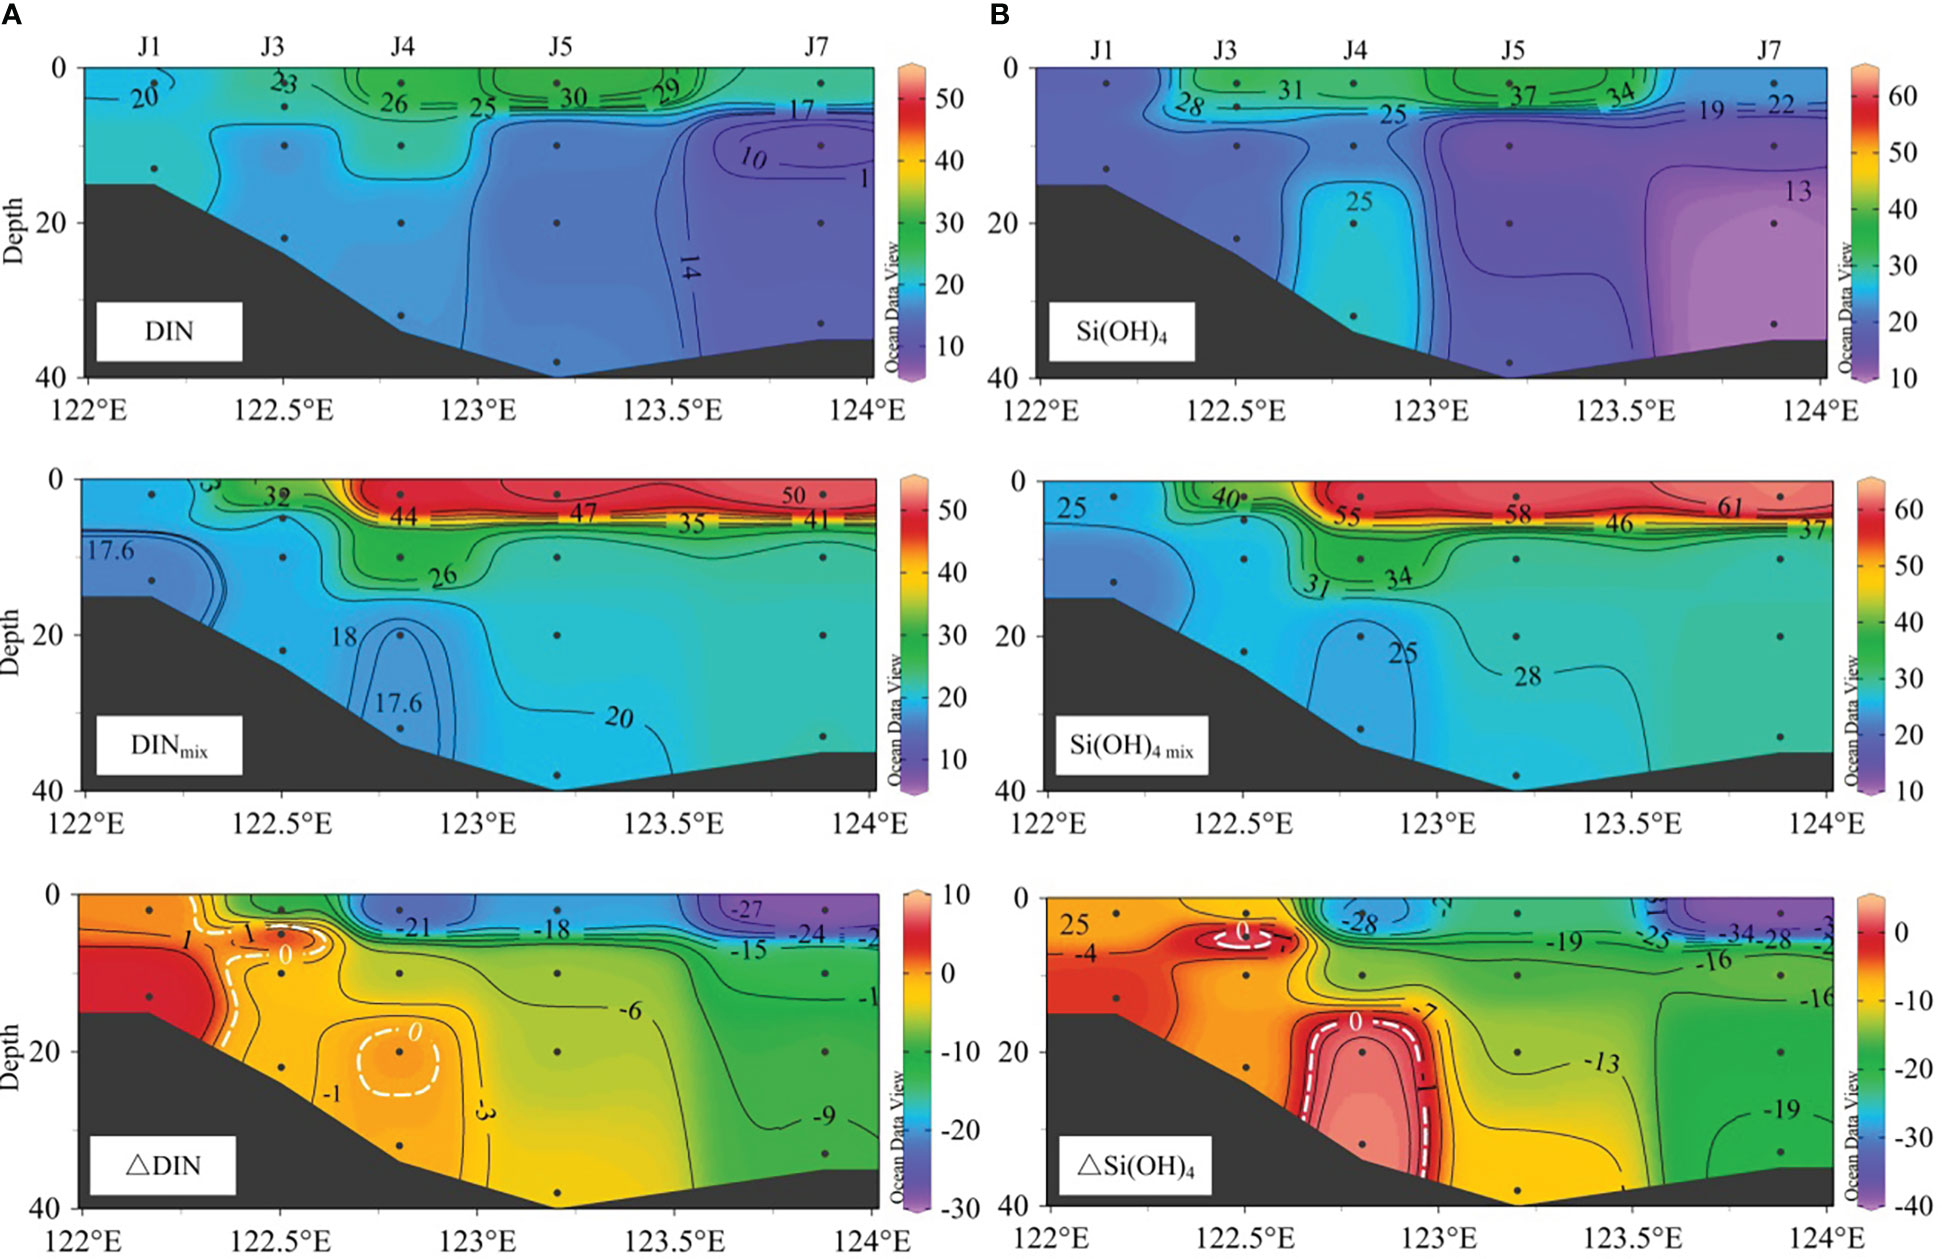
Figure 6 The distributions of measured NUT, calculated〖NUT〗_mix, and ΔNUT [(A) DIN, (B) Si(OH)4].
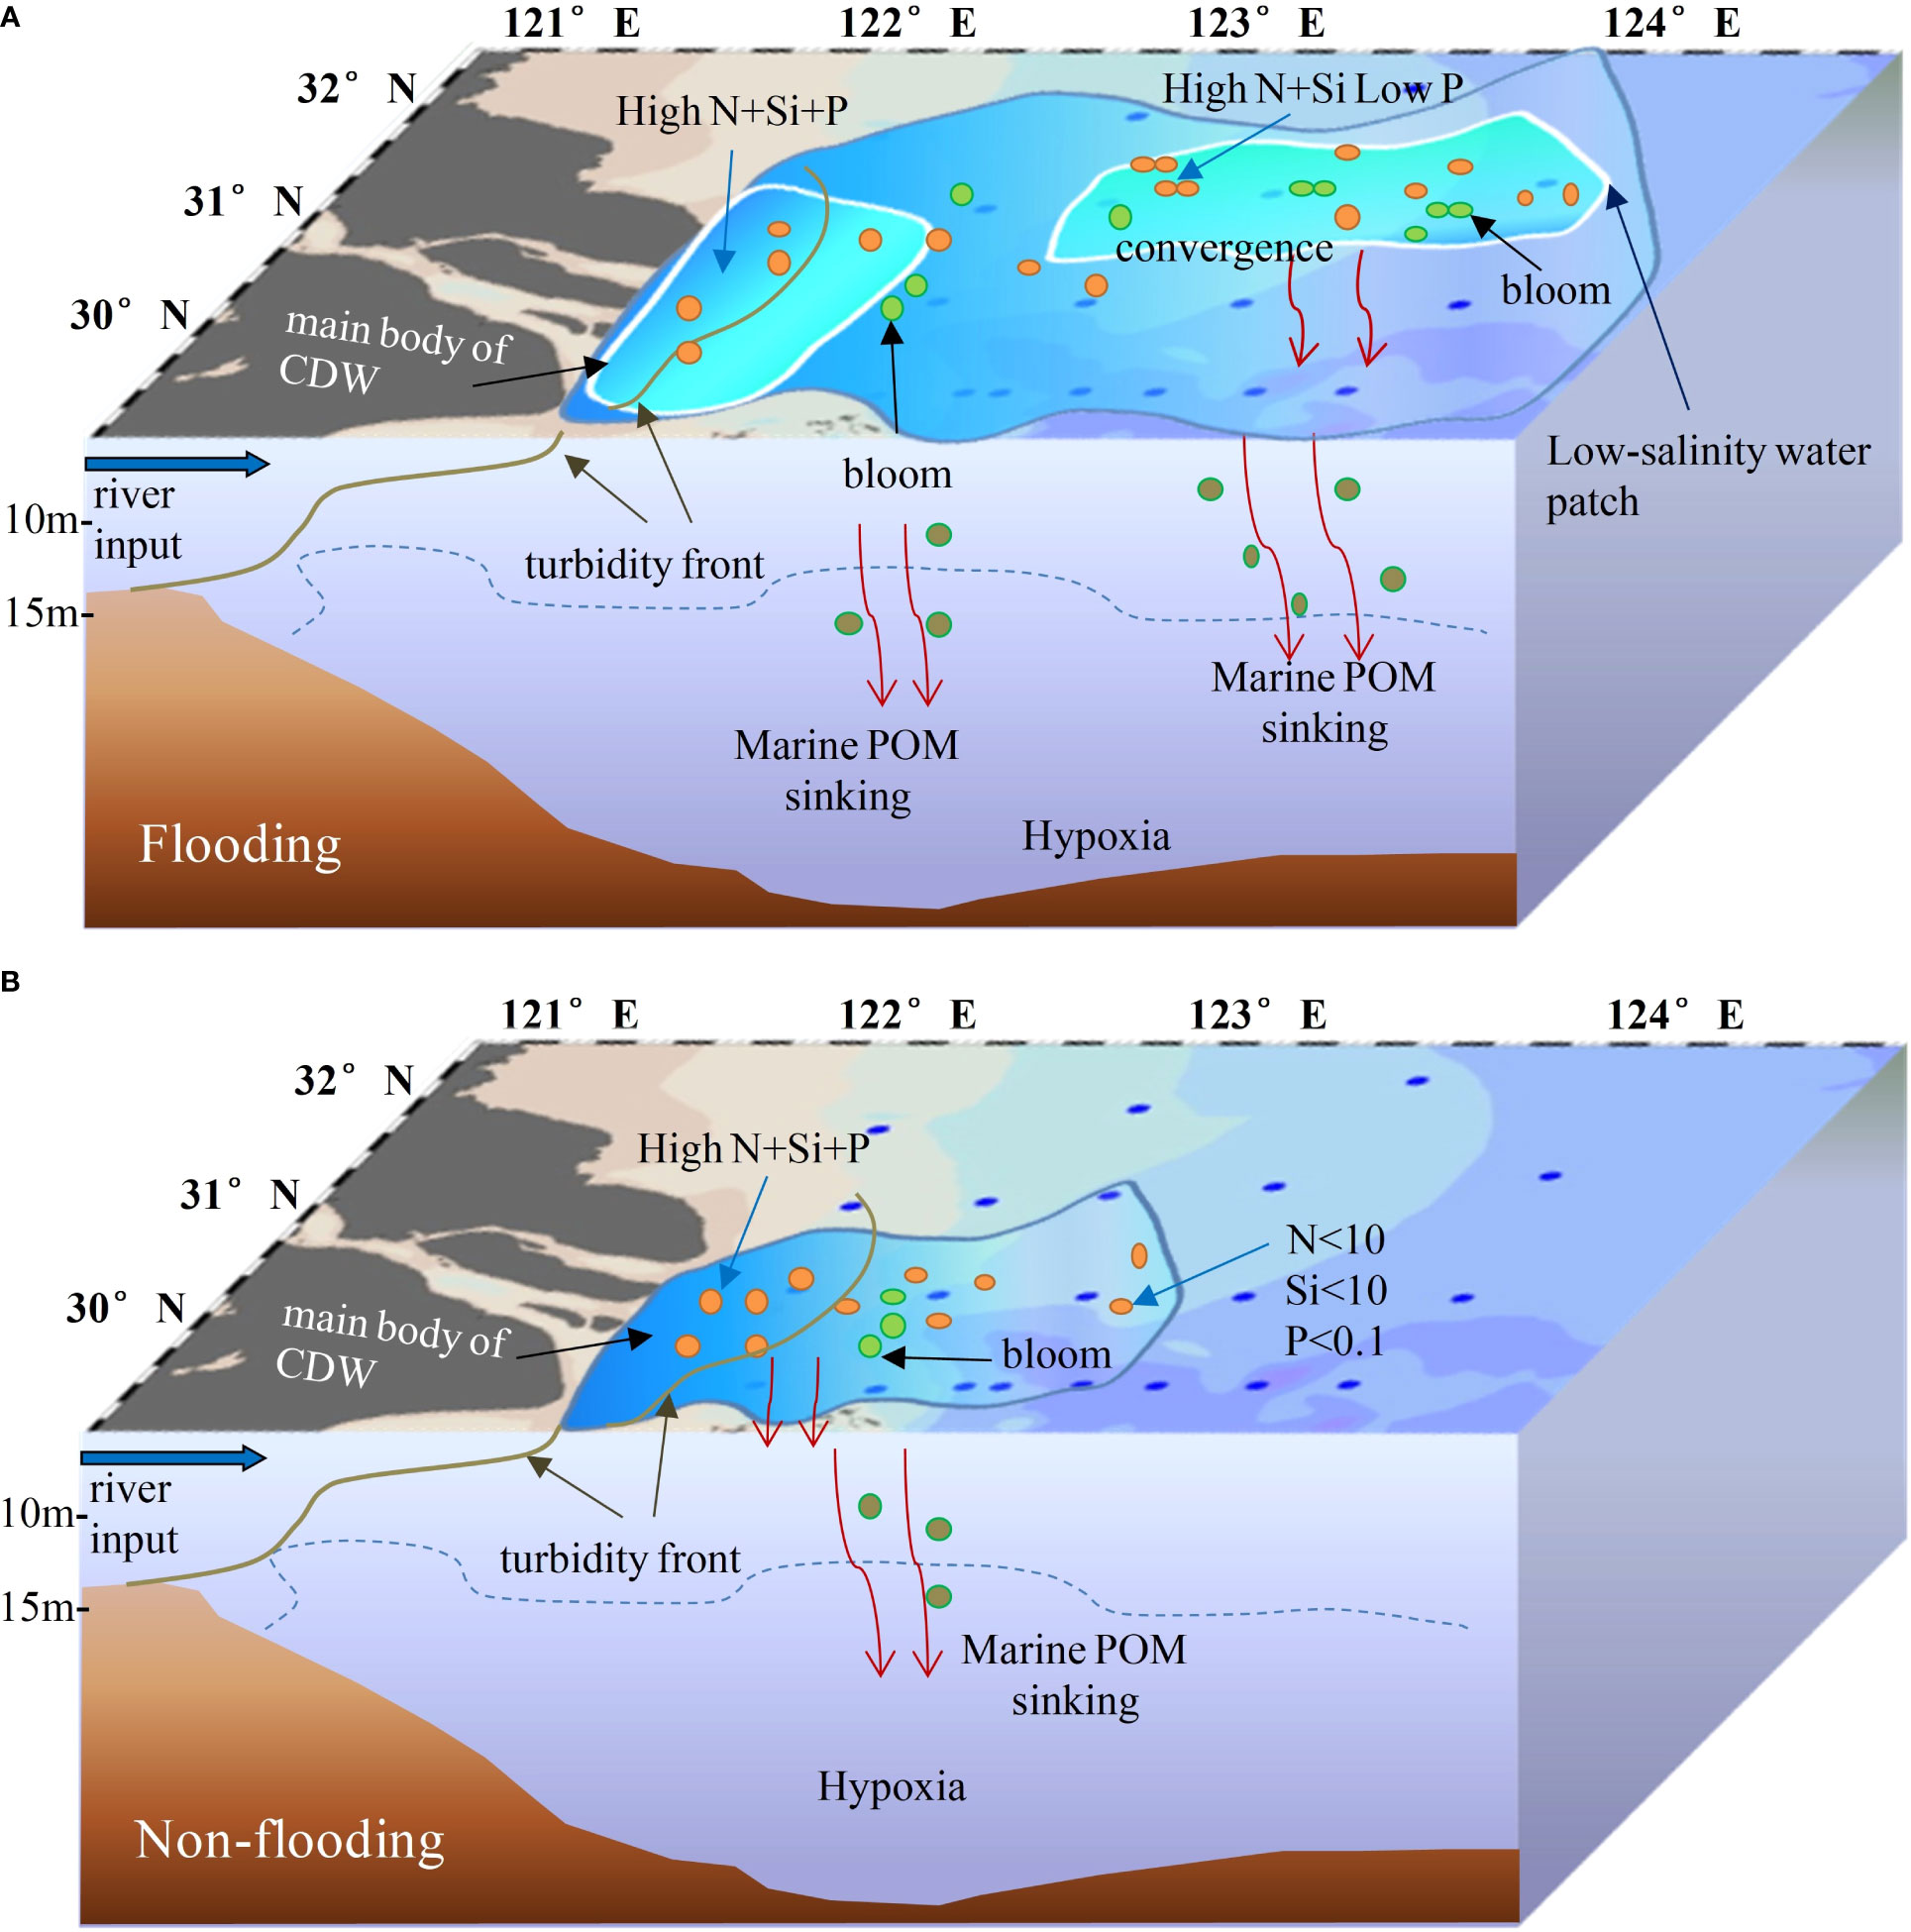
Figure 7 Sketch map of the characteristics of CDW extension and nutrient distributions in (A) a summer flooding period in 2020 and (B) a summer non-flooding period. In (A), the low-salinity water patch (light blue polygen) detached from the main body of the CDW (dark blue polygen). High DIN and Si(OH)4 converged at the low-salinity water patch beyond the turbidity zone, which triggered bloom offshore. PO43−was confined to the west of 123°E. In (B), the CDW extension area in the non-flooding period was significantly smaller than that in flooding year. Nutrients rapidly depleted after crossing the turbidity front. The phytoplankton blooms were largely confined to nearshore areas.
At stations J4, J5, and J7, high N/P ratios (268, 307, and 229, respectively) were observed. The relatively low PO43− concentration indicated PO43− limitations in the low-salinity patch (Figure 5A). In subsurface waters, water-sediment nutrient exchange is an important PO43− source in the Changjiang Estuary (Gong et al., 1996; Meng et al., 2015). If enough PO43− was provided with the physical mixing of subsurface water, such as in typhoon mixing (Wang et al., 2017b) or upwelling mixing (Wong et al., 1991), the low-salinity water patch could possibly have greater phytoplankton blooms. Previous research has also demonstrated that organic phosphorus and PO43− desorption from particles helps to alleviate the phosphorus limitation in the euphotic zone in the Changjiang Estuary (Froelich, 1988; Shen et al., 2008). In contrast, to the west of station J4, the nutrient depletion is minor. Zhang (2002) attributed the semi-conservative behavior of nutrients in the turbidity maximum zone to low primary production caused by limited light penetration. The turbidity front west of 123°E, 31–32°N in 2020 was most likely responsible for the positive ΔDIN value relative to the east of 123°E.
Significantly higher measured concentrations of DIN and silicate than those measured in ambient water of the same depth suggested nutrient addition in bottom waters. ΔDIN and ΔSi (OH)4 were positive in the water column from 17 m layer to the bottom water at station J4 (Figures 6A, B), which suggest excess DIN and Si(OH)4 addition sourced from other process. Frequent hypoxia events were observed in the inner ECS shelf (Wang et al., 2017b; Zhu et al., 2017), which indicate continuous decomposition of organic matter. The denitrification and anammox could cause DIN lost in sediment, according to previous studies in the East China Sea shelf (Song et al., 2013; Liu, 2021). However, the effect of denitrification and anammox on DIN in water column should be minor even it diffuses to waters below the sediment. Thus, the excess DIN in bottom waters could most likely be sourced from the decomposition of organic matter falling from the productive upper layer (Anderson and Sarmiento, 1994; Chen et al., 1996b; Chen et al., 2021).
Low salinity waters have been found in large parts of the ECS in flooding years (Wang et al., 2002). Additionally, the low-salinity water detachment could enhance the offshore transport of nutrients. It was proved that about 70% of the discharge of the CDW flowed into the east Japan Sea (Chang and Isobe, 2003). Although PO43− levels were low due to consumption by phytoplankton uptake at the low-salinity water patch, there were still high concentrations of DIN and Si(OH)4. The residual nutrients carried by CDW have the potential for supporting high Chl a and NCP levels offshore, which could play an important role in regulating biogeochemical cycles in the vicinity of Korea/the Tsushima Strait even in the east Japan Sea (Kim et al., 2013; Chang et al., 2014).
5 Conclusion
In August 2020, the NO3− flux from the Changjiang River into the Changjiang Estuary was 4.8 × 10⁸ μmol d−1, which was 1.4 times the mean value of multiple non-flooding years. Under the influence of flooding and low-salinity water detachment, high DIN and Si(OH)4 levels extended farther to the north when compared with non-flood years, whereas PO43− was confined to west of 123°E coincided with non-flooding years. The surface DIN in 2020 was ~16 and 6 times higher than those in the drought year of 2006 at stations J7 (124°E, 32°N) and A9 (124°E, 31.5°N). In contrast, PO43− was depleted in high-DIN waters, which indicated PO43− limits in the Changjiang Estuary even under the influence of flooding nutrient transport.
End-member mixing model results indicated that the CDWend-member contributes primarily (0.67) to DIN, PO43−, and Si(OH)4 in surface waters within the low-salinity water patch, the levels of these nutrients were over double those in non-flooding years. The considerable nutrient depletion revealed by the model and the high Chl a levels at the surface of the low-salinity water patch indicated strong phytoplankton uptake of nutrients. The estimated NCP derived from DIN of 566–1131 mg C m−2 d−1 within the euphotic zone was much higher than that in 2006 (465 mg C m−2 d−1).
Data availability statement
The raw data supporting the conclusions of this article will be made available by the authors, without undue reservation.
Author contributions
QS and DL designed the original ideas presented in this manuscript. QS worked on data analysis and wrote the original manuscript draft. DL and ZX participated in the manuscript improvement. JC, JZ, and HJ provided financial support for the cruise. BW, YM, FZ, ZJ and HL worked on cruise preparation and offered some suggestions for the manuscript. All authors contributed to the article and approved the submitted version.
Funding
This research was jointly supported by the Key R&D Program of Zhejiang (No. 2022C03044), Scientific Research Fund of the Second Institute of Oceanography, MNR (grant No. SZ2001, Long Term Observation and Research Plan in the Changjiang Estuary and the Adjacent East China Sea Project No. QNYJ2203), National Natural Science Foundation of China-Zhejiang Informatization and Industrialization Integration Project (No. U1709201), Natural Science Foundation of China (No. 42276046; 41806095; 41706120), National Programme on Global Change and Air-Sea Interaction (Phase II)—Hypoxia and Acidification Monitoring and Warning Project in the Changjiang Estuary, and National Key R&D Program of Chin (No. 2019YFD0901105), Science Foundation of Donghai Laboratory (Grant No. DH-2022KF0201, DH-2022KF0217, DH-2022KF0216). Data are available in contacting with corresponding author.
Acknowledgments
We thank the crews of the Runjiang I and the colleagues in the cruise for their support in sample collections. We also thank Liuyang Sheng (Ocean College, Zhejiang University) for providing lab analysis of Chl a data. We thank Professor Feng Zhou and Dr. Zhi Yang (the Second Institute of Oceanography, Ministry of Natural Resources) for providing CTD data and Auto Discrete Chemical Analyzer, respectively.
Conflict of interest
The authors declare that the research was conducted in the absence of any commercial or financial relationships that could be construed as a potential conflict of interest.
Publisher’s note
All claims expressed in this article are solely those of the authors and do not necessarily represent those of their affiliated organizations, or those of the publisher, the editors and the reviewers. Any product that may be evaluated in this article, or claim that may be made by its manufacturer, is not guaranteed or endorsed by the publisher.
Supplementary material
The Supplementary Material for this article can be found online at: https://www.frontiersin.org/articles/10.3389/fmars.2023.1076336/full#supplementary-material
References
Anderson L. A., Sarmiento J. L. (1994). Redfield ratios of remineralization determined by nutrient data analysis. global. biogeochem. Cycles 8, 65–80. doi: 10.1029/93GB03318
Bai Y., He X., Pan D., Chen C. T. A., Kang Y., Chen X. Y., et al. (2014). Summertime changjiang river plume variation during 1998–2010. J. Geophys. Res. Oceans. 119, 6238–6257. doi: 10.1002/2014JC009866
Beardsley R. C., Limeburner R., Yu H., Cannon G. A. (1985). Discharge of the changjiang (Yangtze river) into the East China sea. cont. Shelf. Res. 4, 57–76. doi: 10.1016/0278-4343(85)90022-6
Cao Z. M., Dai M. H., Zheng N., Wang D. L., Li Q., Zhai W. D., et al. (2011). Dynamics of the carbonate system in a large continental shelf system under the influence of both a river plume and coastal upwelling. J. Geophys. Res. 116, G02010. doi: 10.1029/2010JG001596
Chang P. H., Isobe A. (2003). A numerical study on the changjiang diluted water in the yellow and East China seas. J. Geophys. Res. 108, 3299. doi: 10.1029/2002JC001749
Chang P. H., Isobe A., Kang K. R., Ryoo S. B., Kang H. S., Kim Y. H. (2014). Summer behavior of the changjiang diluted water to the East/Japan Sea: A modeling study in 2003. Cont. Shelf. Res. 81, 7–18. doi: 10.1016/j.csr.2014.03.007
Changjiang Water Resources Commission (2022). Available at: http://www.cjw.gov.cn/zwzc/bmgb/ (Accessed 11, 2022).
Chen C. T. A. (1996a). The kuroshio intermediate water is the major source of nutrients on the East China Sea continental shelf. Oceanol. Acta 19, 523–527.
Chen C. T. A. (2009). Chemical and physical fronts in the bohai, yellow and East China seas. J. Mar. Syst. 78, 394–410. doi: 10.1016/j.jmarsys.2008.11.016
Chen F. J., Chen J. F., Zhang H. S., Li H. L., Gao S. Q., Jin H. Y., et al. (2011). The behavior of nitrate and phosphate in changjiang river estuary and its adjacent East China Sea during summer of 2009 (in Chinese). J. Mar. Sci. 29, 48–56.
Chen C. C., Gong G. C., Shiah F. K. (2007). Hypoxia in the East China Sea: One of the largest coastal low-oxygen areas in the world. Mar. Environ. Res. 64, 399–408. doi: 10.1016/j.marenvres.2007.01.007
Chen C. T. A., Gong G. C., Wang S. L., Bychkov A. S. (1996b). Redfield ratios and regeneration rates of particulate matter in the Sea of Japan as a model of closed system. Geophys. Res. Lett. 23,14, 1785–1788. doi: 10.1029/96GL01676
Chen H. Y., Huang S. Z. (2021). Composition and supply of inorganic and organic nitrogen species in dry and wet atmospheric deposition: Use of organic nitrogen composition to calculate the ocean’s external nitrogen flux from the atmosphere. Cont. Shelf. Res. 213, 104316. doi: 10.1016/j.csr.2020.104316
Chen C. T. A., Ruo R., Pai S. C., Liu C. T., Wong G. T. F. (1995). Exchange of water masses between the East China Sea and the kuroshio off northeastern Taiwan. Cont. Shelf. Res. 15, 19–39. doi: 10.1016/0278-4343(93)E0001-O
Chen C. C., Shiah F. K., Chiang K. P., Gong G. C., Kemp W. M. (2009). Effects of the changjiang (Yangtze) river discharge on planktonic community respiration in the East China Sea. J. Geophys. Res. Oceans 114, C03005. doi: 10.1029/2008JC004891
Chen C. C., Shiah F. K., Gong G. C., Chen T. Y. (2021). Impact of upwelling on phytoplankton blooms and hypoxia along the Chinese coast in the East China Sea. Mar. pollut. Bull. 167, 112288. doi: 10.1016/j.marpolbul.2021.112288
Chen C. S., Xue P. F., Ding P. X., Beardsley R. C., Xu Q. C., Miao X. M., et al. (2008). Physical mechanisms for the offshore detachment of changjiang diluted water in the East China Sea. J. Geophys. Res. Ocean 113, C02002. doi: 10.1029/2006JC003994
Chen H. T., Yu Z. G., Yao Q. Z., Mi T. Z., Liu P. X. (2010). Nutrient concentrations and fluxes in the changjiang estuary during summer. Acta Oceanol. Sin. 29, 107–119. doi: 10.1007/s13131-010-0029-8
Froelich P. N. (1988). Kinetic control of dissolved phosphate in natural rivers and estuaries. Limnol. Oceanogr. 33, 649–668. doi: 10.4319/lo.1988.33.4_part_2.0649
Gao L., Zong H. (2021). Using water age to study the biogeochemistry of nutrients in a large-river estuary and the adjacent shelf area. J. Mar. Res. 214, 103469.
Gong G. C., Chen Y. L. L., Liu K. K. (1996). Chemical hydrography and chlorophyll a distribution in the East China Sea in summer: implications in nutrient dynamics. Cont. Shelf. Res. 16 (12), 1561–1590. doi: 10.1016/0278-4343(96)00005-2
Gong G. C., Liu K. K., Chiang K. P., Hsiung T. M., Chang J., Chen C. C., et al. (2011). Yangtze River floods enhance coastal ocean phytoplankton biomass and potential fish production. Geophys. Res. Lett. 38, L13603. doi: 10.1029/2011GL047519
Gong G. C., Liu K. K., Pai S. C. (1995). Prediction of nitrate concentration from two end member mixing in the southern East China Sea. Cont. Shelf. Res. 15, 827–842. doi: 10.1016/0278-4343(94)00039-P
Grasshoff K., Kremling K., Manfred E. (1999). Methods of seawater analysis (NewYork: Wiley-VCH), 600.
Guo X. H., Zhai W. D., Dai M. H., Zhang C., Bai Y., Xu Y., et al. (2015). Air-sea CO2 fluxes in the East China Sea based on multiple-year underway observations. Biogeosciences 12, 5495–5514. doi: 10.5194/bg-12-5495-2015
Han A. Q., Dai M. H., Kao S. J., Gan J. P., Li Q., Wang L. F., et al. (2012). Nutrients dynamics and biological consumption in a large continental shelf system under the influence of both a river plume and coastal upwelling. Limnol. Oceanogr. 57, 486–502. doi: 10.4319/lo.2012.57.2.0486
Hirabayashi Y., Mahendran R., Koirala S., Konoshima L., Yamazaki D., Watanabe S., et al. (2013). Global flood risk under climate change. Nat. Clim. Change 3, 816–821. doi: 10.1038/NCLIMATE1911
Ichikawa H., Beardsley R. C. (2002). The current system in the yellow and East China seas. J. Oceanogr. 58, 77–92. doi: 10.1023/A:1015876701363
Kim S. K., Chang K. I., Kim B., Cho Y. K. (2013). Contribution of ocean current to the increase in n abundance in the northwestern pacific marginal seas. Geophys. Res. Lett. 40, 143–148. doi: 10.1029/2012GL054545
Largier J. L. (1993). Estuarine fronts-how important are they. Estuaries 16, 1–11. doi: 10.2307/1352760
Li D. W., Chen J. F., Wang K., Li H. L., Gao S. Q., Jin H. Y., et al. (2016). Contribution of outer-shelf deep water to the nutrient inventories in the euphotic zone of the changjiang river plume during summer. J. Coast. Res. 32, 1081–1091. doi: 10.2112/JCOASTRES-D-15-00056.1
Lie H. J., Cho C. H., Lee J. H., Lee S. (2003). Structure and eastward extension of the changjiang river plume in the East China Sea. J. Geophys. Res. Oceans. 108, 3077. doi: 10.1029/2001JC001194
Li W. Q., Ge J. Z., Ding P. X., Ma J. F., Glibert P. M., Liu D. Y. (2021). Effects of dual fronts on the spatial pattern of chlorophyll-a concentrations in and off the changjiang river estuary. Estuaries Coasts. 44, 1408–1418. doi: 10.1007/s12237-020-00893-z
Liu C. (2021). Coupling and uncoupling of nitrogen removal processes with nitrification and their influencing mechanism in the Yangtze estuary (Shanghai: East China Normal University).
Liu Z. Q., Gan J. P., Hu J. Y., Wu H., Cai Z. Y., Deng Y. F. (2021). Progress on circulation dynamics in the East China Sea and southern yellow Sea: Origination, pathways, and destinations of shelf currents. Prog. Oceanogr. 193, 102553. doi: 10.1016/j.pocean.2021.102553
Liu S. M., Hong G. H., Zhang J., Ye X. W., Jiang X. L. (2009). Nutrient budgets for large Chinese estuaries. Biogeosciences 6, 2245–2263. doi: 10.5194/bg-6-2245-2009
Liu S. M., Qi X. H., Li X. N., Ye H. R., Wu Y., Ren J. L., et al. (2016). Nutrient dynamics from the changjiang (Yangtze river) estuary to the East China Sea. J. Mar. Syst. 154, 15–27. doi: 10.1016/j.jmarsys.2015.05.010
Liu G. F., Wu H. L., Guo W. H., Zhu J. R., Sun L. C. (2011). Dispersal and fate of dredged materials disposed of in the changjiang estuary determined by use of an in situ rare earth element tracer. China. Ocean. Eng. 25, 495–506. doi: 10.1007/s13344-011-0040-7
Mao H. L., Kan T. C., Lan S. F. (1963). A preliminary study of the Yangtze diluted water and its mixing process (in Chinese). Oceanol. Limnol. Sin. 5, 183–206.
Meng J., Yu Z. G., Yao Q. Z., Bianchi T. S., Paytan A., Zhao B., et al. (2015). Distribution, mixing behavior, and transformation of dissolved inorganic phosphorus and suspended particulate phosphorus along a salinity gradient in the changjiang estuary. Mar. Chem. 168, 124–134. doi: 10.1016/j.marchem.2014.09.016
Moon J. H., Hirose N., Yoon J. H., Pang I. C. (2010). Offshore detachment process of the low-salinity water around changjiang bank in the East China Sea. J. Phys. Oceanogr. 40, 1035–1053. doi: 10.1175/2010JPO4167.1
Ning X., Chai F., Xue H., Cai Y., Liu C., Shi J. (2004). Physical-biological oceanographic coupling influencing phytoplankton and primary production in the south China Sea. J. Geophys. Res. 109, C10005. doi: 10.1029/2004JC002365
Ning X. R., Vaulot D., Liu Z. S., Liu Z. L. (1988). Standing stock and production of phytoplankton in the estuary of the changjiang river (Yangtze river) and adjacent East China Sea. Mar. Ecol. Prog. Ser. 49, 141–150. doi: 10.3354/meps049141
Pu Y. X. (1983). A preliminary study on expansion mechanism of the changjiang diluted water in summer. J. Mar. Sci. 1), 43–51.
Redfield A. C., Ketchum B. H., Richards F. A. (1963). The influence of organisms on the composition of seawater (New York: Academic Press).
Ren J., Li W., Gao Y. Z. (2020). Analyzing dynamic characteristics of river plume in the modaomen mouth, pearl river estuary. J. Oceanogr 76, 247–258. doi: 10.1007/s10872-020-00542-w
Saba G. K., Burd A. B., Dunne J. P., Hernandez-Leon S., Martin A. H., Rose K. A., et al. (2021). Toward a better understanding of fish-based contribution to ocean carbon flux. Limnol. Oceanogr. 66, 1639–1664. doi: 10.1002/lno.11709
Shen Z. L. (1997). Preliminary study on the changjiang river mainstream nutrients fluxes (in Chinese). Oceanol. Limnol. Sin. 5, 522–528.
Shen Z. L., Li Z., Miao H. (2012). An estimation on budget and control of phosphorus in the changjiang river catchment. Ennviron. Monit. Assess. 184, 6491–6505. doi: 10.1007/s10661-011-2435-6
Shen Z. L., Zhou S., Pei S. (2008). Transfer and transport of phosphorus and silica in the turbidity maximum zone of the changjiang estuary. Estuari. Coast. Shelf. Sci. 78, 481–492. doi: 10.1016/j.ecss.2008.01.010
Shi X. Y., Li H. M., Wang H. (2014). Nutrient structure of the Taiwan warm current and estimation of vertical nutrient fluxes in upwelling areas in the East China Sea in summer. J. Ocean Univ. China. 13, 613–620. doi: 10.1007/s11802-014-2481-0
Shi W., Wang M. H. (2009). Satellite observations of flood-driven Mississippi river plume in the spring of 2008. Geophys. Res. Lett. 36, L07607. doi: 10.1029/2009GL037210
Song G. D., Liu S. M., Marchant H., Kuypers M. M. M., Lavik G. (2013). Anammox, denitrification and dissimilatory nitrate reduction to ammonium in the East China Sea sediment. Biogeosciences 10, 6851–6864. doi: 10.5194/bg-10-6851-2013
Song J. M., Qu B. X., Li X. G., Yuan H. M., Li N., Duan L. Q. (2018). Carbon sinks/sources in the yellow and East China seas air-sea interface exchange, dissolution in seawater, and burial in sediments. Sci. China Earth Sci. 61, 1583–1593. doi: 10.1007/s11430-017-9213-6
Su J. L. (2001). A review of circulation dynamics of the coastal oceans near China (in Chinese). Haiyang Xuebao. 23, 1–16.
Tseng Y. F., Lin J., Dai M. H., Kao S. J. (2014). Joint effect of freshwater plume and coastal upwelling on phytoplankton growth off the changjiang river. Biogeosciences 11, 409–423. doi: 10.5194/bg-11-409-2014
Tu Q. G., Pan D. L., Hao Z. Z., Yan Y. W. (2016). SST Diurnal warming in the China seas and northwestern pacific ocean using MTSAT satellite observations. Acta Oceanol. Sin. 35, 12–18. doi: 10.1007/s13131-016-0968-9
Wang K. (2014b). Nutrients and primary production coupling in the changjiang estuary and its indication to the trophic status (Hangzhou: Zhejiang University).
Wang X., Baskaran M., Su K. J., Du J. Z. (2018). The important role of submarine groundwater discharge (SGD) to derive nutrient fluxes into river dominated ocean margins-the East China Sea. Mar. Chem. 204, 121–132. doi: 10.1016/j.marchem.2018.05.010
Wang K., Chen J. F., Jin H. Y., Chen F. J., Li H. L., Gao S. Q., et al. (2011). The four seasons nutrients distribution in changjiang river estuary and its adjacent East China Sea (in Chinese). J. Mar. Sci. 29, 18–35.
Wang K., Chen J. F., Jin H. Y., Li H. L., Gao S. Q., Xu J., et al. (2014a). Summer nutrient dynamics and biological carbon uptake rate in the changjiang river plume inferred using a three end-member mixing model. Cont. Shelf. Res. 91, 192–200. doi: 10.1016/j.csr.2014.09.013
Wang B., Chen J. F., Jin H. Y., Li H. L., Huang D. J., Cai W. J. (2017b). Diatom bloom-derived bottom water hypoxia off the changjiang estuary, with and without typhoon influence. Limnol. Oceanogr. 62, 1552–1569. doi: 10.1002/lno.10517
Wang B. D., Chen A. P., Liu F. (2002). Chemicohydrographic characteristics in the shelf area during the changjiang river catastrophic flood period in the summer of 1998 (in Chinese). Adv. Mar. Sci. 3, 44–51.
Wang K., Chen J. F., Ni X. B., Zeng D. Y., Li D. W., Jin H. Y., et al. (2017a). Real-time monitoring of nutrients in the changjiang estuary reveals short-term nutrient-algal bloom dynamics. J. Geophys. Res. Oceans. 122, 5390–5403. doi: 10.1002/2016JC012450
Wang B. D., Wang X. L. (2007). Chemical hydrography of coastal upwelling in the East China Sea. Chin. J. Oceanol. Limnol. 25, 16–26. doi: 10.1007/s00343-007-0016-x
Wang B. D., Wang X. L., Zhan R. (2003). Nutrient conditions in the yellow Sea and the East China Sea. Estuari. Coast. Shelf. Sci. 58, 127–136. doi: 10.1016/S0272-7714(03)00067-2
Wang Z., Yao L., Ruan X. (1983). Distribution and characteristics of nutrients (N, p, Si) in the estuary of changjiang river in June (in Chinese). Oceanol. Limnol. Sin. 14, 324–332.
Wei Q. S., Wang B. D., Zhang X. L., Ran X. B., Fu M. Z., Sun X., et al. (2021b). Contribution of the offshore detached changjiang (Yangtze river) diluted water to the formation of hypoxia in summer. Sci. Total. Environ. 764, 142838. doi: 10.1016/j.scitotenv.2020.142838
Wei Q. S., Yao P., Xu B. C., Zhao B., Ran X. B., Zhao Y. H., et al. (2021a). Coastal upwelling combined with the river plume regulates hypoxia in the changjiang estuary and adjacent inner East China Sea shelf. J. Geophys. Res. Oceans 126, e2021JC017740. doi: 10.1029/2021JC017740
Wong G. T. F., Pai S. C., Liu K. K., Liu C. T., Chen C. T. A. (1991). Variability of the chemical hydrography at the frontal region between the East China Sea and the kuroshio northeast of Taiwan. Estuari. Coast. Shelf. Sci. 33, 105–120. doi: 10.1016/0272-7714(91)90001-R
Xuan J. L., Ding R. B., Ni X. B., Huang D. J., Chen J. F., Zhou F. (2021). Wintertime submesoscale offshore events overcoming wind-driven onshore currents in the East China Sea. Geophys. Res. Lett. 48, e2021GL095139. doi: 10.1029/2021GL095139
Xuan J. L., Huang D. J., Zhou F., Zhu X. H., Fan X. P. (2012). The role of wind on the detachment of low salinity water in the changjiang estuary in summer. J. Geophys. Res. 117, C10004. doi: 10.1029/2012JC008121
Xu Q., Sukigara C., Goes J. I., Gomes H. D., Zhu Y. L., Wang S. Q., et al. (2019). Interannual changes in summer phytoplankton community composition in relation to water mass variability in the East China Sea. J. Oceanogr. 75, 61–79. doi: 10.1007/s10872-018-0484-y
Ye L. A., Zhang H. B., Fei Y. J., Liu L., Li D. L. (2020). Nutrient distributions in the East China Sea and changes over the last 25 years. Appl. Ecol. Environ. Res. 18, 973–985. doi: 10.15666/aeer/1801_973985
Zhai W. D., Dai M. H., Chen B. S., Guo X. H., Li Q., Shang S. L., et al. (2013). Seasonal variations of sea-air CO2 fluxes in the largest tropical marginal sea (South China Sea) based on multiple-year underway measurements. Biogeosciences 10, 7775–7791. doi: 10.5194/bg-10-7775-2013
Zhang J. (2002). Biogeochemistry of Chinese estuarine and coastal waters: nutrients, trace metals and biomarkers. Reg. Envir. Change 3, 65–76. doi: 10.1007/s10113-001-0039-3
Zhang Y. R., Ding Y. P., Li T. J., Xue B., Guo Y. M. (2016). Annual variations of chlorophyll a and primary productivity in the East China Sea (in Chinese). Oceanol. Limnol. Sin. 47, 261–268.
Zhang J., Guo X. Y., Zhao L. (2019). Tracing external sources of nutrients in the East China Sea and evaluating their contributions to primary production. Prog. Oceanogr. 176, 102122. doi: 10.1016/j.pocean.2019.102122
Zhang J., Liu S. M., Ren J. L., Wu Y., Zhang G. L. (2007b). Nutrient gradients from the eutrophic changjiang (Yangtze river) estuary to the oligotrophic kuroshio waters and reevaluation of budgets for the East China Sea shelf. Prog. Oceanogr. 74, 449–478. doi: 10.1016/j.pocean.2007.04.019
Zhang B., Tang Q. S. (2022). Carbon sink assessment for capture stock in China coastal ocean (in Chinese). Prog. Fish. Sci. 43, 126–131.
Zhang G. S., Zhang J., Liu S. M. (2007a). Characterization of nutrients in the atmospheric wet and dry deposition observed at the two monitoring sites over yellow Sea and East China Sea. J. Atmos. Chem. 57, 41–57. doi: 10.1007/s10874-007-9060-3
Zhang Z. R., Zhou M., Zhong Y. S., Zhang G. S., Jiang S., Gao Y. H., et al. (2020). Spatial variations of phytoplankton biomass controlled by river plume dynamics over the lower changjiang estuary and adjacent shelf based on high-resolution observations. Front. Mar. Sci. 7, 587539. doi: 10.3389/fmars.2020.587539
Zhou M. J., Shen Z. L., Yu R. C. (2008). Responses of a coastal phytoplankton community to increased nutrient input from the changjiang (Yangtze) river. Cont. Shelf. Res. 28, 1483–1489. doi: 10.1016/j.csr.2007.02.009
Zhou F., Xuan J. L., Ni X. B., Huang D. J. (2009). A preliminary study on variations of the changjiang diluted water between august 1999 and 2006 (in Chinese). Haiyang Xuebao. 31, 1–12.
Zhou F., Xue H. J., Huang D. J., Xuan J. L., Ni X. B., Xiu P., et al. (2015). Cross shelf exchange in the shelf of the East China Sea. J. Geophys. Res. Oceans. 120, 1545–1572. doi: 10.1002/2014JC010567
Zhu Z. Y., Wu H., Liu S. M., Wu Y., Huang D. J., Zhang G. S. (2017). Hypoxia off the changjiang (Yangtze river) estuary and in the adjacent East China Sea: Quantitative approaches to estimating the tidal impact and nutrient regeneration. Mar. pollut. Bull. 125, 103–114. doi: 10.1016/j.marpolbul.2017.07.029
Keywords: nutrients offshore transport, flooding, Changjiang Diluted Water detachment, phosphate limitation, net community production
Citation: Sun Q, Li D, Wang B, Xu Z, Miao Y, Lin H, Jin H, Jiang Z, Zeng J, Zhou F and Chen J (2023) Massive nutrients offshore transport off the Changjiang Estuary in flooding summer of 2020. Front. Mar. Sci. 10:1076336. doi: 10.3389/fmars.2023.1076336
Received: 21 October 2022; Accepted: 11 January 2023;
Published: 27 January 2023.
Edited by:
Chin-Chang Hung, National Sun Yat-sen University, TaiwanCopyright © 2023 Sun, Li, Wang, Xu, Miao, Lin, Jin, Jiang, Zeng, Zhou and Chen. This is an open-access article distributed under the terms of the Creative Commons Attribution License (CC BY). The use, distribution or reproduction in other forums is permitted, provided the original author(s) and the copyright owner(s) are credited and that the original publication in this journal is cited, in accordance with accepted academic practice. No use, distribution or reproduction is permitted which does not comply with these terms.
*Correspondence: Dewang Li, dwli@sio.org.cn; Jianfang Chen, jfchen@sio.org.cn