Characterization and classification of estuarine suspended particles based on their inorganic/organic matter composition
 Z. Safar1*
  C. Chassagne1*
  S. Rijnsburger1 M. Ibanez Sanz2
  A. J. Manning1,3,4,5 A.J. Souza6
  T. van Kessel7 A. Horner-Devine8
  R. Flores9 M. McKeon10 J.D. Pietrzak1
- 1Section of Environmental Fluid Mechanics, Department of Hydraulic Engineering, Delft university of technology, Delft, Netherlands
- 2Antea group, Antwerpen, Belgium
- 3HR Wallingford Ltd, Coasts & Oceans Group, Wallingford, United Kingdom
- 4Energy and Environment Institute, University of Hull, Hull, United Kingdom
- 5Universiy of Plymouth, Plymouth, United Kingdom
- 6CINVESTAV, Merida, Yucatan, Mexico
- 7Deltares, Delft, Netherlands
- 8Department of Civil Engineering, University of Washington, Seattle, WA, United States
- 9Departamento de Obras Civiles, Universidad Tecnica Federico Santa Maria, Valparaiso, Chile
- 10Pacific Northwest National Laboratory, Portland, OR, United States
An 11 hours survey was performed on the 17th of September 2014 in the Rhine Region Of Freshwater Influence (Rhine-ROFI) about 10 km downstream of the mouth of the Rotterdam Waterway during calm weather conditions. Suspended Particle Matter (SPM) measurements were performed during a full tidal cycle, near the seabed, at neap tide, and samples were taken at 0.6 meter above bed for on-board analysis. The measurements were performed with (a) LISST 100X, a submersible particle size analyzer, (b) LISST-HOLO, a submersible digital holographic camera, (c) a home-made underwater camera and (d) an on-board LabSFLOC2 video microscopy equipment that used in-situ collected samples. The first aim of the present study was to compare the results obtained from the different monitoring techniques and to characterize the different types of suspended particles found in-situ. It was found that that the highly anisotropic particles present in the water column lead to multiple peaks in the Particle Size Distributions (PSD) found using the LISST 100X. Using the LISST-HOLO, underwater camera and LabSFLOC2 camera these particles could properly be imaged and meaningful PSD’s were obtained using these techniques in the size range > 20 μm. LabSFLOC2, LISST-HOLO and the underwater camera moreover provide information on the size and aspect ratio of particles. On the other hand, LISST 100X can be used to detect the fine fraction (<20 μm), a size range that is not accessible for the other techniques. From the analysis of the data on the survey day, three classes of particles were identified, based on composition rather than size (the sizes given here are purely indicative): (1) mineral (inorganic) sediment particles in the range size 5 - 20 μm, (2) organic/inorganic aggregates in the size range 20 - 200 μm and (3) organic particles in the size range > 200 μm. A large range of settling velocities (0.1 - 10 mm/s) and aspect ratios between 1 and 10 were recorded by video microscopy (LabSFLOC2). This spreading in settling velocities and aspect ratio was due to the different properties (shape, effective density and size) of the particles in the water column. The second aim of the study was to reproduce the flocs found in-situ in the lab and investigate the kinetics of flocculation between inorganic and living organic matter. Laboratory experiments were conducted with grab samples obtained from Port of Rotterdam harbour and living microalgae (Skeletonema costatum). The results of these experiments showed a shift in effective density upon addition of living algae to the sediment, which confirmed the flocculation ability between sediment and microalgae. The flocculation occured on a timescale of minutes and lead to flocs having a large spread in density for a given size, due to the heteregeous inorganic/organic composition of the flocs. This spread in density was at the origin of the large range of settling velocities for a given floc size observed in-situ, which leads to conclude that organic matter should be an important input parameter in sediment transport models.
1 Introduction
Floc properties (size, shape, density) depend on parameters such as salinity (Lee et al., 2016), pH (Mietta et al., 2009), polymeric substances (Shakeel et al., 2020) and hydrodynamic shear (Verney et al., 2011). The conditions in which flocs were formed and the shear stress they experienced when they were created determine the flocs’ structure (Shakeel et al., 2020). Sediment transport models that account for flocculation need to incorporate the key parameters that will lead to predictive models. These parameters should be measurable, so that the models can be validated. A new flocculation model was presented in (Chassagne and Safar, 2020) that is based on parameters measurable in-situ, in particular by laser diffraction (LISST 100X). The remaining parameters (linked to flocculation kinetics) can be found by laboratory experiments. Settling velocity of flocs, which is an input parameter in sediment transport models, is often obtained by estimating the density of flocs based on in-situ measurements. The mean density of flocs is usually obtained by assuming that all flocs (represented by a mean size i.e. a D50) have the same density (Fettweis, 2008; Many et al., 2016). Even though this assumption may be valid for some (large) aquatic regions, it is questionable whether this can apply to estuarine areas. In Regions Of Freshwater Influence (ROFI) in particular, it is generally observed that at the top of the water column, the Suspended Particulate Matter (SPM) concentration, in terms of inorganic sediment, is much lower than in the ambient coastal water during stratified water column conditions (Pietrzak et al., 2011). However, biological algal species and organic particles can be advected by the freshwater plume (De Ruyter van Steveninck et al., 1992; Schofield et al., 2013; Cross et al., 2015; Deng et al., 2019). Coastal waters are nutrient-rich and their shallowness provides good light penetration. They are suitable environments for micro-organisms such as diatoms, bacteria, dinoflagellates, phytoplankton and zoo-plankton (Van de Meent, 1982; De Ruyter van Steveninck et al., 1992; van Leussen, 1999; Lartiges et al., 2001; Roozen, 2005; van der Hout et al., 2012). A wide variety of diatoms, dinoflagellates and flagellates are for instance found in the Dutch coastal area of the North Sea. Most abundant are Skeletonema costatum, Rhizosolenia delicatula, Chaetoceros and Paralia (Rijstenbil, 1987; Prins et al., 2012; Blauw, 2015). These micro-organisms are important in the formation of estuarine aggregates. Aggregates (flocs) are formed in the water column, when organic matter, from the top of the water column, and inorganic matter, found in deeper water layers, meet (Deng et al., 2019). Both living and dead organic matter contribute to this process. By colonizing and growing on the nutrient-rich sediment particles microorganisms form aggregates of different size, shape, density and settling velocity (Logan et al., 1995; Razaz et al., 2015; Lee et al., 2017; Schwarz et al., 2017). Studies have shown that the algal mucous secretion and cell protuberance lead to entanglement and aggregate formation of algae during sinking, and that these ‘sticky’ aggregates scavenge minerals and other particles during settling, which further increases the settling velocity (Pavoni et al., 1972; Alldredge and Gotschalk, 1989; Passow et al., 1994; Dam and Drapeau, 1995). Even small-celled diatoms such as Skeletonema costatum, the microalgae that we used in laboratory studies, attain high settling velocities due to their formation in chains and their ability to aggregate (Malone, 1980; Smetacek, 1985; Manning et al., 2017). The dead cells of the algae can also accumulate as particulate organic matter. This organic matter will be a source of sticky material that also aggregate with clay minerals and sediment particles to form flocs. Some of the particulate organic matter will be microbially decomposed into dissolved organic matter in the water column as well as in the sediment bed (Foree and McCarty, 1970). The near-bottom water flow transports (in)organic matter and microorganisms and is therefore another driving mechanism for sediment transport along many coasts, where both advection and resuspension occur (Ganaoui et al., 2007). The organic matter present in the water column is time and space dependent (Khelifa and Hill, 2006; Maggi, 2007; Fettweis and Baeye, 2015; Fettweis and Lee, 2017). When aggregated with mineral clay it will be shown that the produced flocs can have variety of shapes. This shape will be discussed in terms of particles aspect ratio in the present article.
The aim of this study is to investigate the properties of particles in the Rhine ROFI (size, shape, composition, density and settling velocity) and categorize those particles accordingly. These classes of particles will serve as input parameters for anticipated modelling studies (Chassagne and Safar, 2020). The one-day survey that was chosen to perform the analysis was a calm weather day. The low energetic conditions (neap tide) during the survey day led to the presence of very anisotropic particles in the water column and low SPM concentrations, which makes the interpretation of the in-situ data by diffraction techniques challenging. Studying the particles characteristics during these conditions is however interesting because at higher energetic conditions, mineral sediment particles dominate the Particle Size Distribution (PSD) close to the bed, where the measurements were performed. This would not allow the study of organic matter-based particles, which have typically a low concentration but play an important role in the flocculation and resuspension processes.
Four different in-situ/on board instruments, based on optical techniques, were used simultaneously during this one day boat survey in the Rhine-ROFI to perform this analysis. It will be shown that the combination of instruments enables to give an accurate overview of the different types of particles found in-situ, ranging from organic highly anisotropic particles to quasi-spherical mineral clay particles. In particular, it will be shown that the use of an underwater camera enables to clearly identify particles in the range of 10 μm — 1000 μm. The use of underwater cameras was long limited to size analysis of objects larger than hundreds of microns (Van Leussen and Cornelisse, 1993; Sternberg et al., 1999). Due to the latest development in camera specifications, it is nowadays possible to use underwater cameras with a much better resolution and light sensitivity (Benson and French, 2007; Smith and Friedrichs, 2015; Shen and Maa, 2016), which enables to assess particles larger than 10 μm.
Additional laboratory experiments have been performed to try to reproduce the flocs observed in-situ. The kinetics of flocculation are studied using static light scattering and the steady-state population of flocs is observed by video microscopy.
2 Materials and methods
2.1 In-situ measurements
2.1.1 Survey site and hydrodynamic conditions
An 11 hour boat survey (6:00 - 17:00 GMT) was performed on the 17th of September 2014 in the Rhine Region of Freshwater Influence (Rhine-ROFI) about 10 km downstream of the mouth of the Rotterdam Waterway during calm weather conditions. This field survey was part of a large field campaign that was conducted in September-October 2014 in the mid-field region of the Rhine ROFI (Flores et al., 2017), close to the Sand Engine (Stive et al., 2013). A mooring and two frames were deployed at 12 m depth as part of the Stratification Impact on Near-shore Sediment Transport (STRAINS II) experiment (Flores et al., 2017; Horner-Devine et al., 2017; Rijnsburger et al., 2018). In Figure 1 the position of the survey vessel is indicated by the capital letter S and cross. The mooring and two frames location is indicated by the capital letter M and the dot.
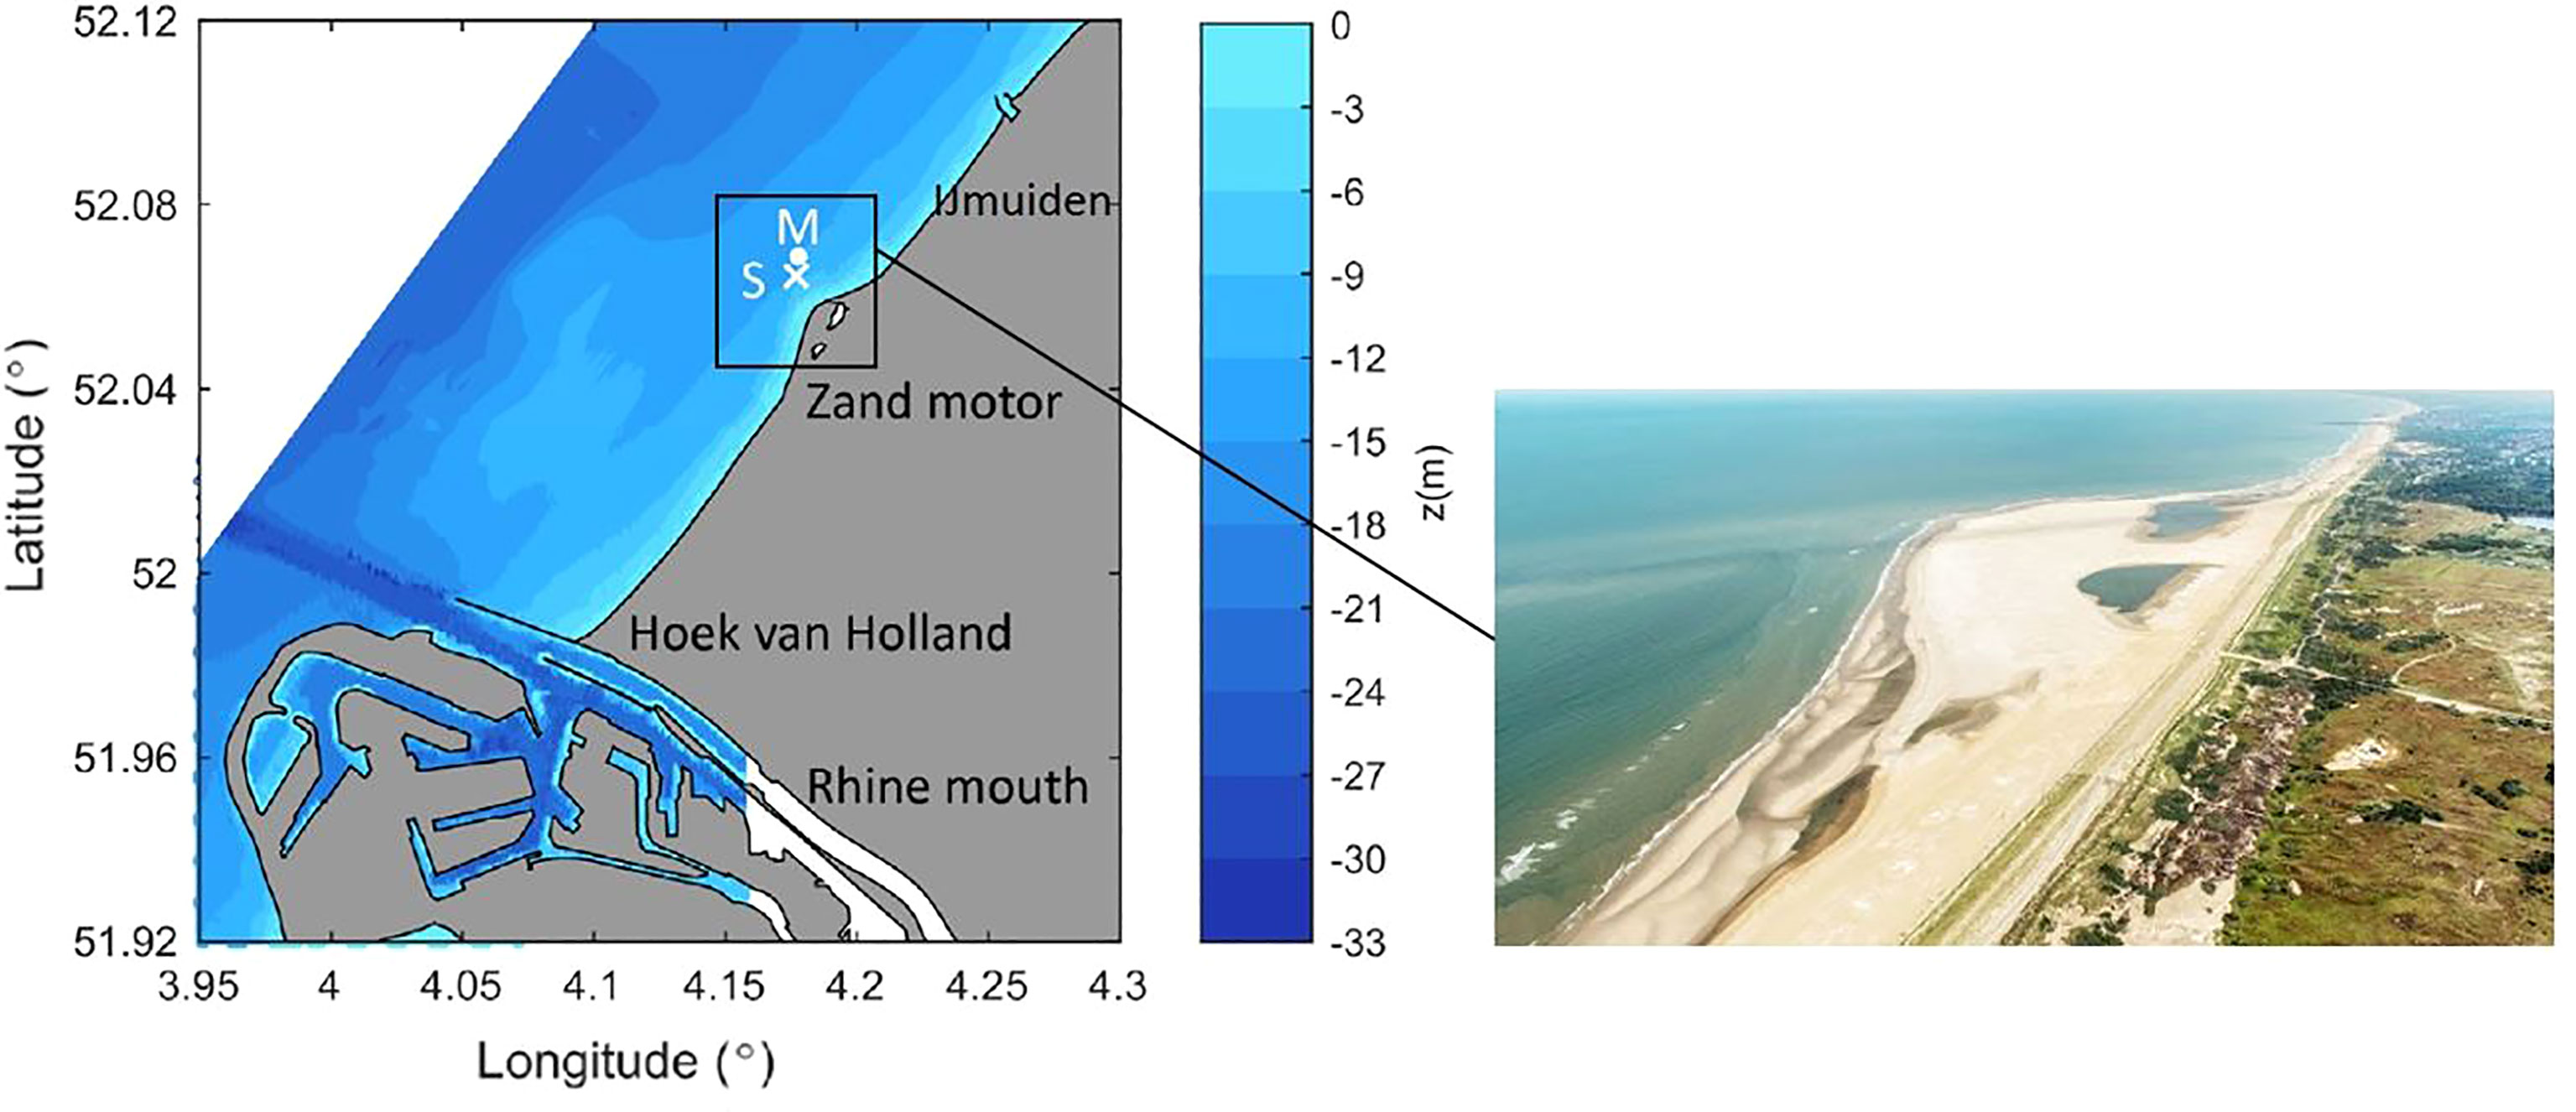
Figure 1 Left figure: Measurement position is given by (x), position of the survey vessel (S, cross), and the mooring and frames (M, dot). Right figure: Aerial view of the Sand Engine close to which the field survey was conducted (Photo: Rijkswaterstaat).
The tidal elevation at Hoek van Holland was between 0.85 m and -0.62 m, and the wind speed stayed below 6 m/s coming from the east. In addition, the significant wave height was below 0.5 m, which was retrieved from a wave rider buoy 1 km south from the survey site. The total river discharge from the Rhine and Meuse River was about 1500 m3/s, for that day. The boat survey started at flood tide, before the flood peak. The water column was weakly stratified with a salinity difference of 2 PSU (Practical Salinity Unit) between surface and bottom. The water column was divided into different salinity layers after a front arrival 2 hours later. The stratification prevailed almost the whole day as it was a neap tide day with low energetic mixing conditions. Note that the salinity close to the bottom remained close to 30 PSU.
The one day field-survey was used to study SPM in the near bed part of the water column. Several in-situ instruments, based on optical techniques, were used simultaneously during this day. Two of these instruments (LISST 100X and LISST-HOLO) were on a frame in the vicinity of the survey vessel whereas the underwater camera was operated from the vessel and the LabSFLOC2 camera set-up was used on board. The samples studied with the LabSFLOC2 camera were collected using a Van Dorn sampler and analysed as soon as the sampler was retrieved.
2.1.2 LISST 100X
LISST 100X (Laser In-Situ Scattering and Transmissometry) uses laser diffraction to determine the volume concentrations of particles in 32 logarithmically spaced effective spherical diameter classes. The obtained Particle Size Distribution (PSD) ranges for the 100X type from 2.5 – 500 μm (Traykovski et al., 1999; Agrawal, 2001). The LISST 100X was placed on the bottom frame, 1.65 m above the bed (mab) and measurements were taken every 10 seconds. The data was averaged over 10 minutes bursts.
2.1.3 LISST-HOLO
LISST-HOLO (Submersible Digital Holographic Camera) is an in-situ digital holographic technology that uses solid state diode laser at 658 nm and 4.4 μ m pixel size digital camera (1600 × 1200 pixels). It measures equivalent spherical diameters in the size range of 25-2500 μ m, within 50 log spaced size classes. The LISST- HOLO was placed at 1.40 mab on one of the two frames and took a picture every 5 minutes. The LISST-HOLO was tuned to get the most appropriate values for clean stack and threshold parameters (Davies et al., 2011). Clean Stack 3% and default threshold of 0.15 were found to give the best pictures and were used to process the raw data (LISST HOLO manual). The particle density can be estimated from the solidity calculated by the LISST-HOLO software. The solidity is defined as the solid fraction of a given particle, and can be related to the porosity of that particle (Choi et al., 2018). A fully solid particle will have a solidity of 1, whereas a solidity close to 0 will indicate a very porous particle. The solidity is obtained by dividing the black area of a particle (AB=N×r2 where r2 is the area of a black pixel and N the number of black pixels within a particle) by the total area (A) of that particle. We assume that the volume of the particle is given by V=A×c , where c is the dimension of the particle perpendicular to the field of view of the camera, and VB=AB×c is the volume of the black area. Assuming that the particles properties do not change along the direction indicated by c, we can express solidity as function of the volume of the particle by:
The density ρp of a particle is given by:
where ρs is the absolute density of the solid part and ρw is the absolute density of water (that fills the voids). It is assumed that no air is trapped in the flocs. From this we can deduce that the effective density of a floc is given by:
The density of the solid fraction ρs (represented by black pixels) is at this stage unknown. For mineral sediment flocs it can be expected to be close to 2600 kg m−3 and for organic rich particles, expected to be much lower (1016-1600 kg m−3 ) (Deng et al., 2019; Chassagne et al., 2021; Deng et al., 2021). Note that the assumption that the particle’s properties do not change along the direction indicated by c can lead to erroneous estimations.
2.1.4 LabSFLOC2 settling column camera system
The water samples were taken at 0.6 mab depth and were analysed using the LabSFLOC2 camera system (Laboratory Spectral Flocculation Characteristics, version 2) that recorded the settling velocity of particles from a pipetted amount of sample. The particle size, shape and effective density were estimated from the settling velocity (Manning et al., 2007b; Manning et al., 2010; Manning et al., 2017).
LabSFLOC2 was developed by Manning (Manning and Dyer, 2002; Benson and Manning, 2013; Manning et al., 2017), and it utilizes a high magnification 2.0 MP Grasshopper monochrome digital video camera (Manning and Dyer, 2002) to observe individual flocs as they settle in a 350 mm high by 100 mm square Perspex settling column. The video camera, positioned nominally 75 mm above the base of the column, views all particles in the center of the column that pass within a 1 mm depth of field, 45 mm from the Sill TZM 1560 Telecentric (maximum pixel distortion of 0.6%), 0.66 (1:1.5) magnification, F4, macro lens fitted behind a 5 mm thick glass face-plate.
During sampling, a modified pipette is used to carefully extract a floc sub-sample from the Van Dorn chamber and is filled to produce a fluid head of 50 mm, which results in a video image control sample volume nominally of 400 mm3 (1 mm image depth and 8 mm nominal video image width, with a nominal 50 mm high suspension extracted with a modified pipette). This controlled volume permits in principle LabSFLOC2 calculated floc mass to be compared and calibrated directly to ambient SSC. In the present study, this was not performed.
The pipette sub-sample is immediately transferred to the LabSFLOC2 settling chamber, whereby the aperture of the pipette was brought into contact with the LabSFLOC2 settling column water surface and permitted the flocs to pass from the vertically held pipette to the chamber and settle solely under gravity, i.e. naturally and unassisted. Thus, the flocs allowed to pass into the settling column were naturally segregated as they fell by the process of differential settling; i.e. the fastest falling aggregates would be observed first.
Settling flocs are viewed as silhouettes (to reduce image smearing) resulting from a CCS LDL-TP-43/35-BL, 43 x 35 mm, homogeneous blue (470 nm) back-illumination LED panel, located at the rear of the settling column. The video images are streamed in real time as AVI files to a laptop PC via a FireWire-B PCI card interface. The digital floc images are captured at a frame rate of 25 Hz (one frame is 0.04 s), at a resolution of 1600 × 1200 pixels, with an individual pixel nominally representing 5 μ m (confirmed by independent calibration). The AVI files are not Codec compressed, so they could be analysed with MATLAB software routines. During post-processing, the HR Wallingford Ltd DigiFloc software - version 1.0 (Benson and Manning, 2013; Manning et al., 2017), is then used to semi-automatically process the digital recordings to obtain floc size and settling velocity spectra.
The sphere-equivalent floc diameter, D , was calculated from the measured major and minor axis of each observed two-dimensional floc by (Manning and Schoellhamer, 2013):
Each floc settling velocity was determined by measuring the vertical distance that the floc travels between a sequence of frames. Stokes Law then enables an estimation of individual floc effective density (Manning and Schoellhamer, 2013),
where Ws is the settling velocity, μ is the water viscosity and g is the gravitational acceleration.
During the survey day, 26 samples were analyzed using the LabSFLOC2 camera system.
2.1.5 Underwater video camera
A video camera mounted under the Van Dorn sampler was lowered at each sampling time, to take videos of the particles at the sample location. The camera was an Imaging source GigE color camera, I/O Aptina CMOS MT9P031, with a maximum resolution of 2592 × 1944. The pixel size is 2μm×2μm . The videos taken with the underwater camera were used for qualitative analysis of the flocs and not for quantitative size analysis.
2.2 Laboratory measurements
Based on the observed field results, additional laboratory experiments were conducted to study flocculation of Port of Rotterdam (PoR) sediment as function of microalgae concentration. Seawater (filtered through a 5 μ m filter) was used as the suspending medium.
2.2.1 Sediment suspensions
The experiments were conducted with grab samples taken in the neighborhood of the survey (at the mooring indicated on the map and defined as PoR sediment.The samples were kept in a dark refrigerated room for two weeks before being used. The samples were sieved so as to remove particles coarser than 125 μm.
2.2.2 Algae
The microalgae Skeletonema costatum was chosen in the study, as being one of the most predominant algae species in the coastal area (Rijstenbil, 1987). The algae was obtained from the hatchery Roem van Yerseke B.V. The concentration of the algae stock suspension was about 5×10⁶ cells/mL and was kept in a dark environment to avoid photosynthesis and limit changes in concentration. The algae stock was refreshed every two weeks.
2.2.3 Particle size measurements
The Particle Size Distribution of samples was obtained by Static Light Scattering (SLS) using a Malvern Mastersizer 2000 which provides a full PSD every 30 s. The size range of the SLS device is 0.01-10000 μ m in 100 logarithmic-spaced bins. The samples are stirred in a 1L-jar at a constant rate of 35 rpm (Shear rate = 30 s−1 ), and pumped through pipes to and from the SLS device at a constant rate of 10 rotation per minute (rpm) which is about 12 s−1 . The set-up is the same as the one used by Ibanez et al. (Ibanez Sanz). The shear rates used are usually higher than those observed in the field (which are of the order of 0−10 s−1 ), especially at neap. However, these rates were determined in preliminary experiments to ensure a minimal breakage of the aggregated fractions and avoid settling in the pipes.
When a steady-state PSD was reached for a given algae concentration, the concentration of algae was adjusted to a higher content. The percentage of algae content was increased in steps to get concentrations of 10, 20 and 30 volume %. A separate measurement was done for a concentration of 5 volume %. Each percentage corresponds to the volume taken from the microalgae stock suspension divided by the total volume in the jar. At steady-state, some sub-samples have been pipetted and studied with the LabSFLOC2 camera system that was mounted in the laboratory. The description of the LabSFLOC2 camera system is given in Section 2.14. In order to obtain a good signal to noise ratio by SLS we used sediment and algae concentrations that are 100 times more concentrated than the ones observed in-situ during our one-day survey. The time scale of aggregation is therefore not be representative of in-situ conditions but an indicator whether flocculation is (or not) taking place.
3 Results and discussion
3.1 Field survey results
3.1.1 Classes of particles
From the underwater camera records and the LISST-HOLO pictures, different types of particles are identified, as shown in Figure 2. One type corresponds to (mineral) sediment-rich flocs, having an effective density close to 1600 kg m−3 with settling velocity of 1 - 10 mm/s. These particles have compact form and dark color (high density). An other particle type corresponds to organic matter-rich particles having an effective density between 16 - 160 kg m−3 with a settling velocity of 0.1 - 1 mm/s. These particles display an open or anisotropic structure and have a lighter color (low density). They are likely composed of inorganic and organic particles such as Transparent Extracellular Polymeric (TEP) substances (Jarvis et al., 2005; Spencer et al., 2010). For some of these flocs, the elongated algae structure is still recognizable, although the algae is coated with (in)organic debris and can be in some state of coiling. The third type corresponds to bare algae, or algae bound to very little amount of sediment, which have a very low density of about 16 kg m−3 with low settling velocity, mostly around 0.1 - 0.5 mm/s. The microalgae Skeletonema costatum, for instance, is known to form elongated strings (Karp-Boss et al., 2007; Many et al., 2019). Despite having such different settling velocities and densities, all these particles are composed of different amounts of organic and inorganic matter. As detailed in (Chassagne et al., 2021), flocs composed in part of organic and inorganic particles are defined as Class 2 particles, whereas pure organic particles (like microalgaes) are defined as belonging to Class 3. Class 1 particles are defined as pure mineral clay particles, and none of the particles observed using video techniques were belonging to this class. As the survey day was very calm, only very small clay particles (<1 μ m) are expected to be in suspension.
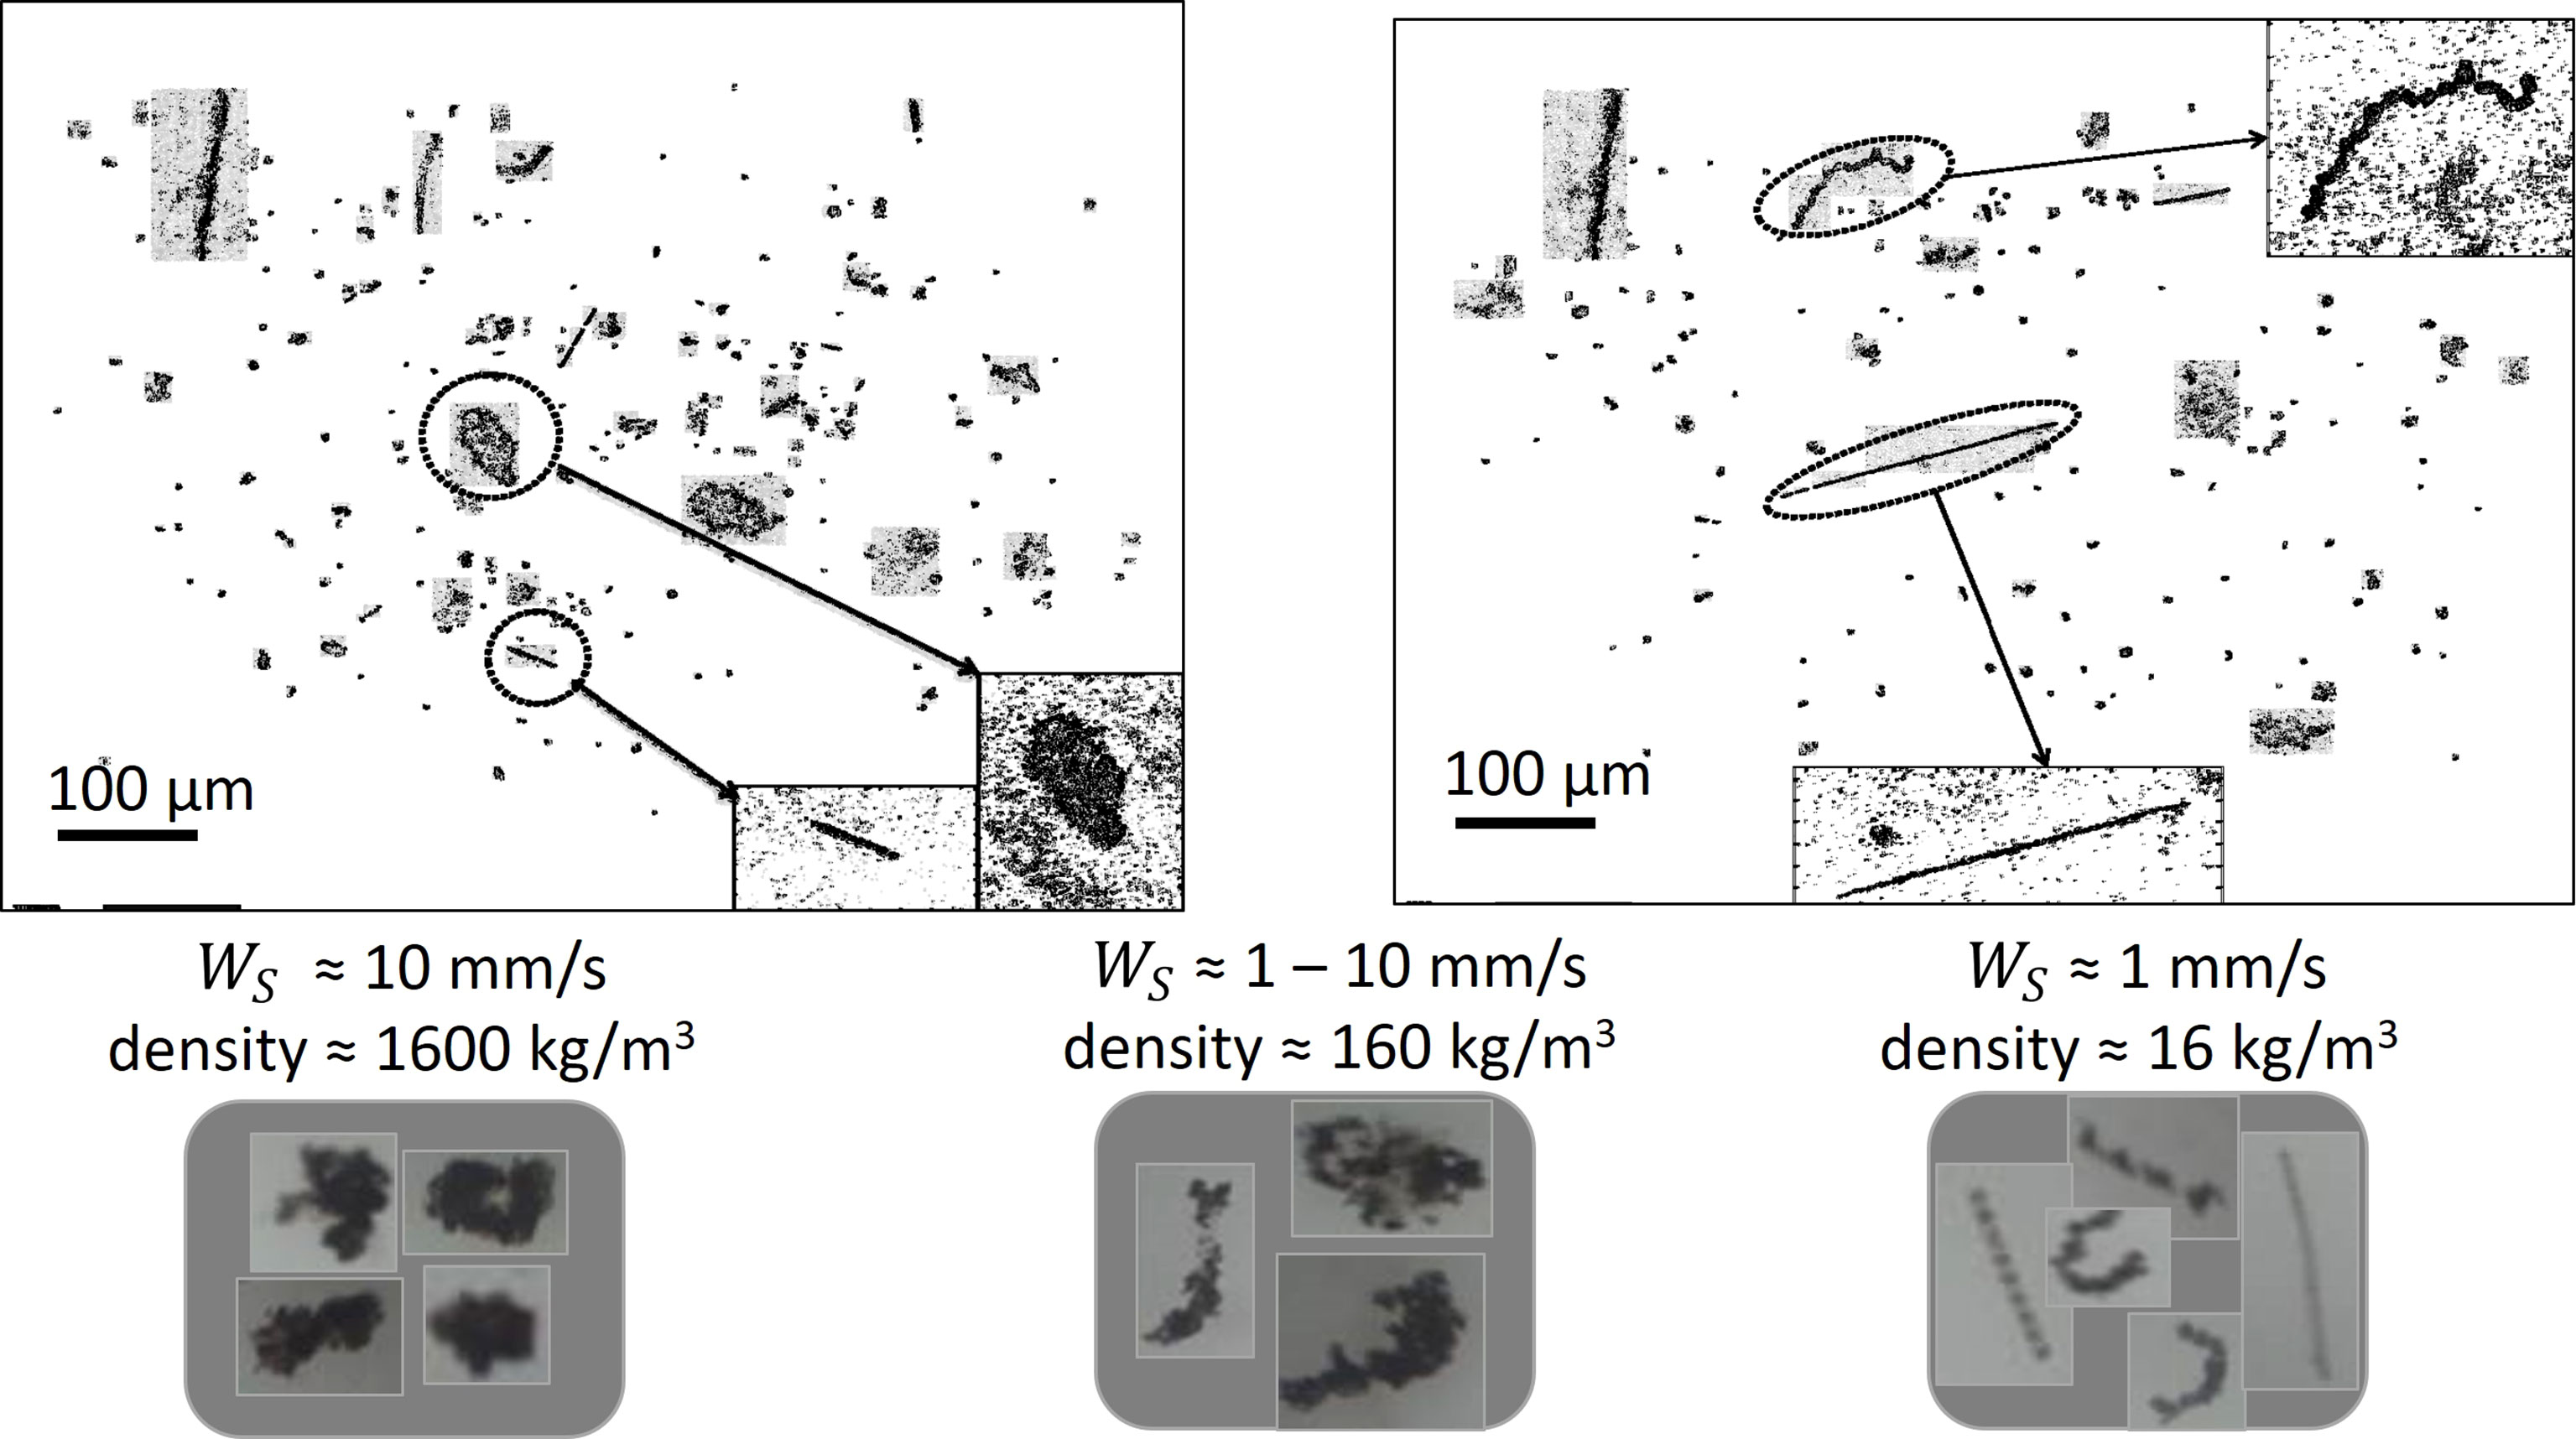
Figure 2 Different particles identified by LISST-HOLO (top figures) and underwater camera (bottom pictures) recordings. The indicated settling velocities and derived densities are found by LabSFLOC2 measurements. All the flocs illustrated here belong to the size range of 20 - 200 μ m. The flocs composed of inorganic/organic particles belong to Class 2 (left and middle pictures, some flocs on the right picture), whereas the bare algae (strings devoid of mineral sediment that are seen on the right picture) belong to Class 3.
The LabSFLOC2 camera cannot measure sizes below 10 μ m, a range that is accessible to the LISST-HOLO. This implies that in Figure 3 no particle below 10 μ m are recorded using the LabSFLOC2. As it was a calm day, not many particles were recorded, and a large spread in settling velocity was recorded the whole day. On the other hand, with the LabSFLOC2 technique, more large particles (> 100 μ m) were observed than with LISST-HOLO. This can partially be due to the fact that differential settling is occurring while particles are left to settle after being pipetted into the settling column. This would also lead to the cluster of fast-settling particles observed at 10:40 for example (also seen at 12:30) in Figure 3. Another possibility for these fast-settling particles is the coiling of flocs under shear that occurs continuously and lead to flocs as illustrated in Figure 2, at the bottom left. In Figure 4 a large spread in density for a given floc size is observed (left panel) - this spread is related to the spread in settling velocity for a given floc size, as shown in Figure 3. This spread was also observed in many studies, see for instance (Manning et al., 2007a; Manning and Schoellhamer, 2013). The spread in density for a given size can be attributed to two factors: first, the composition of a floc (the relative amount of mineral and organic matter within a floc) and second, a conversation artifact due to the shape of a floc. For highly anisotropic particles such as algae, the equivalent diameter will be estimated by:
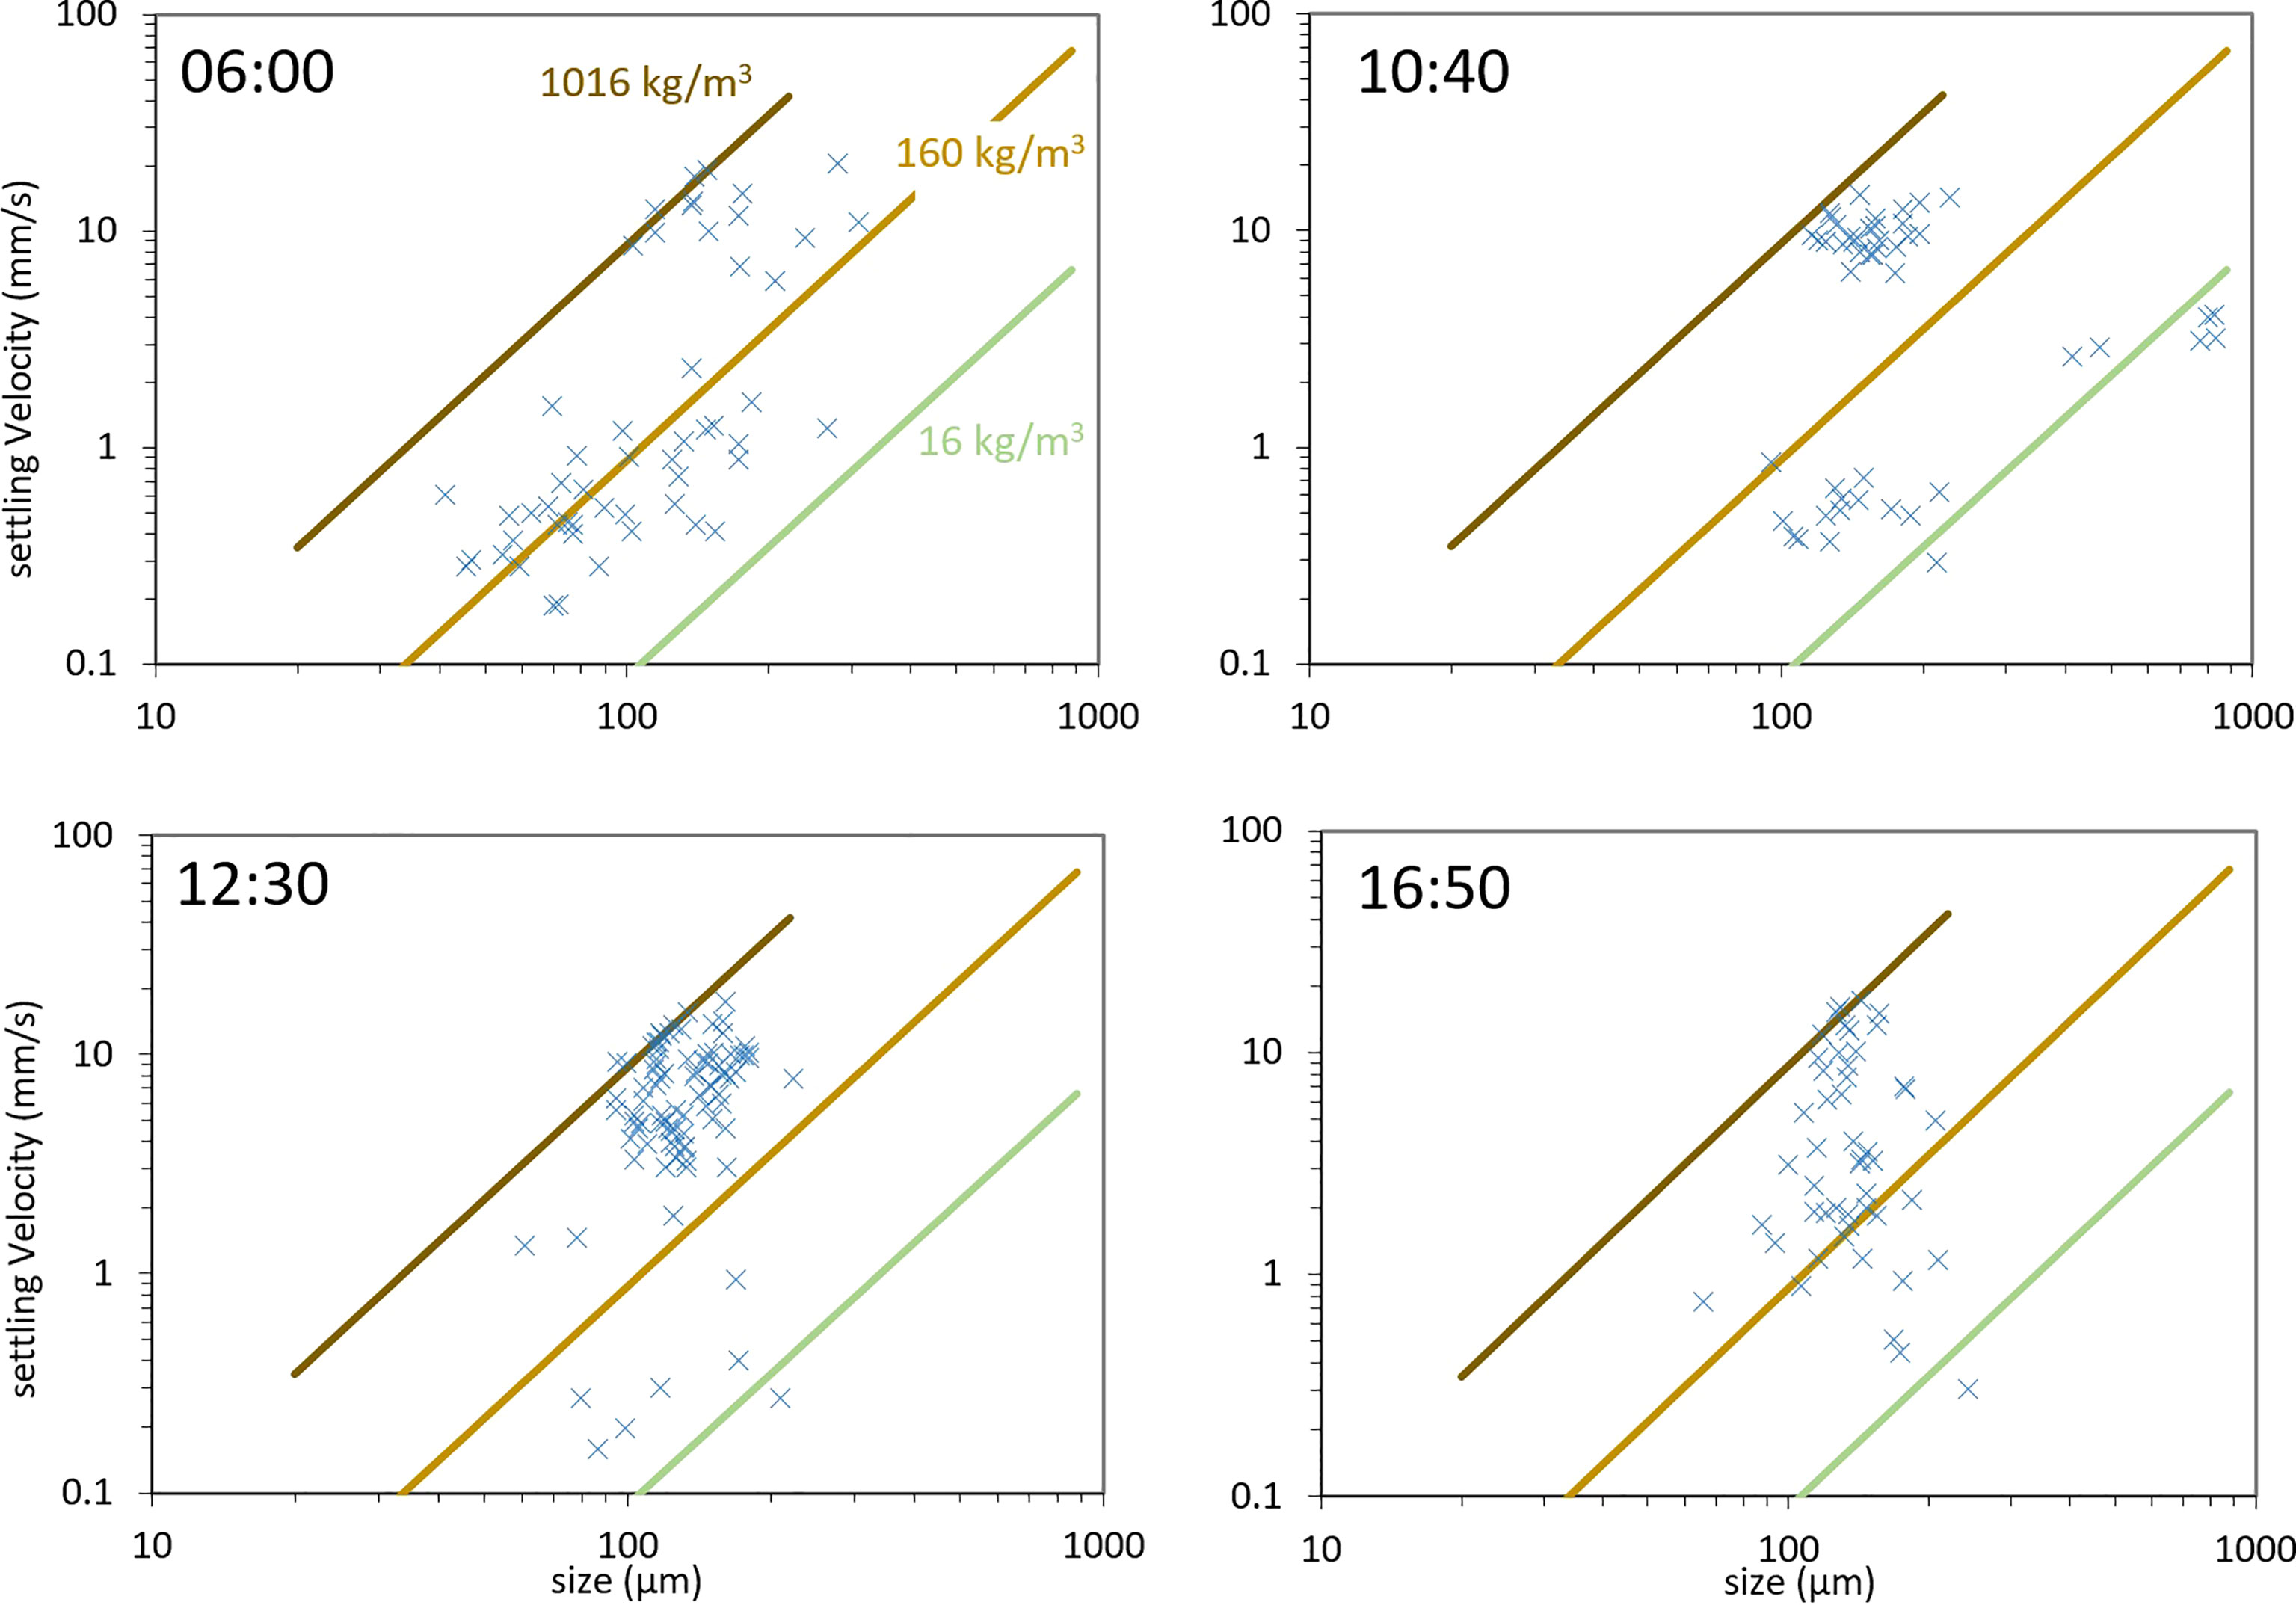
Figure 3 Settling velocities as function of equivalent diameter, as determined by LabSFLOC2 measurements at different GMT times of the survey day.
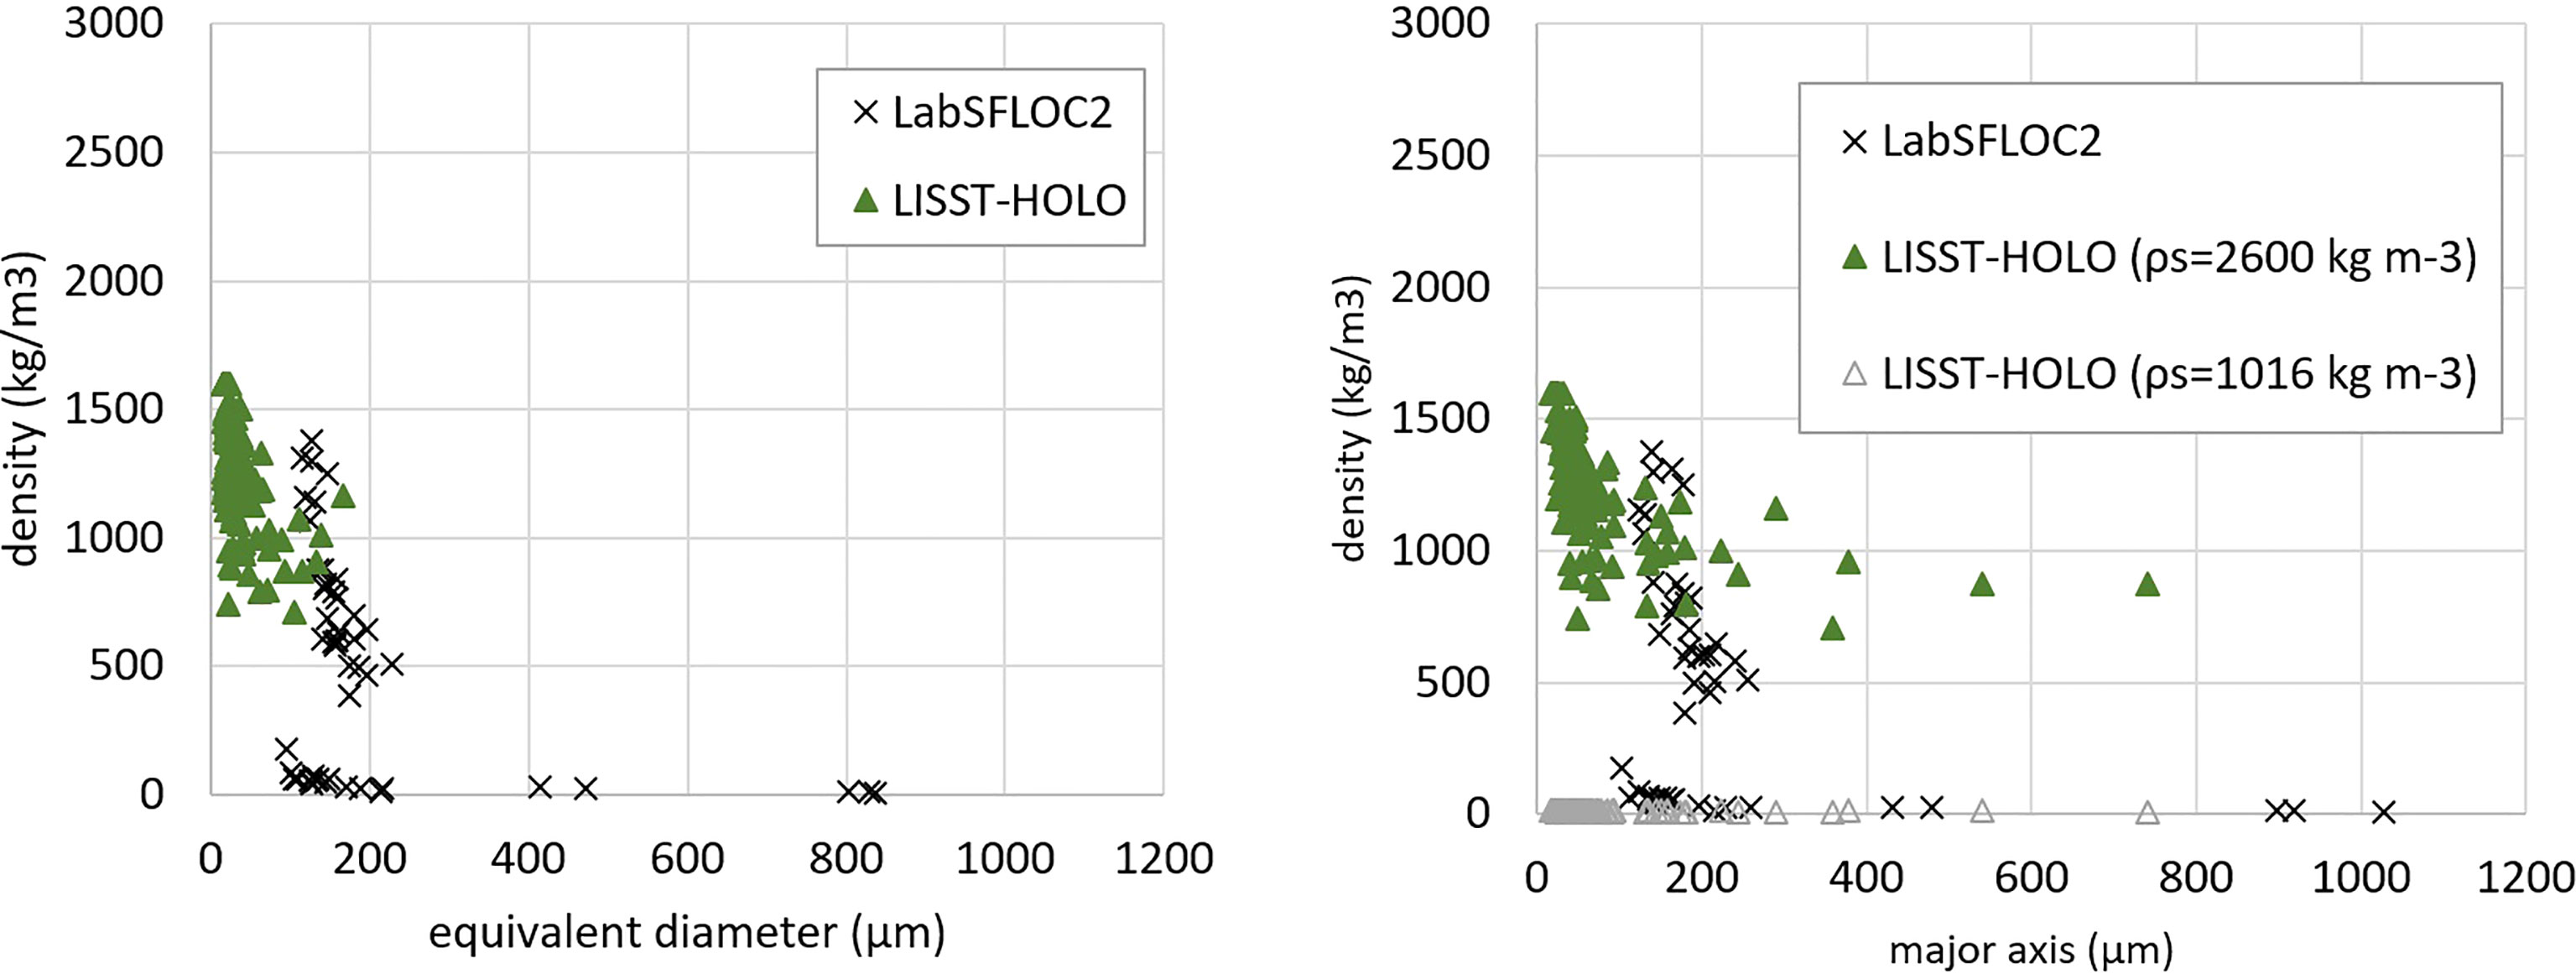
Figure 4 Density of particles as function of size, determined by LabSFLOC2 and LISST-HOLO measurements for survey time 10:40 (GMT). Left figure: as function of particle equivalent diameter, right figure: as function of particle major axis. See text for details about the derivation of the density from LISST-HOLO data.
where the AR the aspect ratio. For a 1 mm long algae, with AR=10 , this gives an equivalent diameter of about 100 μ m, which is the size that many flocs of aspect ratio close to 1 also have. Plotting the density as a function of the particle major axis can therefore help to better differentiate the different types of particles as illustrated in Figure 4, right panel where some elongated particles are now visible in the LISST-HOLO plot.
3.1.2 Density of particles
Particle density estimations are given in Figure 4 for the samples measured at 10:40 by LabSFLOC2 and LISST-HOLO. The data for that time is representative for all the three main type of particles found during the survey day. The density of the flocs recorded using the LabSFLOC2 was evaluated using the method described in Section 2.1.4. The density of the flocs recorded using the LISST-HOLO was evaluated using the method described in Section 2.1.3. This method requires the solid fraction density ρs as input, see eq.(3). From Figure 4, it can be seen that for particles having a major axis Dmajor<300 μm, the data found by LISST-HOLO and by LabsFLOC match when ρs is taken to be the one for mineral clay (which is done for the data plotted in the left panel as well as the one indicated as ρs = 2600 kg m−3 in the right panel), whereas for particles having a major axis Dmajor>300 μ m, the data found by LISST-HOLO and by LabsFLOC match when ρs is taken to be close to the density of organic material (which was taken to be 1016 kg m−3 ). This is done in the right panel (ρs = 1016 kg m−3 ). This implies that a black/white scale to estimate the solidity as proposed in Section 2.1.3 is not appropriate to estimate densities and that a proper greyscale analysis should be performed, whereby the greyscale would be calibrated with the inorganic/organic composition of a floc. This can not be done at present, as this analysis requires a proper calibration of the greyscale colours based on more extended research.
The fact that density of flocs decreases with size has been reported by numerous studies (Gibbs, 1985: Al Ani et al., 1991; Vaezi et al., 2011; Mehta et al., 2014; Ramirez Mendoza). This density/size dependence is usually modelled using the relation
where D is the particle diameter evaluated according to eq.(4) and D0 is a reference size, usually taken to be the one of a primary particle. The parameter Df found from fitting the data is often refered to as a fractal dimension. As we now have seen, even though eq.(7) usually models well the data, no information can be gained from Df as in the situations where organic matter plays a role in flocculation, ρs will be a decreasing function of D.
3.1.3 Particle Size Distribution (PSD) with various techniques
As the size of the particles did not change significantly during the whole day, the PSD data from the LISST 100X, the LISST-HOLO and the LabSFLOC2 camera system were averaged over the entire day for each instrument. This enabled having a statistically significant data set, as the amount of particles detected was low during the day. Figure 5 shows the day average particle size distributions estimated by the three techniques. Although the LabSFLOC2 camera data are not directly comparable with the LISST data due to differences between the two techniques (Mikkelsen et al., 2005), the overall mean size of the particles obtained from the LabSFLOC2 camera correlates with the mean particle size obtained from the LISST data and fluctuates between 150 and 220 μ m.
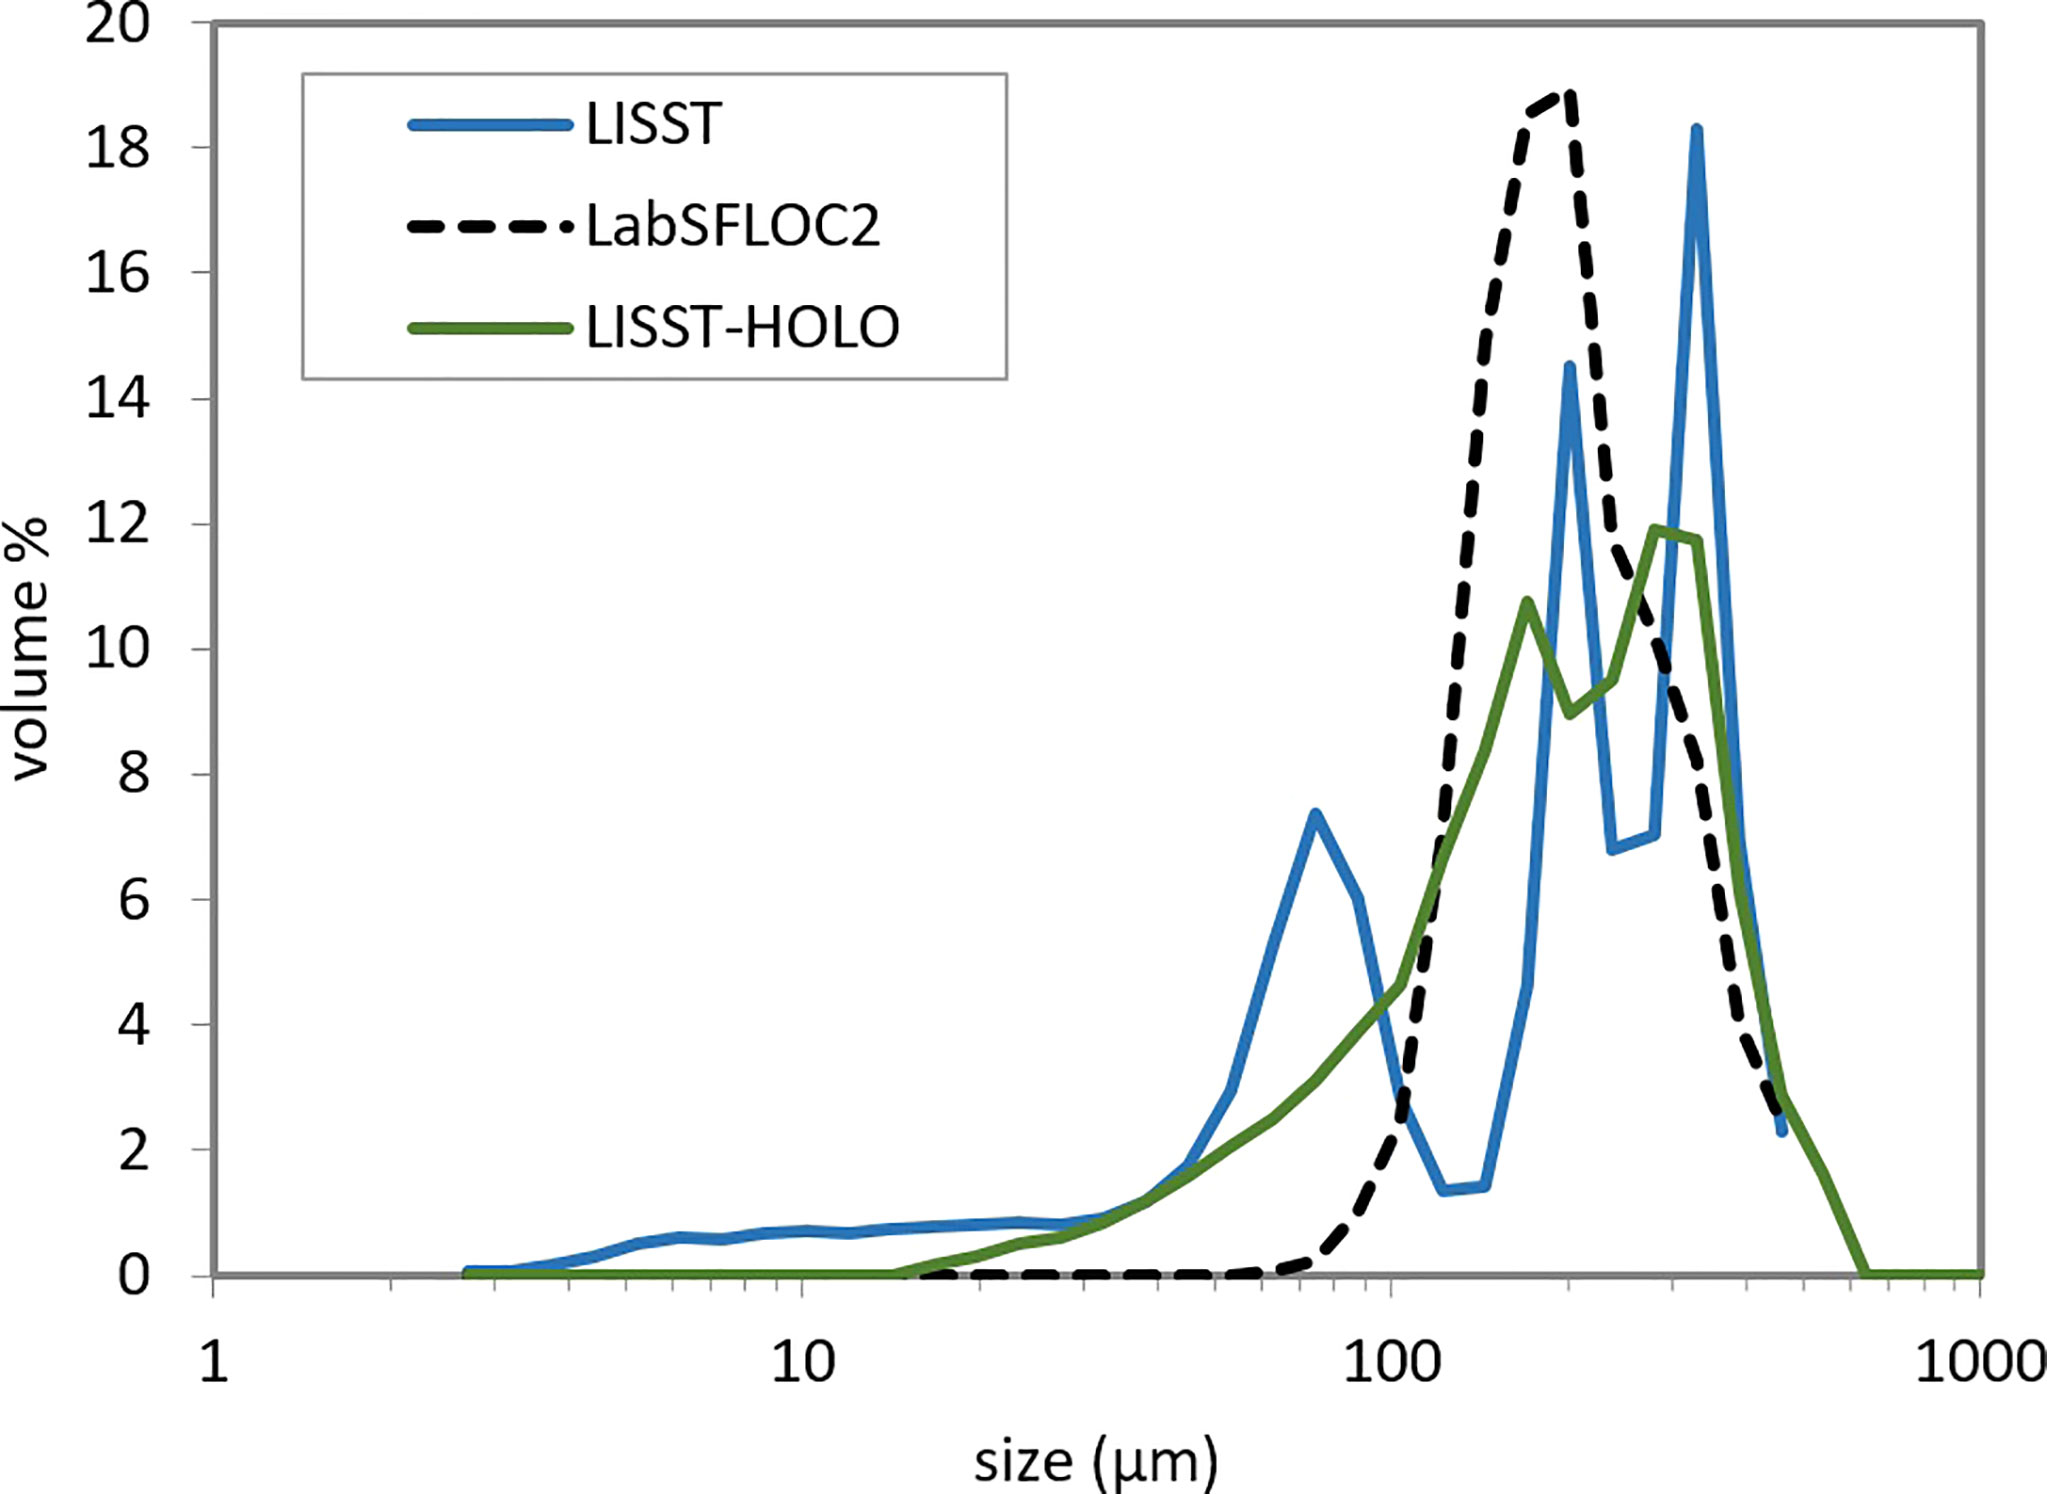
Figure 5 Comparison between the PSD’s obtained from three measurement techniques. Each PSD is the average of the data collected during the 11 hour survey.
The clay-silt fraction (< 10 μ m) can only be assessed by LISST 100X and is out of the LISST-HOLO and LabSFLOC2 system range.
The averaged PSD measured by LISST 100X is trimodal with peaks in particle sizes at 300, 200 and 70 μ m. It was shown by Karp-Boss et al. that biological species cause trimodal distributions in LISST 100 data due to their very anisotropic shape (Karp-Boss et al., 2007). The PSD measured by LISST-HOLO displays two marked peaks which overlap the 200 μ m and 300 μ m LISST 100X size peaks. Graham et al. showed that the PSD produced by LISST-HOLO usually indeed overlap with the PSD of LISST 100X in the size range (20-500 μ m) (Graham et al., 2012). The LabSFLOC2 data on the other hand displays one wide peak that tends to be bimodal, overlapping mainly the 200 μ m peak and slightly the 300 μ m peak. Graham and Nimmo Smith (2010), who compared the LISST-HOLO PSD with the Malvern Hydro 2000G PSD, have found that the LISST-HOLO PSD showed multiple modes as compared to the monomodal PSD produced by the Malvern Hydro 2000G, which were attributed to overlapping large particles in the field of view of the holographic system. In our case, the presence of highly anisotropic particles leads to same kind of effect. The PSD found using the LabSFLOC2 technique is based on the particle size estimation given by eq.(4). Both minor and major axis are visually determined and therefore no error is made when identifying the particles.
Agrawal et al. inverted the data found by LISST 100X using different kernel matrix to produce particle size distribution for non-spherical particles (Agrawal et al., 2008). However their method does not apply to very anisotropic particles such as bare algae and flocculated algae as are present in our observations. This is why a combination of holographic pictures and/or other video or camera recording, are necessary to interpret the LISST 100X PSD as was also concluded by Graham et al. (2012).
3.2 Laboratory Experiments results
From laboratory experiments it is possible to study the time evolution of the clay-algae floc size distributions without the technical problems encountered with the in-situ LISST (Graham and Nimmo Smith, 2010). The untreated PoR sediment obtained from grab samples and the microalage were suspended in seawater as described in Section 2.2. The PSD was measured during flocculation.
Figure 6 shows the SLS (Malvern 2000) measurements of the mean particle sizes (D50) evolution in time until reaching a steady-state. The corresponding PSDs are given in Figure 7.
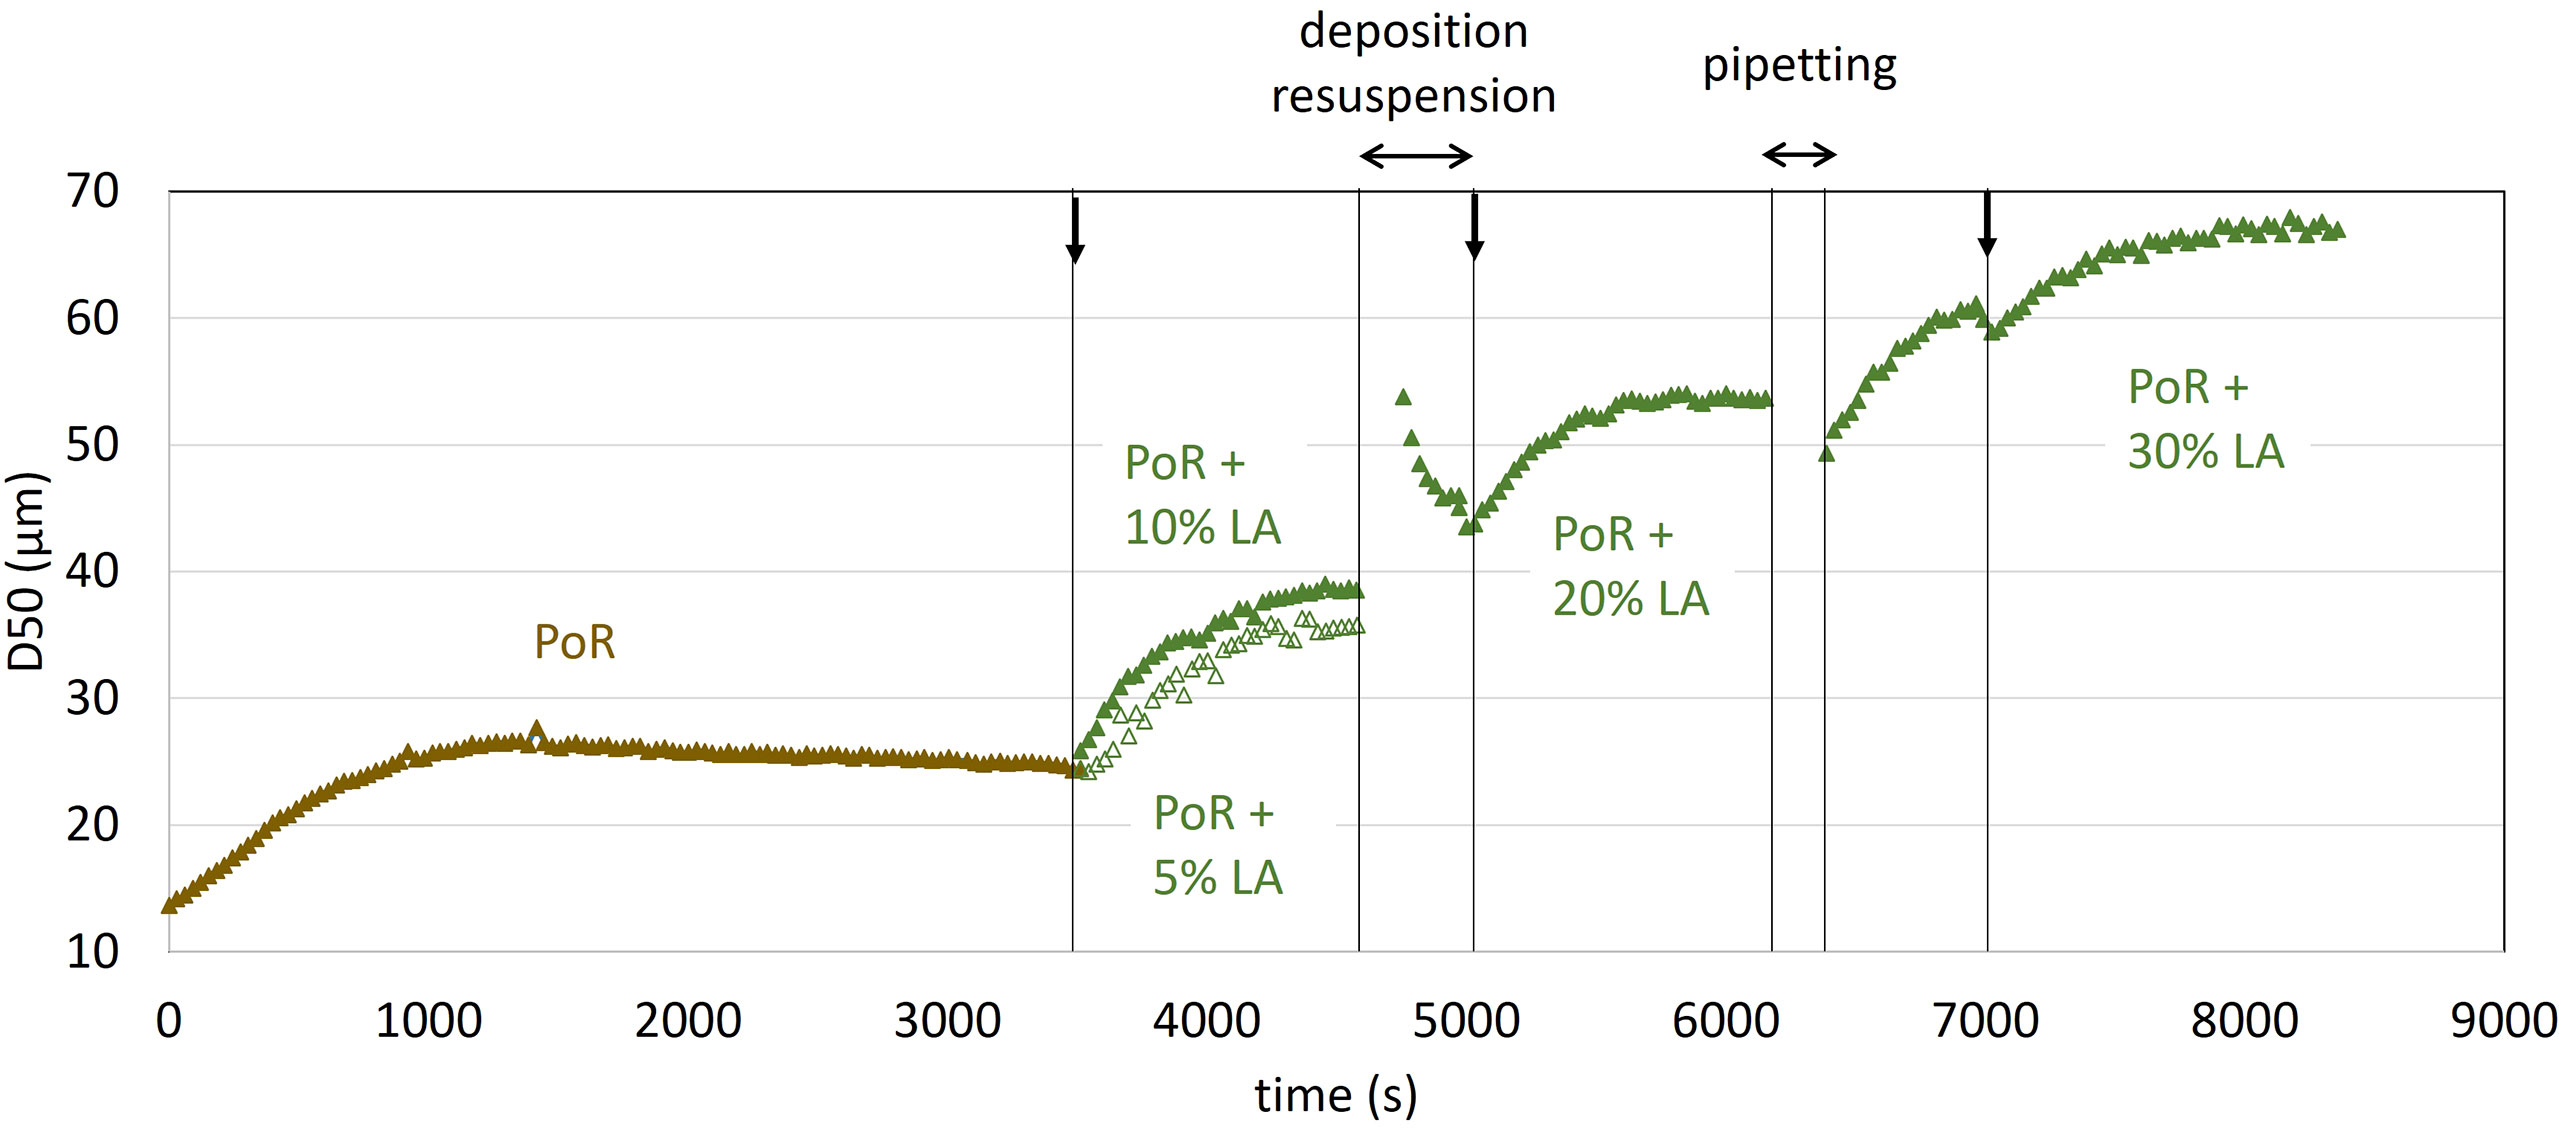
Figure 6 Mean particle size (D50) evolution as function of time. The vertical arrows indicate injection of Living Algae (LA). See text for details.
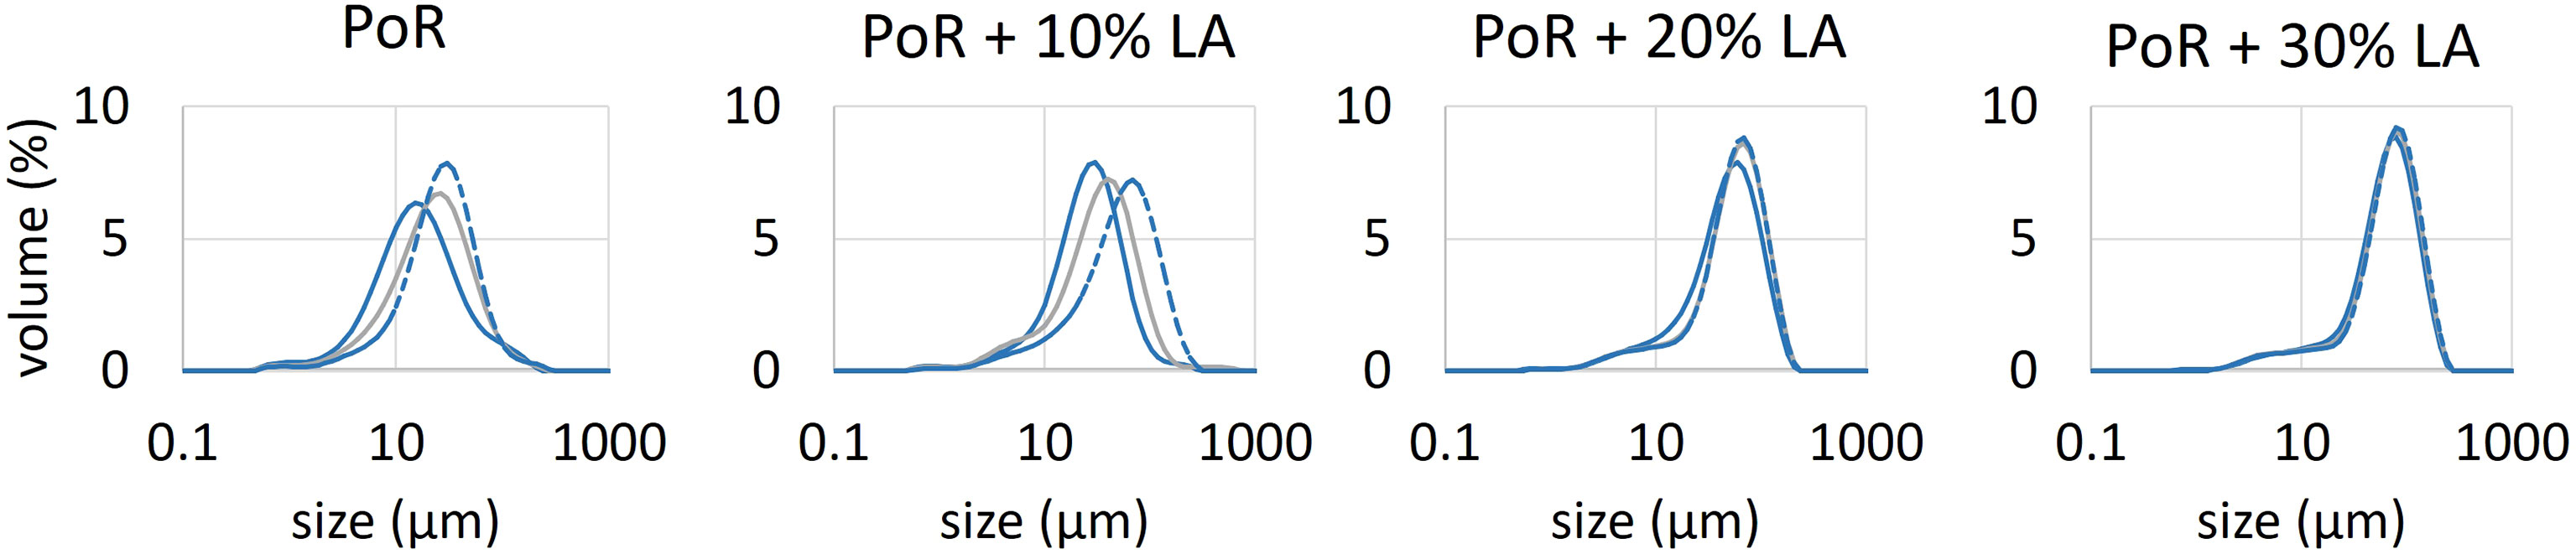
Figure 7 Particle size distributions as function of time. Full blue curve: after injection of algae; grey curve: 500 s after injection; dashed blue curve: before sampling for LabSFLOC2 measurements (when steady-state is reached).
The flocculation rate of PoR sediment particles (no added algae) is low, as is usually observed for sediment suspensions in saline water. It has been shown that salt-induced flocs are extremely fragile, and that their (fully reversible), growth/break-up is proportional to shear stress (Mietta et al., 2009). The organic matter originally present in the PoR samples is decayed, as the samples have been stored for quite some time in a fridge. It is unclear at this stage whether this organic matter (originally present in PoR sample) plays a role in the flocculation process. After reaching steady-state, Living Algae (LA) is added to the suspension to produce a 10% LA + 0.2 g/L PoR sediment suspension. After reaching a steady-state more LA is added to produce a 20% LA + 0.17 g/L PoR sediment suspension. This procedure is repeated to produce a 30% LA + 0.15 g/L PoR sediment suspension. A separate measurement (open symbols) was performed for a 5% LA + 0.21 g/L PoR sediment suspension. In the presence of algae, the mean particle size shifts towards higher particle sizes in a few minutes, indicating that the sediment particles are binding to the algae. From Figure 7, it can be seen that the Particle Size Distribution (PSD) of the samples remain fairly monomodal, even just after injection of microalgae. In contrast to in-situ measurements, the algae used in the lab experiments is rather monodisperse and in the micron-size range. This explains why flocs grow monotonically over time, as more microalgae and sediment particles stick together. After reaching each steady-state a sample was taken to be analysed with the LabSFLOC2 camera system, see Figure 8.
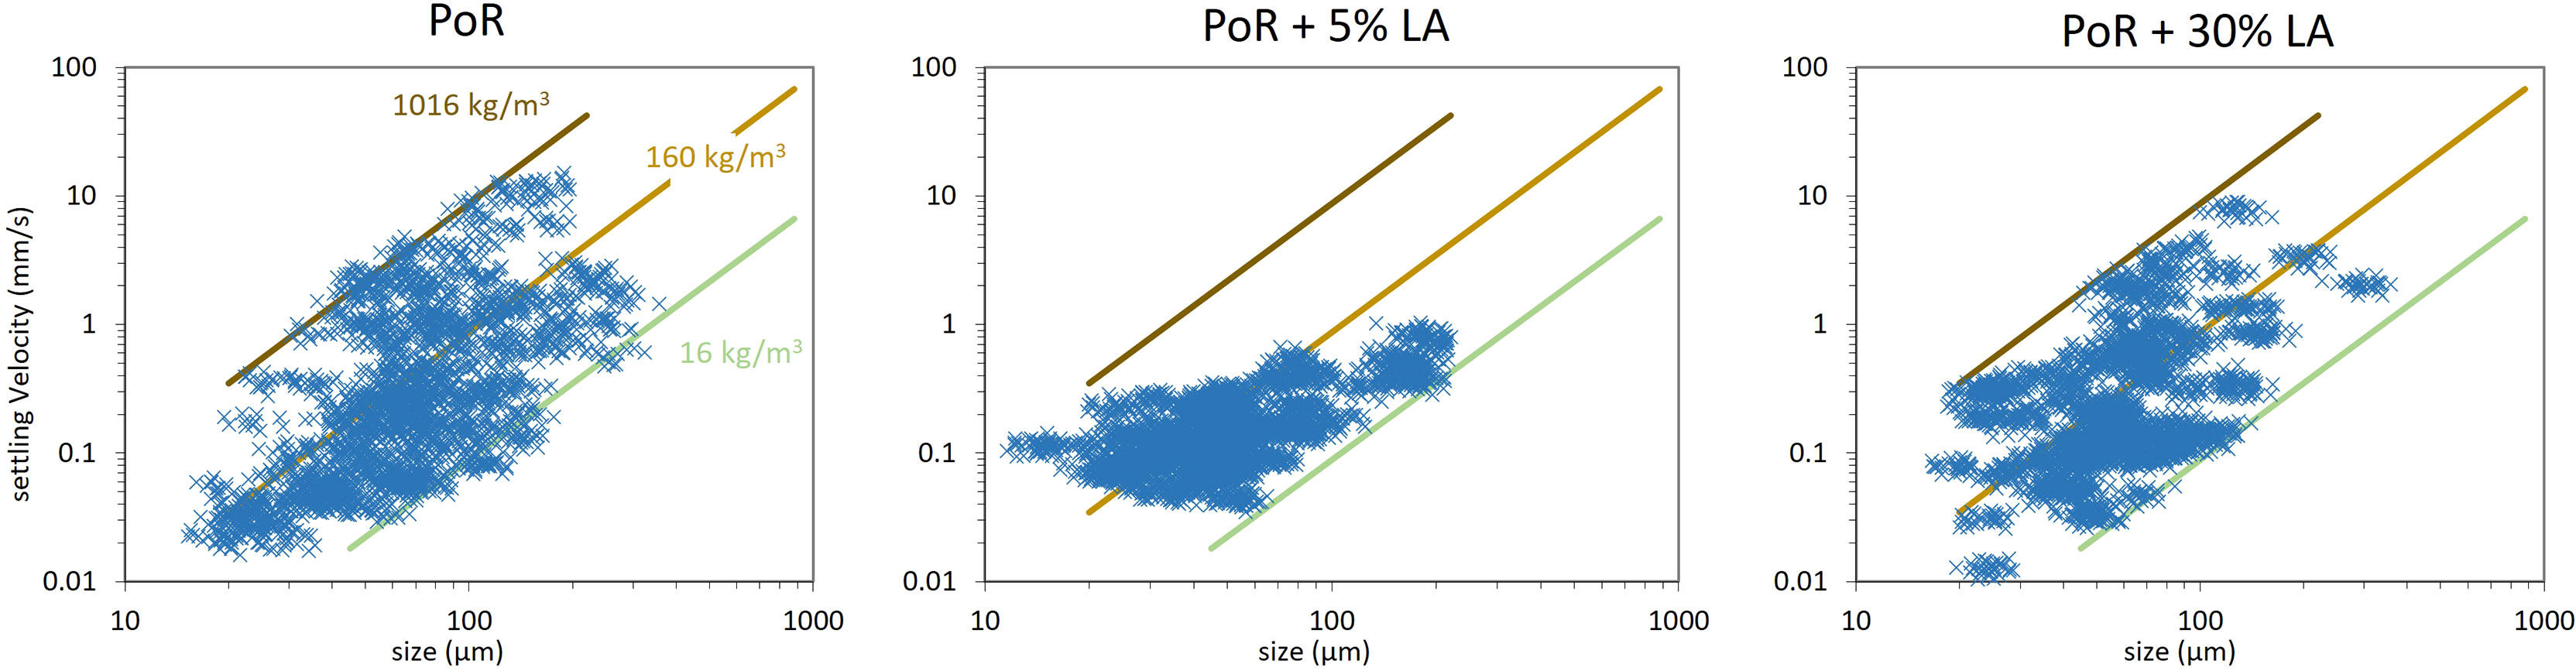
Figure 8 Settling velocity as function of mean size (equivalent diameter) determined by LabSFLOC2 experiments.
Besides the mean size of particles, the aspect ratio of each particle was also determined and the density of each particle evaluated using Stokes Law. The results are given in Figure 9. A distinction is made in that figure between particles having an effective density larger or lower than 160 kg m−3 . The value of 160 kg m−3 corresponds to the middle line in Figure 8.
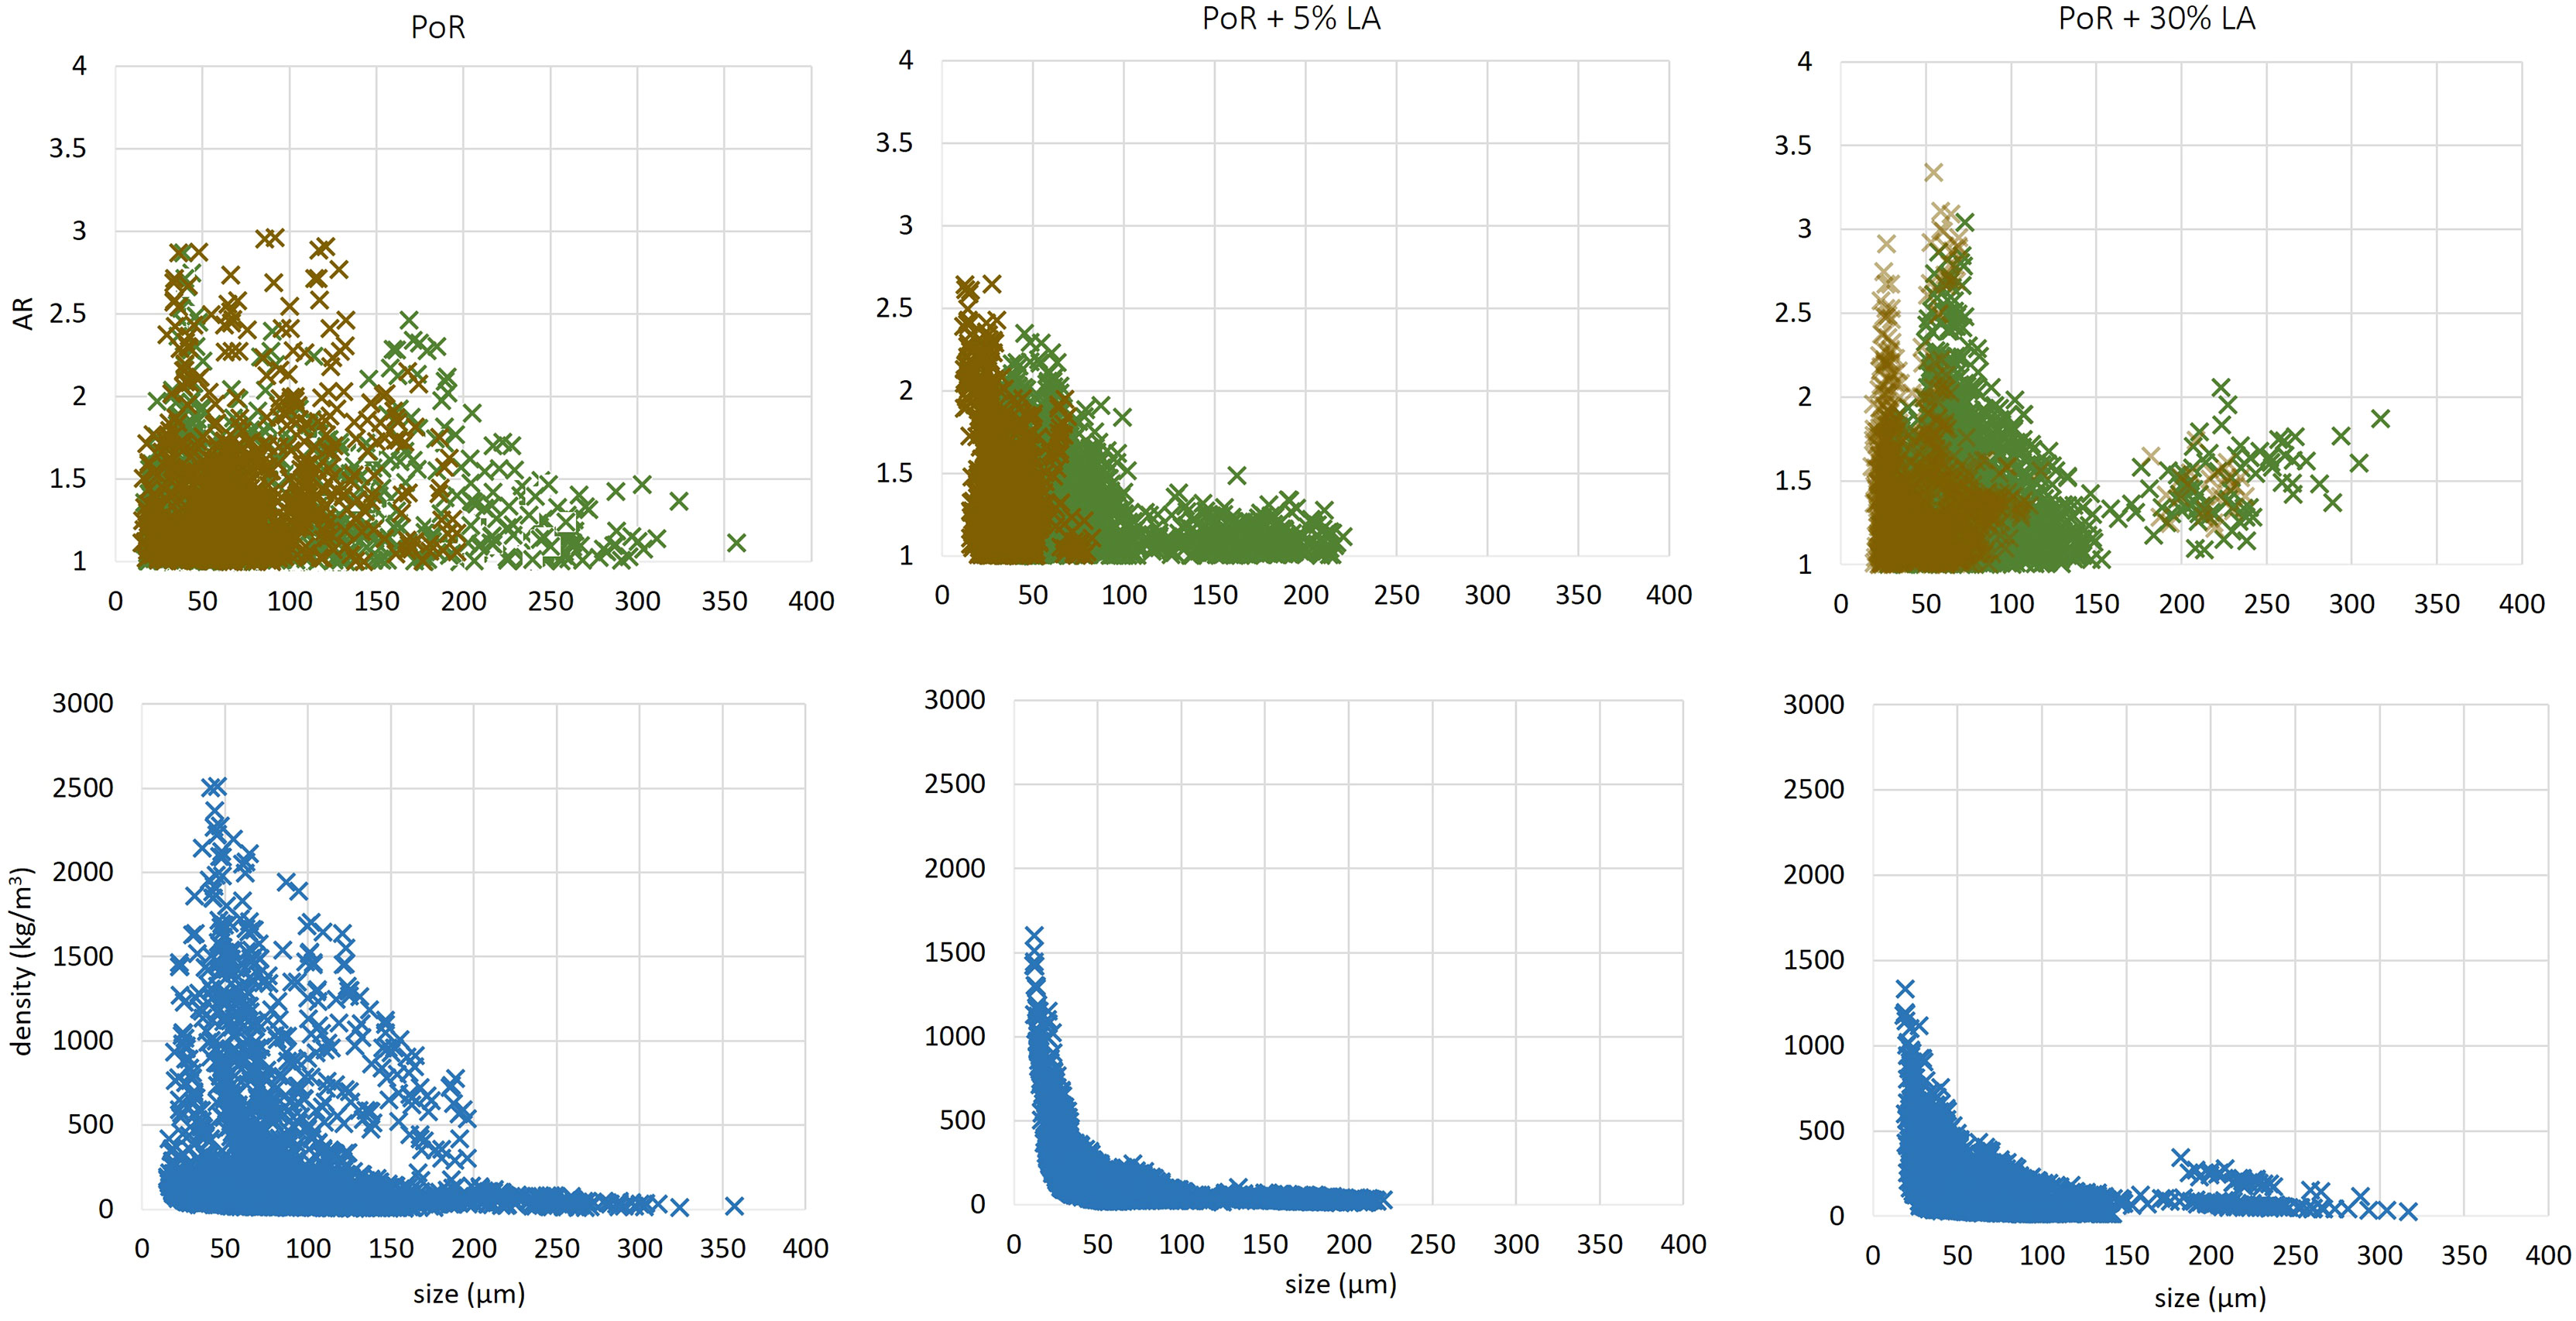
Figure 9 Top panel: Aspect Ratio (AR) as function of equivalent diameter. The brown color represents particles of effective density larger than 160 kg m−3 and the green colour particles of density lower than 160 kg m−3 . Bottom panel: absolute density as function of equivalent diameter. The data is obtained by LabSFLOC2 experiments.
The PoR sediment sample displays particles in the size range 20-350 μ m with a wide range of settling velocities (between 0.01 - 10 mm/s), aspect ratio (AR = 1 - 3) and absolute densities (0 - 2500 kg m−3 ). In the sample with 5% LA content, the particles have aggregated with algae of lower density and hence the settling velocity range becomes (0.01 - 0.5 mm/s). The estimated densities are now in the range (0 - 1500 kg m−3 ). One large cluster with effective density between 160 kg m−3 and 16 kg m−3 is found in the size range > 100 μ m, see Figure 9. These low density particles can be attributed to microalgae which have aggregated with themselves.
Upon addition of LA, the density/size profile changes in shape and resembles more an exponential decreasing density function of size, as it is usually observed in estuarine conditions (Manning and Schoellhamer, 2013). The PoR sample has a much wider spread in density for a given particles size compared with sediment and living algae. This is consistent with the fact that the the LA binds to the mineral sediment particles, hereby reducing the density of the particles. As was discussed in the previous subsection, eq.(7) cannot be used to estimate a meaningful fractal dimension, as ρs depends on particle size.
The sample with 30% LA shows a large number of clusters, with a large spread in settling velocities (0.01 - 10 mm/s). A large amount of particles are found in the effective density range 160 - 16 kg m−3 and sizes > 100 μ m, which indicates that these particles are algae-rich. These particles are also elongated (AR > 1), see Figure 9. The AR is not as high as the ones observed in-situ, due to the shear imposed in the jar, which prevents flocs to grow anisotropically. This condition is different in-situ, where the shear is usually milder and differential settling can occur, whereby particles can “catch-up” with each other (Deng et al., 2021).
When pippeting the samples for the LabSFLOC2 experiments in the presence of algae, the stirrer twice needed to be stopped in the jar, resulting in the deposition of flocs at the bottom of the jar (see “deposition/resuspension” and “pipeting” in Figure 6). When the stirrer was set in motion again, flocs were resuspended and it was assumed that aggregation had occured between flocs that had been in contact at the bottom of the jar. This resulted in the large size increase upon resuspension observed after “deposition/resuspension”. Very rapidly, due to shear, the mean size decreased towards the steady-state value found before the stirrer was stopped. At “pipetting” the stirrer was only very briefly stopped. Despite the fact that the D50 had reached a steady-state prior the pipeting, some size increase was observed after the stirrer was set in motion again.
4 Conclusion
In this study, we have presented the SPM characteristics of a one-day field survey in the Rhine ROFI, during neap tide calm weather conditions with a variety of techniques. Videos from the underwater camera and LISST-HOLO data show the presence of many algae particles in the bottom water layer. These particles can be found in the form of elongated chains, or bound to debris and mineral particles in different degrees of coiling. From sample analysis done on board with a LabSFLOC2 camera, the aspect ratio of the particles could be quantified and was found to be close on average to 2 for the lightest particles (effective density < 160 kg m−3 ) even though aspect ratios between 3 and 8 were also observed for this class of particles. All the other particles have in good approximation an aspect ratio close to 1. According to their density estimations, and confirmed visually from the LISST-HOLO and underwater camera video recordings, these lightest particles were algae-rich flocs or bare algae particles.
The particle density was estimated using Stokes Law from the LabSFLOC2 data. It could in principle also be estimated from the solidity derived from the LISST-HOLO data, however due to presence of organic rich particles, the conversion is not straightforward, as the density of organic and inorganic particles are very different. Further research is required to find a proper calibration between the gray-scale recorded from LISST-HOLO and density.
The fact that particles are highly anisotropic leads to multiple peaks in the PSD found using the LISST 100X. These peaks could lead to the erroneous interpretation that they correspond to meaningful particle size distributions. Comparison between instruments (LISST with LabsFLOC2 and underwater camera) has demonstrated that the combination of instrument leads to better data interpretation. The mean particle size obtained by LISST 100X for the larger flocs is however in agreement with the mean particle size obtained with the LISST-HOLO and LabsFLOC camera system.
The use of different measurement techniques provide a full spectrum of particle size distribution: LISST 100X can be used to detect the fine fraction (< 20 μ m), while LabSFLOC2, LISST-HOLO and the underwater camera provide information about the coarser fraction, in particular the particles’ shape. From the LabSFLOC2, both size and settling velocity can be estimated, from which density can be assessed.
Based on these findings the in-situ SPM particles are categorized into three classes. These classes are defined as follows:
(Class 1): Sediment inorganic particles (clay minerals): the particles in this class have high effective density and small aspect ratio. Class 1 particles can flocculate with organic matter to form Class 2 particles. They belong to the size range < 20 μ m.
(Class 2): Flocculated particles: this class has a wide distribution in sizes (20 - 200 μ m), effective densities and settling velocities (0.1 - 10 mm/s). Their properties depend on the availability of the other classes, the floc history and hydrodynamic conditions.
(Class 3): Living (microalgae) or dead organic matter (exopolymers): particles in this class have low effective density, can have a high aspect ratio and can flocculate with sediment particles. The largest microalgae recorded in-situ have sizes > 200 μ m, however microalgaes and expopolymers can have sizes in the range (100 nm - 20 μ m).
The size ranges given in the present article (< 20 μ m, 20 - 200 μ m, > 200 μ m) are purely indicative. Shen et al. (2018) for instance uses the size ranges 0.25-4 μ m for primary particles and 4 - 20 μ m for microflocs. They discuss the fact that microflocs are generally stable and compact, whereas the sizes of macroflocs and megaflocs (sometimes referred to as microflocs and macroflocs if only two classes are considered) varies for different studies. The critical diameter that separates macroflocs and megaflocs (microflocs and macroflocs) is in the range 133 - 500 μ m.
In future studies, the role of organic matter should be better integrated. Recently, such a study has for instance been done in the Southern Bight of the North Sea (Fettweis et al., 2022). The authors have analyzed the seasonal variations in concentration of Transparent Exopolymer Particles (TEPs), particulate organic carbon (POC) and particulate organic nitrogen (PON) were investigated together with floc size and the concentration of suspended particulate matter (SPM) along the cross-shore gradient, from the high turbid nearshore toward the low-turbid offshore waters. They found in particular that, despite a constantly high abundance of total TEP throughout the entire year, it is its fresh organic matter fraction (i.e. produced during phytoplankton blooms) that promotes the formation of larger and faster sinking biomineral flocs, thereby contributing to reducing the SPM concentration in the water column over spring and summer. Clearly, the seasonal variations in organic matter properties hence impact the suspended sediment properties, such as floc composition, size, shape and density in particular.
Complementary laboratory experiments have confirmed that sediment inorganic particles bind to living microalgae: the flocculation time between inorganic and organic (algae) particles is less than a few minutes. In the laboratory experiments, no floc or algae strain had an aspect ratio larger than 3, suggesting that the creation of highly anisotropic particles, as observed in field data, is occuring in environmental conditions that are different from the lab. Due to technical constraints, high and continuous shears need to be applied in the lab, whereas differential settling and lower shears in-situ lead to the creation of more elongated and open flocs. This study helped us to rethink our laboratory set-up and design a new one that will enable to study the growth and decay of flocs in conditions that are closer to in-situ conditions.
The main finding of this study is that flocs (Class 2 particles) which are found in the size range 20-200 μ m and which corresponds to the size range of most particles found in-situ, have a very large spread in density due to their organic/inorganic composition. This suggests that the organic fraction should be an input parameter in any realistic flocculation model. A more in-depth discussion, that put the work presented here in a broader context can be found in (Chassagne et al., 2021). The new flocculation model presented in (Chassagne and Safar, 2020; Chassagne et al., 2021) can be parameterized by laboratory experiments involving suspensions of mineral sediment and organic matter (living or dead) - which will be the topic of a forthcoming article. The model is based on parameters measurable in-situ, in particular by laser diffraction (LISST 100X), which enables it to be tested. This model can easily be implemented in large-scale sediment transport models (Chassagne and Safar, 2020).
Data availability statement
The original contributions presented in the study are included in the article/supplementary material. Further inquiries can be directed to the corresponding authors.
Author contributions
ZS: data analysis and writing. CC: writing and supervision. SR: data collection and processing. MS: data collection and processing. AM: data collection and processing. JP: supervising. AS: data analysis revision and writing revision. TK: data analysis revision. AH-D: data collection. RF: data collection. MM: data collection. All authors contributed to the article and approved the submitted version.
Funding
This work has been performed in the frame of the grant NWO 869.15.011, entitled “Flocs and fluff in the Delta” and the MUDNET academic network (https://www.tudelft.nl/mudnet/).
Conflict of interest
Author MS was employed by company Antea Group, and author AM was employed by company HR Wallingford Ltd.
The remaining authors declare that the research was conducted in the absence of any commercial or financial relationships that could be construed as a potential conflict of interest.
Publisher’s note
All claims expressed in this article are solely those of the authors and do not necessarily represent those of their affiliated organizations, or those of the publisher, the editors and the reviewers. Any product that may be evaluated in this article, or claim that may be made by its manufacturer, is not guaranteed or endorsed by the publisher.
References
Agrawal Y. C. (2001). Traykovski p. particles in the bottom boundary layer: Concentration and size dynamics through events. J. Geophys. Res.: Oceans. 106 (C5), 9533–9542. doi: 10.1029/2000JC900160
Agrawal Y. C., Whitmire A., Mikkelsen O. A., Pottsmith H. C. (2008). Light scattering by random shaped particles and consequences on measuring suspended sediments by laser diffraction. J. Geophys. Res.: Oceans., 113(C4). doi: 10.1029/2007JC004403
Al Ani S., Dyer K. R., Huntley D. A. (1991). Measurement of the influence of salinity on floc density and strength. Geo-Marine. Lett. 11 (3), 154–158. doi: 10.1007/BF02431002
Alldredge A. L., Gotschalk C. C. (1989). Direct observations of the mass flocculation of diatom blooms: characteristics, settling velocities and formation of diatom aggregates. Deep. Sea. Res. Part A. Oceanographic. Res. Papers. 36 (2), 159–171. doi: 10.1016/0198-0149(89)90131-3
Benson T., French J. R. (2007). InSiPID: A new low-cost instrument for in situ particle size measurements in estuarine and coastal waters. J. Sea. Res. 58 (3), 167–188. doi: 10.1016/j.seares.2007.04.003
Benson T., Manning A. J. (2013). DigiFloc: the development of semi-automatic software to determine the size and settling velocity of flocs (HR Wallingford Report DDY0427-Rt001).
Blauw A. N. (2015). Monitoring and prediction of phytoplankton dynamics in the north Sea (Universiteit van Amsterdam [Host]) UvA-DARE (Digital Academic Repository).
Chassagne C., Safar Z. (2020). Modelling flocculation: Towards an integration in large-scale sediment transport models. Mar. Geol. 430, 106361. doi: 10.1016/j.margeo.2020.106361
Chassagne C., Safar Z., Deng Z., He Q., Manning A. (2021). “Flocculation in estuaries: Modeling, laboratory and in-situ studies,” in Sediment transport - recent advances (IntechOpen). doi: 10.5772/intechopen.100404
Choi S. M., Seo J. Y., Ha H. K., Lee G. H. (2018). Estimating effective density of cohesive sediment using shape factors from holographic images. Estuarine. Coast. Shelf. Sci. 215, 144–151. doi: 10.1016/j.ecss.2018.10.008
Cross J., Nimmo-Smith W. A., Hosegood P. J., Torres R. (2015). The role of advection in the distribution of plankton populations at a moored 1-d coastal observatory. Prog. Oceanography. 137, 342–359. doi: 10.1016/j.pocean.2015.04.016
Dam H. G., Drapeau D. T. (1995). Coagulation efficiency, organic-matter glues and the dynamics of particles during a phytoplankton bloom in a mesocosm study. Deep. Sea. Res. Part II.: Topical. Stud. Oceanography. 42 (1), 111–123. doi: 10.1016/0967-0645(95)00007-D
Davies E. J., Nimmo-Smith W. A., Agrawal Y. C., Souza A. J. (2011). Scattering signatures of suspended particles: an integrated system for combining digital holography and laser diffraction. Optics. Express. 19 (25), 25488–25499. doi: 10.1364/OE.19.025488
Deng Z., He Q., Chassagne C., Wang Z. B. (2021). Seasonal variation of floc population influenced by the presence of algae in the changjiang (Yangtze river) estuary. Mar. Geol. 440, 106600. doi: 10.1016/j.margeo.2021.106600
Deng Z., He Q., Safar Z., Chassagne C. (2019). The role of algae in fine sediment flocculation: In-situ and laboratory measurements. Mar. Geol. 413, 71–84. doi: 10.1016/j.margeo.2019.02.003
De Ruyter van Steveninck E. D., Admiraal W., Breebaart L., Tubbing G. M., Van Zanten B. (1992). Plankton in the river Rhine: structural and functional changes observed during downstream transport. J. Plankton. Res. 14 (10), 1351–1368. doi: 10.1093/plankt/14.10.1351
Fettweis M. (2008). Uncertainty of excess density and settling velocity of mud flocs derived from in situ measurements. Estuarine. Coast. Shelf. Sci. 78 (2), 426–436. doi: 10.1016/j.ecss.2008.01.007
Fettweis M., Baeye M. (2015). Seasonal variation in concentration, size, and settling velocity of muddy marine flocs in the benthic boundary layer. J. Geophys. Res.: Oceans. 120 (8), 5648–5667. doi: 10.1002/2014JC010644
Fettweis M., Lee B. J. (2017). Spatial and seasonal variation of biomineral suspended particulate matter properties in high-turbid nearshore and low-turbid offshore zones. Water 9 (9), 694. doi: 10.3390/w9090694
Fettweis M., Schartau M., Desmit X., Lee B. J., Terseleer N., van der Zande D., et al. (2022). Organic matter composition of biomineral flocs and its influence on suspended particulate matter dynamics along a nearshore to offshore transect. J. Geophys. Res.: Biogeosci. 127 (1), e2021JG006332. doi: 10.1029/2021JG006332
Flores R. P., Rijnsburger S., Horner-Devine A. R., Souza A. J., Pietrzak J. D. (2017). The impact of storms and stratification on sediment transport in the r hine region of freshwater influence. J. Geophys. Res.: Oceans. 122 (5), 4456–4477. doi: 10.1002/2016JC012362
Foree E. G., McCarty P. L. (1970). Anaerobic decomposition of algae. Environ. Sci. Technol. 4 (10), 842–849. doi: 10.1021/es60045a005
Ganaoui O. E., Schaaff E., Boyer P., Amielh M., Anselmet F., Grenz C. (2007). Erosion of the upper layer of cohesive sediments: characterization of some properties. J. Hydraulic. Eng. 133 (9), 1087–1091. doi: 10.1061/(ASCE)0733-9429(2007)133:9(1087)
Gibbs R. J. (1985). Estuarine flocs: their size, settling velocity and density. J. Geophys. Res.: Oceans. 90 (C2), 3249–3251. doi: 10.1029/JC090iC02p03249
Graham G. W., Davies E. J., Nimmo-Smith W. A., Bowers D. G., Braithwaite K. M. (2012). Interpreting LISST-100X measurements of particles with complex shape using digital in-line holography. J. Geophys. Res.: Oceans. 117 (C5), C05034. doi: 10.1029/2011JC007613
Graham G. W., Nimmo Smith W. A. (2010). The application of holography to the analysis of size and settling velocity of suspended cohesive sediments. Limnol. Oceanography.: Methods 8 (1), 1–5. doi: 10.4319/lom.2010.8.1
Horner-Devine A. R., Pietrzak J. D., Souza A. J., McKeon M. A., Meirelles S., Henriquez M., et al. (2017). Cross-shore transport of nearshore sediment by river plume frontal pumping. Geophys. Res. Lett. 44 (12), 6343–6351. doi: 10.1002/2017GL073378
Ibanez Sanz M. E. (2018). Flocculation and consolidation of cohesive sediments under the influence of coagulant and flocculant (Delft University of Technology).
Jarvis P., Jefferson B., Parsons S. A. (2005). Breakage, regrowth, and fractal nature of natural organic matter flocs. Environ. Sci. Technol. 39 (7), 2307–2314. doi: 10.1021/es048854x
Karp-Boss L., Azevedo L., Boss E. (2007). LISST-100 measurements of phytoplankton size distribution: Evaluation of the effects of cell shape. Limnol. Oceanography.: Methods 5 (11), 396–406. doi: 10.4319/lom.2007.5.396
Khelifa A., Hill P. S. (2006). Models for effective density and settling velocity of flocs. J. Hydraulic. Res. 44 (3), 390–401. doi: 10.1080/00221686.2006.9521690
Lartiges B. S., Deneux-Mustin S., Villemin G., Mustin C., Barres O., Chamerois M., et al. (2001). Composition, structure and size distribution of suspended particulates from the Rhine river. Water Res. 35 (3), 808–816. doi: 10.1016/S0043-1354(00)00293-1
Lee B. J., Hur J., Toorman E. A. (2017). Seasonal variation in flocculation potential of river water: Roles of the organic matter pool. Water 9 (5), 335. doi: 10.3390/w9050335
Lee J., Liu J. T., Hung C. C., Lin S., Du X. (2016). River plume induced variability of suspended particle characteristics. Mar. Geol. 380, 219–230. doi: 10.1016/j.margeo.2016.04.014
Logan B. E., Passow U., Alldredge A. L., Grossartt H. P., Simont M. (1995). Rapid formation and sedimentation of large aggregates is predictable from coagulation rates (half-lives) of transparent exopolymer particles (TEP). Deep. Sea. Res. Part II.: Topical. Stud. Oceanography. 42 (1), 203–214. doi: 10.1016/0967-0645(95)00012-F
Maggi F. (2007). Variable fractal dimension: A major control for floc structure and flocculation kinematics of suspended cohesive sediment. J. Geophys. Res.: Oceans. 112 (C7), C7012. doi: 10.1029/2006JC003951
Malone T. C. (1980). Algal size [Influence on response to environment, physiological processes]. Stud. Ecol. (USA). 7, 456–463.
Manning A. J., Dyer K. R. (2002). The use of optics for the in situ determination of flocculated mud characteristics. J. Optics. A.: Pure. Appl. Optics. 4 (4), S71. doi: 10.1088/1464-4258/4/4/366
Manning A. J., Friend P. L., Prowse N., Amos C. L. (2007a). Estuarine mud flocculation properties determined using an annular mini-flume and the LabSFLOC system. Continental. Shelf. Res. 27 (8), 1080–1095. doi: 10.1016/j.csr.2006.04.011
Manning A. J., Friend P. L., Prowse N., Amos C. L. (2007b). Preliminary findings from a study of Medway estuary (UK) natural mud floc properties using a laboratory mini-flume and the LabSFLOC system. Continental. Shelf. Res. BIOFLOW. SI. 1080-95. doi: 10.1016/j.csr.2006.04.011
Manning A. J., Schoellhamer D. H. (2013). Factors controlling floc settling velocity along a longitudinal estuarine transect. Mar. Geol. 345, 266–280. doi: 10.1016/j.margeo.2013.06.018
Manning A. J., Schoellhamer D. H., Mehta A. J., Nover D., Schladow S. G. (2010). “Video measurements of flocculated sediment in lakes and estuaries in the USA,” in Proceedings of the joint federal interagency conference on sedimentation and hydrologic modeling (Nevada, USA: Riviera Hotel, Las Vegas).
Manning A. J., Whitehouse R. J., Uncles R. J. (2017). Suspended particulate matter: the measurements of flocs. ECSA practical handbooks on survey and analysis methods. Estuar. Coast. Hydrography. Sedimentol. 17, 211–260. doi: 10.1017/9781139644426.009
Many G., Bourrin F., de Madron X. D., Pairaud I., Gangloff A., Doxaran D., et al. (2016). Particle assemblage characterization in the Rhone river ROFI. J. Mar. Syst. 157, 39–51. doi: 10.1016/j.jmarsys.2015.12.010
Many G., de Madron X. D., Verney R., Bourrin F., Renosh P. R., Jourdin F., et al. (2019). Geometry, fractal dimension and settling velocity of flocs during flooding conditions in the rhône ROFI. Estuarine. Coast. Shelf. Sci. 219, 1–3. doi: 10.1016/j.ecss.2019.01.017
Mehta A. J., Manning A. J., Khare Y. P. (2014). A note on the krone deposition equation and significance of floc aggregation. Mar. Geol. 354, 34–39. doi: 10.1016/j.margeo.2014.04.002
Mietta F., Chassagne C., Manning A. J., Winterwerp J. C. (2009). Influence of shear rate, organic matter content, pH and salinity on mud flocculation. Ocean Dynamics. 59 (5), 751–763. doi: 10.1007/s10236-009-0231-4
Mikkelsen O. A., Hill P. S., Milligan T. G., Chant R. J. (2005). In situ particle size distributions and volume concentrations from a LISST-100 laser particle sizer and a digital floc camera. Continental. Shelf. Res. 25 (16), 1959–1978. doi: 10.1016/j.csr.2005.07.001
Passow U., Alldredge A. L., Logan B. E. (1994). The role of particulate carbohydrate exudates in the flocculation of diatom blooms. Deep. Sea. Res. Part I.: Oceanographic. Res. Papers. 41 (2), 335–357. doi: 10.1016/0967-0637(94)90007-8
Pavoni J. L., Tenney M. W., Echelberger W. F. Jr. (1972). Bacterial exocellular polymers and biological flocculation. J. (Water. pollut. Control. Federation). 1, 414–431.
Pietrzak J. D., de Boer G. J., Eleveld M. A. (2011). Mechanisms controlling the intra-annual mesoscale variability of SST and SPM in the southern north Sea. Continental. Shelf. Res. 31 (6), 594–610. doi: 10.1016/j.csr.2010.12.014
Prins T. C., Desmit X., Baretta-Bekker J. G. (2012). Phytoplankton composition in Dutch coastal waters responds to changes in riverine nutrient loads. J. sea. Res. 73, 49–62. doi: 10.1016/j.seares.2012.06.009
Razaz M., Kawanisi K., Nistor I. (2015). Tide-driven controls on maximum near-bed floc size in a tidal estuary. J. Hydro-environment. Res. 9 (3), 465–471. doi: 10.1016/j.jher.2014.04.001
Rijnsburger S., Flores R. P., Pietrzak J. D., Horner-Devine A. R., Souza A. J. (2018). The influence of tide and wind on the propagation of fronts in a shallow river plume. J. Geophys. Res.: Oceans. 123 (8), 5426–5442. doi: 10.1029/2017JC013422
Rijstenbil J. W. (1987). Phytoplankton composition of stagnant and tidal ecosystems in relation to salinity, nutrients, light and turbulence. Netherlands J. Sea. Res. 21 (2), 113–123. doi: 10.1016/0077-7579(87)90027-5
Roozen F. C. (2005). Transparency of floodplain lakes: a study of plankton and suspended matter along the lower Rhine (Wageningen University and Research).
Schofield O., Moline M., Cahill B., Frazer T., Kahl A., Oliver M., et al. (2013). Phytoplankton productivity in a turbid buoyant coastal plume. Continental. Shelf. Res. 63, S138–S148. doi: 10.1016/j.csr.2013.02.005
Schwarz C., Cox T., Van Engeland T., Van Oevelen D., Van Belzen J., Van de Koppel J., et al. (2017). Field estimates of floc dynamics and settling velocities in a tidal creek with significant along-channel gradients in velocity and SPM. Estuarine. Coast. Shelf. Sci. 197, 221–235. doi: 10.1016/j.ecss.2017.08.041
Shakeel A., Safar Z., Ibanez M., van Paassen L., Chassagne C. (2020). Flocculation of clay suspensions by anionic and cationic polyelectrolytes: A systematic analysis. Minerals 10 (11), 999. doi: 10.3390/min10110999
Shen X., Lee B. J., Fettweis M., Toorman E. A. (2018). A tri-modal flocculation model coupled with TELEMAC for estuarine muds both in the laboratory and in the field. Water Res. 145, 473–486. doi: 10.1016/j.watres.2018.08.062
Shen X., Maa J. P. (2016). A camera and image processing system for floc size distributions of suspended particles. Mar. Geol. 376, 132–146. doi: 10.1016/j.margeo.2016.03.009
Smetacek V. S. (1985). Role of sinking in diatom life-history cycles: ecological, evolutionary and geological significance. Mar. Biol. 84 (3), 239–251. doi: 10.1007/BF00392493
Smith S. J., Friedrichs C. T. (2015). Image processing methods for in situ estimation of cohesive sediment floc size, settling velocity, and density. Limnol. Oceanography.: Methods 13 (5), 250–264. doi: 10.1002/lom3.10022
Spencer K. L., Manning A. J., Droppo I. G., Leppard G. G., Benson T. (2010). Dynamic interactions between cohesive sediment tracers and natural mud. J. Soils Sediments. 10 (7), 1401–1414. doi: 10.1007/s11368-010-0291-6
Sternberg R. W., Berhane I., Ogston A. S. (1999). Measurement of size and settling velocity of suspended aggregates on the northern California continental shelf. Mar. Geol. 154 (1-4), 43–53. doi: 10.1016/S0025-3227(98)00102-9
Stive M. J., De Schipper M. A., Luijendijk A. P., Aarninkhof S. G., van Gelder-Maas C., Van Thiel de Vries J. S., et al. (2013). A new alternative to saving our beaches from sea-level rise: the sand engine. J. Coast. Res. 29 (5), 1001–1008. doi: 10.2112/JCOASTRES-D-13-00070.1
Traykovski P., Latter R. J., Irish J. D. (1999). A laboratory evaluation of the laser in situ scattering and transmissometery instrument using natural sediments. Mar. Geol. 159 (1-4), 355–367. doi: 10.1016/S0025-3227(98)00196-0
Vaezi F., Sanders R. S., Masliyah J. H. (2011). Flocculation kinetics and aggregate structure of kaolinite mixtures in laminar tube flow. J. Colloid. Interface Sci. 355 (1), 96–105. doi: 10.1016/j.jcis.2010.11.068
Van de Meent D. (1982). Particulate organic matter in the river Rhine delta: Its role in trace metal scavenging. Netherlands.
van der Hout C. M., Witbaard R., Duineveld G., Groot L., Bergman M. (2012). “Variability of suspended particulate matter composition at egmond, the Netherlands,” in Particles in Europe, ICM, Barcelona, Spain: Royal Netherlands Institute for Sea Research (NIOZ) Vol. 17. 1.
van Leussen W. (1999). The variability of settling velocities of suspended fine-grained sediment in the ems estuary. J. sea. Res. 41 (1-2), 109–118. doi: 10.1016/S1385-1101(98)00046-X
Van Leussen W., Cornelisse J. M. (1993). The determination of the sizes and settling velocities of estuarine flocs by an underwater video system. Netherlands J. Sea. Res. 31 (3), 231–241. doi: 10.1016/0077-7579(93)90024-M
Keywords: Flocculation, SPM, ROFI, aggregation, algae, settling velocity, density
Citation: Safar Z, Chassagne C, Rijnsburger S, Sanz MI, Manning AJ, Souza AJ, van Kessel T, Horner-Devine A, Flores R, McKeon M and Pietrzak JD (2022) Characterization and classification of estuarine suspended particles based on their inorganic/organic matter composition. Front. Mar. Sci. 9:896163. doi: 10.3389/fmars.2022.896163
Received: 14 March 2022; Accepted: 29 June 2022;
Published: 10 August 2022.
Edited by:
Alexander Yankovsky, University of South Carolina, United StatesReviewed by:
Steven Figueroa, Chungnam National University, South KoreaEwa Szymczak, University of Gdansk, Poland
Copyright © 2022 Safar, Chassagne, Rijnsburger, Sanz, Manning, Souza, van Kessel, Horner-Devine, Flores, McKeon and Pietrzak. This is an open-access article distributed under the terms of the Creative Commons Attribution License (CC BY). The use, distribution or reproduction in other forums is permitted, provided the original author(s) and the copyright owner(s) are credited and that the original publication in this journal is cited, in accordance with accepted academic practice. No use, distribution or reproduction is permitted which does not comply with these terms.
*Correspondence: Zeinab Safar, z.safar@tudelft.nl; Claire Chassagne, C.Chassagne@tudelft.nl