Modeling the Effects of Seasonal Fishing Moratorium on the Ecosystem of the Minjiang Estuary in Southeastern China
 Yefu Kong
 Bin Kang
 Xiaotao Shi2*
- 1Fisheries College, Ocean University of China, Qingdao, China
- 2Hubei International Science and Technology Cooperation Base of Fish Passage, China Three Gorges University, Yichang, China
China’s marine fisheries have made a huge contribution to the world’s food supply at the expense of wild resources collapse by overfishing. Accordingly, the government has introduced a series of measures represented by seasonal fishing moratorium to achieve sustainable fisheries. To evaluate the impact of the seasonal fishing moratorium on the ecosystem of the Minjiang Estuary in southeastern China, three ecosystem models, one in 2006, one in 2016 after 10 years seasonal fishing moratorium, and one in 2016 simulated under the scenario without a fishing moratorium, were constructed by Ecopath with Ecosim. Based on the 2016 model, the status of the Minjiang Estuary ecosystem after 50 years was simulated under four scenarios of different combinations of fishing pressure and durations of the fishing moratorium. The results showed that in the 2016 model, parameters as total ecosystem flow, mean fishing trophic level, and Finn’s index were 9,235.407 t km−2 year−1, 2.94, and 0.920, respectively, all significantly higher than those extracted from the 2016 simulated model, suggesting the effectiveness of the seasonal fishing moratorium. Under scenario analysis, extending the fishing moratorium by 3 months and reducing fishing pressure by 50% showed synergistic effects to achieve a better result than the current fishing moratorium strategy.
1 Introduction
Estuaries are the main places for material exchange between the inland and the ocean waters (Pritchard, 1967), supporting high productivity in the world (Costanza et al., 1997) and subsequently suffering from significant destructions by human activities (Lotze et al., 2006). The Minjiang Estuary is located in Fujian Province in southeastern China, belonging to the subtropical marine monsoon climate zone and is one of the typical coastal ecosystems. This area is affected by the complex hydrological conditions including the coastal waters of Fujian and Zhejiang Provinces, the Taiwan warm current, and the Kuroshio (Sun, 2006), as well as rich annual runoff 620 kmc into the estuary (Cheng and Zhao, 1985), which brings abundant baits to maintain important commercial fisheries. The main economic fishes include bombay duck Harpadon nehereus, hairtail Trichiurus lepturus, silver pomfret Pampus argenteus, Muraenesox cinereus, etc. (Huang et al., 2010; Kang et al., 2018). Due to the accumulation of land-based pollutants, excessive reclamation, and destruction of vegetation, the deteriorating environmental conditions have an increasing intense impact on Minjiang estuarine ecosystem (Yuan et al., 2001; Gao et al., 2018; Cheng et al., 2020). Additionally, the estuary had undergone the high fishing pressure due to successive fishing efforts, causing the status of some species varying from fully exploited to overfished (Huang et al., 2010; Zhang et al., 2010; Wang et al., 2020).
Concerning the dramatic impacts of overfishing, the government has implemented the summer fishing moratorium in the marine water in China since the 1990s. According to the habitat conditions and species spawning times, the beginning and duration of fishing moratorium varied with different areas. In the Minjiang Estuary, the fishing moratorium is from June 1 to August 1 every year (Lu and Zhao, 2015). Without any fishing activities, the biomass of fish stocks can be certainly recovered (Myers and Worm, 2005), but the speed of recovery was supposed to be related to the population productivity and extent of stocks recession (Safina et al., 2005). For example, many stocks show little sign of recovery for long periods, suggesting that fish stocks may decline to levels that impede their recovery (Hutchings, 2000; Hutchings and Reynolds, 2004). Studies on seasonal fishing moratorium in the Minjiang Estuary mostly focused on single population resources or community composition changes (Feng et al., 2009; Lin and Cheng, 2009; Liu et al., 2017), and studies at the scale of the ecosystem, including the inner structure of the ecosystem and the dynamics of the ecosystem under human intervention, are urgently needed for a reasonable and effective management.
Ecopath with Ecopath (EwE), proposed by Polovina (1984a; 1984b) and further developed by Christensen and Pauly (1992), was designed to construct, parameterize, and analyze mass-balanced nutrient models for aquatic and terrestrial ecosystems (Christensen et al., 2008). Ecopath describes the energy flow between the various key functional groups of the ecosystem, and the Ecosim module reflects how ecosystems respond to changes in fishing methods (Walters et al., 1997; Walters et al., 2000; Christensen et al., 2008). Ecopath and Ecosim have gained wide acceptance worldwide to study the nutrient composition of estuarine ecosystems, the effects of fisheries production and environment on ecosystems, and the management and protection strategies (Patrício et al., 2009; Mutsert et al., 2012; Lercari et al., 2015; Zeng et al., 2019; Zhai and Pauly, 2020; Zhang et al., 2020; Sinnickson et al., 2021; Sreekanth et al., 2021; Srithong et al., 2021).
In this study, we described the inner composition and health status of the Minjiang Estuary by constructing the ecosystem model in 2006. Furthermore, we also constructed the ture and simulated model (i.e., without a fishing moratorium) in 2016, respectively, to assess the effects of the seasonal fishing ban policy. Finally, the status of the ecosystem after 50 years since 2016 was simulated under four scenarios of different combinations of fishing pressure and durations of the fishing moratorium to explore better management strategies in the future.
2 Materials and Methods
2.1 Study Area
The Minjiang River is the largest in Southeastern China, with a total length of 2,872 km and a watershed area of 60,992 km2. The Minjiang Estuary (Figure 1) covers an area of 400.97 km2, from the North-South Harbor Convergence in the west, Huangqi Peninsula in the north, and Changlezhang Bay in the south. The coastline of the estuary is 181.1 km, water depth mostly within 10 m, and the island area at 75.02 km2. Marine fishing, mussel clam aquaculture, and laver aquaculture are the traditional fisheries in this area, which supported the livelihood of residents of six villages (Liu and Li, 2008).
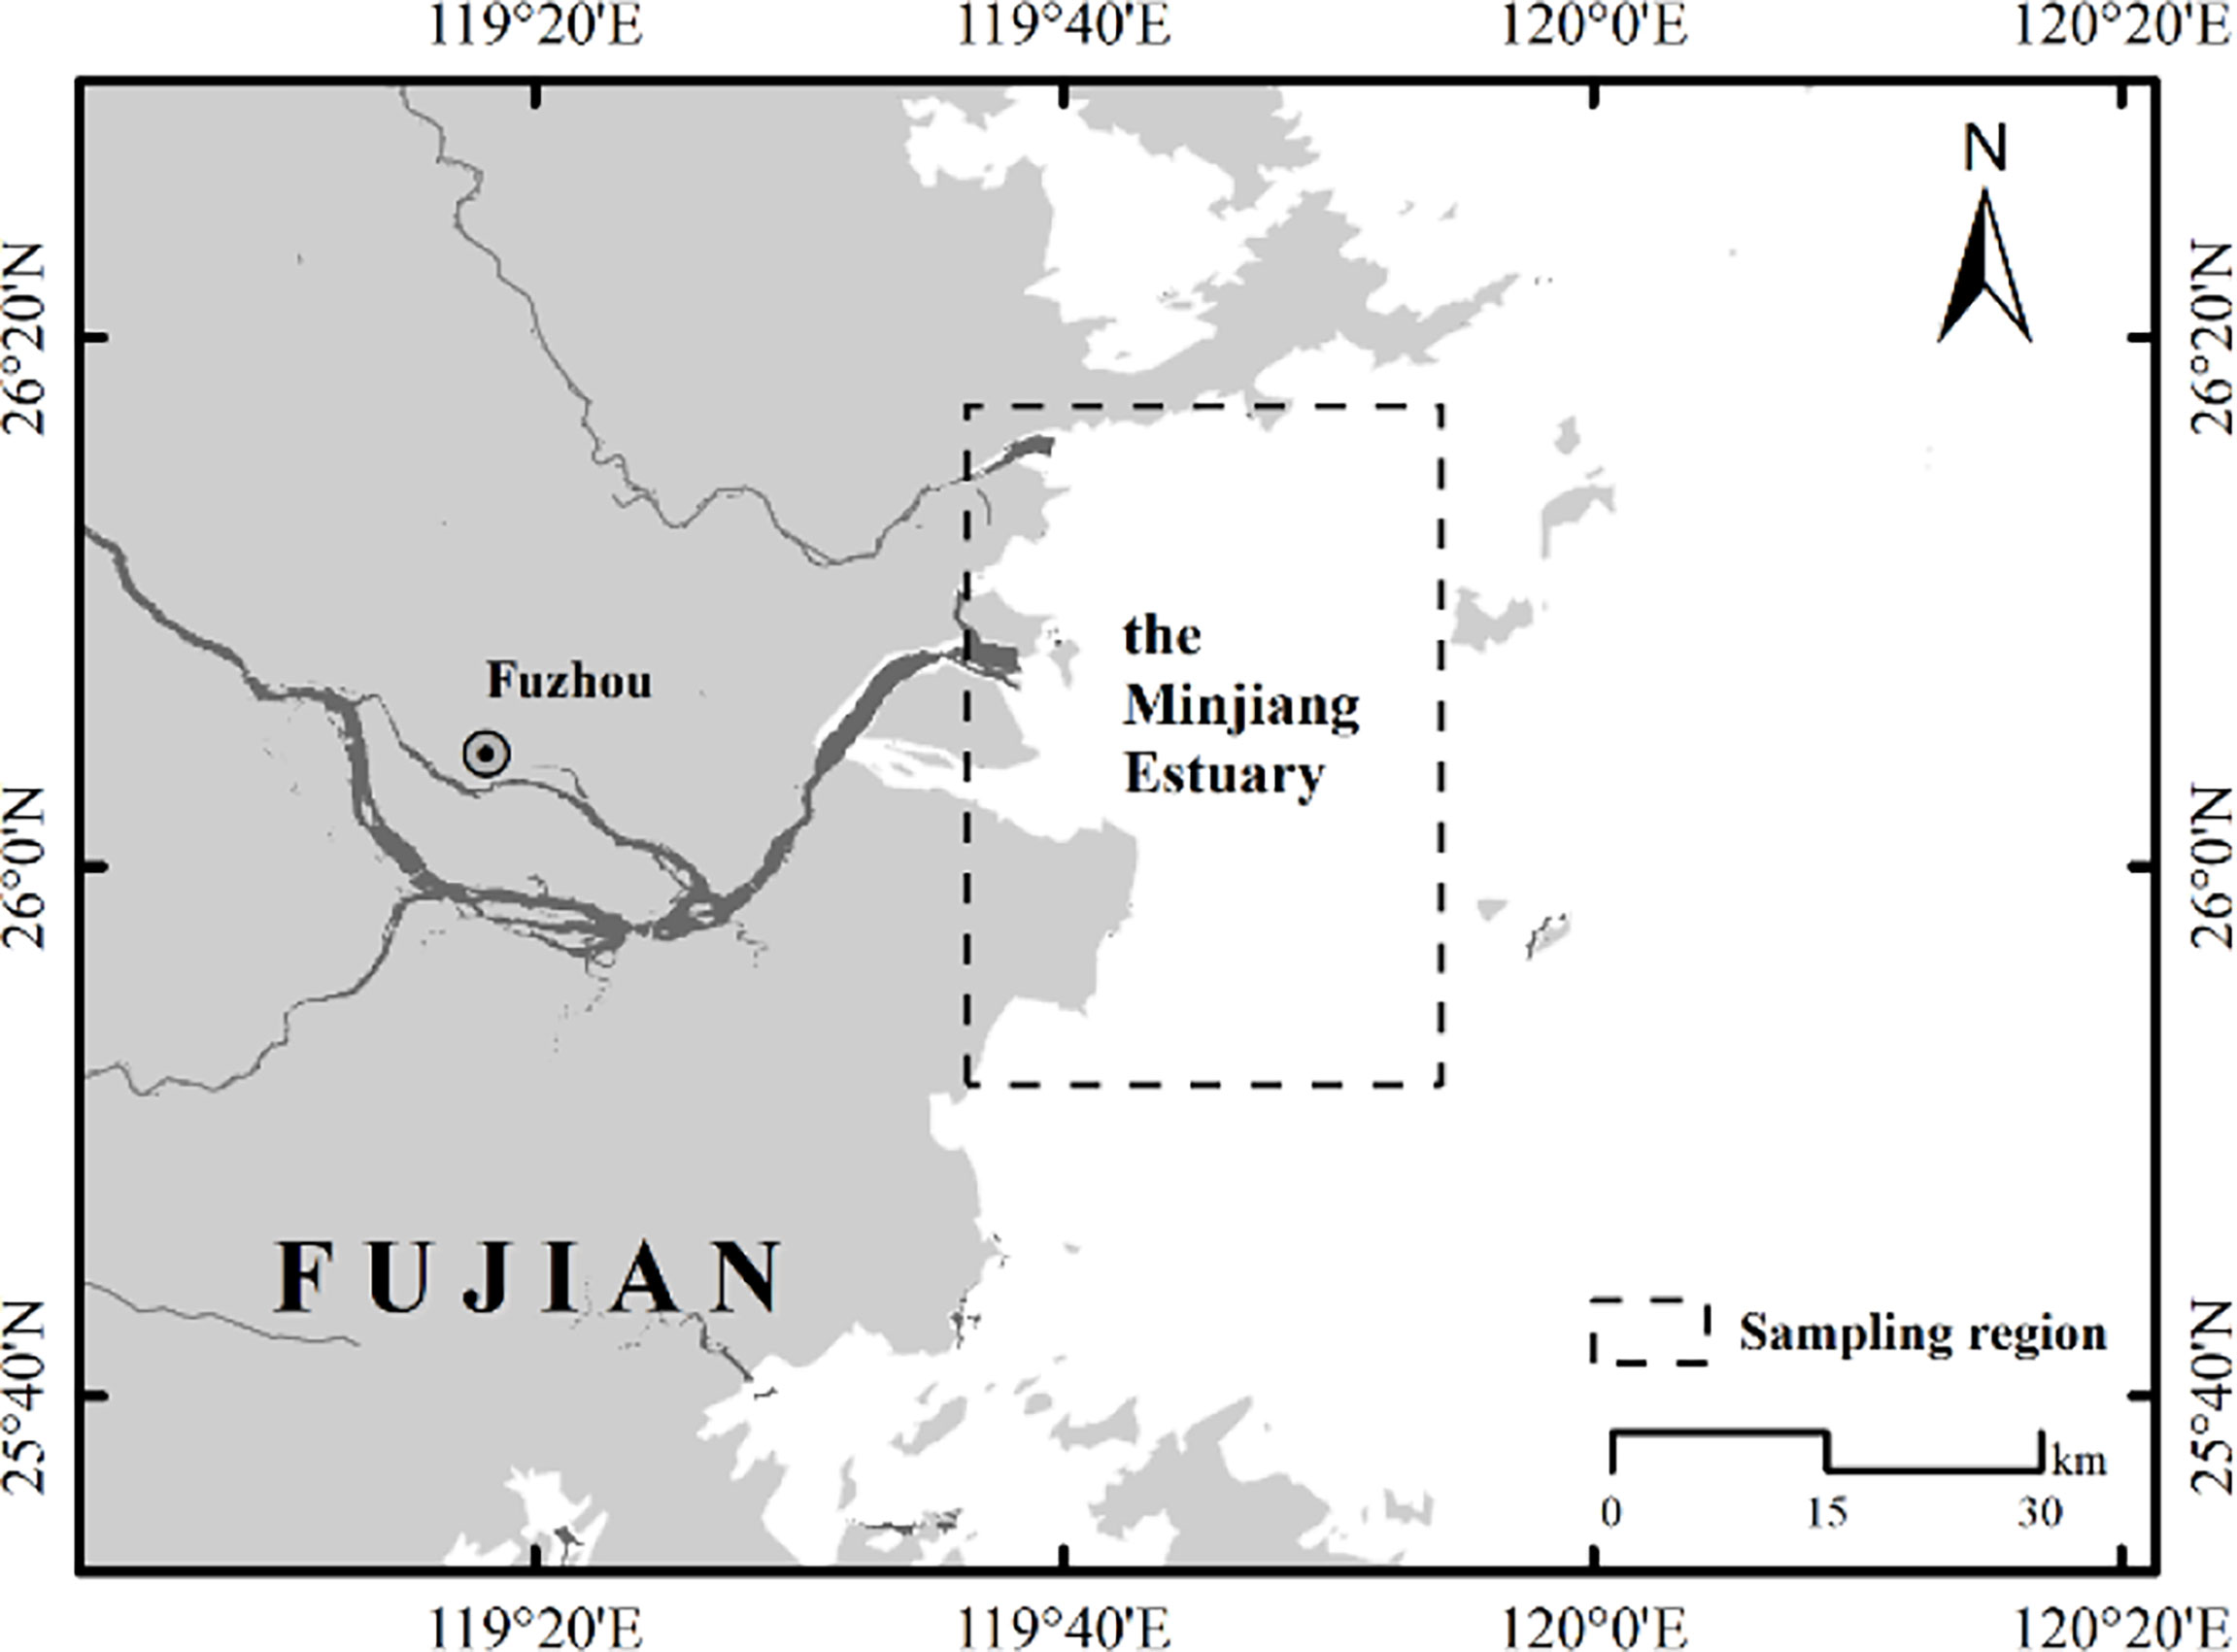
Figure 1 The sketch map of the Minjiang Estuary.
2.2 Data Sources
Data used for constructing models were from two comprehensive surveys in the Minjiang Estuary in four seasons each in 2006 and 2016, ranging from 25°50′ to 26°18′ N and 120°39′ to 121°53′ E, by single bottom trawling. In 2006, 192 species were collected, including 129 fishes, 11 cephalopods, 23 shrimps, and 29 crabs. A total of 217 species were collected in 2016, including 140 fishes, 11 cephalopods, 39 shrimps, and 27 crabs (Kang, 2018).
2.3 Modeling by Ecopath With Ecosim
2.3.1 Functional Group Division
The concept map of the Minjiang Estuary ecosystem is shown in Figure 2, including 21 functional groups: (1) shark, (2) bombay duck, (3) hairtail, (4) pike eel, (5) butterfish, (6) pelagic fishes feeding on plankton, (7) pelagic fishes feeding on mixed organisms, (8) demersal fishes feeding on plankton, (9) demersal fishes feeding on nekton, (10) demersal fishes feeding on mixed organisms, (11) crabs, (12) stomatopods, (13) shrimp, (14) cephalopod, (15) mollusca, (16) other benthic organisms, (17) jellyfish, (18) zooplankton, (19) macroalgae, (20) phytoplankton, and (21) detritus. Among them, dominant species as bombay duck, hairtail, pike eel, and butterfish, and key species shark were divided into individual functional groups (Kang, 2018).
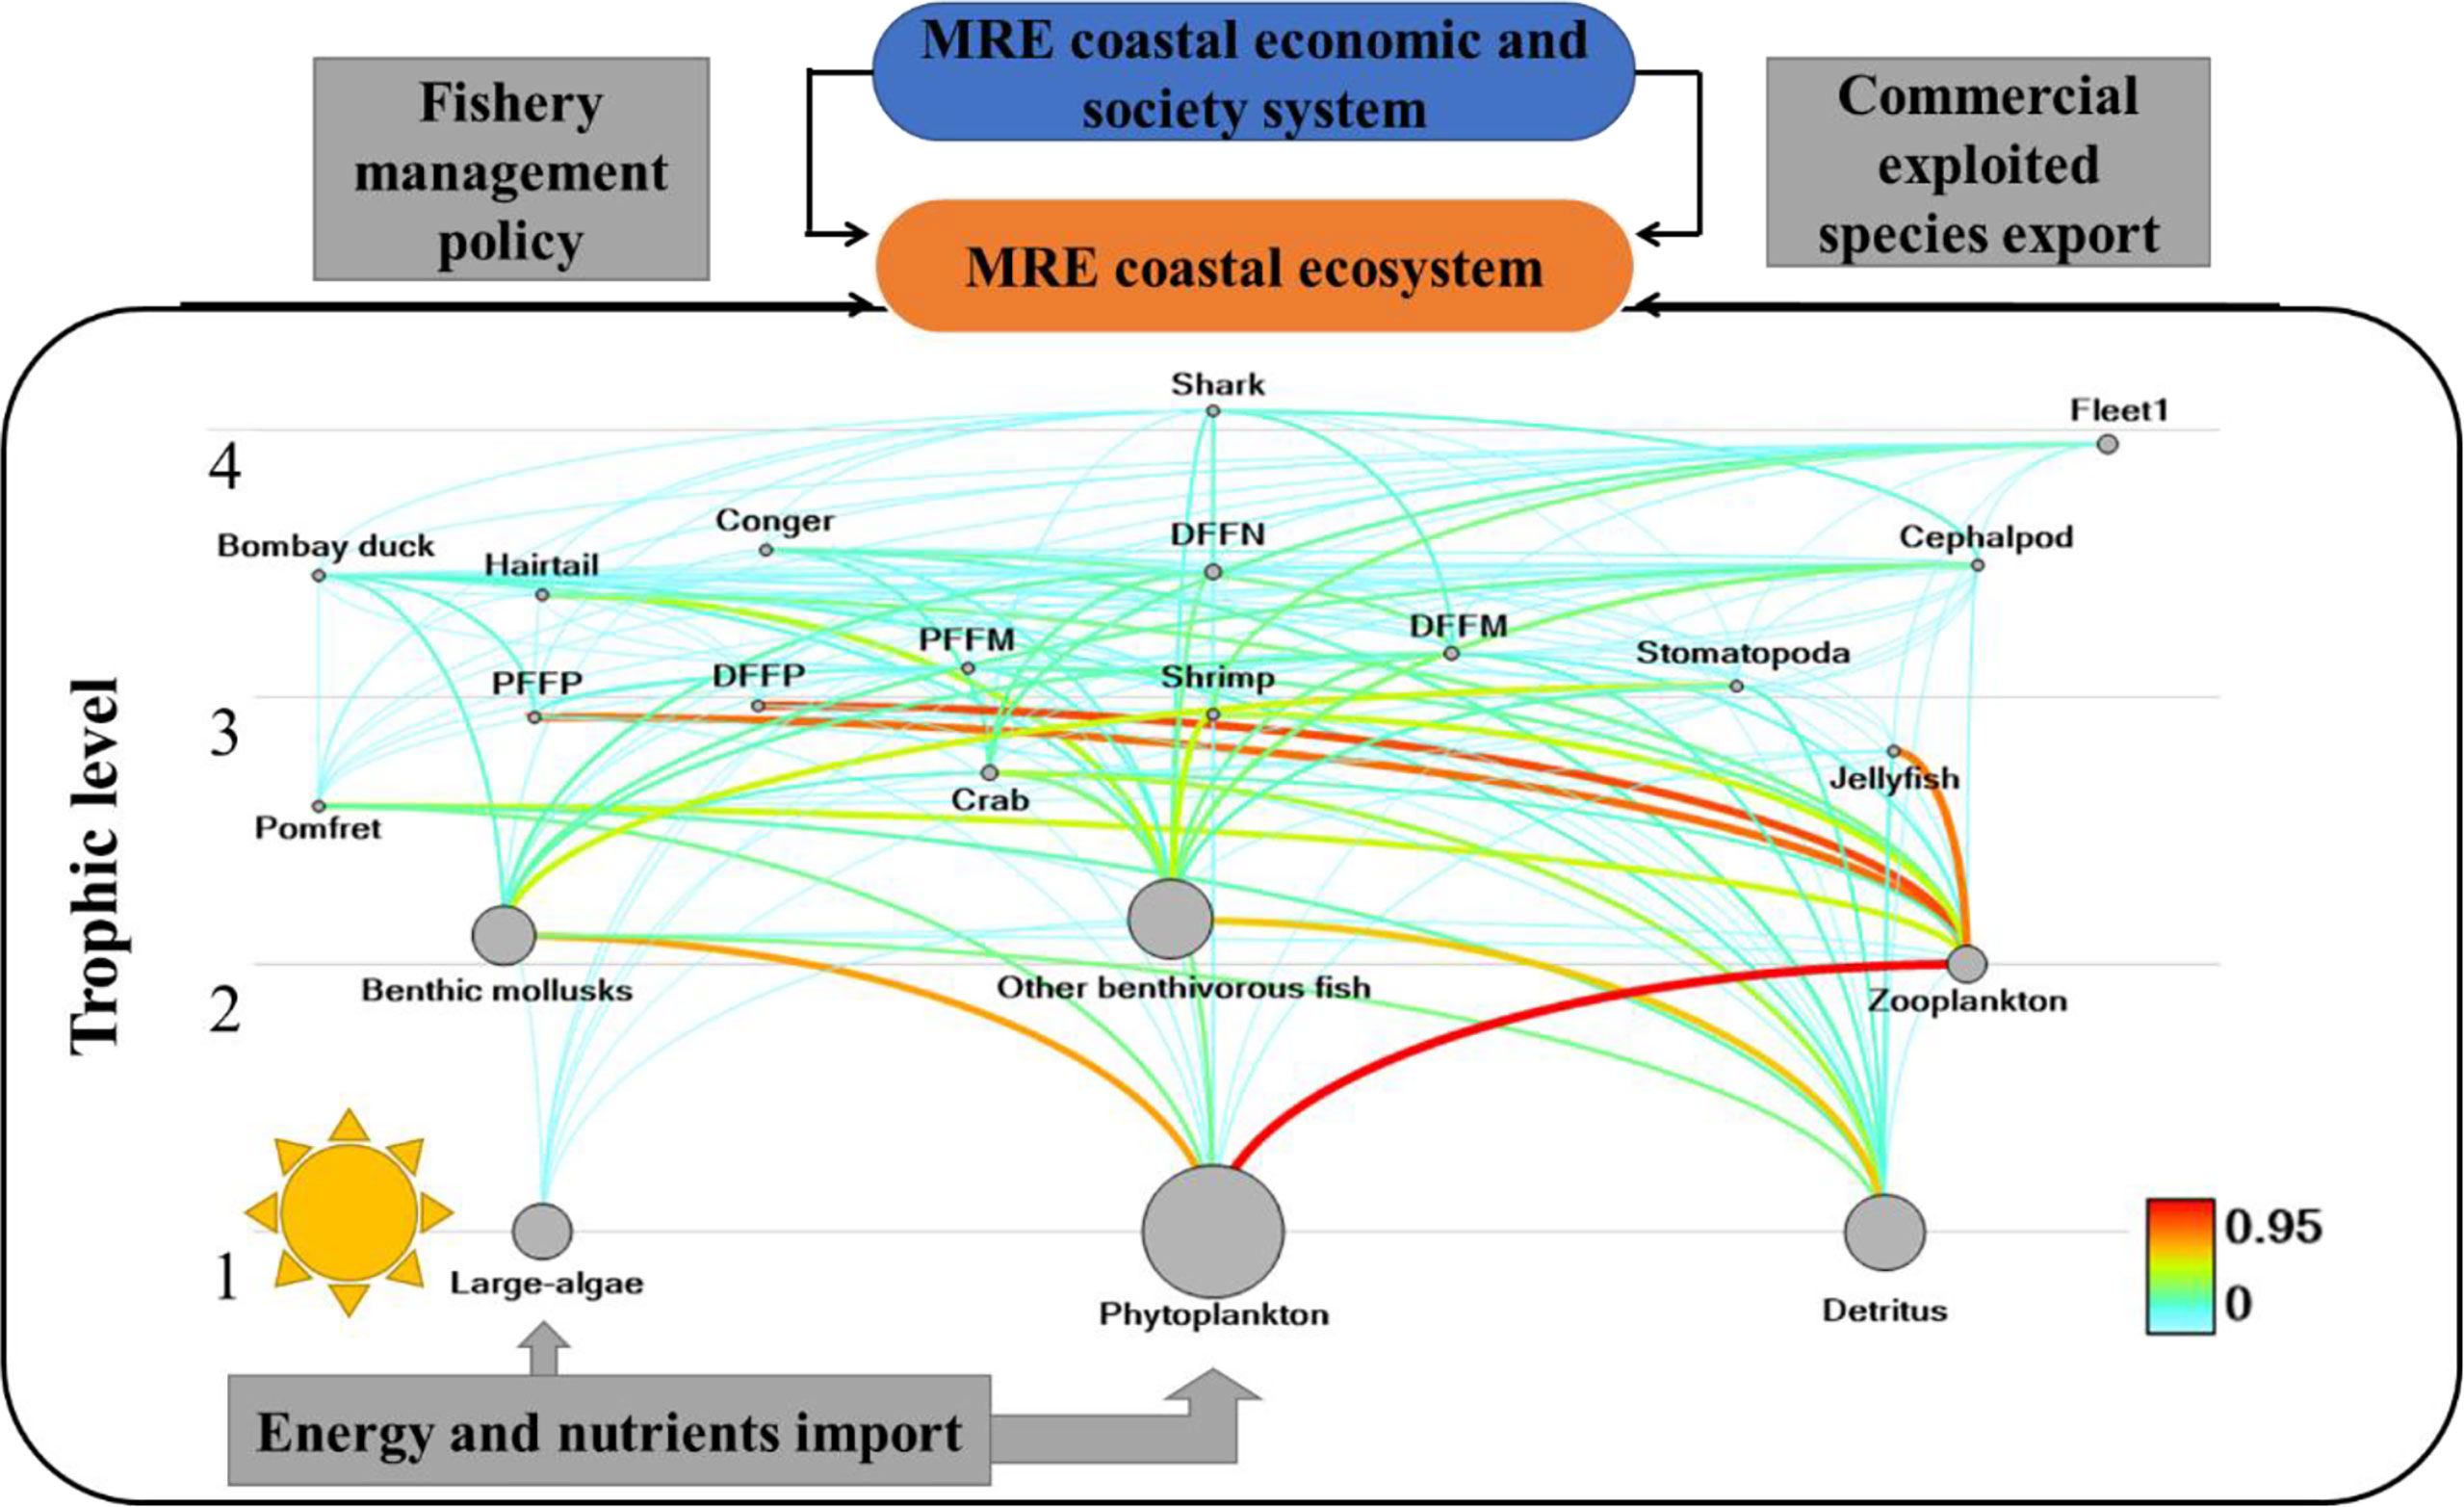
Figure 2 Concept map of energy network of the Minjiang Estuary ecosystem. MRE, Minjiang estuary; PFFP, pelagic fish feeding on plankton; PFFM, pelagic fish feeding on mixed biophagy; DFFP, demersal fish feeding on plankton; DFFN, demersal fish feeding on nekton; DFFM, demersal fish feeding on mixed biophagy.
2.3.2 Ecopath Parameterization
1) Estimation of the ecosystem parameters. In the Ecopath model, the energy flow was expressed with wet weight (t km−2). The methods of determining biomass (B) of each functional group were different: fishery resources were recorded from trawler catch data; phytoplankton biomass was converted from chlorophyll-a concentration, with the ratio of chlorophyll-a to carbon content at 1:50 and the ratio of dry carbon content to wet weight at 1:10 (Yang et al., 2016); macroalgae biomass was derived from Li et al. (2017); and organic detritus biomass was calculated by an empirical formula of Pauly et al. (1993). At the equilibrium of the ecosystem, P/B (the ratio of fish production to biomass) of fish was replaced by the total instantaneous mortality rate (Z), and P/B values of other aquatic organisms were derived from the empirical formula of Pauly (1980). The ratio of consumption to biomass (Q/B) in fish was estimated by Palomares and Pauly (1998) or cited data reported in the adjacent waters in other functional groups (Christensen et al., 2008; Yang et al., 2016). Ecotrophic efficiency, one of the important parameters in evaluating the Ecopath model, was difficult to obtain directly and generally calculated by the model, except for jellyfish due to lack of biomass data and followed reports from adjacent waters (Lin et al., 2009). The statements of data sources, data credibility, and overall model credibility were tested by the Pedigree index, as 0.527 in both 2006 and 2016.
2) Matrix of feeding habit. The diet composition mainly expressed the internal relations of nutrient intake among various functional groups in the ecosystem. For the functional group composed of a single species, food composition could be directly measured by gastric content method (Christensen et al., 2008; Kang, 2018); for the functional group composed of multiple species, food composition was determined by weighting the proportion of biomass of each food species (Song, 2004; Kang, 2018); and for the functional groups without food information, food composition was established by FishBase (Froese and Pauly, 2021).
3) Landings. The landings data in 2006–2016 was from the Fuzhou Statistical Yearbook (FCBS (Fuzhou City Bureau of Statistics), 2007–2017) and China Fishery Statistical Yearbook (MARA (Ministry of Agriculture and Rural Affairs), 2007–2017).
4) Model balancing. The basic parameters mentioned above in the model should be adjusted to make the EE of each functional group meet the requirements of 0 < EE < 1 (Darwall et al., 2010). As a constraint of the model, the feeding efficiency (P/Q) of the functional group was also requested to vary from 0.1 to 0.3 (Darwall et al., 2010). First, we need to check whether the EE values of all function groups were less than 1, as the model assumes that the consumption of all function groups cannot be higher than their output (Christensen et al., 2008). Second, we also need to check the total food conversion efficiency (GE) of each functional group, which should be in 0.1 to 0.3 (Darwall et al., 2010). Third, we have to adjust the ratio of feeding parameters of each functional group to reduce EE nearly to 0.95 according to the nutrition level of a functional group from high to low until a balance of the whole ecosystem can be achieved.
5) Sensitive analysis. There was a logarithmic relationship between the change rate of input data biomass of different functional groups and the change rate of estimated data ecological transfer efficiency (EE) in both 2006 and 2016 models. When the input data biomass changed between −0.500 and 0.500, the change rate value of the estimated parameter ecological transfer efficiency (EE) ranged from −0.169 to 0.509 in the 2006 model and from −0.144 to 0.432 in the 2016 Ecopath model.
6) Ecosystem parameters. Ecosystem parameters were used to characterize the maturity as well as the development of the ecosystem (Table 1). By comparing the characteristic indicators in different periods, the impacts of the different strategies on the ecosystem were evaluated.
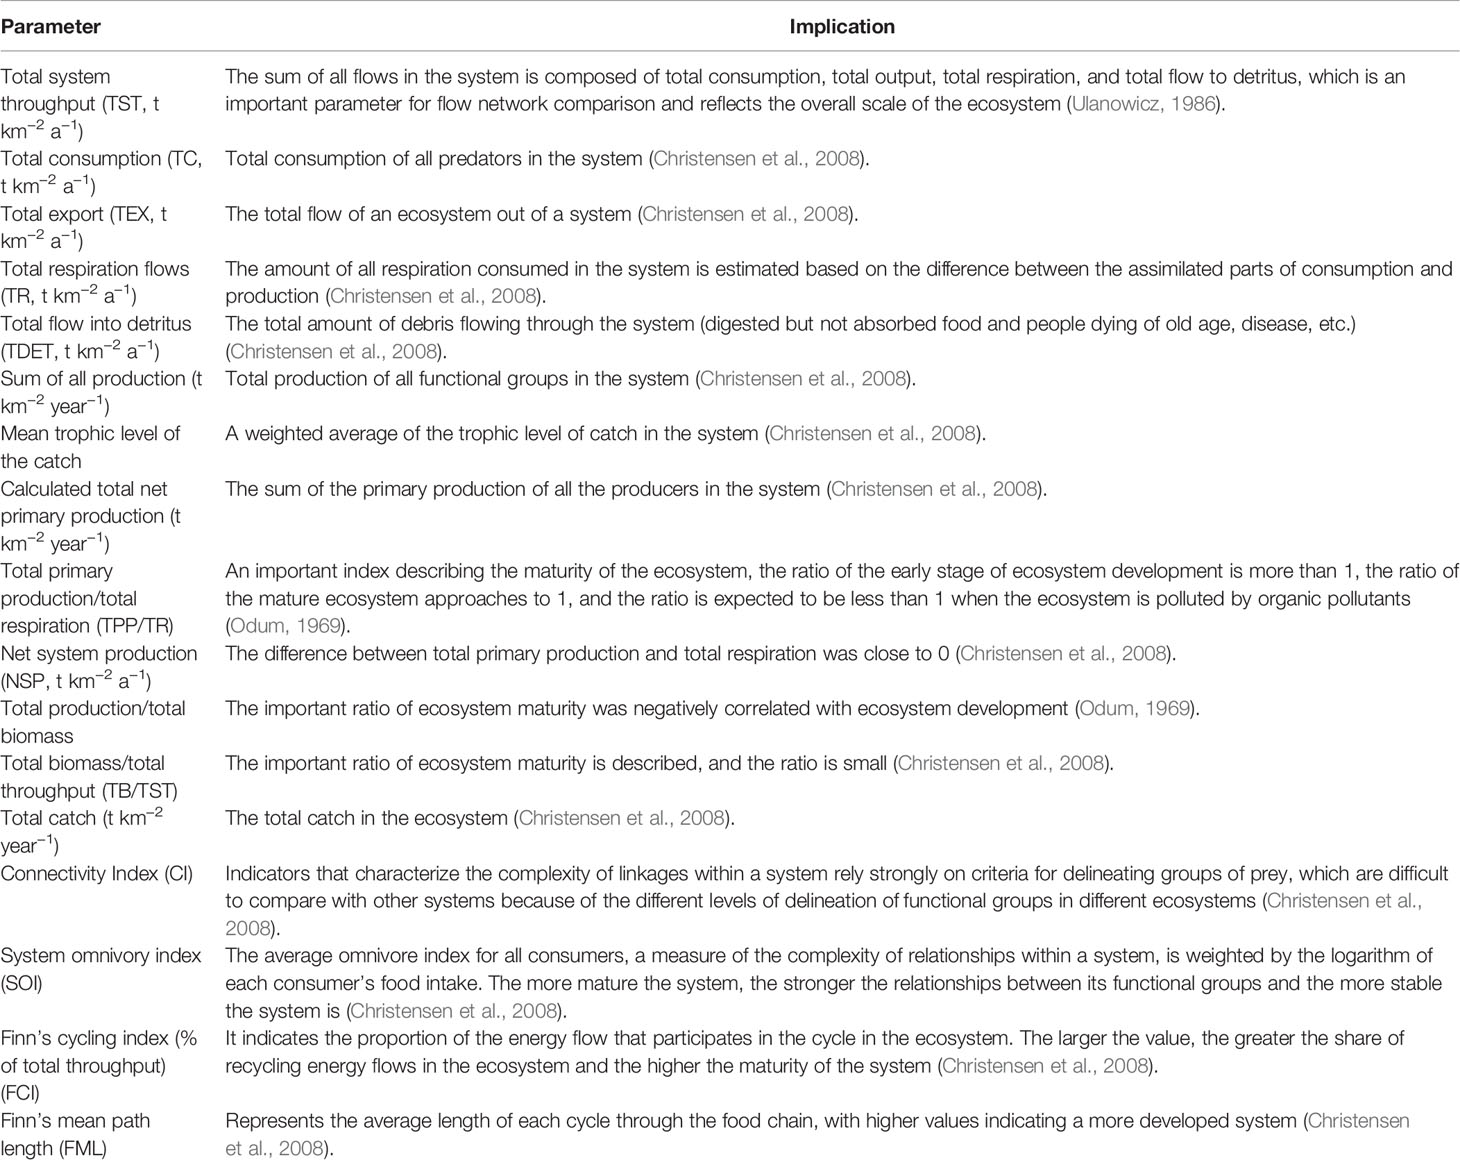
Table 1 Ecopath model parameters and their implication.
2.3.3 Ecosim Parameterization
Ecosim, a temporal dynamic module, could be used to simulate the ecosystem under different scenarios (Walters et al., 2000). Except for the vulnerability index (v), all parameters were assumed by the model-defined default values, including the basic ratio of nutrients as 1.0, minimum feeding time as 0.1, maximum relative feeding time as 2.00, feeding time adjustment rate as 0.5, and density-dependent catchability as 1.0. Ecosim simulation was sensitive to the vulnerability index, which was generally determined as the default setting of mixed control at v = 2. A low v-value indicated bottom-up control was dominant, while a high v-value indicated top-down control was dominant (Christensen et al., 2008). Another way to determine v was by time series data fitting; the more time-series data are used, the more reliable and reasonable the v-value is. In this study, landing-related time series data and CPUE data for six functional groups from 2006 to 2016 were performed in Ecosim to determine v-value. By adjusting the v-value, the best-fitted values of the time series data of six functional groups were determined (Figure 3), resulting in a reduction of the total sum-of-square error (SS) from 20.39 to 16.26.
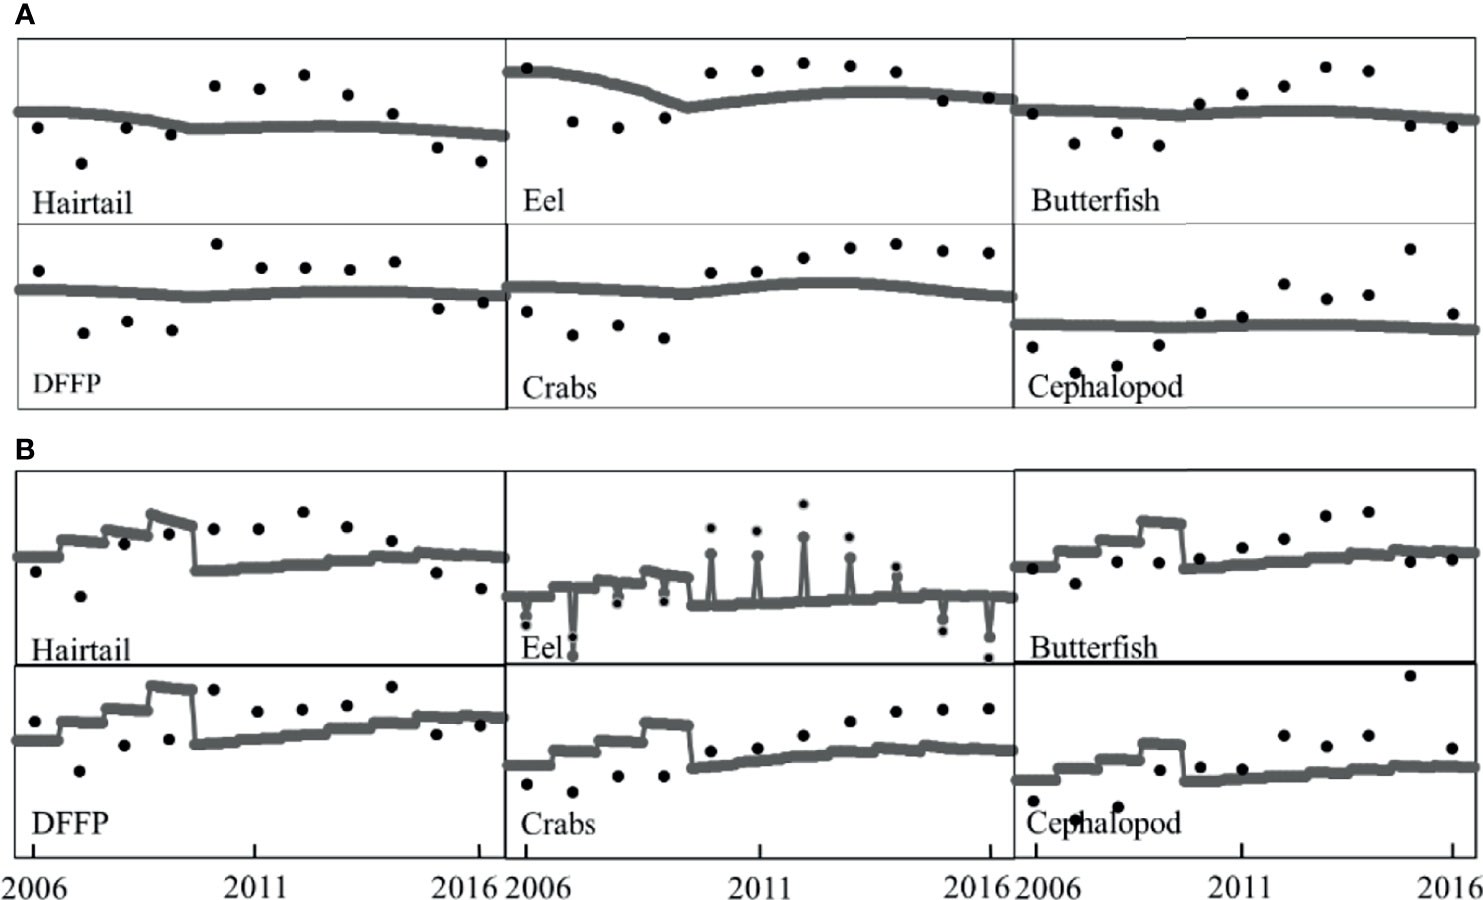
Figure 3 The best-fitted values of time series data from the start year 2006 to the end year 2016 in CPUE (A) and landings (B) of 6 functional groups for dynamic simulation.
2.4 Effects Assessments of Fishing Moratorium and Fisheries Regulation
2.4.1 Evaluation of the Effect of a 10-Year Fishing Moratorium
Based on the survey data in 2006 and 2016, two Ecopath models of the Minjiang Estuary were constructed. Based on the 2006 model, assuming no seasonal fishing closure in the Minjiang Estuary since 2006, parameters in 2016 were predicted using dynamic simulation to construct the 2016 simulated model. The differences of the 2016 simulated model from the 2016 model were regarded as the impacts of the seasonal fishing moratorium on the Minjiang Estuary ecosystem.
2.4.2 Simulations of Different Fisheries Regulations
Based on the 2016 Ecopath model, the status of the Minjiang Estuary ecosystem in 2066 (after a 50-year period) was simulated under four strategies characterized by the combinations of fishing intensity and duration of the fishing moratorium. (1) Scenario 1 (S1): keeping the current fishing moratorium duration. (2) Scenario 2 (S2): combination of S1 and 50% reduction in fishing effort for all fishing gears. (3) Scenario 3 (S3): extending fishing moratorium duration (June 16 to August 16 revised to May 1 to September 30). (4) Scenario 4 (S4): combination of S3 and 50% reduction in fishing effort for all fishing gears. To select the best regulation, indicators including biomass estimation of 21 functional groups, the mean trophic level of the landings, and the changes in biomass of high trophic level species (TL≥3) and low trophic level species (2<TL<3) were determined to reflect ecosystem structure, and model parameters were used to evaluate the maturity of the Minjiang Estuary ecosystem under different scenarios.
3 Results
3.1 Changes in Nutritional Structure of the Minjiang Estuary Ecosystem
The basic inputs and estimated parameters of the 2006, 2016, and 2016 simulated models of the Minjiang Estuary ecosystem are listed in Table 2. The trophic level of the 2016 model ranged from 1 to 4.072, lower than 1–4.112 of the 2006 model. No significant difference in fish mean trophic level between 2006 at 3.26 ± 0.37 and 2016 at 3.27 ± 0.39. The trophic level of cephalopods in 2016 was 3.495, higher than the 3.408 of 2006. Compared with the 2006 model, the trophic level of functional groups such as crabs, shrimps, mollusks, and other benthic organisms in the 2016 model respectively decreased by 8.27%, 1.51%, 2.59%, and 4.87% and the trophic level of stomatopods in the 2016 model increased by 1.50%.
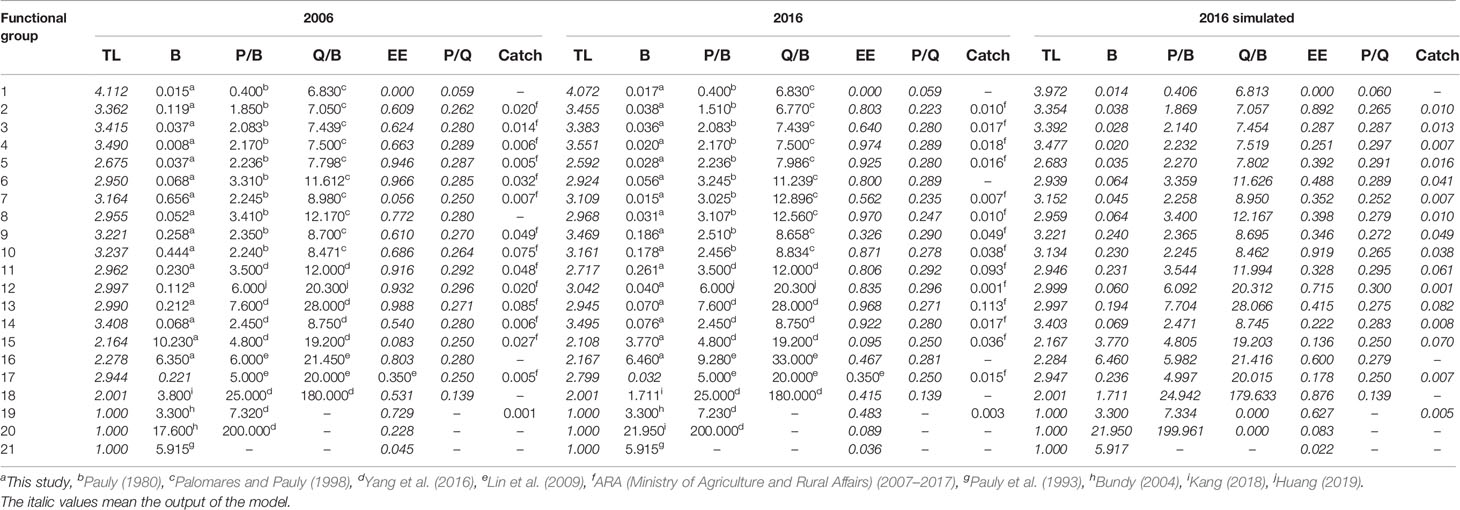
Table 2 Parameters of the 2006 model, 2016 model, and 2016 simulated model of the Minjiang Estuary ecosystem.
Comparing the estimated parameters in the 2016 simulated model and real parameters in the 2016 model (Table 2), the upper limit value of the trophic level in the 2016 simulated model was 3.972, significantly lower than that of the 2016 model. The mean trophic level of fish or cephalopods in 2016 was respectively 3.22 ± 0.34 or 3.403, both lower than the values of the 2016 model. Except for stomatopods that showed a 1.41% decrease, crabs, shrimps, mollusks, and other benthic organisms respectively increased by 8.43%, 1.77%, 2.80%, and 5.40% in trophic level in the 2016 simulated model without a fishing closure policy.
3.2 Characteristic Indicators of the Minjiang Estuary Ecosystem
The summary statistics for describing characteristics of the 2006, 2016, and 2016 simulated models of the Minjiang Estuary ecosystem are shown in Table 3. The total system throughput of the 2016 model was 9,235.407 t km−2 year−1, significantly higher than that of the 2006 model at 7,625.492 t km−2 year−1. The total system consumption and the total respiration in the 2016 model were 606.155 and 360.603 t km−2 year−1, respectively, significantly lower than 1,047.492 and 647.550 t km−2 year−1 in 2006; correspondingly, total system output at 4,053.256 t km−2 year−1 and total flow to detritus at 4,205.845 t km−2 year−1 in 2016 were significantly higher than those in the 2006 model. The mean trophic level of the landings decreased from 3.044 in the 2006 model to 2.947 in the 2016 model. The system connectivity index in 2016 was higher than that in 2006, while the system omnivore index in 2016 was lower than that in 2006. The TPP/TR value of 12.240 in 2016 was much higher than 5.473 in the 2006 model, and the FCI of 0.920 in 2016 was higher than 0.893 in 2006.
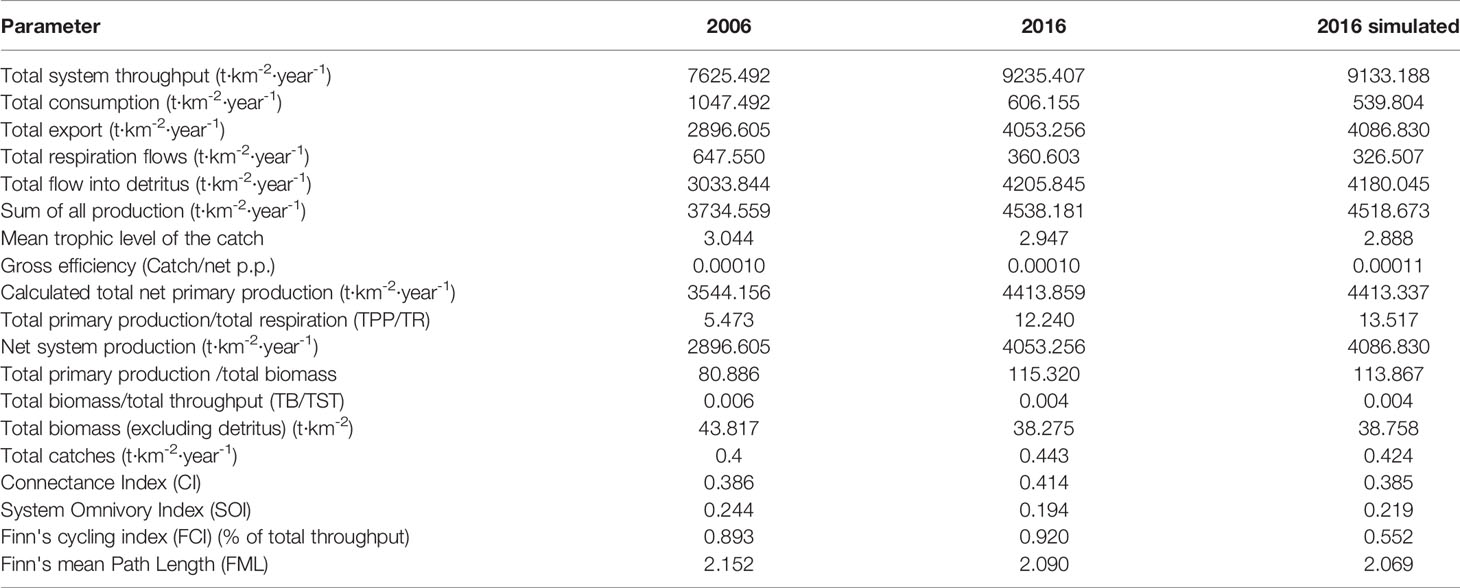
Table 3 Summary of the indices for Minjiang Estuary ecosystem.
Comparing characteristic indicators in the 2016 model and 2016 simulated model, there was no significant difference in total system throughput between the two models. Total system consumption (606.155 t km−2 year−1), total respiration (360.603 t km−2 year−1), and total runoff detritus (4205.845 t km−2 year−1) were respectively 12.3%, 10.4%, and 3.8% higher than those in the 2016 simulated mode. The mean trophic level of the landings in the 2016 model increased by 2% more than the 2016 simulated model without fishing ban. The system connectivity index in the 2016 model was 7.5% higher than the simulated ecosystem. If no fishing moratorium was enforced, TPP/TR decreased by 10.4% and FCI increased by 66.7%.
3.3 Simulations of Different Fisheries Regulations
Based on the 2016 model, four scenario simulations showed similar trends but to varying degrees in species biomass (Figure 4). Under the S1 scenario, keeping current fishing closure policy, the biomass of shark, hairtail, pelagic fishes feeding on mixed organisms, demersal fishes feeding on mixed organisms, and shrimp respectively increased by 28.6%, 16.8%, 17.1%, 4%, and 39.2%, while biomass of butterfish and crab decreased by 13.9% and 13.3%, respectively. Under S2, the 50% reduced fishing pressure expanded the magnitude of biomass recovery, e.g., the biomass of shark and shrimp resources was approximately twice that in 2016 model, and hairtail and pelagic fishes feeding on plankton increased by 28.7% and 29.1% over S1. When the fishing moratorium was extended at S3, some functional groups showed better results of biomass recovery than S1, e.g., the biomass of shark and shrimp resources increased by 46.0% and 30.6%, respectively, followed by 19.2% in pelagic fishes feeding on mixed organisms and18.9% in hairtail. Under the S4 scenario combined with the fishing moratorium extension and fishing pressure reduction, the biomass of shark was 1.80 times of S1, 1.26 times of S2, and 1.58 times of S3; the biomass of shrimp increased by 30% over S1, 2.7% over S2, and 14.1% over S3; and the biomass of hairtail increased by 30% over S1, 6.4% over S2, and 16.1% over S3.
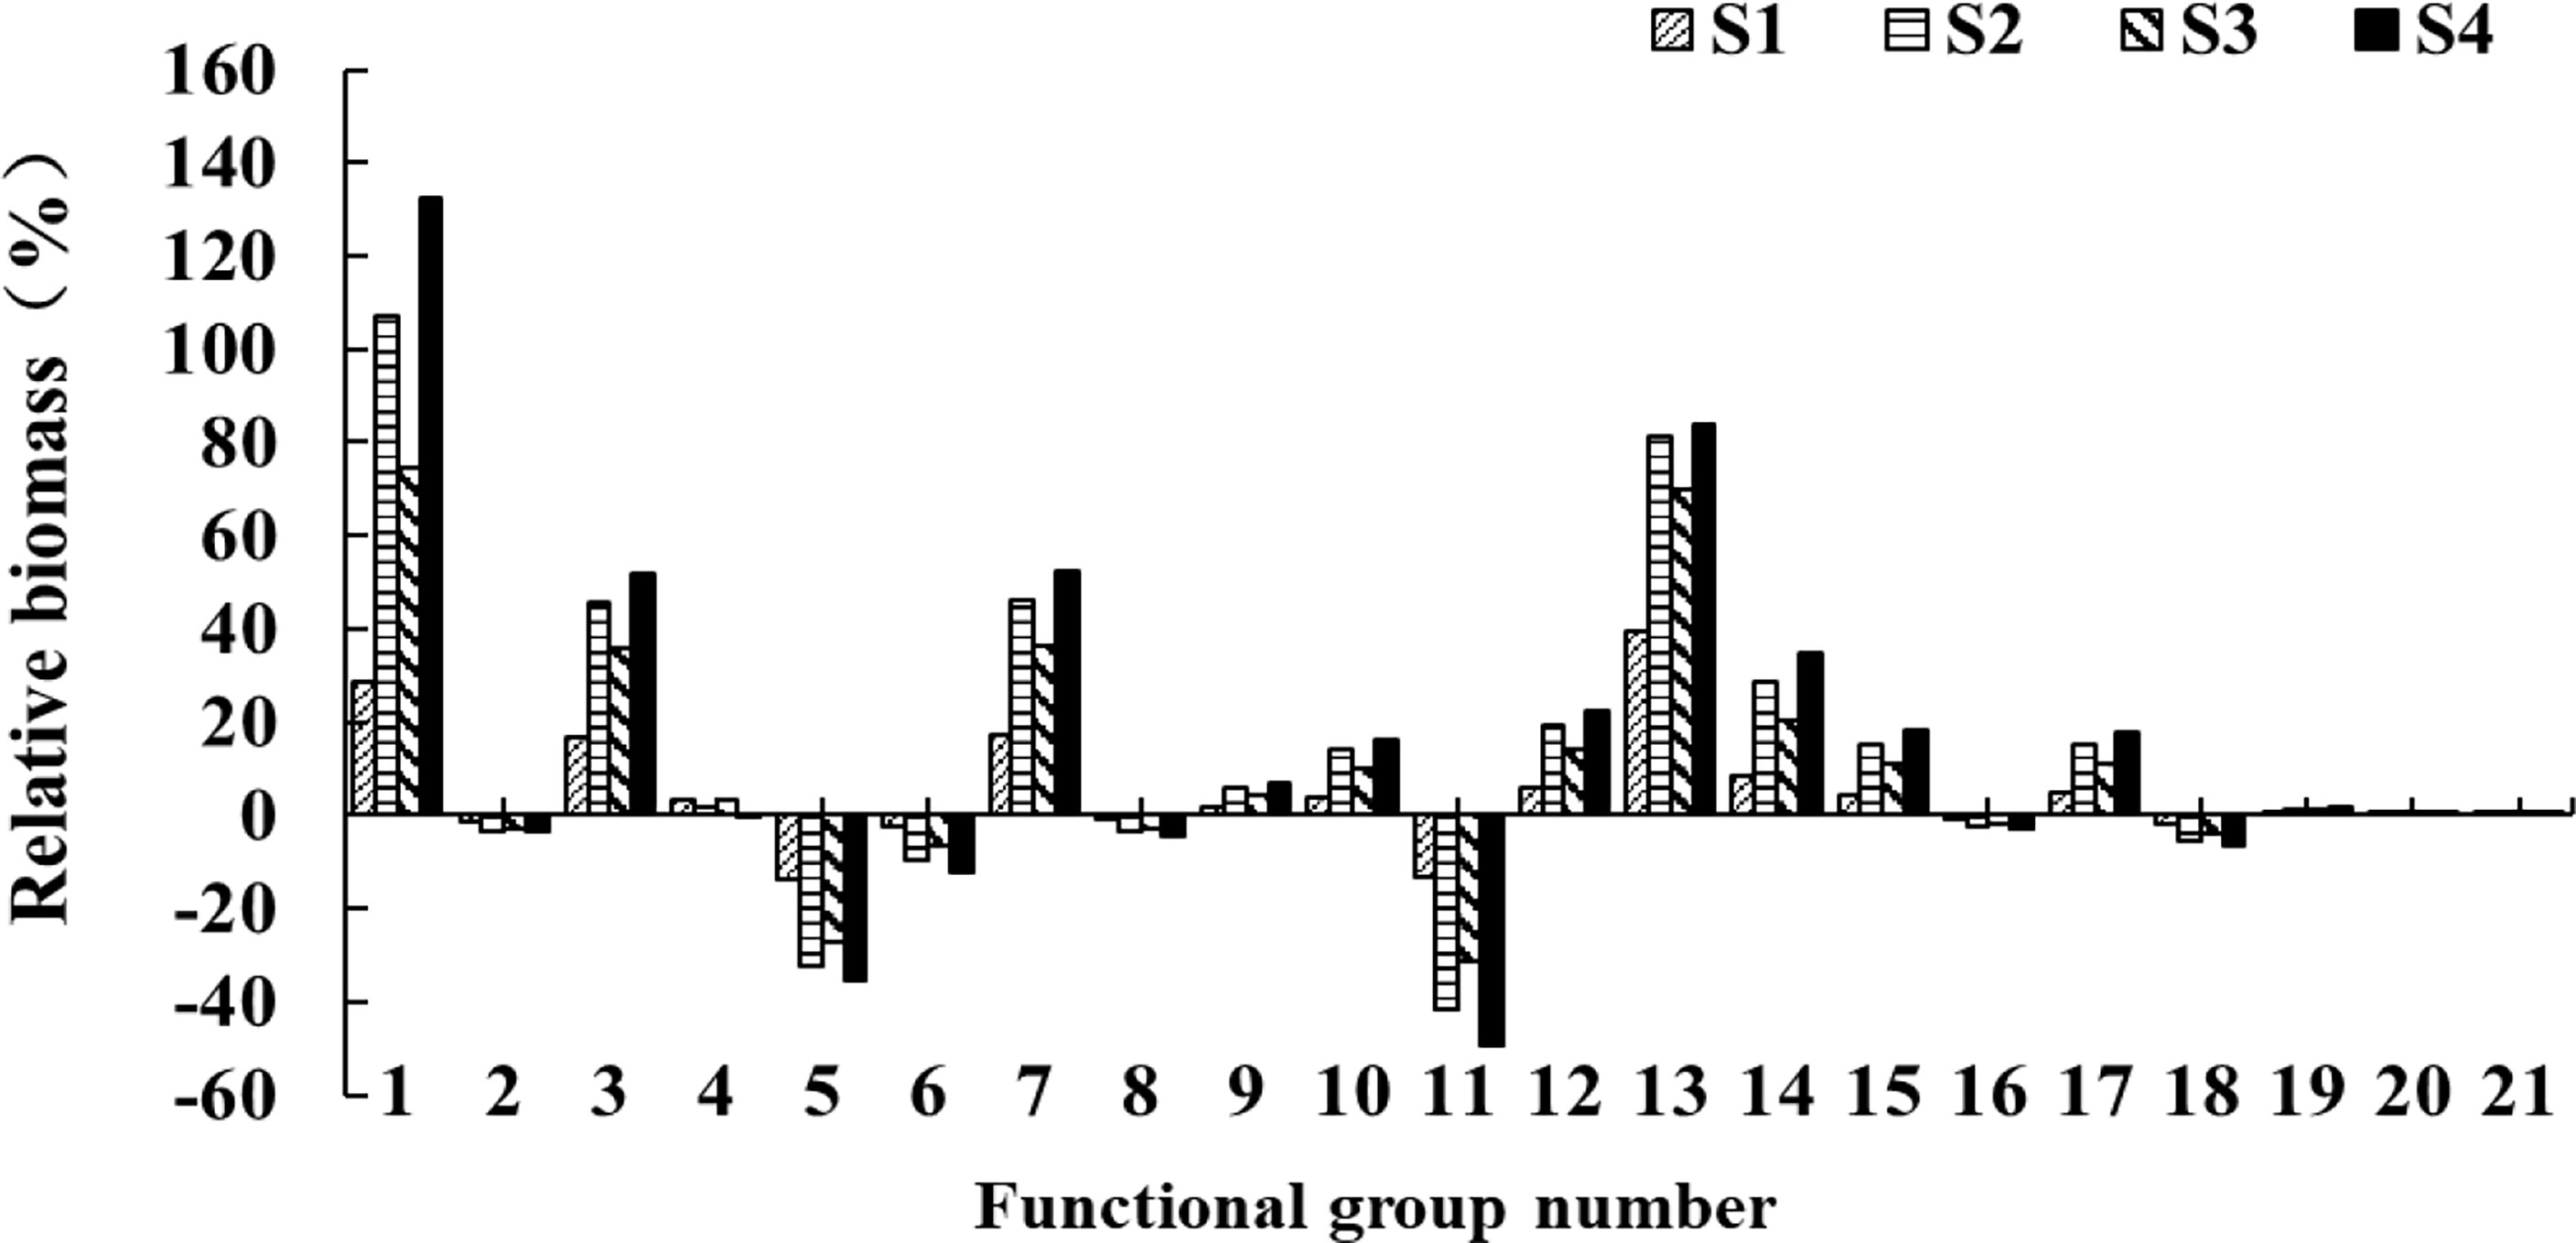
Figure 4 Changes in relative biomass of each functional group after 50 years under four simulated scenarios.
The mean trophic level showed a 2% increase under S4, followed by S2, S3, and S1 (Figure 5A), similar to variations of relative biomass of lower trophic level species (Figure 5B). High trophic level species were sensitive to the fishing regulations, with an increase of 57.4% in biomass under S4, followed by S2 under 47.4% and 34.1% under S3 (Figure 5C).
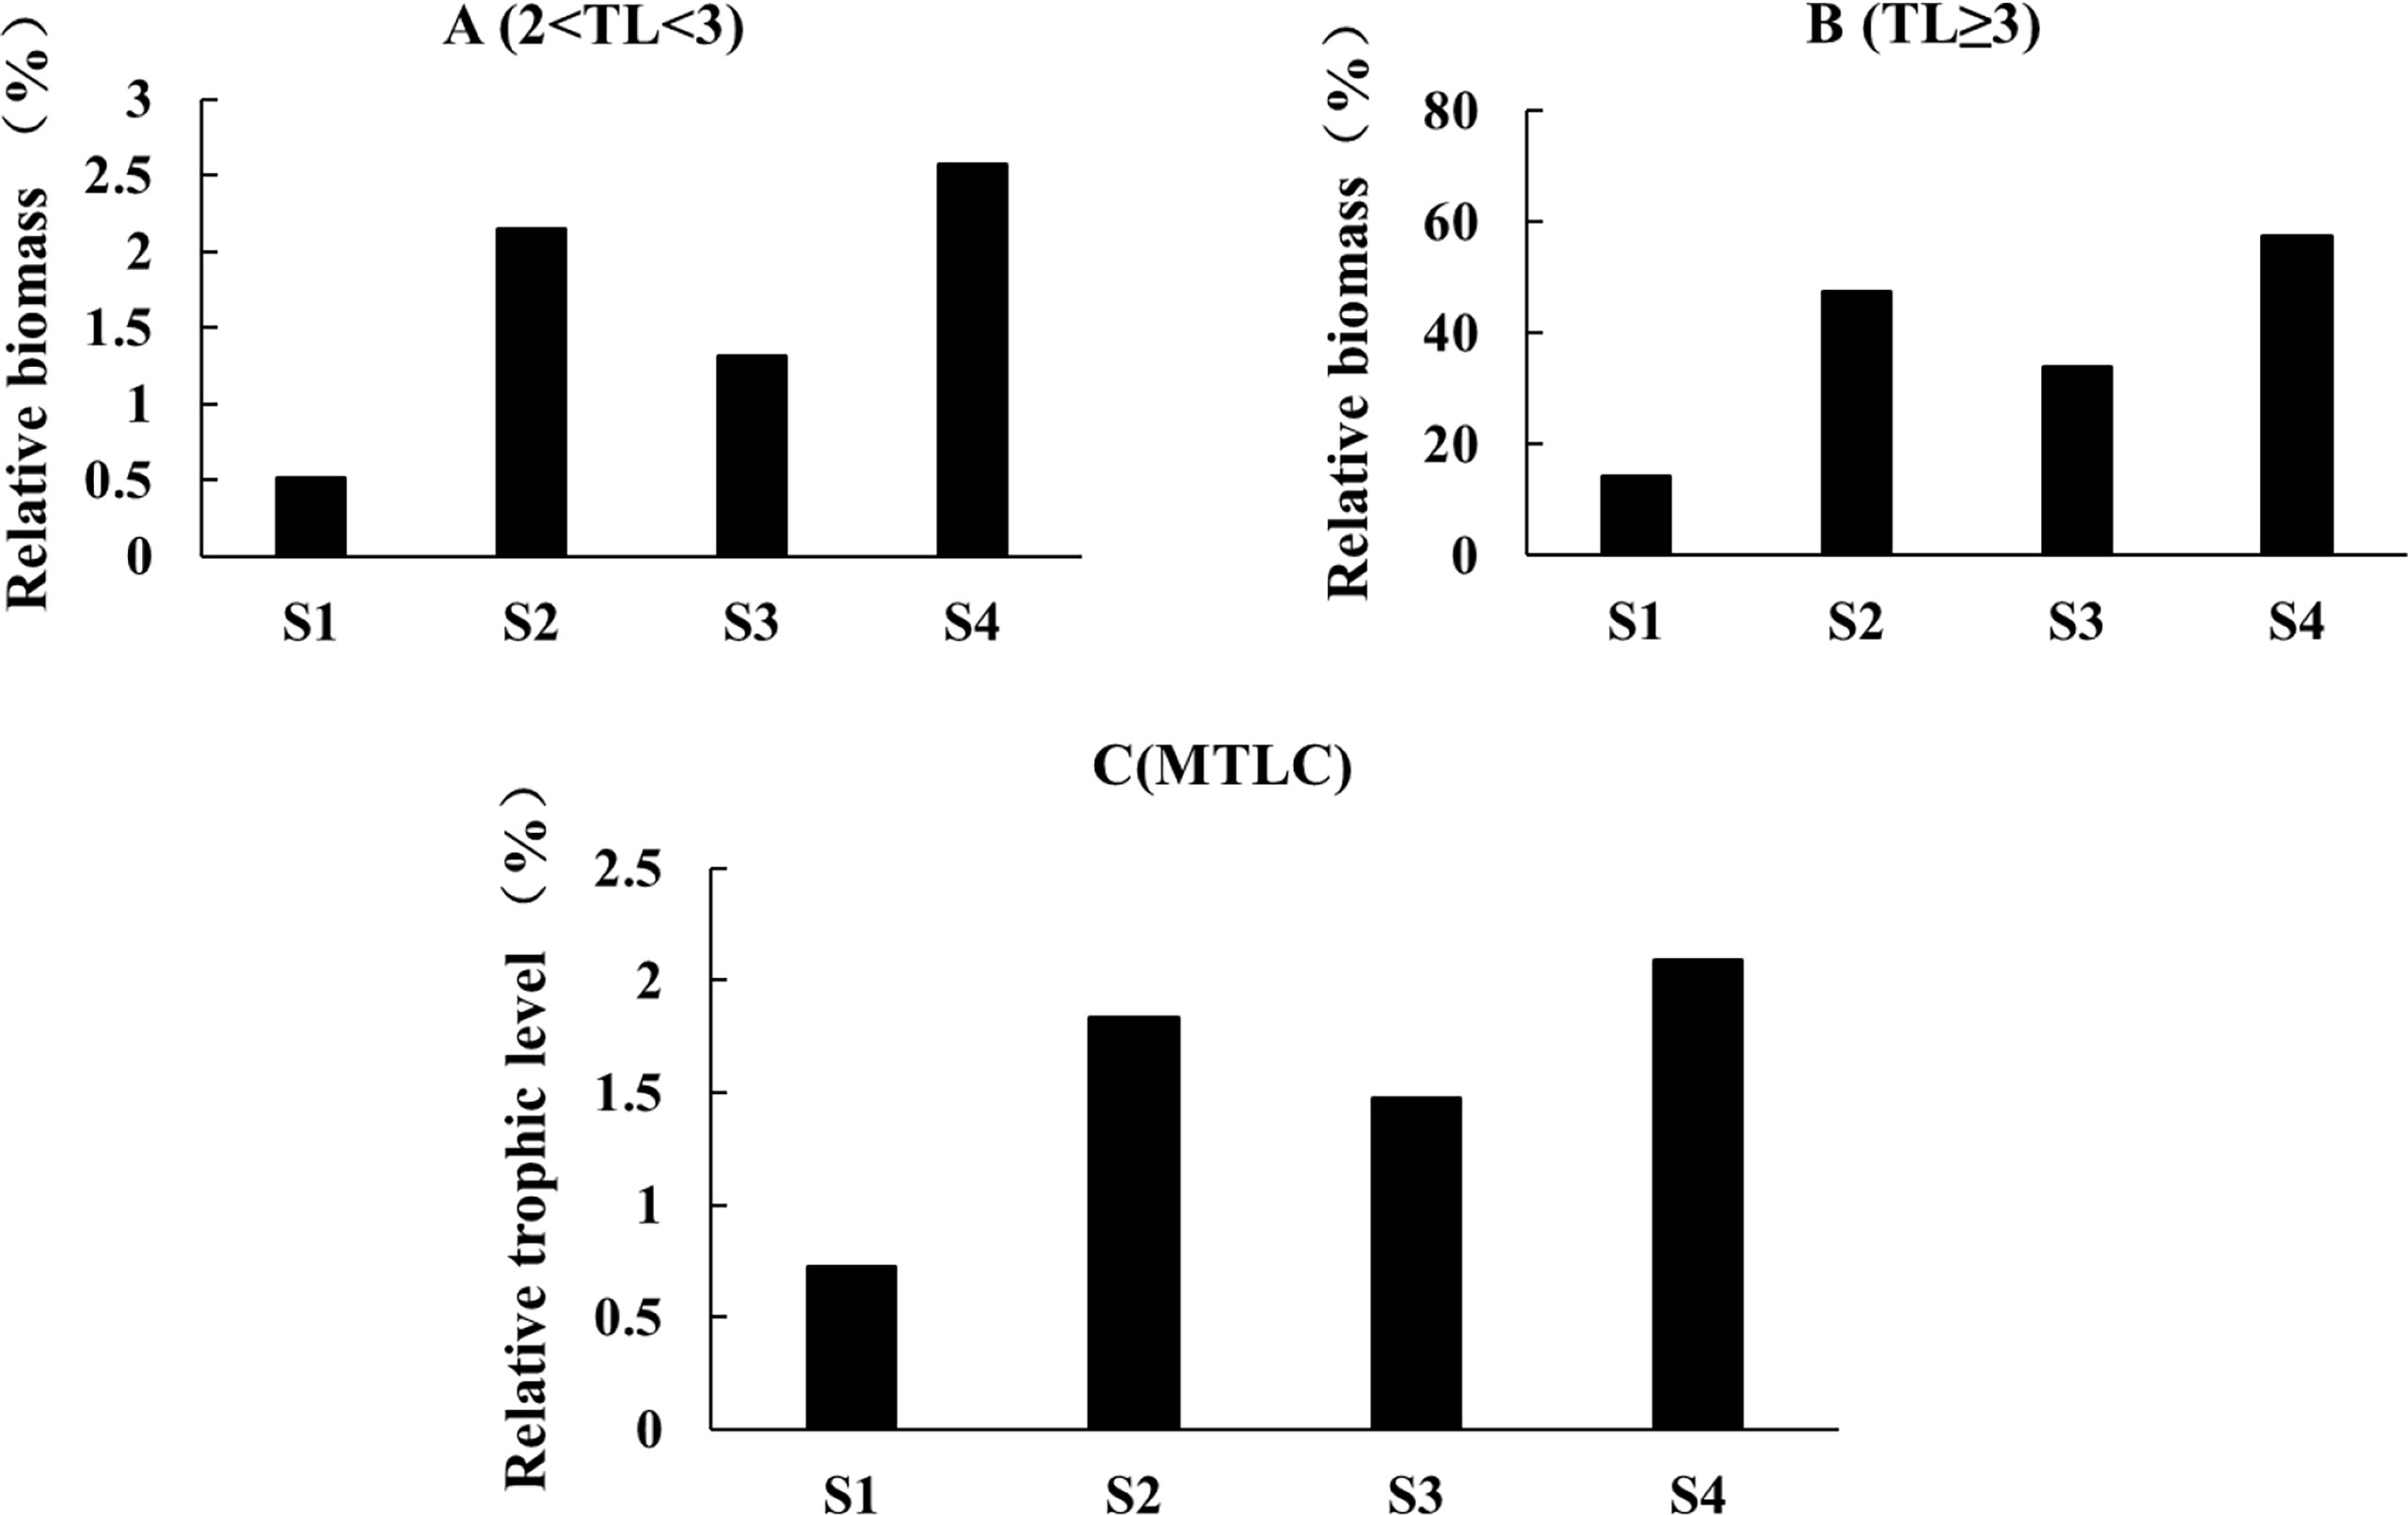
Figure 5 Changes of biomass and trophic level of the Minjiang Estuary ecosystem under different scenarios after 50 years. (A) Biomass changes of low nutrient level (2< TL <3); (B) biomass changes of high nutrient level (TL>3); (C) simulated changes of mean fishing trophic level (MTLC).
In the characteristic indicators, total system consumption (TC) and total system respiration (TR) under all four scenarios were smaller than those in 2016. Both TC and TR showed the smallest variation in S1 and the largest variation in S4, and no significant difference between S2 and S3. On the contrary, total system output (TEX), total system flow debris (TDET), and total system flow (TST) under all four simulated scenarios were higher than those in 2016 (Figure 6). System omnivory index (SOI), Finn’s cycle index (FCI), and total primary production/total respiration (TPP/TR) revealed that FCI showed different consequences: FCI decreased under all four scenarios, while TPP/TR showed an opposite result; SOI were lower than the 2016 model under S1 and S3 but higher under S1 and S4 (Figure 6).
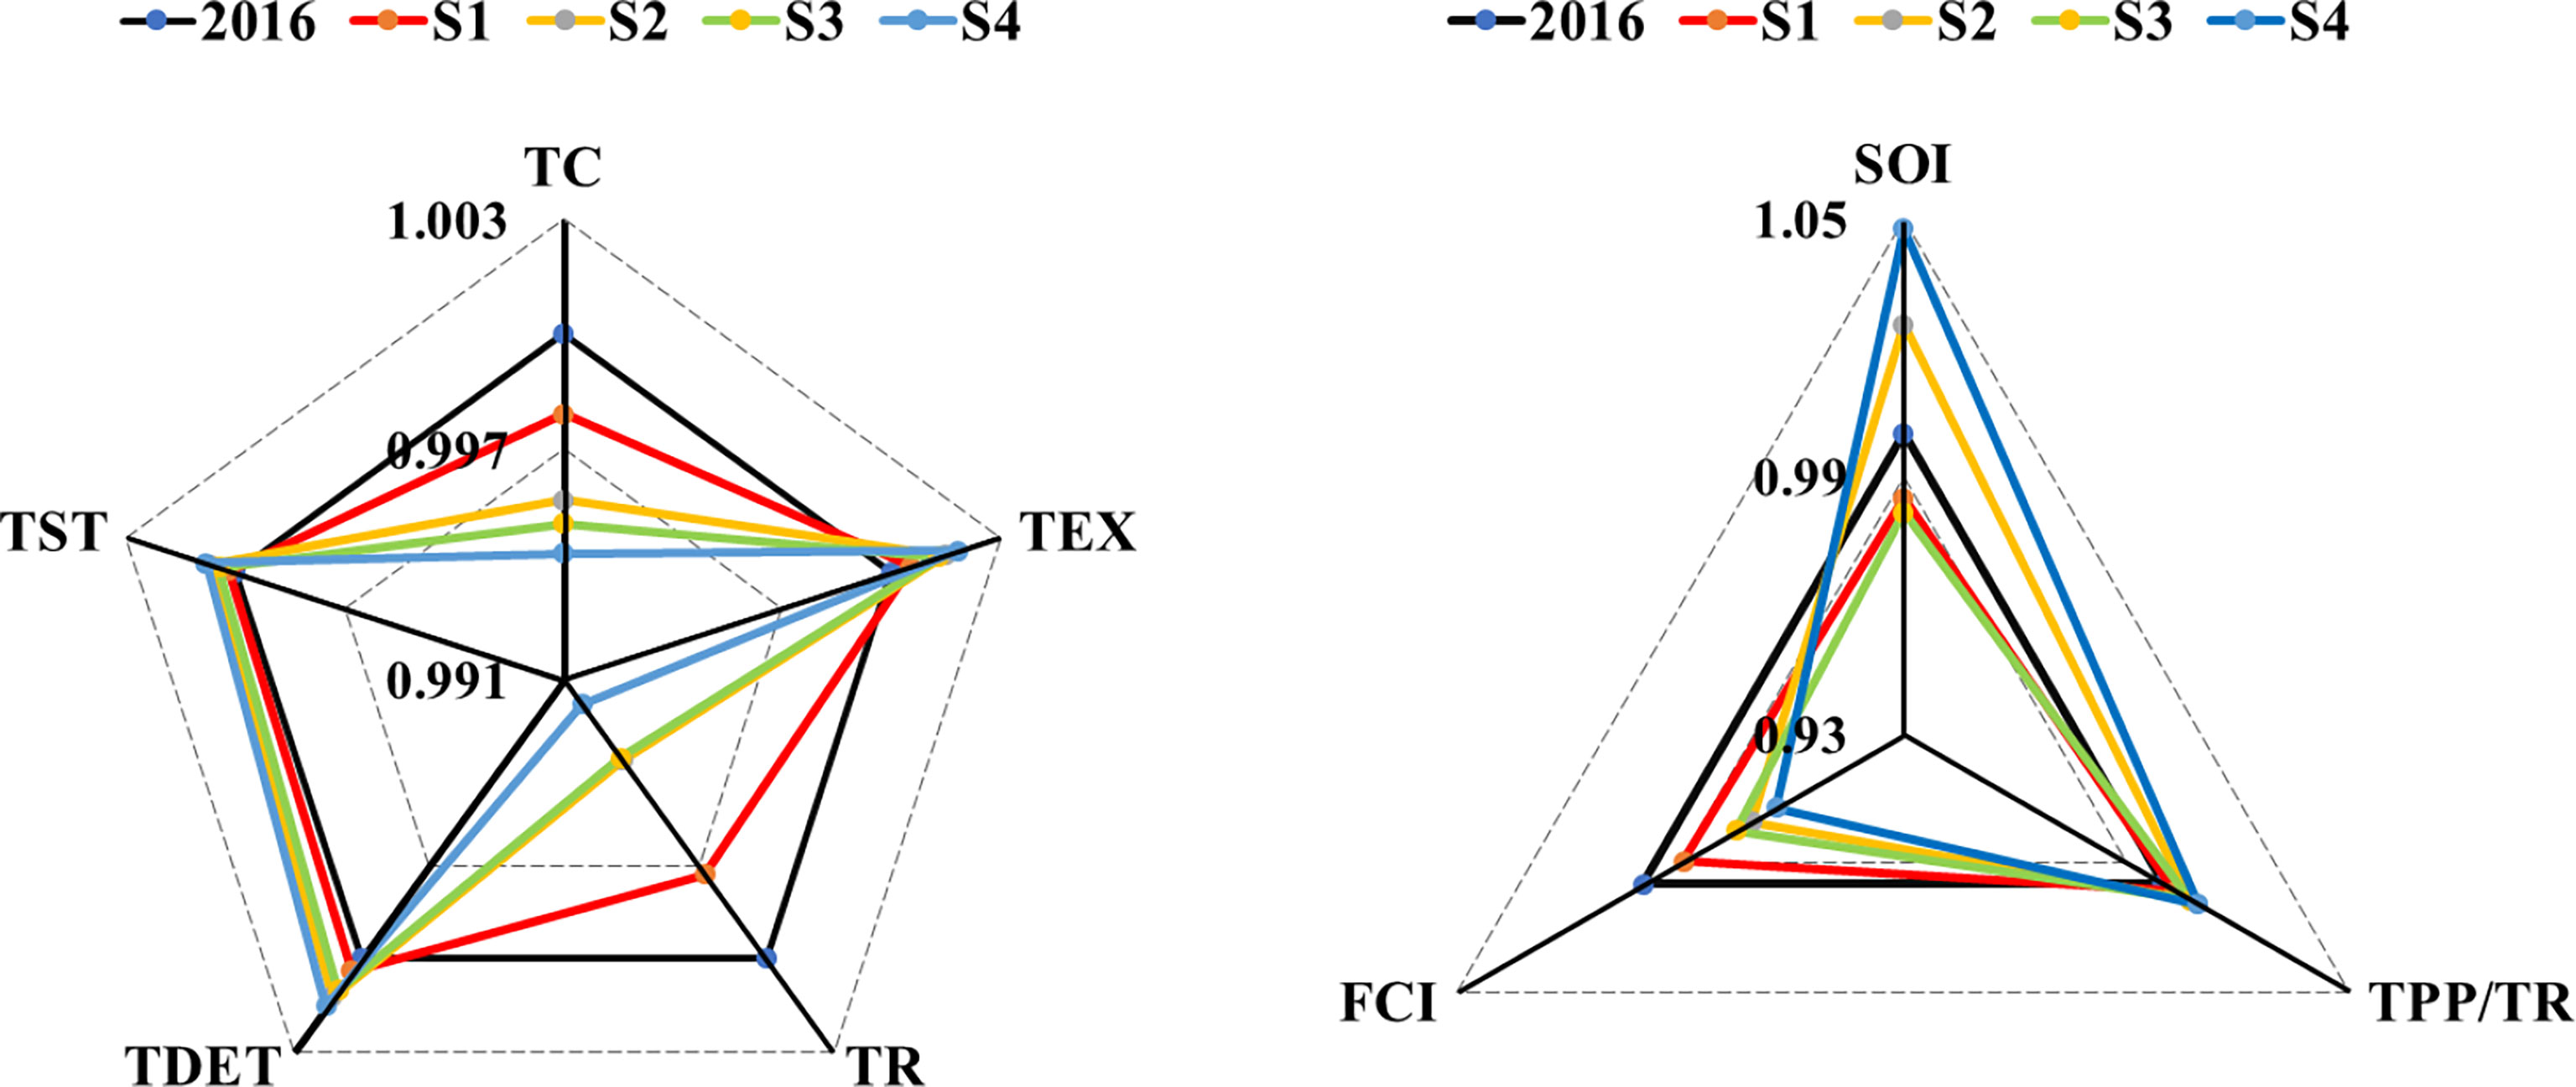
Figure 6 Variations of characteristic indicators of the Minjiang Estuary ecosystem under four scenarios. Left: indicators reflecting the overall size, maturity, and stability of an ecosystem, including total system throughput (TST), total export (TEX), total respiration flows (TR), total flow into detritus (TDET), and total consumption (TC); right: indicators reflecting the complex relationships within an ecosystem and the maturity of an ecosystem, including system omnivory index (SOI), total primary production/total biomass (TPP/TR), and Finn’s cycling index (FCI).
4 Discussion
4.1 Effectiveness of Fishing Moratorium in the Minjiang Estuary
The Minjiang Estuary and its adjacent waters are traditional fishing grounds in China (Tang, 2012) and have been in multiple stresses by supporting overfishing (Kang and Li, 2020). Compared with the 2016 model, the range of trophic levels in the Minjiang Estuary ecosystem in 2016 shortened, and the trophic levels of most species decreased except cephalopods and stomatopods, suggesting the simplification of the food web in the Minjiang Estuary in the last decade. Despite the fishing moratorium, the catch still far exceeded the stock supplemented, accelerating the overconsumption of high trophic level species, which indicated that the current fishing ban regulation has not achieved satisfactory results. For example, resources of Collichthys lucidus and Odontamblyopus rubicundus in the Minjiang Estuary were in collapse (He et al., 2018; Wang et al., 2020). Moreover, environmental pollution further increased the survival pressure of fishery organisms (Gao et al., 2018; Cheng et al., 2020), especially species characterized by long maturity period and less spawning (Jayasinghe et al., 2015). The mean trophic level of catch decreased to 0.097, 60% of the rate of decline in the southern Australian fishing zone (Alleway et al., 2014), but twice the global descending rate (Pauly et al., 1998), which could be attributed to the significant increasing catch of crab with low trophic level. Due to consumers’ appetite for crabs and their high price, the artificial release of crabs has increased in recent years, resulting in a sharp increase in the proportion of crabs in the catch (FCBS (Fuzhou City Bureau of Statistics), 2007-2017; Kang et al., 2021). Meanwhile, it is undeniable that the fishing moratorium has shown certain effects, slowing down the rate of resource decline. Without fishing ban, the maximum trophic level in the 2016 simulated model was lower than that in the 2016 model, so was the mean trophic level. The positive effects of fishing ban were evidenced in most areas, e.g., the implementation of a fishing moratorium resulted in an overall increase in the mean trophic level in the Sine Saloum Estuary in Senegal (Ecoutin et al., 2014) and the Pearl River Estuary (Wang et al., 2015).
The reduction in biological resources and the deterioration of habitats under overfishing and environmental pollution caused variations in the overall size, maturity, and stability of the Minjiang Estuary ecosystem. Total ecosystem throughput (TST), which was generally used to quantify the input and output of system energy flow (Ulanowicz, 1986), showed a high value in the 2016 model than that in the 2006 model; however, the proportion of total system consumption (TC) and total respiration (TR) decreased, which suggested that most energies flowed into detritus or out of the system. With economic development, a large amount of domestic sewage and industrial and agricultural waste discharged into the Minjiang Estuary brought enough organic matter and rich food sources, increasing the energy flow through the ecosystem (Gao et al., 2018; Cheng et al., 2020). In addition, overfishing destroyed the original status of trophic structure and energy flow distribution of the Minjiang Estuary ecosystem; as a result, the primary energy entering the ecosystem could not be effectively used before flowing out of the ecosystem.
A combination of the Connectivity Index (CI) and the SOI could reflect the complex relationships within an ecosystem and describe the maturity of an ecosystem (Odum, 1969; Christensen et al., 2008). After the fishing moratorium, corresponding to the increasing species diversity and biomass in the Mingjiang Estuary (Tao et al., 2020), the value of CI increased, showing broader and more complex species interrelations within the community. As CI is strongly dependent on the feeding habits of functional groups and how to define functional groups, relying on CI alone could not accurately reflect the structure of the ecosystem (Christensen et al., 2008; Thapanand et al., 2009; Bueno-Pardo et al., 2018). The SOI of the Minjiang Estuary ecosystem in 2016 was similar to the Yangtze Estuary (Han et al., 2016) and the Hooghly–Matla Estuary of India (Mukherjee et al., 2019), and lower than the west coast estuary of India (Lal et al., 2021) and the northern waters of Brazil (Lira et al., 2021), indicating the simplification of foodweb from a complex network to a linear pattern in the Minjiang Estuary. Interestingly, after the fishing moratorium, the increasing food source could lead to the specialization of feeding habits of some predators and the consequent decline of SOI, e.g., feeding habits of Mullus barbatus and Merluccius merluccius in the Gulf of Castellammare, northwest Sicily, tended towards simplification (Badalamenti et al., 2002).
TPP/TR, an indicator reflecting system maturity, is greater than 1 in the early stage of ecosystem development as the yield is expected to exceed the respiration and gradually decreased with the development of the ecosystem approaching 1 of the mature stage (Odum, 1969). Due to the eutrophication in the past decade, red tide outbreaks frequently in the Minjiang Estuary (Zhuo, 2018), which resulted in the inefficient utilization of a large amount of primary productivity. The Minjiang Estuary was extremely immature, with TPP/TR of the Minjiang Estuary decreased from 5.473 in the 2006 model to 12.24 in the 2016 model, much higher than The Hooghly-Matla Estuary (Mukherjee et al., 2019), the Yangtze Estuary (Han et al., 2016), and the Pearl River Estuary (Wang et al., 2015), but lower than that of the Gulf of Mexico (Chi-Espínola and Vega-Cendejas, 2022) and Canche (Selleslagh et al., 2012). The implementation of the fishing moratorium enhanced the utilization of primary production and alleviated the impacts on the ecosystem to a certain extent, resulting in the decline of TPP/TR (Lu and Zhao, 2015; Khatun et al., 2020). In the Minjiang Estuary, TPP/TR value in the 2016 simulated model without fishing moratorium was 10.4% higher than the 2016 model.
FCI represents the proportion of the flow involved in cycling in the total system throughput. The higher the value is, the higher the proportion of recycling energy flow is, indicating a higher maturity of the ecosystem (Christensen et al., 2008). Generally, the FCI of the estuarine ecosystem ranged from 0.19% to 24.8% (Sreekanth et al., 2020). In the Minjiang Estuary, FCI in 2016 was 0.92%, significantly lower than the Pearl River Estuary (Wang et al., 2015), the Yangtze Estuary (Han et al., 2016), and the Hooghly-Matla Estuary in India (Mukherjee et al., 2019), suggesting that the Minjiang Estuary ecosystem was in a low cycle and an immature state. Without a fishing moratorium since 2006, FCI in the 2016 simulated model was about half of the actual value, indicating that the fishing closure achieved a remarkable effect from this indicator.
4.2 The Advantages and Disadvantages of the Fishing Moratorium Regulations
Even under fishing closure, the biomass of overfished species could not stop falling (Wang et al., 2015). For example, after more than 20 years of fishing ban, the total biomass of the Waikiki-Diamond rock fisheries management area in Oahu, Hawaii, declined by two-thirds, and scad and parrotfish became rare (Williams et al., 2006). In the Minjiang Estuary, all the simulated fishing regulations showed only several functional groups benefited from the summer moratorium, e.g., shark and shrimp. Meanwhile, due to dual pressures of the unrestricted catch at open fishing and preying by high trophic level species, the biomass of low trophic level species such as pomfret and crabs decreased. In the East China Sea, the biomass of crustaceans and cephalopods showed a downward trend from 2014 to 2016 (Yan et al., 2019), suggesting the limited effects of short-term fishing moratorium under continuous heavy fishing pressure (Williams et al., 2006). Changes in species composition did not produce expected positive changes in the fish community in the northern part of the East China Sea (Jiang et al., 2009). In fishing grounds opened regularly, resources can be seen to recover just after fishing closure, while the retaliatory fishing in the open period could significantly reduce the resource to the origin or even worse before the coming of the next fishing closure (Murawski et al., 2005; Cohen et al., 2013), which indicated that overfishing during open fishing periods could vanish the positive effects of fishing ban. Comprehensive management regulations should be formulated by combining the extension of the fishing moratorium and reduction of fishing pressure, so as to realize the restoration and sustainable utilization of fisheries.
Data Availability Statement
The raw data supporting the conclusions of this article will be made available by the authors, without undue reservation.
Ethics Statement
The animal study was reviewed and approved by the Animal Care and Ethics Committee of the Ocean University of China.
Author Contributions
BK and XS conceptualized this paper, actively participated in write-up, and set the overall directions for the paper. YK contributed to data gathering, processing, analysis, and write-up. All authors listed have made a substantial, direct, and intellectual contribution to the work and approved it for publication.
Funding
This study was supported by the National Natural Science Foundation of China (51922065), Hubei International Science and Technology Cooperation Base of Fish Passage (HIBF2020001), and National Natural Science Foundation of China (41976091).
Conflict of Interest
The authors declare that the research was conducted in the absence of any commercial or financial relationships that could be construed as a potential conflict of interest.
Publisher’s Note
All claims expressed in this article are solely those of the authors and do not necessarily represent those of their affiliated organizations, or those of the publisher, the editors and the reviewers. Any product that may be evaluated in this article, or claim that may be made by its manufacturer, is not guaranteed or endorsed by the publisher.
Acknowledgments
We appreciate the help provided by other associates with sample collections and massive field works.
References
Alleway H. K., Connell S. D., Ward T. M., Gillanders B. M. (2014). Historical Changes in Mean Trophic Level of Southern Australian Fisheries. Mar. Freshw. Res. 65, 884–893. doi: 10.1071/MF13246
Badalamenti F., D’Anna G., Pinnegar J., Polunin N. (2002). Size-Related Trophodynamic Changes in Three Target Fish Species Recovering From Intensive Trawling. Mar. Biol. 14, 561–570. doi: 10.1007/s00227-002-0844-3
Bueno-Pardo J., García-Seoane E., Sousa A. I., Coelho J. P., Morgado M., Frankenbach S., et al. (2018). Trophic Web Structure and Ecosystem Attributes of a Temperate Coastal Lagoon (Ria De Aveiro, Portugal). Ecol. Model. 378, 13–25. doi: 10.1016/j.ecolmodel.2018.03.009
Bundy A. (2004). The Ecological Effects of Fishing and Implications for Coastal Management in San Miguel Bay, the Philippines. Coast. Manage. 5, 25–38. doi: 10.1080/08920750490247472
Cheng T., Zhao C. (1985). Runoff and Sediment Transport of Major Rivers in China and Their Influence on Coastal Areas. Acta Oceanol. Sin. 1985, 460–471.
Cheng Y., Zha Y., Tong C., Hu M., Du D., Fan Y., et al. (2020). Plant Population Dynamics in a Degraded Coastal Wetland and Implications for the Carbon Cycle. Wetlands 40, 1617–1625. doi: 10.1007/s13157-020-01268-7
Chi-Espínola A. A., Vega-Cendejas M. E. (2022). Trophic Dynamics and Properties of the Marine Ecosystem of Campeche Bank, Mexico. Mar. Biol. 169, 14. doi: 10.1007/s00227-021-03999-5
Christensen V., Pauly D. (1992). ECOPATH II — a Software for Balancing Steady-State Ecosystem Models and Calculating Network Characteristics. Ecol. Model. 61, 169–185. doi: 10.1016/0304-3800(92)90016-8
Christensen V., Walters C. J., Pauly D., Forrest R. (2008). Ecopath With Ecosim Version 6 User Guide (Vancouver: Fisheries Centre, University of British Columbia).
Cohen P. J., Cinner J. E., Foale S. (2013). Fishing Dynamics Associated With Periodically Harvested Marine Closures. Glob. Environ. Change 23, 1702–1713. doi: 10.1016/j.gloenvcha.2013.08.010
Costanza R., Arge R. D., de Groot R., Farber S., Grasso M., Hannon B., et al. (1997). The Value of World’s Ecosystem Services and Natural Capital. Nature 387, 253–260. doi: 10.1038/387253a0
Darwall W. R. T., Allison E. H., Turner G. F., Irvine K. (2010). Lake of Flies, or Lake of Fish? A Trophic Model of Lake Malawi. Ecol. Model. 221, 713–727. doi: 10.1016/j.ecolmodel.2009.11.001
Ecoutin J. M., Simier M., Albaret J. J., Lae R., Raffraf J., Sadio O., et al. (2014). Ecological Field Experiment of Short-Term Effects of Fishing Ban on Fish Assemblages in a Tropical Estuarine MPA. Ocean Coast. Manage. 100, 74–85. doi: 10.1016/j.ocecoaman.2014.08.009
FCBS (Fuzhou City Bureau of Statistics) (2007–2017). Fuzhou Statistical Yearbook (Beijing: China Statistic Publishing House. (in Chinese).
Feng B., Lu Y., Lu H. (2009). A Modeling Evaluation of Effects of Closed Season on Paragyrops Edita in Beibu Gulf. Resour. Sci. 31, 2201–2207.
Froese R., Pauly D. (2021) FishBase. Electronic Publication. Available at: www.fishbase.org.
Gao D., Chen G., Li X., Zeng C. (2018). Reclamation Culture Alters Sediment Phosphorus Speciation and Ecological Risk in Coastal Zone of Southeastern China. CLEAN-Soil Air Water 46, 1700495. doi: 10.1002/clen.201700495
Han R., Chen Q., Wang L., Tang X., Shen X. (2016). Analysis of the Ecosystem Structure and Energy Flow of the Yangtze River Estuary and Adjacent Seas, Based on the Ecopath Model. Acta Ecol. Sin. 36, 4907–4918.
He X., Li J., Shen C., Shi Y., Feng C., Guo J., et al. (2018). The Breadth and Overlap of Ecological Niche of Major Fish Species in the Minjiang River Estuary, China. Chin. J. Appl. Ecol. 29, 3085–3092. doi: 10.13287/j.1001-9332.201809.037
Huang L., Li J., Zhang Y., Xie Y., Liu Q., Jin X. (2010). Current Fishery Resource Assessment in the Minjiang River Estuary and its Neighboring Waters. J. Trop. Oceanogr. 29, 142–148.
Huang M., Xu S., Liu Y., Xiao Y., Wang T., Li C. (2019). Assessment of Ecological Carrying Capacity of Sparus Macrocephalus in Daya Bay Based on an Ecopath Model. J. Fish. Sci. China 26, 1–13. doi: 10.3724/SP.J.1118.2019.18328
Hutchings J. A. (2000). Collapse and Recovery of Marine Fishes. Nature 406, 882. doi: 10.1038/35022565
Hutchings J. A., Reynolds J. D. (2004). Marine Fish Population Collapses: Consequences for Recovery and Extinction Risk. BioSciences 54, 297–309. doi: 10.1641/0006-3568(2004)054[0297:MFPCCF]2.0.CO;2
Jayasinghe R. P. P. K., Amarasinghe U. S., Newton A. (2015). Evaluation of Marine Subareas of Europe Using Life History Parameters and Trophic Levels of Selected Fish Populations. Mar. Environ. Res. 112, 81–90. doi: 10.1016/j.marenvres.2015.08.002
Jiang Y. Z., Cheng J. H., Li S. F. (2009). Temporal Changes in the Fish Community Resulting From a Summer Fishing Moratorium in the Northern East China Sea. Mar. Ecol. Prog. 387, 265–273. doi: 10.3354/meps08078
Kang B. (2018). Fishery Resources and Ecological Environment of the Minjiang Estuary (Beijing: China Agriculture Press).
Kang B., Li J. (2020). Dominant Species Drive Seasonal Dynamics of the Fish Community in the Min Estuary, China. Oceanol. Hydrobiol. St49, 34–48. doi: 10.1515/ohs-2020-0004
Kang B., Liu M., Huang X. X., Li J., Yan Y. R., Han C. C., et al. (2018). Fisheries in Chinese Seas: What can We Learn From Controversial Official Fisheries Statistics? Rev. Fish Biol. Fisher. 28, 503–519. doi: 10.1007/s11160-018-9518-1
Kang B., Pecl G. T., Lin L. S., Sun P., Zhang P. D., Li Y., et al. (2021). Climate Change Impacts on China’s Marine Ecosystems. Rev. Fish Biol. Fisher. 31, 599–629. doi: 10.1007/s11160-021-09668-6
Khatun M., Barman P., Lupa S., Zahangir M., Liu Q., Asha S. (2020). Comparative Analysis of Mass-Balanced Models for a Tropical Reservoir to Assess the Impact of a Management Practice. Appl. Ecol. Env. Res. 18, 1901–1924. doi: 10.15666/aeer/1801_19011924.
Lal D. M., Sreekanth G. B., Shivakrishna A., Kumar R., Nayak B. B., Abidi Z. J. (2021). Ecosystem Health Status and Trophic Modeling of an Anthropogenically Impacted Small Tropical Estuary Along India’s West Coast. Environ. Sci. Pollut. Res. 28, 35073–35093. doi: 10.1007/s11356-021-12857-2.
Lercari D., Horta S., Martínez G., Calliari D., Bergamino L. (2015). A Food Web Analysis of the Río De La Plata Estuary and Adjacent Shelf Ecosystem: Trophic Structure, Biomass Flows, and the Role of Fisheries. Hydrobiologia 742, 39–58. doi: 10.1007/s10750-014-1964-8.
Lin L., Cheng J. (2009). Effects of the Prolonged Summer Closed Fishing Period on Fisheries in East China Sea. J. Dalian Fish. Univ. 24, 12–16. doi: 10.1016/j.elecom.2008.10.019.
Lin Q., Jin X., Guo X., Zhang B. (2009). Study on Structure and Energy Flow of the Yangtze Estuary and Adjacent Waters Ecosystem Based on Ecopath Model. J. Hydroecol. 30 (2), 28–36.
Lira A. S., Lucena-Frédou F., Le Loc’h F. (2021). How the Fishing Effort Control and Environmental Changes Affect the Sustainability of a Tropical Shrimp Small Scale Fishery. Fish. Res. 235, 105824. doi: 10.1016/j.fishres.2020.105824
Liu X., Li T. (2008). Comprehensive Environmental Impact Assessment of Gulf Reclamation Planning in Fujian Province (Beijing: Science Press. (in Chinese).
Liu X., Li D., Song G. (2017). Assessment of Heavy Metal Levels in Surface Sediments of Estuaries and Adjacent Coastal Areas in China. Front. Earth Sci. 11 (1), 1–10. doi: 10.1007/s11707-016-0569-0
Li R. G., Wang J. J., Huang Y. Q., Lin J. H., Lin H. S. (2017). Intertidal Macrobenthos in Coastal Wetlands, Fujian Province (Beijing: China Ocean Press).
Lotze H. K., Lenihan H. S., Bourque B. J., Bradbury R. H., Cooke R. G., Kay M. C., et al. (2006). Depletion, Degradation, and Recovery Potential of Estuaries and Coastal Seas. Science 312, 1806–1809. doi: 10.1126/science.1128035
Lu C., Zhao J. (2015). The Review and Prospect on Fish Moratorium Policy in the East China Sea. Fish. Inf. Strategy 30 (3), 169–174. doi: 10.13233/j.cnki.fishis.2015.03.002
MARA (Ministry of Agriculture and Rural Affairs) (2007–2017). China Fishery Statistical Yearbook (Beijing: China Agriculture Press).
Mukherjee J., Karan S., Chakrabarty M., Banerjee A., Rakshit N., Ray S. (2019). An Approach Towards Quantification of Ecosystem Trophic Status and Health Through Ecological Network Analysis Applied in Hooghly-Matla Estuarine System. India Ecol. Indic 100, 55–65. doi: 10.1016/j.ecolind.2018.08.025
Murawski S. A., Wigley S. E., Fogarty M. J., Rago P. J., Mountain D. G. (2005). Effort Distribution and Catch Patterns Adjacent to Temperate MPAs. ICES J. Mar. Sci. 62, 1150–1167. doi: 10.1016/j.icesjms.2005.04.005
Mutsert K. D., Cowan J. H., Walters C. J. (2012). Using Ecopath With Ecosim to Explore Nekton Community Response to Freshwater Diversion Into a Louisiana Estuary. Mar. Coast. Fish 4, 104–116. doi: 10.1080/19425120.2012.672366
Myers R. A., Worm B. (2005). Extinction, Survival or Recovery of Large Predatory Fishes. Philos. T R. Sco. B. 360, 13–20. doi: 10.1098/rstb.2004.1573
Odum E. P. (1969). The Strategy of Ecosystem Development. Science 164, 262–270. doi: 10.1126/science.164.3877.262
Palomares M., Pauly D. (1998). Predicting Food Consumption of Fish Populations as Functions of Mortality, Food Type, Morphometrics, Temperature and Salinity. Mar. Freshwater Res. 49, 447–453. doi: 10.1071/MF98015
Patrício J., Neto J. M., Teixeira H., Salas F., Marques J. C. (2009). The Robustness of Ecological Indicators to Detect Longterm Changes in the Macrobenthos of Estuarine Systems. Mar Environ. Res. 68, 25–36. doi: 10.1016/j.marenvres.2009.04.001
Pauly D. (1980). On the Interrelationships Between Natural Mortality, Growth Parameters, and Mean Environmental Temperature in 175 Fish Stocks. ICES J. Mar. Sci. 39, 175–192. doi: 10.1093/icesjms/39.2.175
Pauly D., Christensen V., Dalsgaard J., Froese R., Jr. Torres F. (1998). Fishing Down Marine Food Webs. Science 279, 860–863. doi: 10.1126/science.279.5352.860
Pauly D., Soriano-Bartz M. L., Palomares M. L. D. (1993). “Improved Construction, Parameterisation and Interpretation of Steady-State Ecosystem Models,” in Trophic Models of Aquatic Ecosystems. International Centre for Living Aquatic Resources Conference Proceedings. Eds. Christensen V., Pauly D. (Manila: International Center for Living Aquatic Resources Management), 1–13.
Polovina J. J. (1984b). Model of a Coral Reef Ecosystem I. The ECOPATH Model and its Application to French Frigate Shoals. Coral Reefs 3, 1–11. doi: 10.1007/BF00306135
Pritchard D. W. (1967). What is an Estuary: Physical Viewpoint. In G. H. Lauff (Editor), Estuaries. Am. Assoc. Adv. Sci. Publ. 83, 3–5. doi: 10.1007/BF00386522
Safina C., Rosenberg A. A., Myers R. A., Quinn T. J. II, Collie J. S. (2005). U.S. Ocean Fish Recovery: Staying the Course. Science 309, 707–708. doi: 10.1126/science.1113725
Selleslagh J., Lobry J., Amara R., Brylinski J.-M., Boët P. (2012). Trophic Functioning of Coastal Ecosystems Along an Anthropogenic Pressure Gradient: A French Case Study With Emphasis on a Small and Low Impacted Estuary. Estuar. Coast. Shelf S. 112, 73–85. doi: 10.1016/j.ecss.2011.08.004
Sinnickson D., Chagaris D., Allen M. (2021). Exploring Impacts of River Discharge on Forage Fish and Predators Using Ecopath With Ecosim. Front. Mar. Sci. 8, 689950. doi: 10.3389/fmars.2021.689950
Song B. (2004). Ecosystem Modelling Study on the Fishery and Environment of Taihu Lake. (East China Normal University, Shanghai: Doctoral Thesis).
Sreekanth G. B., Chakraborty S. K., Jaiswar A. K., Mohamed K. S., Zacharia P. U., Francour P. (2020). Trophic Network and Food Web Characteristics in a Small Tropical Monsoonal Estuary: A Comparison With Other Estuarine Systems. Indian J. Geo-Mar. Sci. 47, 945–958. doi: 10.1016/j.ecoinf.2021.101429.
Sreekanth G. B., Chakraborty S. K., Jaiswar A. K., Zacharia P. U., Mohamed K. S. (2021). Modeling the Impacts of Fishing Regulations in a Tropical Indian Estuary Using Ecopath With Ecosim Approach. Environ. Dev. Sustain. 23, 17745–17763. doi: 10.1007/s10668-021-01410-3
Srithong N., Jensen K. R., Jarernpornnipat A. (2021). Application of the Ecopath Model for Evaluation of Ecological Structure and Function for Fisheries Management: A Case Study From Fisheries in Coastal Andaman Sea, Thailand. Reg. Stud. Mar. Sci. 47, 101972. doi: 10.1016/j.rsma.2021.101972
Tao L. S. R., Lui G. C. S., Wong K. J. H., Hui T. T. Y., Mak Y. K. Y., Sham R. C., et al. (2020). Does a Trawl Ban Benefit Commercially Important Decapoda and Stomatopoda in Hong Kong? Ecosystems 2020, 1–14. doi: 10.1007/s10021-020-00574-9
Thapanand T., Jutagatee T., Wongrat P., Lekcholayut T., Meksumpun C., Janekitkarn S., et al. (2009). Trophic Relationships and Ecosystem Characteristics in a Newly-Impounded Man-Made Lake in Thailand. Fish. Manage. Ecol. 16, 77–87. doi: 10.1111/j.1365-2400.2008.00601.x
Ulanowicz R. E. (1986). Growth and Development: Ecosystems Phenomenology (New York: Springer-Verlag).
Walters C., Christensen V., Pauly D. (1997). Structuring Dynamic Models of Exploited Ecosystems From Trophic Mass-Balance Assessments. Rev. Fish Biol. Fisher. 7, 139–172. doi: 10.1023/A:1018479526149
Walters C., Pauly D., Christensen V., Kitchell J. F. (2000). Representing Density Dependent Consequences of Life History Strategies in Aquatic Ecosystems: EcoSim Ii. Ecosystems 3, 70–83. doi: 10.1007/s100210000011
Wang Y., Duan L., Li S., Zeng Z., Failler P. (2015). Modeling the Effect of the Seasonal Fishing Moratorium on the Pearl River Estuary Using Ecosystem Simulation. Ecol. Model. 312, 406–416. doi: 10.1016/j.ecolmodel.2015.06.011
Wang L. L., Lin L., Li Y., Xing Y. K., Kang B. (2020). Sustainable Exploitation of Dominant Fishes in the Largest Estuary in Southeastern China. Water 12, 3390. doi: 10.3390/w12123390
Williams I. D., Walsh W. J., Miyasaka A., Friedlander A. M. (2006). Effects of Rotational Closure on Coral Reef Fishes in Waikiki-Diamond Head Fishery Management Area, Oahu, Hawaii. Mar. Ecol-Prog. Ser. 310, 139–149. doi: 10.3354/meps310139
Yang L., Jiang Y., Yuan X., Lin N., Liu Z., Li S. (2016). Ecological Carring Capacity of Typical Enhancement Species in Xiangshan Bay. Mar. Fish. 38, 273–282. doi: 10.13233/j.cnki.mar.fish.2016.03.006
Yan L., Liu Z., Jin Y., Cheng J. (2019). Effects of Prolonging Summer Fishing Moratorium in the East China Sea on the Increment of Fishery Resources. Mar. Fish. 41, 513–519. doi: 10.13233/j.cnki.mar.fish.2019.05.001
Yuan D. X., Yang D. N., Wade T. L., Qian Y. (2001). Status of Persistent Organic Pollutants in the Sediment From Several Estuaries in China. Environ. Pollut. 114, 101–111. doi: 10.1016/S0269-7491(00)00200-1
Zeng Z., Cheung W. W. L., Li S. (2019). Effects of Climate Change and Fishing on the Pearl River Estuary Ecosystem and Fisheries. Rev. Fish Biol. Fish. 29, 861–875. doi: 10.1007/s11160-019-09574-y
Zhai L., Pauly D. (2020). Construction and Interpretation of Particle Size Distribution Spectra From 19 Ecopath Models of Chinese Coastal Ecosystems. Front. Mar. Sci. 7, 00298. doi: 10.3389/fmars.2020.00298
Zhang L. L., Ren Q. Q., Liu M., Xu Q., Kang B., Jiang X. B. (2020). Fishery Stock Assessments in the Min River Estuary and Its Adjacent Waters in Southern China Using the Length-Based Bayesian Estimation (LBB) Method. Front. Mar. Sci. 7, 00507. doi: 10.3389/fmars.2020.00507
Zhang Z., Su X., Liu Y., Ye S. (2010). Analysis on States of Marine Fishing Industry in Fujian. J. Fujian Fish. 4, 82–86. doi: 10.14012/j.cnki.fjsc.2010.04.020
Keywords: Ecopath with Ecosim, ecosystem characteristics, fishing moratorium, fishing pressure, dynamic simulation
Citation: Kong Y, Kang B and Shi X (2022) Modeling the Effects of Seasonal Fishing Moratorium on the Ecosystem of the Minjiang Estuary in Southeastern China. Front. Mar. Sci. 9:886799. doi: 10.3389/fmars.2022.886799
Received: 01 March 2022; Accepted: 15 March 2022;
Published: 08 April 2022.
Edited by:
Jinghui Fang, Chinese Academy of Fishery Sciences (CAFS), ChinaReviewed by:
Yunkai Li, Shanghai Ocean University, ChinaCui Liang, Institute of Oceanology (CAS), China
Copyright © 2022 Kong, Kang and Shi. This is an open-access article distributed under the terms of the Creative Commons Attribution License (CC BY). The use, distribution or reproduction in other forums is permitted, provided the original author(s) and the copyright owner(s) are credited and that the original publication in this journal is cited, in accordance with accepted academic practice. No use, distribution or reproduction is permitted which does not comply with these terms.
*Correspondence: Bin Kang, bkangfish@163.com; Xiaotao Shi, fishlab@163.com