Protistan Communities Within the Galápagos Archipelago With an Emphasis on Micrograzers
 Se Hyeon Jang
 Prisca Lim1
  Adrian Marchetti
- 1Department of Earth, Marine and Environmental Sciences, University of North Carolina at Chapel Hill, Chapel Hill, NC, United States
- 2Department of Oceanography, Chonnam National University, Gwangju, South Korea
The Galápagos Archipelago is a globally significant biodiversity hotspot. However, compared to the relatively well-known megafauna, the distribution and ecological significance of marine protists in this system are poorly understood. To gain an understanding of the protistan assemblages across trophic modes, an intensive oceanographic survey was conducted in the Galápagos Marine Reserve (GMR) in October of 2018. The Equatorial Undercurrent (EUC)-influenced region had higher chlorophyll-a (Chl-a) concentrations than those of the eastern regions of the archipelago, along with higher abundances of protistan grazers. Specifically, proportions of autotrophic and potentially mixotrophic dinoflagellates were higher in the EUC, whereas in the eastern regions, heterotrophic dinoflagellates and chlorophytes dominated. Taxonomic composition and biochemical indicators suggested proportions of micrograzers and their associated heterotrophic biomass was higher in the oligotrophic, low Chl-a regions in the east. We also report observations from a dinoflagellate bloom in the western archipelago, which was heavily influenced by upwelling of the EUC. The red tide-forming dinoflagellate Scrippsiella lachrymosa was highly detected through light microscopy and DNA amplicon sequencing. In addition, the heterotrophic dinoflagellate Polykrikos kofoidii was detected and, based on cell densities observed in this study and grazing rates obtained from the literature, estimated to potentially graze up to 62% of S. lachrymosa bloom population. Our findings thus provide new insights into the composition of micrograzers and their potential roles in structuring protistan communities in the Galápagos Archipelago.
Introduction
The Galápagos Archipelago comprises a group of volcanic islands in the Equatorial Pacific Ocean located roughly 1,000 km from mainland Ecuador. To protect the archipelago’s marine biodiversity, the Galápagos Marine Reserve (GMR) was created in 1998 and was declared a World Heritage Site in 2001. Despite the unique global value of this marine ecosystem, there is still a lack of knowledge, particularly of its planktonic communities, which provide the majority of primary productivity to this system. The source waters that supply nutrients to the euphotic zone of the Galápagos Archipelago are influenced by a number of physical processes (Feldman, 1986). Most importantly, the upwelling by the eastward flowing Equatorial Undercurrent (EUC) is the fundamental origin for the supply of nutrients in this region (Feldman, 1986). Based on remote sensing data, the nutrient-replete EUC causes an increase of Chl-a concentrations associated with increased phytoplankton biomass, especially in the western side of the archipelago that is directly affected by the EUC upwelling (Schaeffer et al., 2008; Kislik et al., 2017). Also, the strength of the EUC upwelling in the GMR is known to be influenced by El Niño Southern Oscillation (ENSO) events (Sweet et al., 2007).
Little is known about upwelling effects on the structure and function of protozoan (micrograzers) communities in the Galápagos Archipelago, potentially impacting food availability for higher trophic levels. Identifying protozoan species can be an arduous task due to ingested prey material causing morphological variations, cell fragility, and relatively poorly-known taxonomic information (Sherr and Sherr, 1993; Anderson and Menden-Deuer, 2017). However, distinguishing protists, particularly whether they are mixotrophic or heterotrophic, is essential since they link planktonic food webs through phytoplankton and metazoans (Stoecker and Capuzzo, 1990; Tillmann, 2004; Buitenhuis et al., 2010). In particular, dinoflagellates, which commonly cause blooms in waters around the globe, are a protistan group with a variety of trophic modes (Stoecker, 1999; Jeong et al., 2010); thus, the population dynamics of species are sometimes completely different based on the functional characteristics of their trophic modes. Also, understanding trophic modes of micrograzers in marine food webs is important in that it is estimated, on average, 60% of total primary production is consumed by phagotrophic protists, followed by grazing by mesozooplankton or sinking to the seafloor sediment, fueling the biological carbon pump (Calbet and Landry, 2004; Schmoker et al., 2013).
The DNA metabarcoding method has been used to investigate composition, relative abundance, and distribution of eukaryotic plankton taxonomic communities by sequencing a short DNA region at an affordable cost (Cuvelier et al., 2010; De Vargas et al., 2015; Abad et al., 2016; Schroeder et al., 2020). Furthermore, the high sensitivity of this technique is capable of detecting rare taxa and identifying cryptic species and those overlooked by conventional microscopy methods because they are either too fragile or too small (Cuvelier et al., 2010; Abad et al., 2016). In this study, we used DNA metabarcoding complemented by microscopic examination of the protistan community in waters of the Galápagos Archipelago. There were two main objectives of this study. First, to investigate oceanographic variables and their influence on spatial patterns and trophic structure of planktonic protistan assemblages in the Galápagos Archipelago. This includes the environmental conditions and potential controls of a red tide bloom opportunistically sampled in Elizabeth Bay on the west side of Isabela Island. Second, to understand the abundance and distribution of micrograzers in protistan communities in this region.
Materials and Methods
Study Area and Sample Collection
The research cruise was conducted throughout the Galápagos Archipelago, including sites adjacent to most of its main inhabited islands of Isabela, Santa Crúz, San Cristobal, and Floreana, within an area from 1°N to 2°S and 92 – 89°W from September 30th to October 15th of 2018 (Figure 1). CTD profiles were obtained at 29 sites; at 23 of these, seawater was collected for biological and chemical measurements. The survey period fell within a typically cool and dry season driven by southeasterly trade winds resulting in upwelling (Atwood and Sachs, 2014). The surveyed sites were grouped into two distinct regions based on the observed data: 1) the EUC-influenced region and 2) an eastern region, according to the water mass characteristics (i.e., water-column temperature and nutrient profiles, Supplementary Table 1). Exceptionally, St. 14, located in the partially collapsed caldera, which is now Darwin Bay, off the Island of Genovesa in the northeastern region of the archipelago, had water-column characteristics distinct from the surrounding waters and was therefore not included in the analysis. Additionally, we investigated a red tide bloom event located in the western part of Isabella Island in Elizabeth Bay (St. RT).
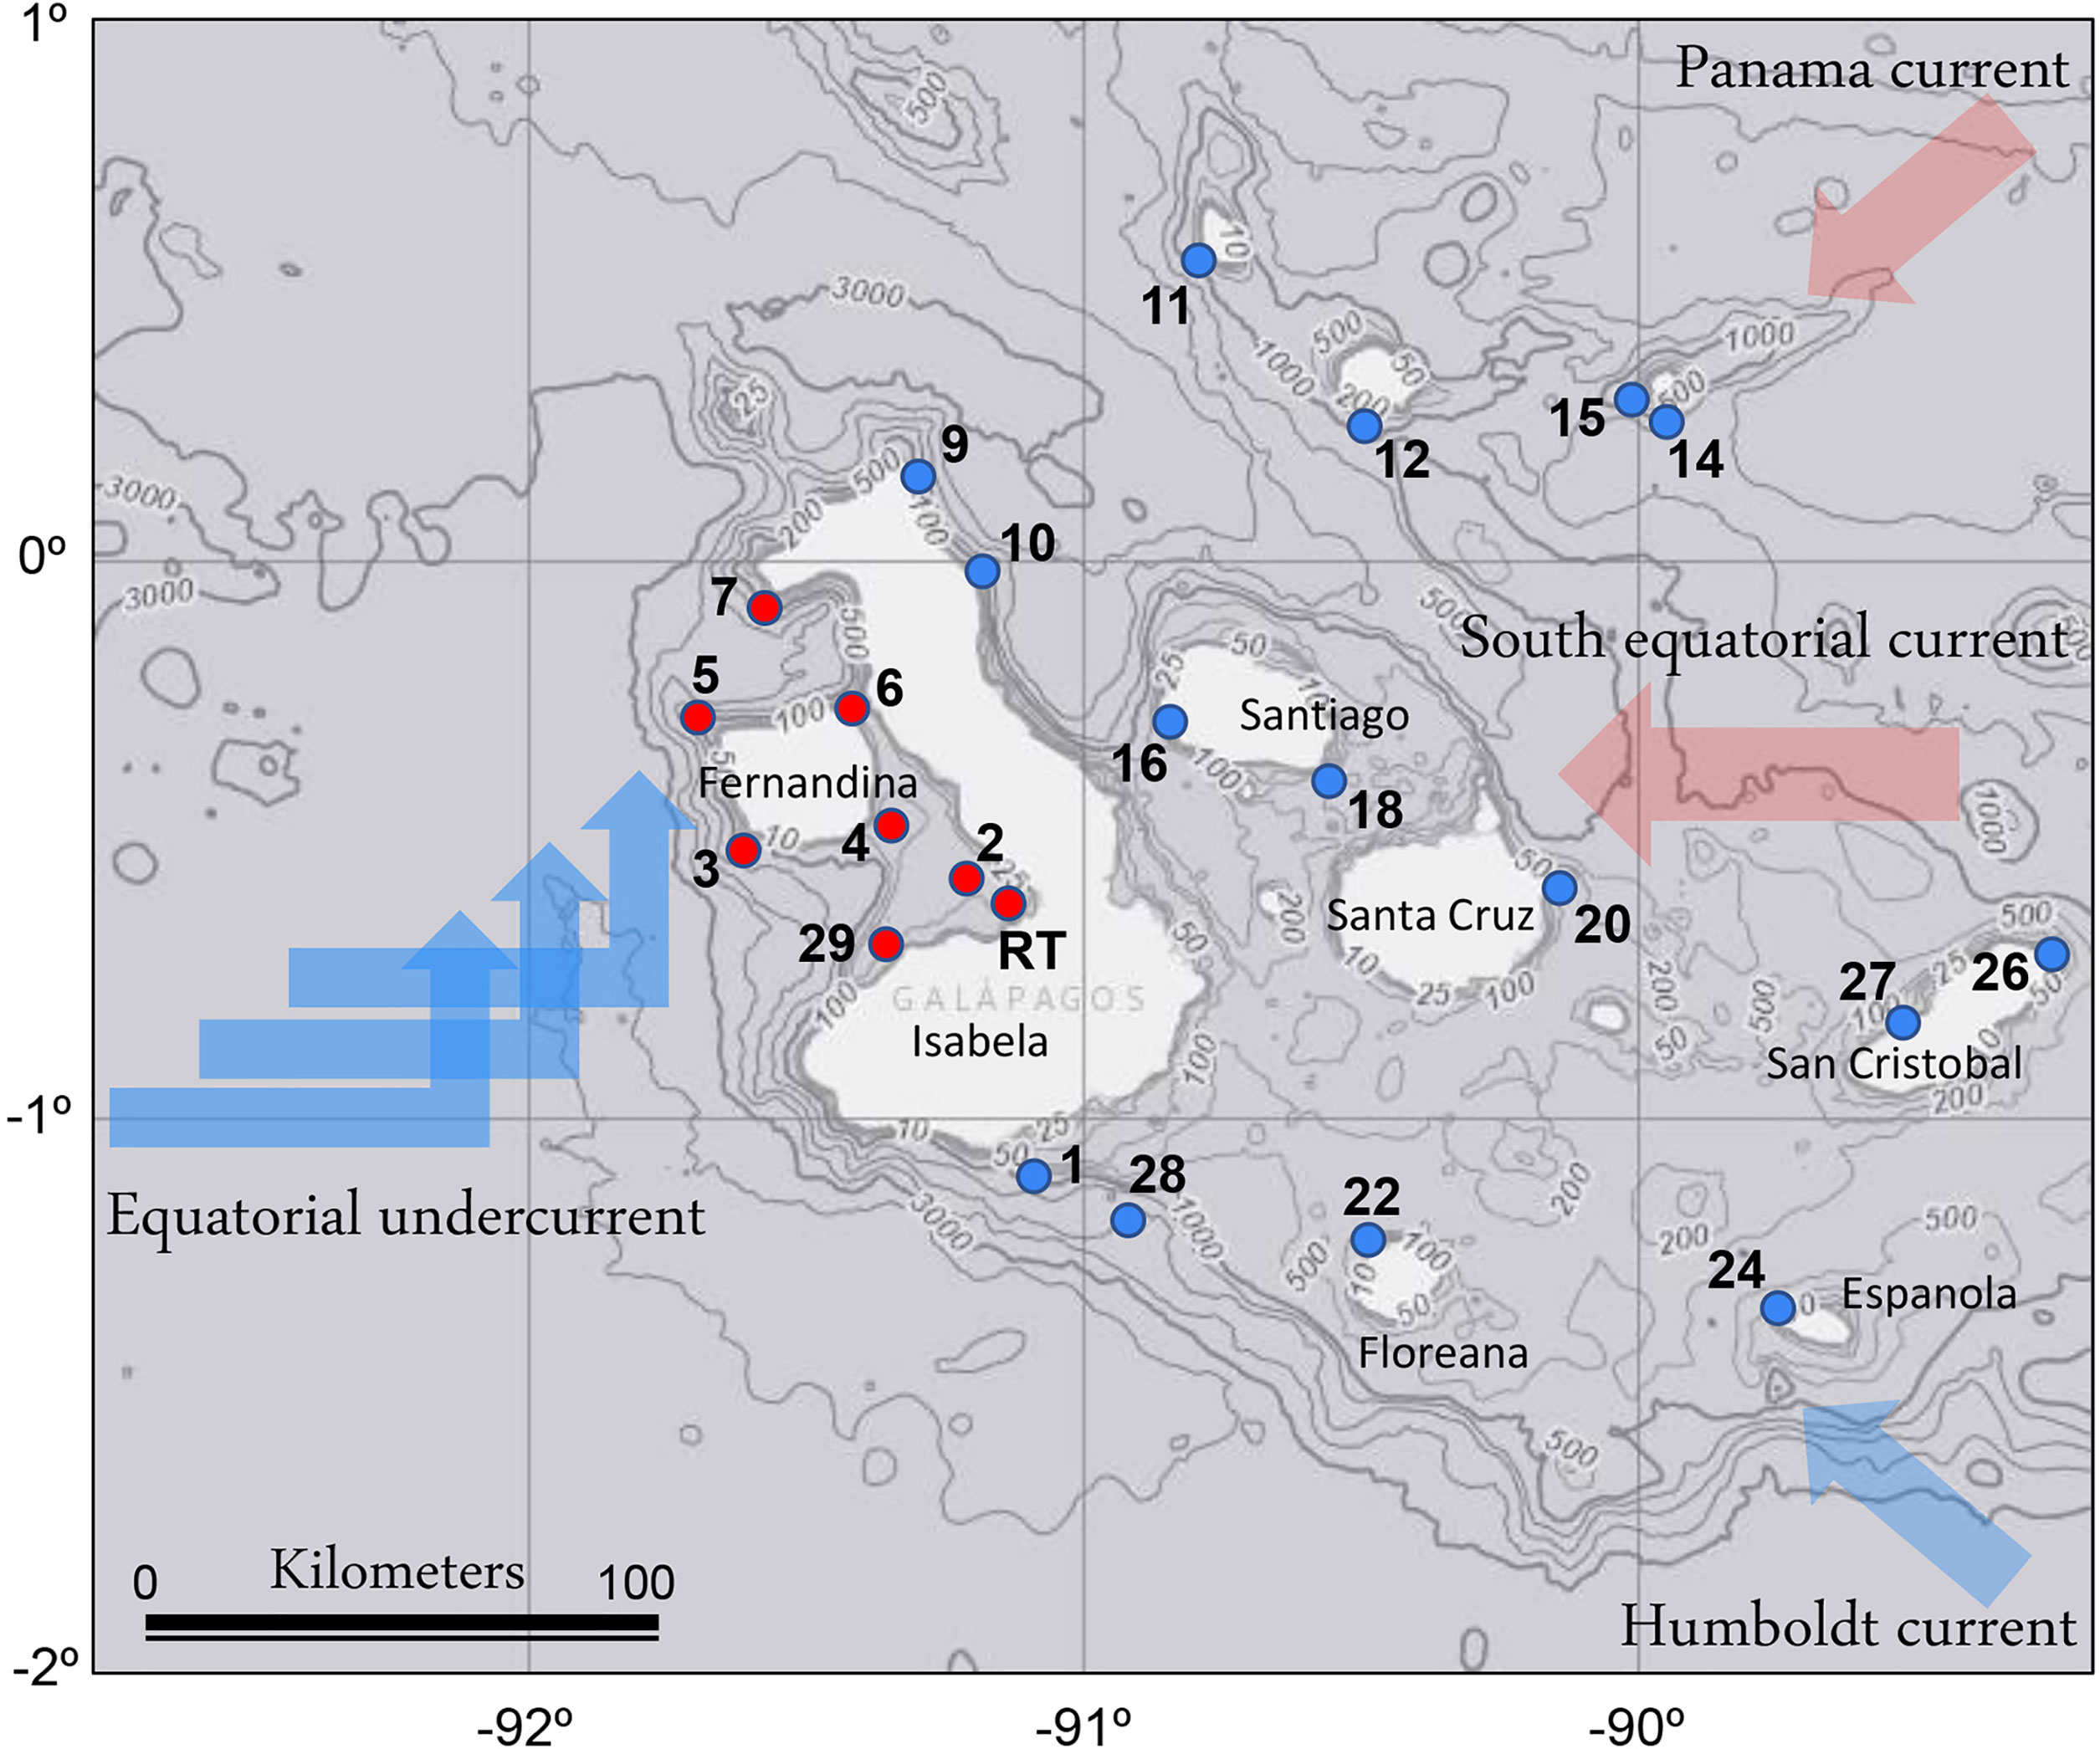
Figure 1 Locations of sampling sites in the Galápagos Archipelago. The major oceanographic currents bringing primarily cold (blue) and warm (pink) waters to the region are indicated. Red circles indicate the Equatorial undercurrent upwelling (EUC) sites, and blue circles indicate the eastern region sites. The map is overlayed on NOAA bathymetry (https://maps.ngdc.noaa.gov/viewers/bathymetry/). RT indicates the red tide bloom site.
Temperature, salinity, and photosynthetic active radiation (PAR) profiles were obtained by CTD (SeaBird SBE 19plus) casts to approximately 100 m depth. Based on the measured PAR, discrete water-column samples from four light depths within the euphotic zone at ∼50%, 30%, 10%, and 1% of incident irradiances (Io) were collected using 10 L Niskin bottles. Chlorophyll-a (Chl-a), dissolved and particulate nutrients, 13C-DIC primary productivity, and 15N-NO3 uptake rates were analyzed using the collected waters. Samples for 18S rRNA gene amplicon analyses and cell counts preserved in Lugol’s iodine solution (final concentration of 2%) were collected at the 50% Io depth of each site where discrete water samples were collected. Processed DNA filters and samples were frozen at -20°C and the Lugol’s solution fixed plankton samples were stored in the dark at 4°C until further analysis.
Analyses of the Collected Samples and Seawater Properties
To distinguish between contributions of small-sized phytoplankton such as flagellates, including picoeukaryotes, and relatively large-sized phytoplankton such as diatoms and most dinoflagellates, size-fractionated (<5 μm and ≥5 μm) Chl-a samples, as a proxy for phytoplankton biomass, were obtained from 400 mL of seawater passed through a filter cascade containing a 5-μm polycarbonate filter (47 mm, Millipore, Burlington, MA, USA) by gravity filtration and 0.7-μm nominal porosity glass fiber filter (25 mm, Whatman GF/F) under gentle vacuum pressure (< 100 mmHg). Chl-a extraction was performed using 90% acetone and incubated in the dark at -20°C for 24 h. Raw fluorescence values of the Chl-a extracts were measured by fluorometry with a Turner Designs 10-AU fluorometer according to the methods of Parsons et al. (1984).
Dissolved nutrient and Si[OH]4 concentrations were measured using a OI Analytical Flow Solutions IV auto-analyzer (Parsons et al., 1984). A total of 15 mL of seawater for each sample was filtered through a GF/F filter (25 mm), using acid-washed syringes into a polypropylene FalconTM tube. Nutrients were measured by the Wetlands Biogeochemistry Analytical Services at Louisiana State University with detection limits of 0.09 μM for , and 0.02 μM for Si(OH)4. Reference standards for dissolved nutrients in seawater were run for quality control.
Size-fractionated (<5 μm and ≥5 μm) particulate organic carbon (POC), particulate organic nitrogen (PON), DIC uptake rates and uptake rates were obtained by spiking 618 mL of subsamples with 120 μmol L-1 NaH13CO3 and 0.5 μmol L-1 Na15NO3 and incubated for 24h in flow-through transparent incubators covered with neutral density screening as according to the light intensity observed at the depth the samples were collected (Slawyk et al., 1977). Stable isotope additions were meant to target additions of 10% of ambient concentrations assuming DIC concentrations of 1200 μmol L-1 and average concentrations of 5 μmol L-1. At sites where sampled depths had concentrations below 5 μmol L-1, uptake rates may have been stimulated by the isotope addition and therefore would reflect potential rather than absolute uptake rates. Following incubation, samples were filtered through a filter cascade containing a 5 μm polycarbonate filter (47 mm, Millipore, Burlington, MA, USA) by gravity filtration and a pre-combusted (450°C for 5 h) GF/F filter (25 mm) by gentle vacuum (<100 mmHg). Particulates collected on the 5 μm filter were then rinsed onto an additional pre-combusted GF/F filter (25 mm) using an artificial saline solution. Filters were stored at -20°C until laboratory analysis. In the lab, filters were dried in an oven at 60°C for 24 h and pelletized using tin squares (Elemental Microanalysis). POC, PON, and atom % of 15N and 13C were then quantified from this filter using an elemental analyzer paired with an isotope ratio mass spectrometer (EA-IRMS) at the UC Davis Stable Isotope Facility. Dissolved nitrate concentrations, PON, POC and 15N and 13C atom percentages were used to calculate volumetric uptake and DIC uptake rates of the different size fractions as according to Dugdale and Goering (1967).
The depths of the mixed and subthermocline layers were determined using temperature and salinity profiles. SeaBird’s SeaSoft software was used to correct all CTD casts. The sw pden() function from the Mixing Oceanographic toolbox v 1.8.0.0 in MATLAB was used to calculate potential density (R2017b). A consistent density structure was observed, made up of an almost uniform density surface and deep layer separated by a density gradient (interfacial layer) that was typically tens of meters thick. The depth of the mixed layer was determined as the depth at which the density change from the surface was > 0.35 kg m-3. The depth of the subthermocline layer (the top of the deep layer of uniform density) was calculated by measuring the depth at which the density change from the bottom of the cast was > 0.2 kg m-3. The detailed process for calculating seawater properties from CTD cast measurements was performed according to protocols used previously by Neave et al. (2021).
Satellite Data
Satellite-derived sea surface temperature (°C), Chl-a (μg L-1), and POC (μmol L-1) data on a 0.025° grid were obtained from the MODerate-resolution Imaging Spectroradiometer (MODIS) on board the National Aeronautics and Space Agency Aqua satellite platform. Daily averaged sea surface temperature, Chl-a, and POC were collected to reflect hydrologic conditions of the Galápagos Archipelago during the survey period. These data were downloaded from the NOAA CoastWatch Browser and are presented using Ocean Data View software (Schlitzer, 2013).
DNA Extraction, Amplicon Sequencing, and Sequence Analysis
Four liters of seawater was filtered under gentle vacuum pressure (< 100 mmHg) through 0.45-µm NES membrane filters (Pall, 47 mm). For DNA extractions, filters were extracted using the Qiagen DNeasy Plant Mini Kit (Qiagen, Hilden, Germany) according to the manufacturer’s instruction with an initial bead beating step. Extracted DNA was quantified on a Qubit using the Qubit DNA Assay Kit (Invitrogen, NY, USA) and stored at -20°C prior to polymerase chain reaction (PCR).
DNA was diluted 1:10 and amplified with PCR primers (Forward: 5′-CCAGCA(G/C)C(C/T)GCGGTAATTCC-3′, Reverse: 5′-ACTTTCGTTCTTGAT-3′) targeted for the V4 region of the 18S rRNA gene (Lin et al., 2017). All primers used in the PCR include universal linker primer sequences, which were used to link to Illumina adapters and barcodes in the downstream library preparation process (Neave et al., 2021). Samples were amplified in triplicate using half reactions of Takara hot start Ex-Taq buffer with 2 μL dNTPs, 2.5 μL of 10X buffer, 0.4 μL of forward and reverse primers, 0.125 μL of Taq, 2 μL of DNA template, and 17.6 μL of Milli-Q water to bring the reaction volume to 25 μL. The following thermocycler settings were used with a 9902 Veriti 96-well thermal cycler (Thermo Fisher Scientific): 1 cycle of 98°C for 1 min, 4 cycles 94°C for 30 s, 45°C for 45 s, 72°C for 1 min, 30 cycles of 94°C for 30 s, 57°C for 45 s, 72°C for 1 min, 1 cycle of 72°C for 2 min. The amplicon was then confirmed by 1% agarose gel electrophoresis to ensure a clear band was formed. Products were cleaned with the Qiaquick PCR Purification Kit (Qiagen, Hilden, Germany). The purified products from 23 sites were submitted for sequencing at Genewiz Inc (South Plainfield, NJ) on a single lane of Illumina MiSeq platform.
The sequencing output was demultiplexed using tools from QIIME 1.9.1 and Cutadapt 1.18 then analyzed using the software pipeline QIIME 2.0 (Martin, 2011; Bolyen et al., 2019). Reads were trimmed, assembled and quality controlled. De-multiplexed paired-end reads were denoised, paired ends were joined, and chimeras were removed using DADA2 (Callahan et al., 2016). Joined sequences were clustered into amplicon sequence variants (ASVs). Taxonomic assignment of the clustered ASVs was performed against the SILVA 132 database using default parameters (Quast et al., 2012). ASVs classified as Metazoans were removed from the analyses. For the functional classification in relation to trophic modes, the ASVs of dinoflagellates were assigned at the species/genus levels and those of other protists generally at order/class levels according to the references. If the dinoflagellate genus is known to have at least one mixotrophic species, the genus was classified as a potential mixotroph. The various ASVs belonging to Syndiniales were categorized by several groups.
To further identify species of the dinoflagellate genus Scrippsiella, which dominated the red tide in Elizabeth Bay, at the species level, single cells from the Lugol’s solution fixed sample stored at 4°C were isolated in a 0.2-mL PCR tube containing 15 μL of Milli-Q water. The tube was frozen at -80°C for 3 min to rupture the cell membranes and subsequently thawed. PCR amplification was conducted using 5 μL of 10X Ex Taq buffer, 4 μL of 2.5 mM dNTP mix, 0.25 μL of 5 U/μL ExTaq polymerase (RR006A, Takara Bio, Madison, WI), 0.2 μM of primers for the ITS region of rDNA; ITSF2 and LSU500R (Litaker et al., 2003). The PCR protocol included one cycle of 95°C for 5 min, 38 cycles of 95°C for 40 s, 59°C for 2 min and 72°C for 1 min, with one cycle of 72°C for 5 min. Products containing a clear single band were then cleaned with the Qiaquick PCR Purification Kit (Qiagen, Hilden, Germany). For phylogenetic analysis, multiple sequences including two of the Galápagos’ Scrippsiella were aligned using native implementation of ClustalW in MEGA v.4.0 (Tamura et al., 2007) and then refined manually. The analysis was inferred by Maximum-likelihood (ML) analysis using the RAxML 7.0.3 program (Stamatakis, 2006) and Bayesian analysis using MrBayes v.3.1 (Ronquist and Huelsenbeck, 2003) (see Jang et al., 2018 for more details).
Cell Identification and Abundance Estimation
Light microscopy was used to further identify and enumerate dominant protistan species. For microscopic cell counts, 50 mL subsamples preserved in Lugol’s solution were concentrated by sedimentation using Utermöhl chambers for >24h (Utermöhl, 1958). Cell counts of recognizable dinoflagellate and diatom genera were carried out using an Olympus CKX-31 inverted microscope on a minimum of 200 total cells in at least ten fields of view at 200× and 400× magnification.
Statistical Analyses
To statistically compare the spatial differences between oceanographic variables and 18S rRNA gene read-based protistan taxa observed in the EUC upwelling and eastern region sites, t-tests were performed using the statistical software package SPSS ver. 25.0 (IBM Corp., Armonk, NY, USA). Furthermore, non-metric multidimensional scaling (NMDS) was performed to visualize pairwise dissimilarity between communities across the sites sampled. Environmental factors were fitted onto the NMDS ordination to represent how oceanographic and productivity variables influence spatial patterns in protistan communities using the envfit-function. To determine whether statistically significant differences were observed between the EUC and eastern regions, a one-way analysis of similarities (ANOSIM) test was utilized. Both NMDS and ANOSIM analyses were performed using the vegan package in R-4.1.2.
Results
Physical and Chemical Properties of the Water Column
The satellite-derived sea surface temperatures (SST) during the 2018 sampling period displayed a clear regional contrast between sites in the EUC upwelling influenced region and sites in the eastern region (Figure 2A). Both surface concentrations of Chl-a and particulate organic carbon (POC) observed by remote sensing were higher in the EUC region, especially in Elizabeth Bay, consistent with the observed red tide bloom (Figure 2B, C). Concentrations of nutrients were higher in the mixed layer (depth sampled at 50% incident irradiance, Io) of the EUC region, while those of the other sites were more variable and often oligotrophic (Figure 2D–F). Generally, the seawater temperatures in the upper 100 meters had a significant negative relationship with the measured nutrient concentrations (i.e., nitrate, phosphate, and silicic acid; all p <0.01) (Supplementary Figure 1).
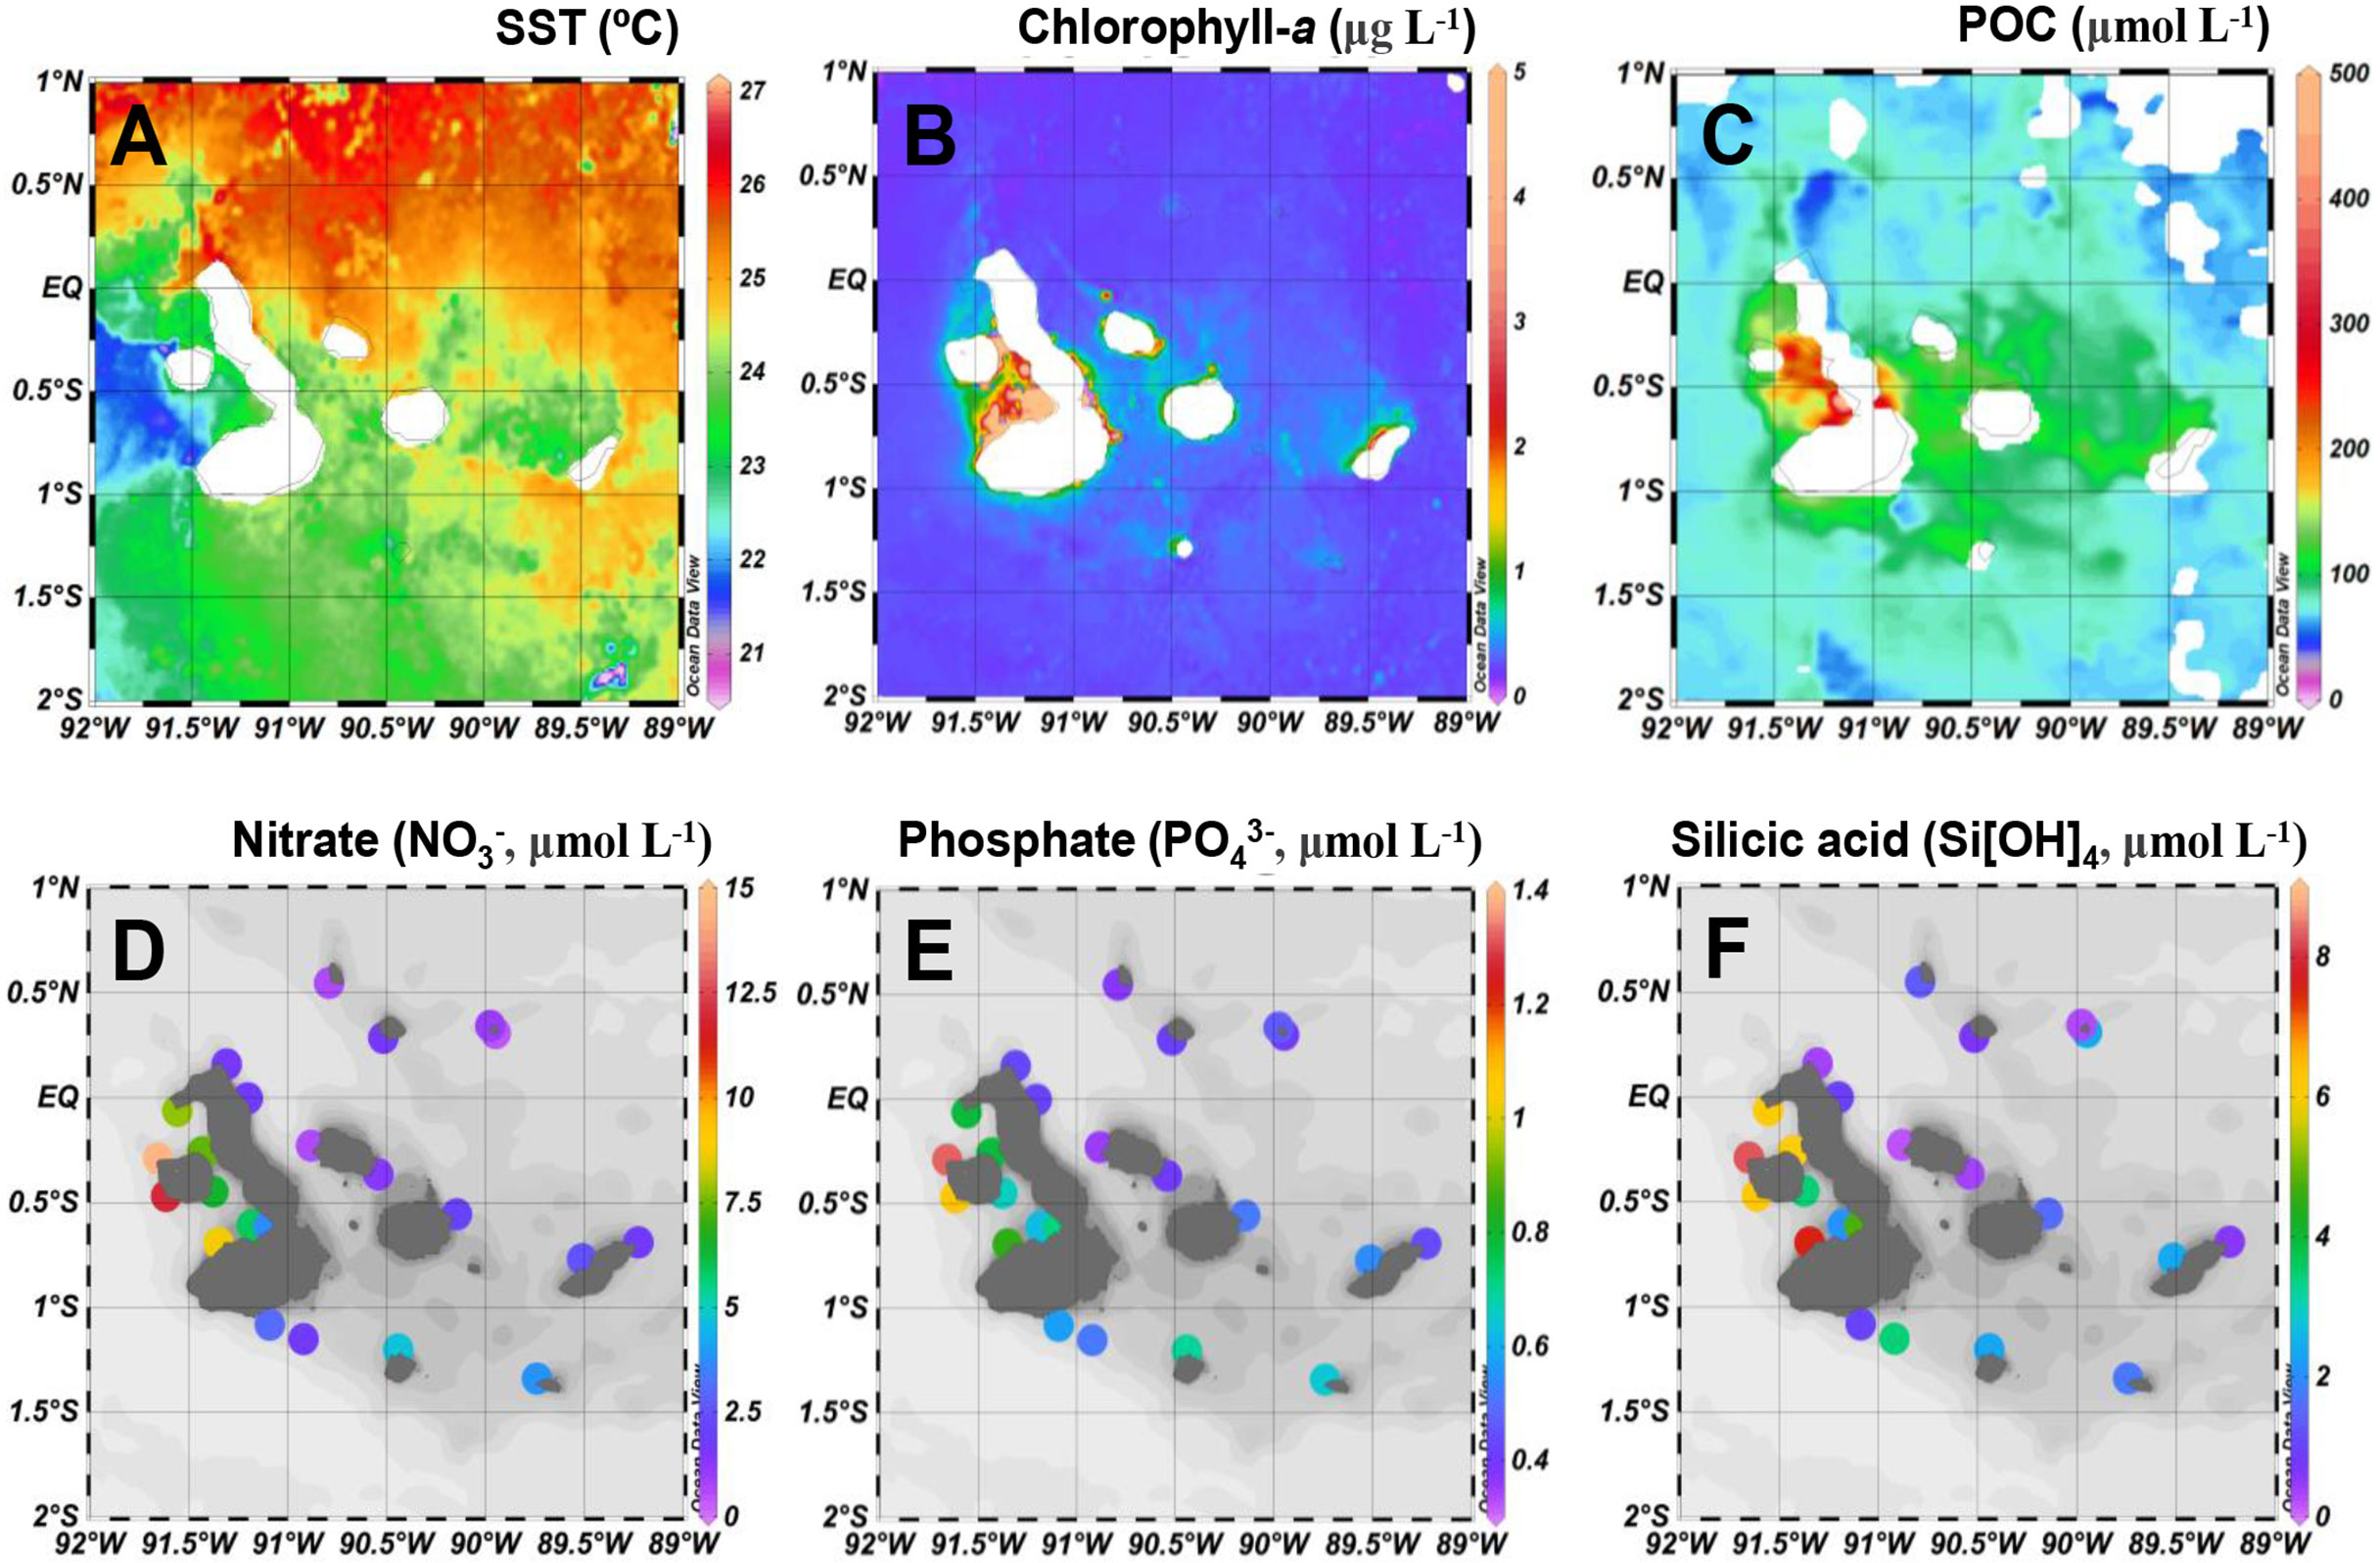
Figure 2 Spatial distribution of (A) sea surface temperatures (SST, °C), (B) chlorophyll-a (μg L-1), and (C) particulate organic carbon (POC, μmol L-1) concentrations derived from remote sensing during the survey period and dissolved nutrient concentrations (μmol L-1) for (D) nitrate (E) phosphate ,and (F) silicic acid (Si[OH]4) measured in the mixed layer (50% incident irradiance depth).
In the EUC upwelling region, the averaged depths of the mixed layer and subthermocline layer were 8 m and 48 m, respectively, which were shallower than those of the other sites in the eastern region at 23 m and 67 m, respectively (Figure 3 and Supplementary Table 1). The average water temperature difference between the upper layer and the deep layer was 2.2°C and 6.8°C in the EUC upwelling and other eastern region sites, respectively, indicating a relatively stronger degree of stratification in the latter. The average nitrate concentrations in the upper and deep layers in the EUC region were 8.9 μmol L-1 and 10.4 μmol L-1, respectively, while the average nitrate concentrations in the eastern region differed remarkably from the upper layer (2.0 μmol L-1) to the deep layer (9.9 μmol L-1), indicating that a nitracline had been established (Figure 3 and Supplementary Table 1).
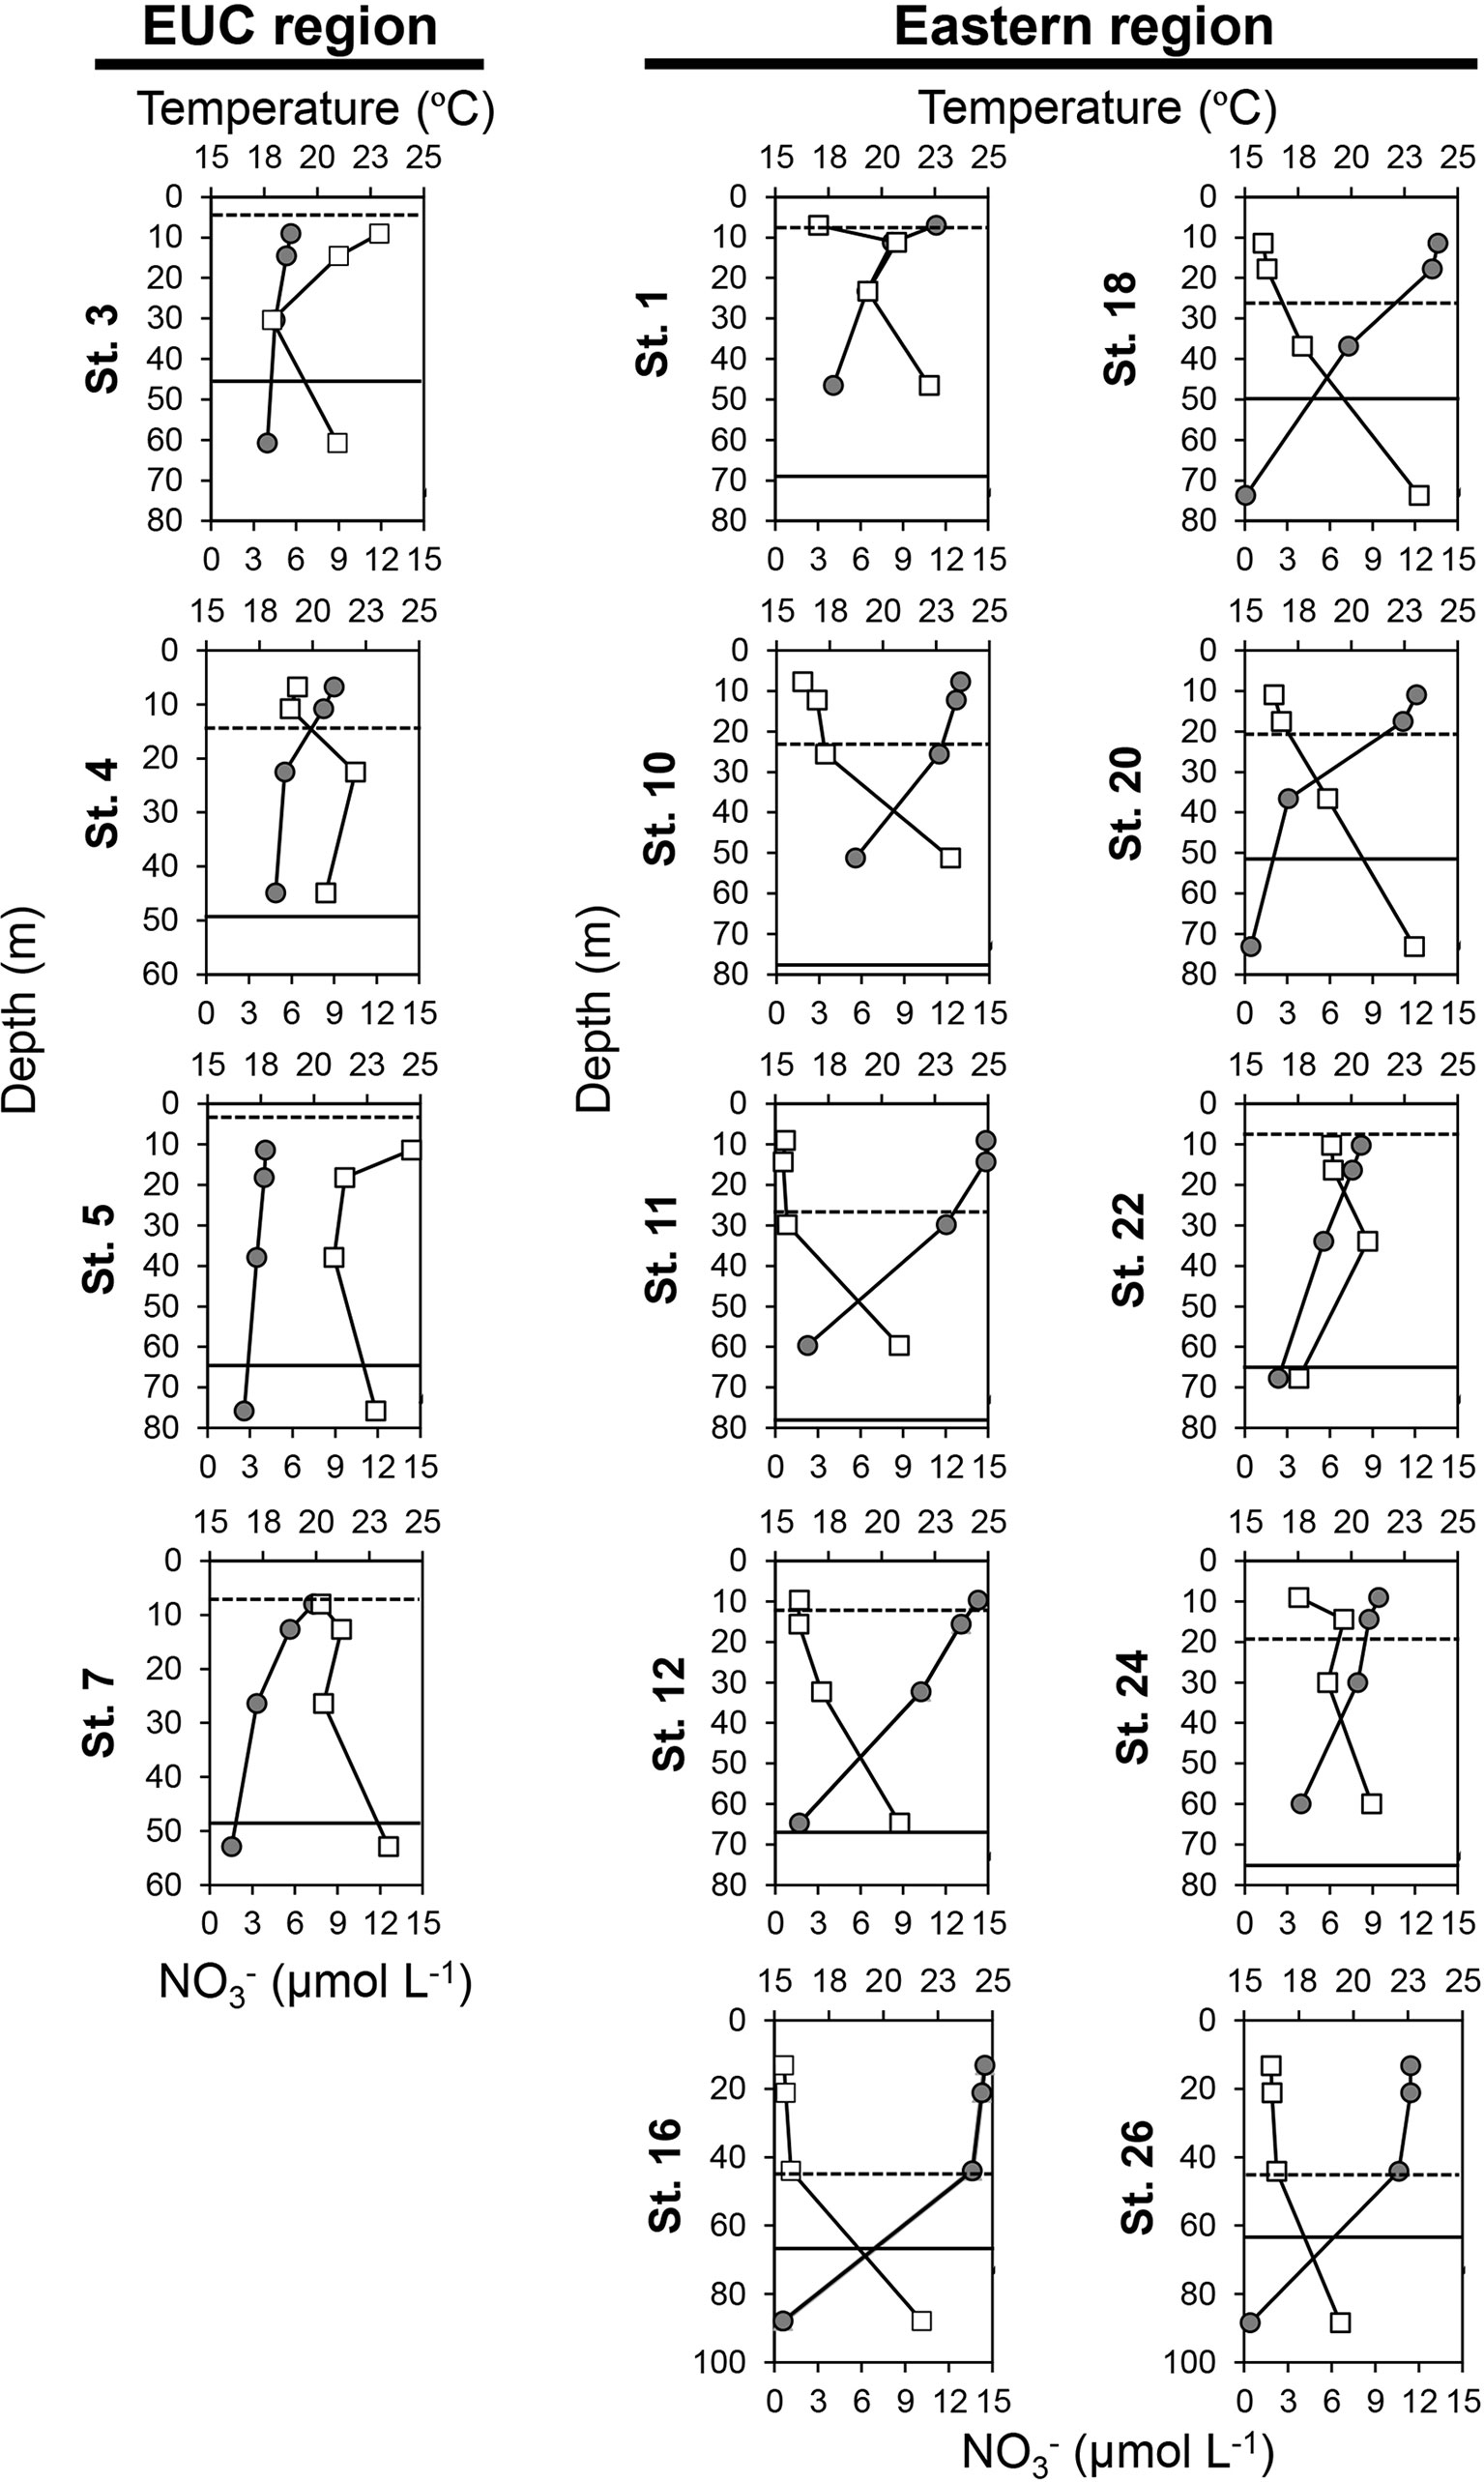
Figure 3 Vertical distribution of temperature (upper axis, closed circles, °C) and nitrate () concentrations (lower axis, open squares, μmol L-1) in the Equatorial undercurrent upwelling (EUC) region and eastern region of the Galápagos Archipelago. The y-axis represents the depth (m). The dotted and solid lines indicate depths of the mixed layer and subthermocline layer, respectively. Of the 23 sites surveyed, the sites where data were measured at multiple depths (50%, 30%, 10%, and 1% incident irradiance) are displayed. Full data are available in Supplementary Table 1.
Biological Properties of the Upper Layer
The measured surface biological variables were collected at 50% Io depth of the euphotic zone (Table 1). Both small (<5 μm) and large (≥5 μm) size-fractions of average Chl-a concentrations were significantly higher at EUC upwelling sites than the eastern region sites (t-test, both p <0.05). The concentrations of small size-fraction Chl-a were higher in most sites than those of the large size-fraction. With respect to particulate organic carbon (POC) and particulate organic nitrogen (PON) concentrations, there were no significant differences between the two regions. However, the average POC to Chl-a ratios for both small and large size-fractions were nearly twice as high in the eastern region sites compared to the EUC sites (t-test, both p <0.05). Similarly, the averaged PON to Chl-a ratios for both size-fractions were significantly higher in the eastern region sites (t-test, p <0.01 and <0.05, respectively).
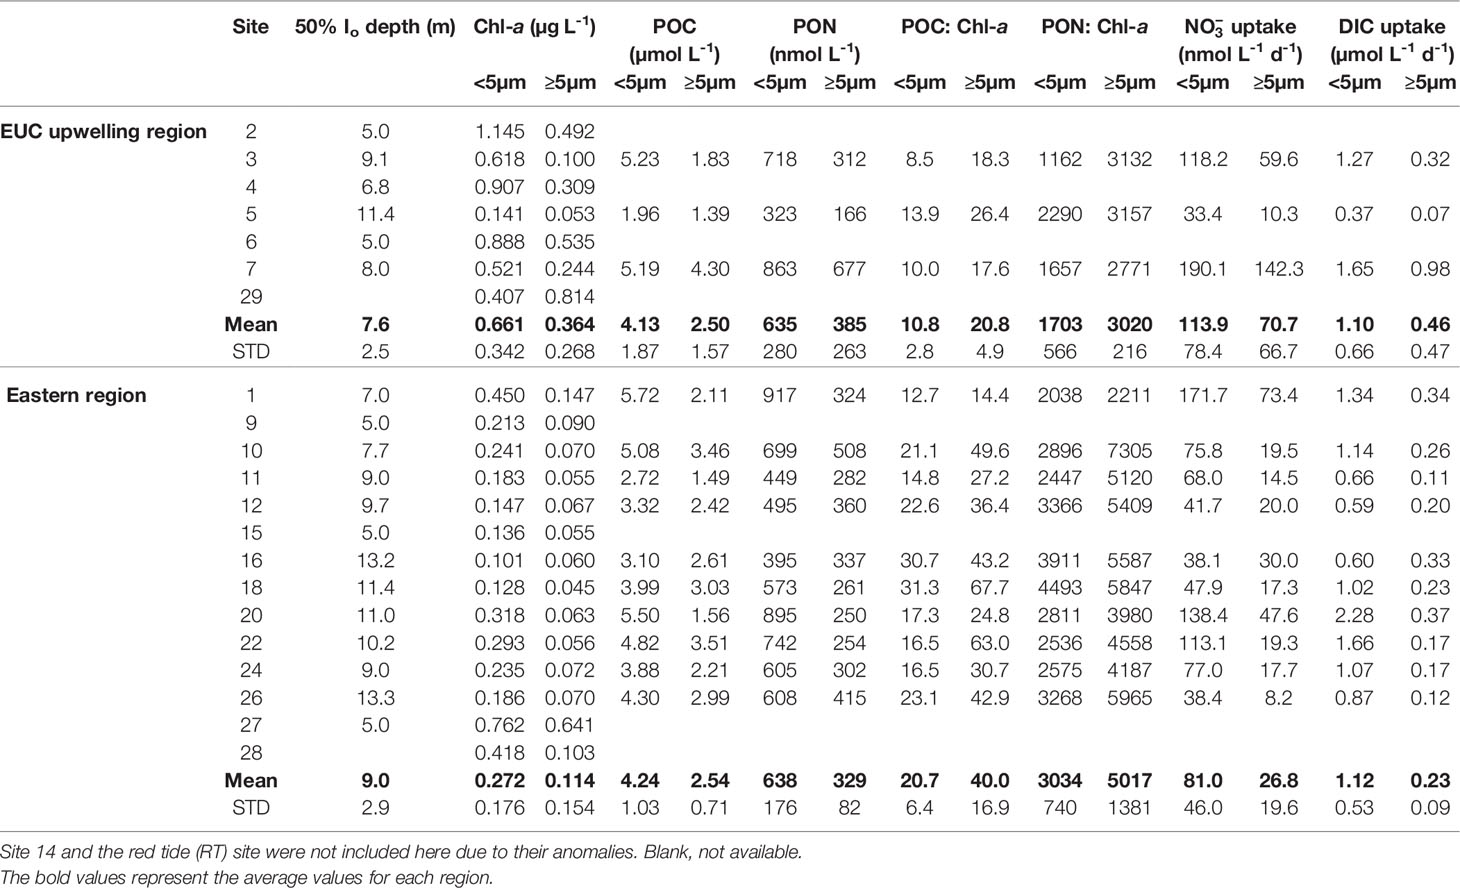
Table 1 Size-fractionated Chlorophyll-a (Chl-a), particulate organic carbon (POC), particulate organic nitrogen (PON), and nitrate and dissolved inorganic carbon (DIC) uptake rates in the mixed layer [50% incident irradiance (Io) depth] at sites in Galápagos Archipelago in October 2018.
The average mixed layer DIC and uptake rates of small cells (<5 μm) measured in both regions were only slightly different (Table 1). However, the average uptake rates of large cells (≥5 μm) in the EUC region sites were more than double those in the eastern region sites, although there were no significant differences due to large variability (t-test, both p >0.1).
Protistan Community Structure
Taxonomic assignment inferred from the V4 region of the 18S rRNA gene amplicon sequencing showed the relative dominance of Dinoflagellata and Chlorophyta followed by Syndiniales across both regions (Figure 4A). Dinoflagellata was the most abundant group in the EUC upwelling region (48 ± 23% of protistan reads), while Chlorophyta, consisting mostly of picoeukaryotic taxa, was the most dominant in the eastern region (30 ± 20%). Furthermore, there were several sites in the eastern region where members of the group Rhizaria were considerably abundant. We calculated the mean Shannon diversity between the EUC upwelling and eastern regions for alpha diversity analysis (Figure 4B). For general protistan taxa, the Shannon index inferred by the ASVs revealed no significant differences across regions, but the dinoflagellate and rhizarian groups did, with lower diversity of dinoflagellates and higher diversity of rhizaria in the EUC region (t-test, p <0.01).
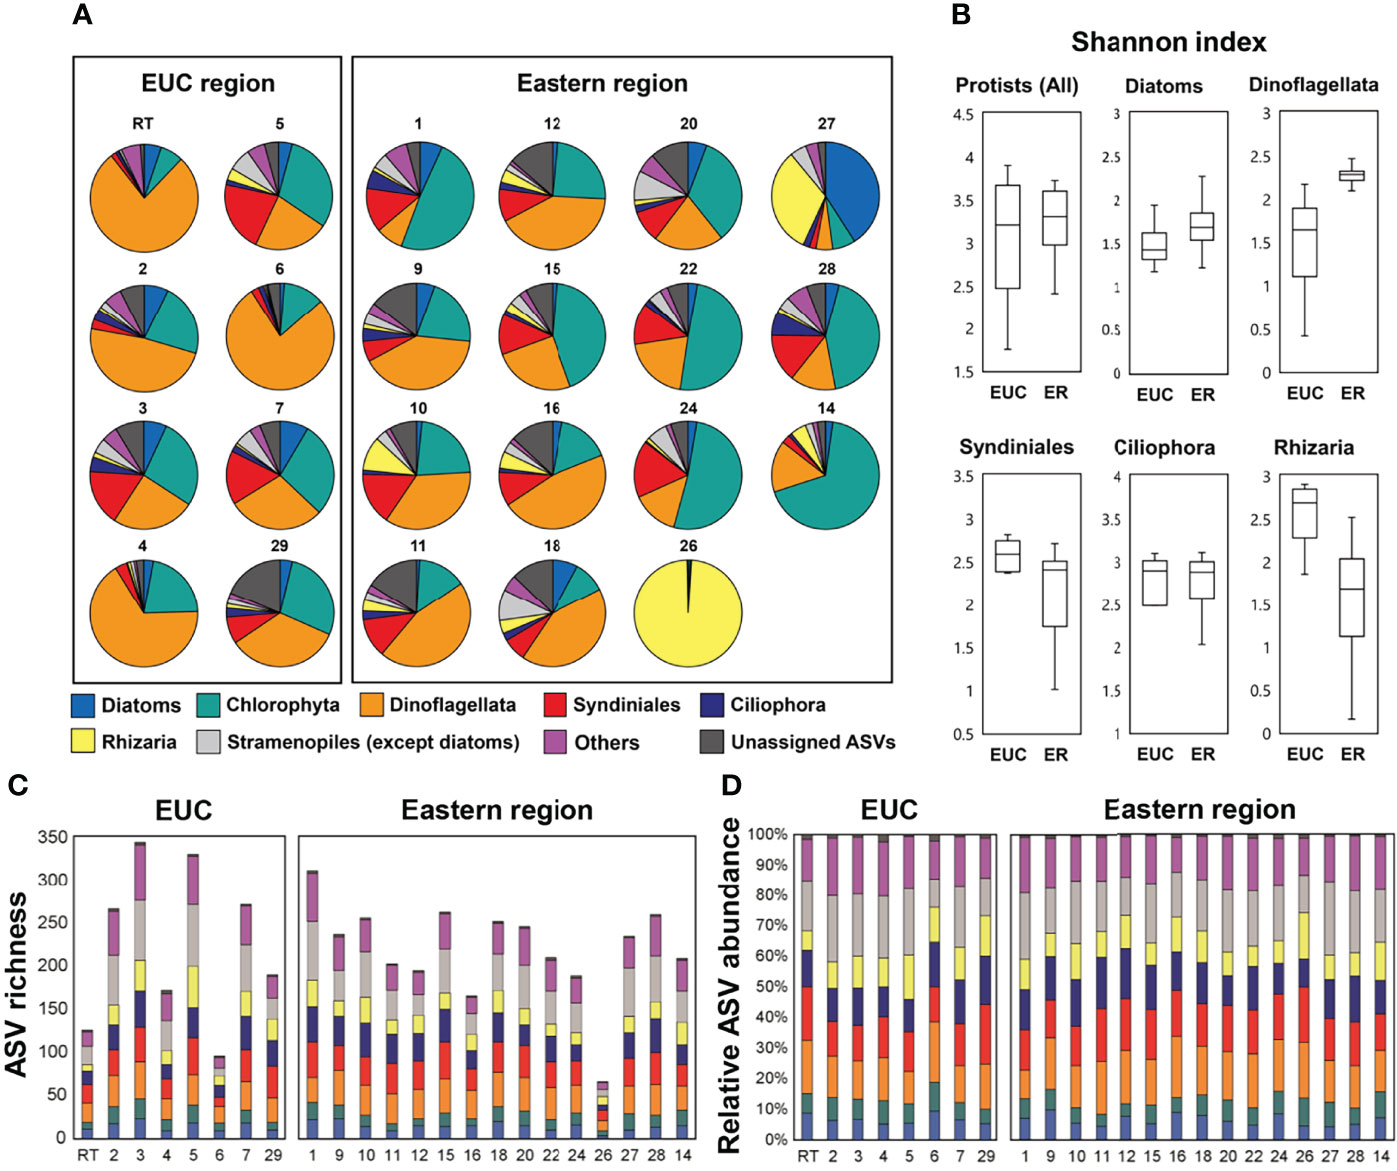
Figure 4 18S rRNA gene amplicon sequencing of higher ranked taxonomic groups of protistan communities at the sites within the Equatorial undercurrent upwelling (EUC) region and eastern region. (A) Taxonomic abundance based on read counts, (B) Box and whisker plots of the Shannon alpha diversity, (C) species richness and (D) relative abundance based on the number of ASVs.
Regardless of region, both species richness (i.e., the number of different ASVs; average of 222 ± 69) and relative abundance of the number of ASVs at most sites were similar (Figures 4C, D). In general, the most abundant ASVs across all regions were Stramenopiles, followed by Dinoflagellata and Syndiniales (Supplementary Table 2). However, three sampling sites (RT, 6, and 26) had considerably low richness (126, 96, and 66 ASVs, respectively). The overall richness within the EUC upwelling region was higher at the sites over the archipelago slope (i.e., St. 3, 5, and 7; average of 316 ± 39 ASVs) which may have been more directly affected by the upwelling water mass compared to the inner continental shelf sites (i.e., St. RT, 4, and 6; average of 165 ± 75 ASVs), where the value of the former were among the highest out of all surveyed sites.
NMDS analysis showed that samples were generally clustered by spatial differences between the EUC upwelling and eastern regions (Figure 5 and Supplementary Table 3). Also, the result indicated that nutrients, biomass (i.e., Chl-a, POC, and PON), and primary productivity measurements correlated more with the EUC region, whereas temperature and particulate carbon and nitrogen to Chl-a ratios correlated with the eastern region. Furthermore, ANOSIM analysis indicated that there was a marginal, yet significant difference in protistan communities between the two regions (R = 0.38; p <0.01).
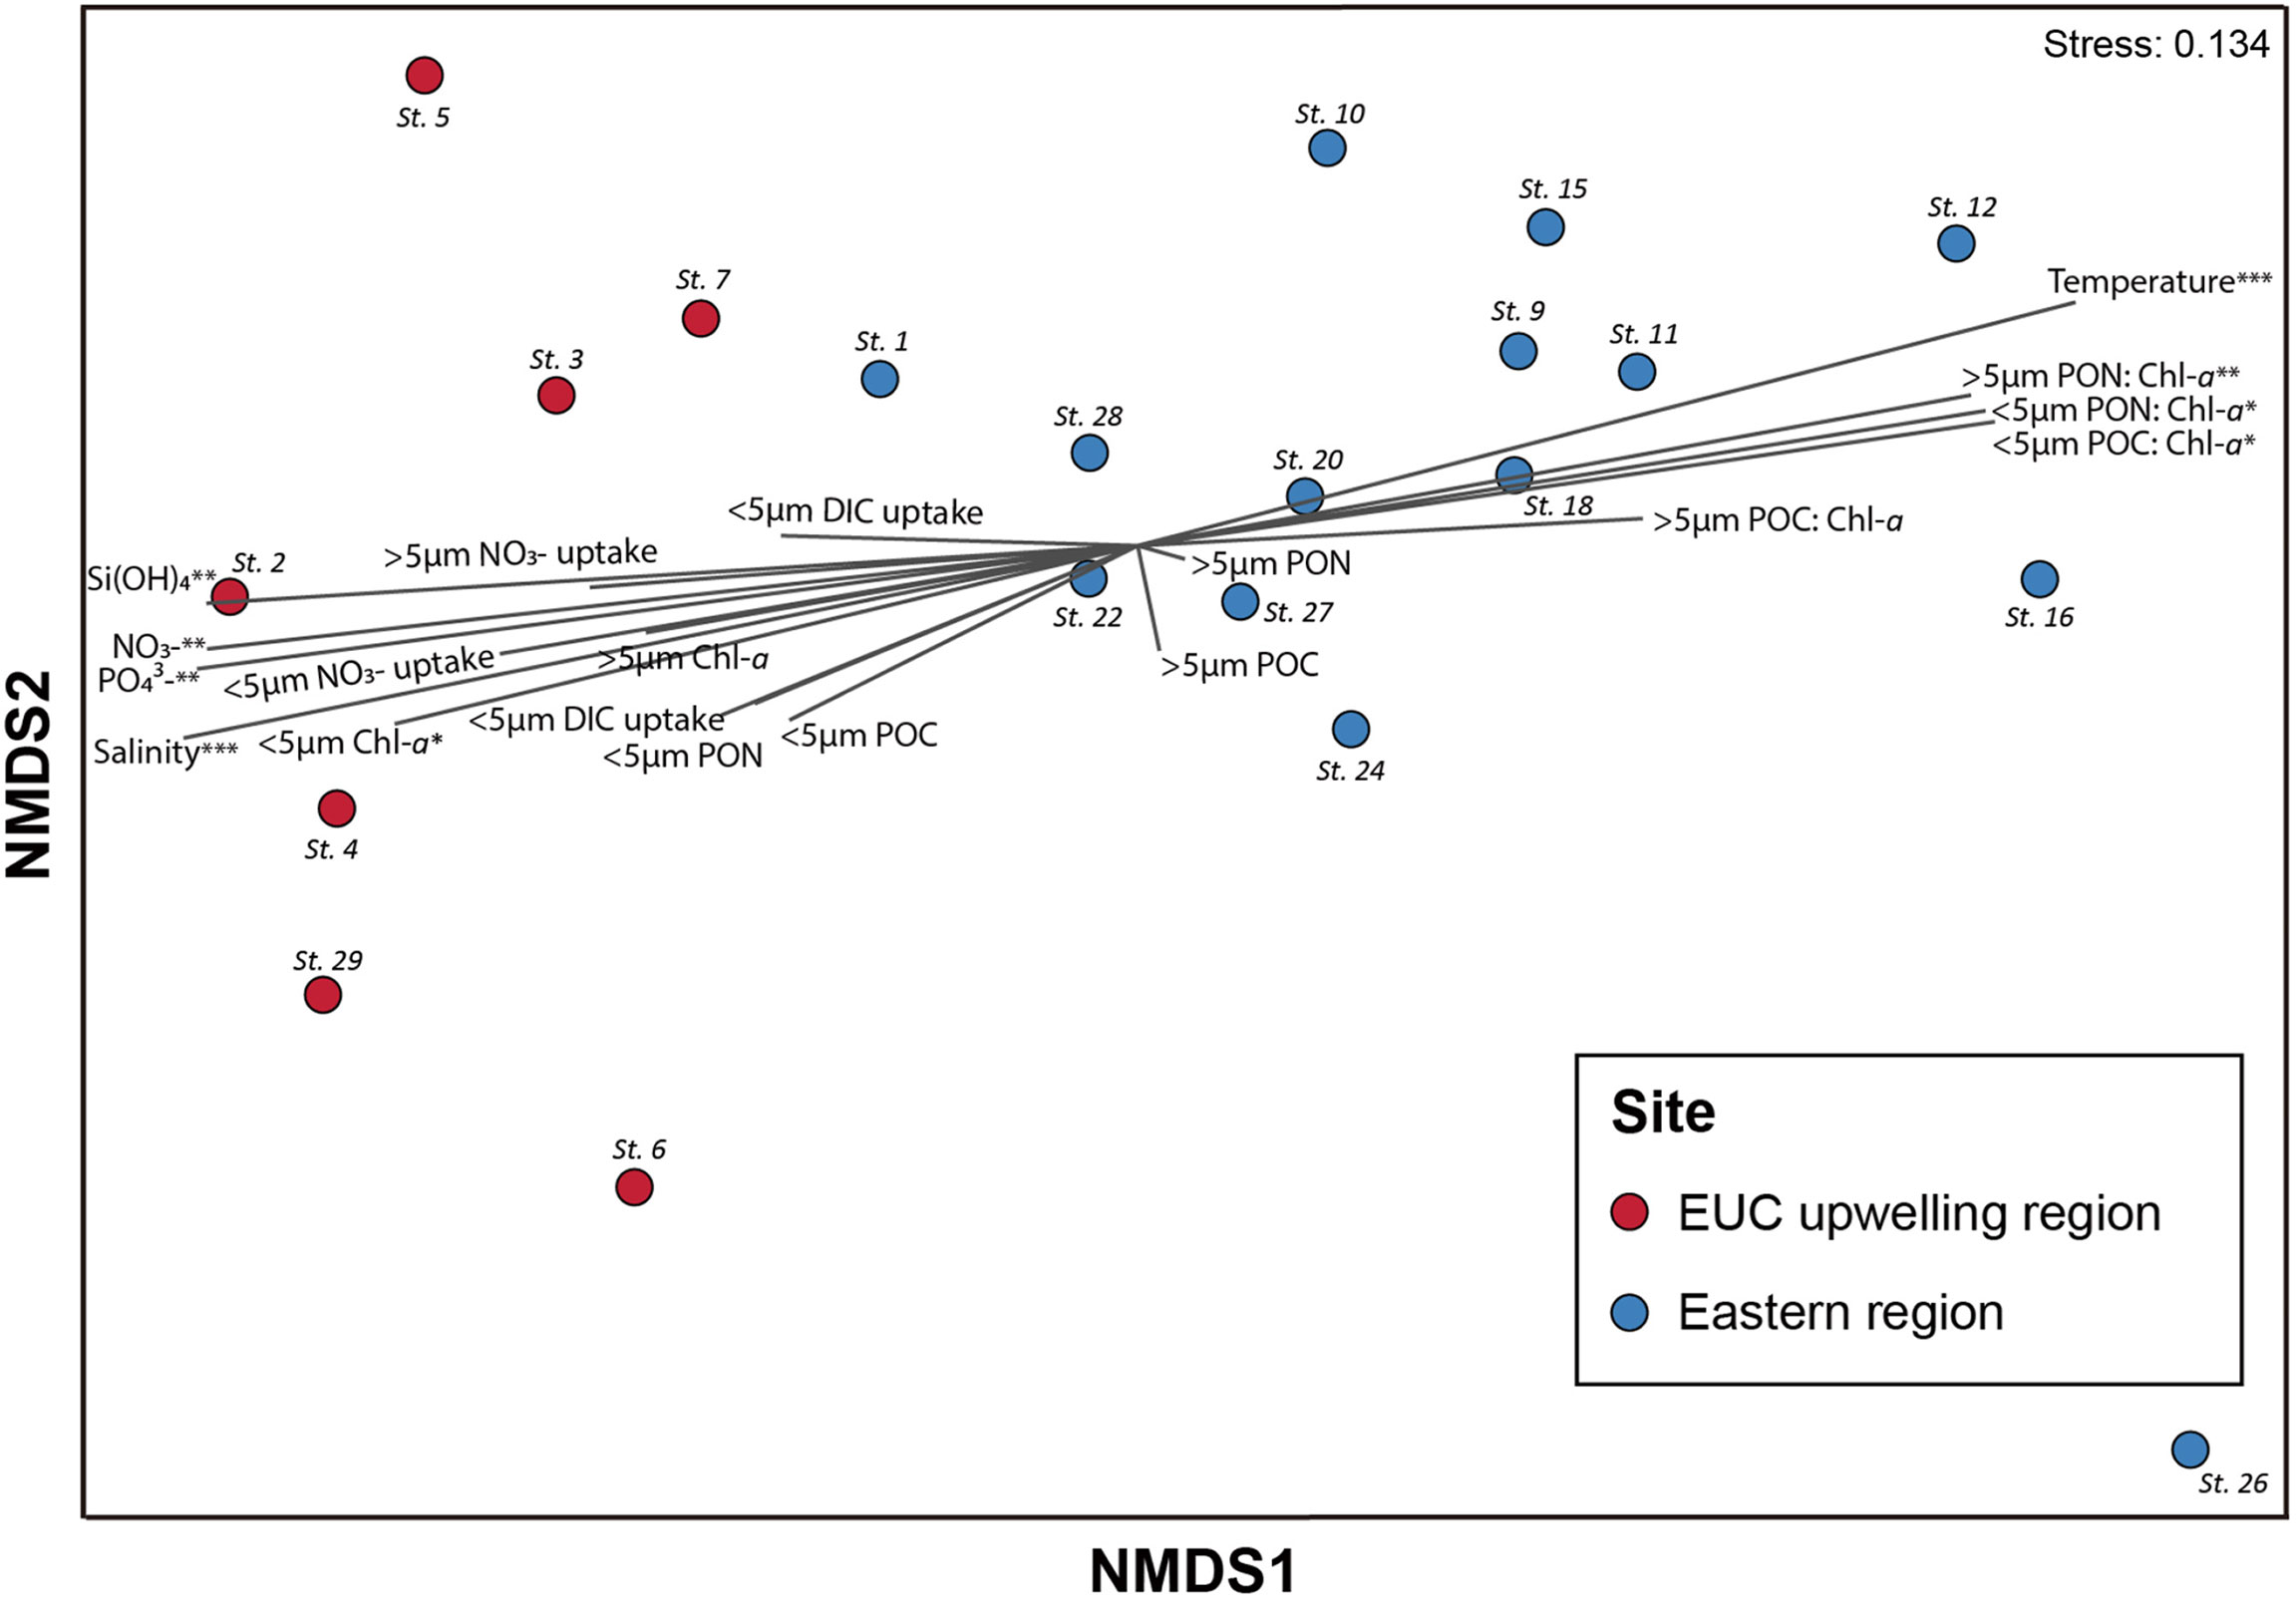
Figure 5 Non-metric multidimensional scaling (NMDS) of the protistan assemblages in the Galápagos Archipelago. NMDS (stress = 0.134) of samples based on protist composition determined by sequence reads obtained from DNA metabarcoding (V4 region of 18S rRNA gene). Samples were classified according to the sites collected: Equatorial undercurrent upwelling (EUC) region (red circle) and eastern region (blue circle) sites. Vectors illustrate the relative directions and magnitudes of oceanographic and productivity variables’ contribution to dissimilarities among samples. Asterisks indicate significance at p-values of less than 0.05 (*), 0.01 (**), and 0.001 (***). The R2 and p-values of each vector are provided in Supplementary Table 3.
An assessment of functional classifications of the protistan community and specifically the dinoflagellate group based on their trophic modes (i.e., autotroph, mixotroph, and heterotroph) was conducted (Figures 6A, B). At the whole protistan level, the averaged proportion based on read counts of heterotrophic protists in the eastern region (34 ± 19%) was higher than that of the EUC upwelling region (22 ± 11%). Similarly, the averaged proportion of heterotrophic dinoflagellates out of the entire dinoflagellate community was also higher in the eastern region (31 ± 12%) than the EUC upwelling region (18 ± 15%).
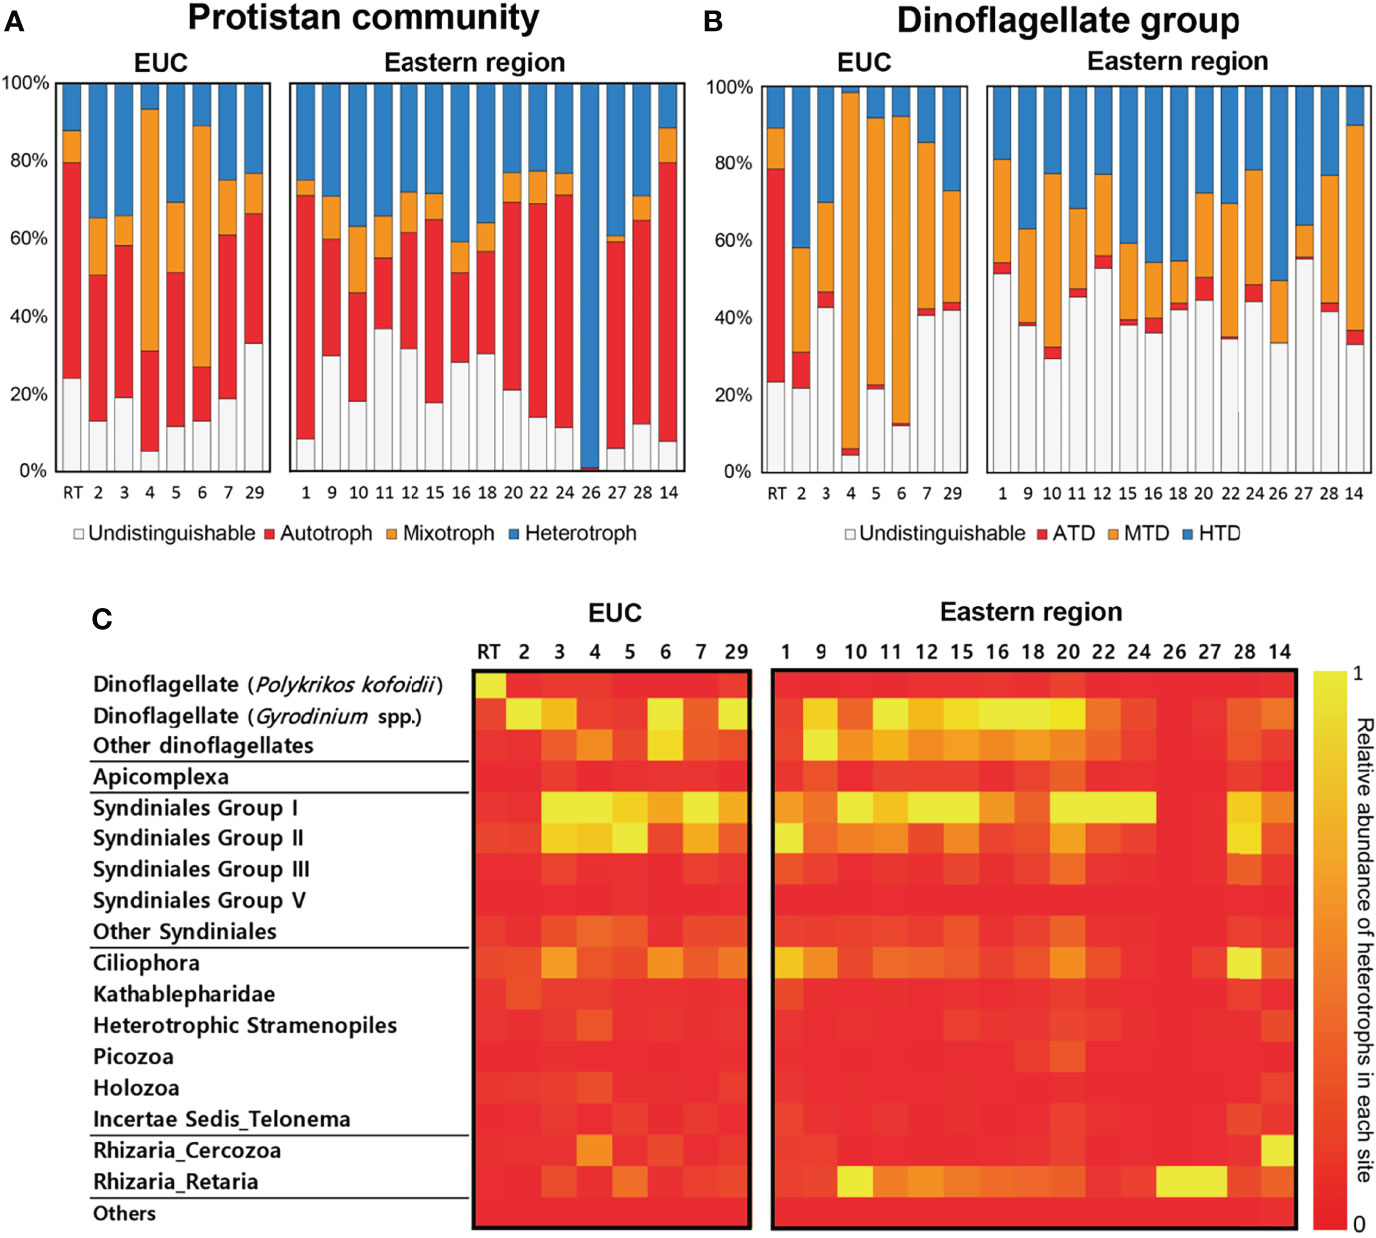
Figure 6 Functional classifications of the protistan community and the dinoflagellates in relation to their trophic modes based on read abundances of 18S rRNA gene amplicon sequencing. (A) Protistan community and (B) Dinoflagellate groups. ATD, autotrophic dinoflagellate; MTD, mixotrophic dinoflagellate; HTD, heterotrophic dinoflagellate. (C) Relative abundance of heterotrophic protists in each sample. Sites are separated by region where Equatorial undercurrent upwelling (EUC) sites are on the left and Eastern region sites are on the right. The trophic modes of dinoflagellates were annotated at the species/genus levels and for the other protists generally at order/class levels according to the cited references. If the dinoflagellate genus is known to have at least one mixotrophic species, the genus was classified as a potential mixotroph. See Supplementary Table 2 for detailed ASV information.
The number of 18S rRNA gene reads belonging to heterotrophic protists in each site showed a few noteworthy characteristics (Figure 6C). Firstly, free-living heterotrophic dinoflagellates including Gyrodinium spp., the parasitic Syndiniales groups and ciliates were commonly present across many of the surveyed sites regardless of region. However, the read counts of the heterotrophic dinoflagellate Polykrikos kofoidii were only present in appreciable densities at the red tide bloom site. Finally, the read counts of Rhizaria among heterotrophic protists was higher in the eastern region sites despite diversity being lower.
Cell Abundances of the Dominant Protistan Taxa
The dominant protistan taxa were further quantified by light microscopy-based cell counts (Table 2). Of the heterotrophic protists, the small-sized dinoflagellate Gyrodinium spp. (<40 μm) and small naked ciliates (20-50 μm) were commonly present across many of the surveyed sites. However, the large-sized dinoflagellates (e.g., Gyrodinium spp. larger than 40 μm in cell length and P. kofoidii) and large naked ciliates (50-100 μm and >100 μm) were primarily abundant at sites containing high levels of the large size-fraction phytoplankton biomass. The dominant protistan taxa observed at the red tide bloom site were the dinoflagellates Scrippsiella and P. kofoidii, with maximum observed cell densities of 3636 cells mL-1 and 132 cells mL-1, respectively, followed by small naked ciliates (45 cells mL-1). Also, the dominance of the diatom Cylindrotheca spp. (892 cells mL-1) was observed at St. 6 in the EUC upwelling region.
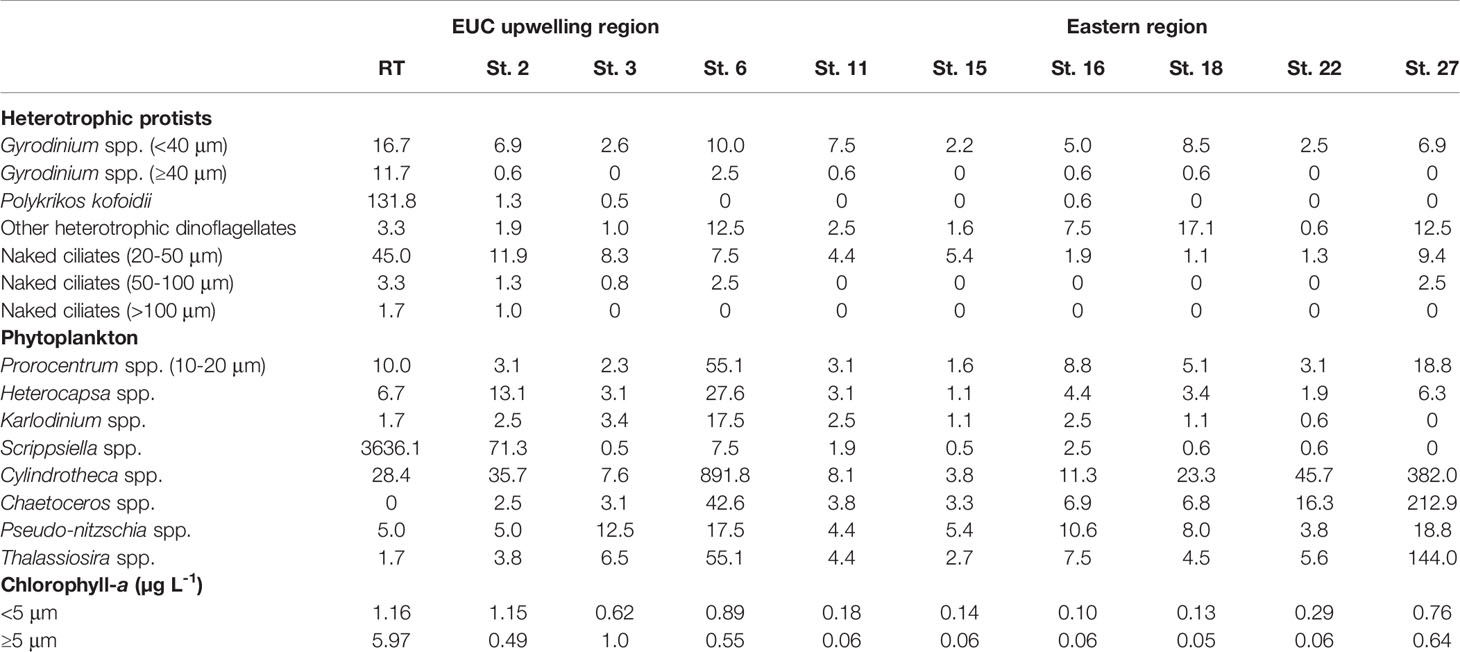
Table 2 Cell abundances (cells mL-1) of dominant phytoplankton taxa (>10 μm in cell length of dinoflagellates and diatoms) and heterotrophic protists during the survey period in 2018.
A Red Tide Bloom Event in Elizabeth Bay, Isabela Island
An intense red-pigmented bloom, mostly composed of the dinoflagellate Scrippsiella, was observed on October 1st 2018 on the west coast of Isabela Island in Elizabeth Bay (Figures 7A, B and Table 2). The dinoflagellate species Scrippsiella lachrymosa was identified by sequencing of the ITS regions of the rRNA genes from single cells of Scrippsiella (Supplementary Figure 2). The two analyzed sequences of Scrippsiella cells showed no genetic differences, indicating they were identical clones. Cells of the large dinoflagellate grazer P. kofoidii that appeared to have fed on S. lachrymosa cells were also commonly observed in the preserved samples (Figure 7C).
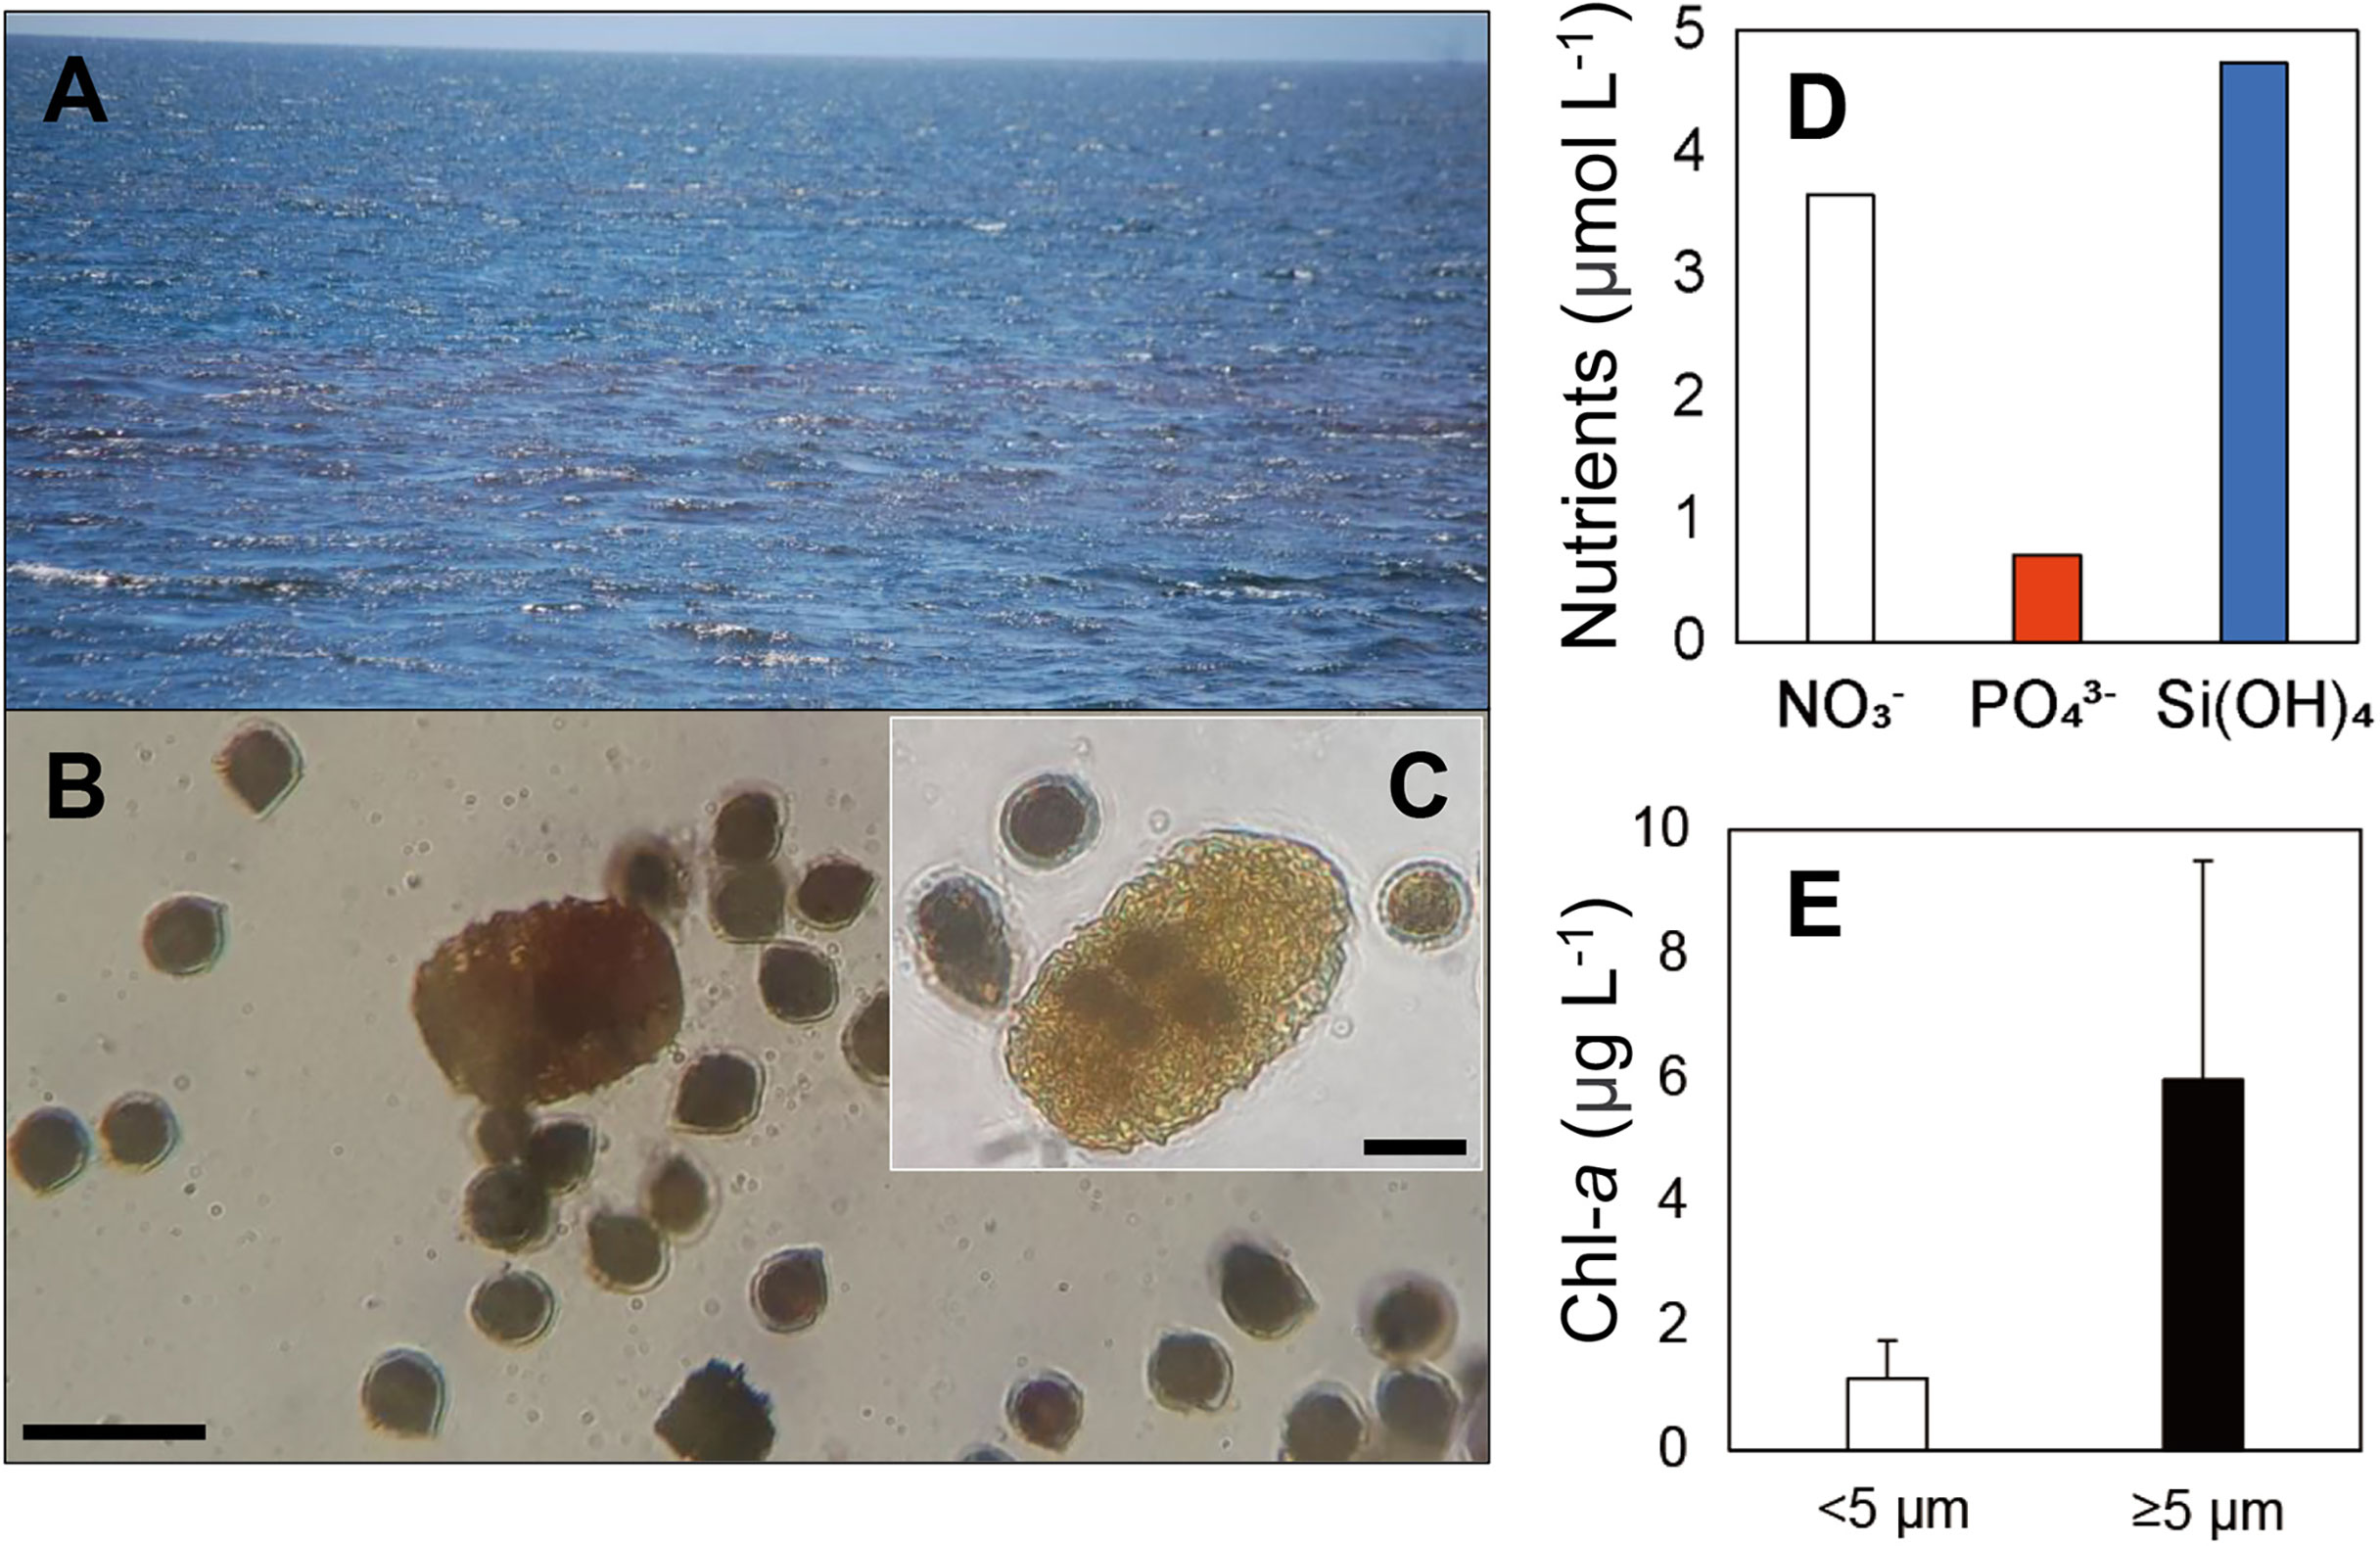
Figure 7 A red tide (RT) event observed in October 2018 in Elizabeth Bay on the west side of Isabela Island of the Galápagos Archipelago. (A) A general view of the red tide event from the surface. (B) The two dominant taxa: dinoflagellates Polykrikos kofoidii and Scrippsiella lachrymosa, observed in a preserved sample collected from the RT site. (C) P. kofoidii cell assumed to have fed on several S. lachrymosa cells. (D) Nutrient concentrations (μmol L-1) for nitrate , phosphate , and silicic acid (Si[OH]4) measured at the site. (E) Size-fractionated chlorophyll-a concentrations (Chl-a, μg L-1). Scale bars = 50 μm for B and 20 μm for (C) Error bars in E represent standard deviation of the mean (n=3).
During the bloom, the mixed layer nutrient concentrations of nitrate, phosphate, and silicic acid were 3.7, 0.7, and 4.7 μmol L-1, respectively (Figure 7D). The average mixed layer Chl-a concentrations of small and large size-fractions were 1.16 and 5.97 μg L-1, respectively, with high variability across biological replicates due to spatial heterogeneity in the bloom (Figure 7E).
Discussion
While only a few recent studies have thoroughly explored the Galápagos planktonic protistan communities (e.g., Carnicer et al., 2019; Neave et al., 2021), here we reveal the trophic structures of the assemblages with a particular emphasis on the ecological significance of heterotrophic protists and their potential grazing impacts. Furthermore, we found relatively higher heterotrophic biomass proportions in the oligotrophic eastern waters. At the same time, we report the occurrence of a dinoflagellate red tide event where a dominant factor controlling the population of the blooming dinoflagellate was suggested to be grazing by another heterotrophic dinoflagellate, suggesting crucial roles of dinoflagellates as both primary producers and micrograzers in the planktonic marine food webs of the GMR.
Oceanographic Variables and Their Effects on the Protistan Communities
Nutrient distributions in the upper water column are strongly influenced by the upwelling of the cold EUC waters, which sequentially affects the protistan community structure. With respect to phytoplankton growth and nitrate uptake kinetics, the observed nutrient concentrations in the EUC region suggest they were sufficient to support proliferation of most phytoplankton taxa, including large-sized taxonomic groups such as diatoms and autotrophic and mixotrophic dinoflagellates (Eppley et al., 1969; Lee et al., 2017). Considering that the EUC upwelling region of the Galápagos has sufficient macronutrients throughout the year (Sakamoto et al., 1998; Palacios, 2004; Schaeffer et al., 2008), the bloom dynamics in Elizabeth Bay, characterized as a phytoplankton hotspot, is likely influenced by other variables. Although iron limitation is widespread in the Equatorial Pacific Ocean, given the naturally enriched iron in the EUC water mass and the close proximity of our sampling sites to the islands, iron is less likely to be limiting, although the relationship between Chl-a and iron levels in waters of the GMR is still unclear (Martin et al., 1994; Sakamoto et al., 1998). Also, Kislik et al. (2017) reported positive and negative correlations of Chl-a with particulate carbon and surface temperature, respectively. However, the relationship between grazers and primary production in the GMR is not fully understood.
The stratified vertical profiles of physicochemical properties at the majority of sites in the eastern region of the archipelago suggest a limited nutrient supply on primary productivity throughout the upper euphotic zone. An exception was observed at St. 27, where high nutrients and Chl-a concentrations suggest there is localized upwelling at this site, possibly resulting from the topographic influence of Kicker Rock (Roca León Dormido) and/or an island wake effect from San Cristóbal Island as reported by Feldman (1986). Given the geographical characteristics of the Galápagos Archipelago, characterizing the various physical modes of deepwater nutrient delivery into the upper water column would be valuable knowledge for understanding plankton dynamics and productivity. The results of the clustering of samples between the EUC upwelling and eastern regions shown by the NMDS ordination also suggests that the composition of protistan communities in the archipelago is strongly affected by the characteristics of the upwelled water.
Heterotrophic Biomass Proportions
Another interesting contrasting characteristic observed between the EUC and eastern regions is that of the ratios of the biochemical properties (i.e., POC: Chl-a and PON: Chl-a ratios), which may be used as a proxy for heterotrophic biomass proportions: sites in the eastern region had ratios twice as high as in the EUC-influenced region. It seems unlikely that the particulate organic matter in these waters originated from terrestrial sources given the minimal land-based runoff into the marine environment, especially during the dry season (Atwood and Sachs, 2014; Moity et al., 2019). Although phytoplankton cellular Chl-a contents can vary to some extent due to their physiological status (Riemann et al., 1989; Rodriguez et al., 2006), the obviously large and statistically significant differences in ratios between the two examined regions may also be a consequence of varying amounts of heterotrophs, which is consistent with our taxonomic measurements based on 18S rRNA gene sequencing and light microscopy cell counts. Thus, observation of the POC: Chl-a ratio via remote sensing could be another possible way to evaluate the planktonic food web structure in relation to nutritional modes.
Taxonomic and Trophic Structures of the Protistan Community
Both high numbers of 18S rRNA gene sequence reads (72,748 average/sample, 41,375 standard deviation) and the even relative abundances of the number of ASVs among the taxa across all sites suggest a sufficient sequencing depth. Furthermore, the light microscopy-based morphological identification and quantitative cell counts of dominant protistan genera support the interpretations based on DNA sequencing.
From the ASV richness, it is possible to speculate on the biodiversity patterns derived by the EUC upwelling in the western archipelago region. The highest ASV richness at the sites closest to where fresh upwelling occurred may be due to the sediment resuspension of seed populations along the archipelago slope (Powell et al., 1992; Bringué et al., 2013). The supply of nutrient-rich water into Elizabeth Bay, where residence times are likely higher, may then cause the proliferation of select dominant species, which decreases biodiversity.
The dominance of the Chlorophyta group, mainly consisting of picoeukaryotic plankton, in the eastern region sites is consistent with the previous observations that these organisms play a more significant role in oligotrophic waters (Magazzu and Decembrini, 1995; Not et al., 2008). This may be due to their small size having an advantage in acquiring nutrients through having a reduced diffusion boundary layer and large surface area to volume ratio (Raven, 1987), In contrast, as expected, Dinoflagellata (excluding Syndiniales) with a relatively large cell size compared to Chlorophytes occupied higher proportions in the EUC upwelling region sites. However, the proportions of dinoflagellates did not drop sharply even in the oligotrophic eastern waters as observed in other studies (Le Bescot et al., 2016; Cohen et al., 2021), suggesting the importance of understanding their diverse trophic modes. Unlike other protistan groups, the greater Shannon alpha diversity of dinoflagellates in the eastern region is likely also a result of their various nutritional modes. One of the potential causes of the low R value (0.38) of ANOSIM test, which shows the dissimilarity between protistan communities in the two regions, may be the abundance of protistan groups that exhibit various nutritional modes such as dinoflagellates. Furthermore, unlike the significant high R2 values of individual vectors associated with oceanographic parameters and heterotrophic biomass proportions in the NDMS analysis, vectors for the primary productivity measurements were not statistically significant, which may be partially explained by the high abundance of mixotrophic dinoflagellates within both of the regions.
Given that the minimum range of prey sizes available to phagotrophic dinoflagellates are generally less than 5 μm (Nakamura et al., 1995; Berge et al., 2008), a high proportion of heterotrophic dinoflagellates in the eastern region may be possible due to the presence of available prey biomass. In the same manner, other dominant protozoan groups, such as small ciliates, could occur throughout the archipelago due to the abundance of prey sources.
Although many heterotrophic protists are capable of feeding on diverse prey species, there are often constraints on the size of prey species for sufficient proliferation for large cells (Hansen, 1992; Hansen et al., 1994), such as those detected mainly in the large size-fraction (≥5 μm) Chl-a abundant sites from this study. Therefore, we speculate that the abundance of the large-sized heterotrophic protists in the GMR is likely to be bottom-up regulated by the limited abundance of large phytoplankton species. In summary, the protozoan community structure in the GMR is likely regulated by the abundance of their prey size spectra, which depend on the availability of nutrients provided by upwelling.
The frequent ASVs based on read counts belonging to dinoflagellate genera such as Scrippsiella, Gyrodinium, and Polykrikos and low proportions of diatom groups during our observation period were consistently verified from the microscopic cell counts. Although certain diatom genera appear to be underestimated based on 18S rRNA gene sequencing, particularly with members of the diatom genus Cylindrotheca that were found to be in high concentrations at St. 6 (892 cells mL-1), yet almost absent from DNA sequencing. Indeed, the 18S rRNA gene copy numbers within certain protists can be variable according to their genome sizes (Gong and Marchetti, 2019), thus resulting in underestimates of some genera and overestimates of others, therefore not being an accurate reflection of cell abundances. In addition, in some dinoflagellate lineages, the sequence of the V4 (18S rRNA gene) region, which is commonly used for protist metabarcoding is too highly conserved, making classification to the genus-level challenging. Despite these caveats, the metabarcoding approach used in this study was highly valuable to understanding trends in relative protistan dynamics. Moreover, the method provided high resolution for estimating the importance of small protozoans, particularly high relative proportions of the parasitic dinoflagellate Syndiniales, which are difficult to identify based on morphological observations, raising questions regarding their ecological roles as protistan parasites in this region.
Grazing Impacts by Dominant Heterotrophic Protists on Phytoplankton Species
The grazing coefficients attributable to the dominant heterotrophic protists (i.e., heterotrophic dinoflagellates Gyrodinium spp., P. kofoidii and naked ciliates) on some of the most commonly found phytoplankton species (i.e., dinoflagellate Prorocentrum spp. with 10-20 μm in cell length, Heterocapsa spp., and Scrippsiella spp.) throughout the archipelago were predicted using maximum potential grazing rate estimates based on cell concentrations (Supplementary Text S1 and Figure S3). Given the two phytoplankton species, Prorocentrum spp. and Heterocapsa spp., are optimal prey for small naked ciliates (NCs, <50 μm), the potential grazing impacts of small NCs on two red-tide species could be considerable throughout the archipelago (Gifford, 1985; Verity, 1991; Yang et al., 2015). However, cells of large NCs (50-100 and >100 μm), Gyrodinium spp. (>40 μm), and P. kofoidii, which belong to the large cell size category among the protistan species, mainly were detected in the EUC upwelling region, thus demonstrating their spatially-restricted impacts as grazers in this community. The grazing coefficient potentials suggest varied and significant consumption of primary producers by micrograzers. Most importantly, considering that the protistan community in Elizabeth Bay, where the red tide bloom occurred, was over-dominated by a single species S. lachrymosa, it is estimated that the grazing coefficient of P. kofoidii could be remarkably high as our estimate indicates (Figure S3).
Documenting a Dinoflagellate Red Tide Event in the GMR
Prior to this study, only a few red tide events have been reported in the Galápagos Archipelago (e.g., Torres, 2015). Although the western GMR is a known productivity hotspot, there is a general lack of information on factors influencing algal bloom development.
Members of the dinoflagellate genus Scrippsiella, which were responsible for the red tide outbreak, are known as one of the most commonly found dinoflagellates to produce resting cysts in sediments around the world, suggesting germination as a primary mechanism for bloom initiation (Nehring, 1994; Satta et al., 2010; Shin et al., 2012). Particularly, the identified relatively short dormancy period and high germination rate for this dinoflagellate, combined with the absence of a requirement for a dramatic shift in environmental conditions for excystment, have suggested that Scrippsiella species could facilitate rapid cycling between cysts and vegetative stages (Binder and Anderson, 1987; Olli and Anderson, 2002; Wang et al., 2007). Also, the co-occurring heterotrophic dinoflagellate P. kofoidii is another actively cyst-forming dinoflagellate (Satta et al., 2010; Shin et al., 2012). Thus, cyst-forming protistan species may have an advantage surviving in this dynamic system in between upwelling events.
The relatively lower nutrient concentrations at the bloom site compared to surrounding sites were likely due to localized drawdown by blooming cells. The high concentrations of nutrients can support large-sized phytoplankton that have higher nutrient demands, as observed in our study. Similarly, the increased biomass of larger-sized phytoplankton is also observed in other upwelling systems (Cermeno et al., 2006; Taylor and Landry, 2018). The nutrients incorporated into biomass of larger cells may be more efficiently transferred to higher-level consumers through short food chains, thus creating a biological hotspot in this region.
Although we were not able to investigate the complete evolution of this red tide event, the dominant species composition of the bloom strongly suggested a potential termination mechanism of this S. lachrymosa red tide - considering the heterotrophic nutritional mode and the large cell size of the dinoflagellate P. kofoidii, their observed high cell abundance (i.e., 132 cells mL-1) indicates active consumption. Furthermore, previous studies have shown that Scrippsiella species are among the most optimal prey species that provide high growth rates for P. kofoidii (Jeong et al., 2001; Kim et al., 2019). Kim et al. (2019) derived a laboratory-based growth rate equation of P. kofoidii feeding on S. lachrymosa. When applied to our bloom scenario, the calculated growth rate of P. kofoidii feeding on S. lachrymosa at a concentration of 3636 cells mL-1 (1272.6 ng C mL-1) was 0.35 d-1 (Kim et al., 2019). This calculated growth rate estimates P. kofoidii could support 68% of their maximum growth rate feeding on only S. lachrymosa, consuming as much as 62% of the bloom in a single day (Figure S3). These findings suggest that predation by P. kofoidii would significantly influence the termination of the S. lachrymosa red tide, causing succession by grazer dominance. Exploring various roles of grazers, such as detoxifying phytoplankton toxins by ingestion of P. kofoidii, could be beneficial as a harmful algal bloom mitigation strategy for the GMR (Jeong et al., 2003).
Comparison Between 2018 and the 2015/16 ENSO Event
We compared the temporal trends of the environmental variables and protistan communities in the Galápagos Archipelago between the El Niño Southern Oscillation (ENSO) event occurring in 2015 and 2016, and the 2018 observation period. Neave et al. (2021) investigated the influence of an ENSO event on the protistan community in the archipelago during the same season, where during their sampling period in 2015, El Niño conditions were present followed by a return to cooler, yet neutral conditions in 2016.
In the EUC upwelling region during the El Nino event, Chl-a concentrations were considerably lower than that of other years, when the upwelling was weakened, while the Chl-a concentrations at most sites in the eastern region were relatively stable regardless of temporal differences (Figure 8A). POC concentrations were generally higher in the EUC upwelling region than in the eastern region, but there were no particular temporal trends across years (Figure 8B). Interestingly, the POC to Chl-a ratios, used here as a potential indicator of heterotrophic biomass proportions, were consistently higher in the eastern region (Figure 8C). Furthermore, the higher POC: Chl-a ratio in the EUC region during El Niño compared to 2016 and 2018 suggests a greater proportion of heterotrophs. This comparison suggests that the ecological importance of heterotrophic protists in the planktonic community of the Galápagos Archipelago is directly influenced by the oceanographic conditions and the degree of EUC upwelling on both temporal and spatial scales.
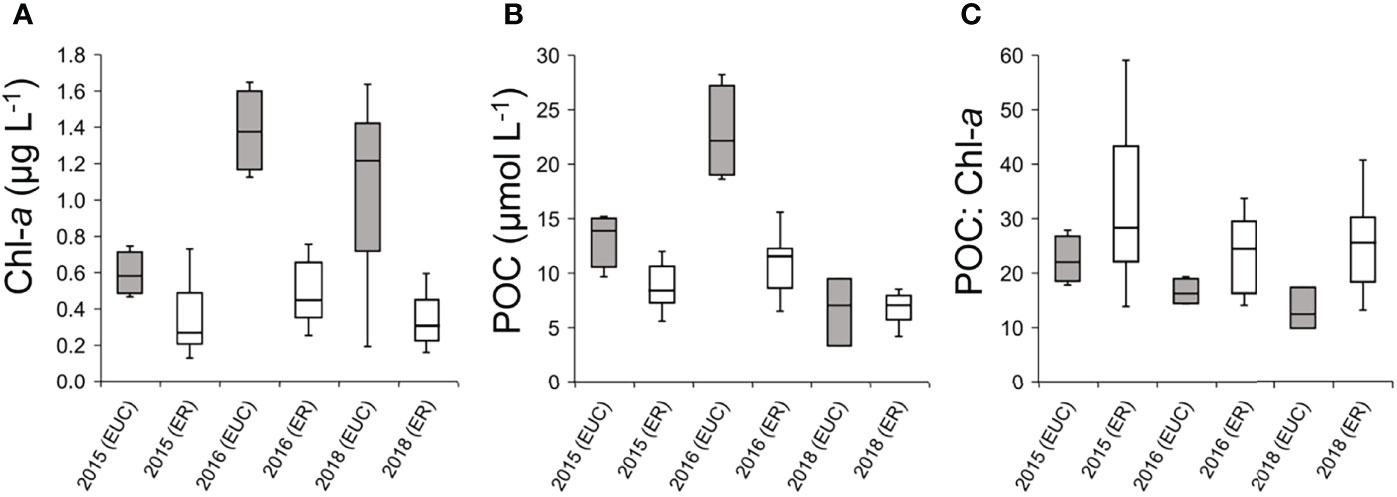
Figure 8 Comparison of oceanographic variables in the Equatorial undercurrent upwelling (EUC) and eastern (ER) regions between this study and measurements collected previously during the same season; 2015 sampling was during an El Niño event whereas 2016 and 2018 were during neutral conditions. (A) Interquartile range of Chlorophyll-a concentrations (Chl-a, μg L-1). (B) Interquartile range of particulate organic carbon (POC, μmol L-1) concentrations. (C) Interquartile range of POC to Chl-a ratios.
Although numerical comparisons for proportions of protistan community between Neave et al. (2021) and this study was not possible due to differing taxonomic criteria, it is noteworthy that heterotrophic micrograzers such as ciliates and rhizarians were higher during the El Niño event than in the neutral periods. Moreover, the high proportion of heterotrophic Syndiniales during the El Niño condition was likely due to their feeding strategy, which allows them to prey on their diverse hosts, somewhat independently of the nutrient status of primary producers (Siano et al., 2011; Jephcott et al., 2016).
Conclusions
The results of this study provide insights into how EUC upwelling affects the protistan communities of the Galápagos Archipelago, including the dynamics of micrograzers. More specifically, protozoan community structure in the GMR is likely regulated by the abundances of their prey size spectra, which depend on the availability of nutrients provided by upwelling. Also, cyst-forming protistan species may have an advantage in surviving in dynamic systems in between upwelling events. We also report a bloom of an autotrophic dinoflagellate in the western GMR, which was heavily influenced by upwelling of the EUC. Our estimates of grazing potential suggested that the bloom propagation was likely to be hindered by predatory pressure. Although the grazing coefficients of micrograzers on dominant phytoplankton species were considerable throughout the archipelago, the taxonomic composition and biochemical indicators suggested a higher proportion of micrograzers and associated heterotrophic biomass in oligotrophic, low Chl-a regions in the east. In conclusion, our findings suggest the importance of micrograzers in structuring protistan communities within the Galápagos marine system, which will have consequences for energy transfer to higher trophic levels of the marine food web.
Data Availability Statement
The datasets presented in this study can be found in online repositories. The names of the repository/repositories and accession number(s) can be found below: NCBI [accession: PRJNA689599, SAMN23036291-SAMN23036315].
Author Contributions
SJ and AM designed the research and wrote the manuscript. SJ, PL, OT, EN, and AM conducted the experiment and analyzed the data. HS designed the research and contributed to the manuscript editing. SJ, PL, OT, EN, HS, and AM approved the final submitted manuscript.
Funding
Funding for this project was provided to AM and HS from the Center for Galápagos Studies (Office of the Vice Chancellor for Research) and to SJ from a National Science Foundation grant to AM (OCE1751805).
Conflict of Interest
The authors declare that the research was conducted in the absence of any commercial or financial relationships that could be construed as a potential conflict of interest.
Publisher’s Note
All claims expressed in this article are solely those of the authors and do not necessarily represent those of their affiliated organizations, or those of the publisher, the editors and the reviewers. Any product that may be evaluated in this article, or claim that may be made by its manufacturer, is not guaranteed or endorsed by the publisher.
Acknowledgments
We thank scientists and staff from the Galápagos Science Center (GSC), Universidad San Francisco de Quito (USFQ), and Galápagos National Park (GNP) for their logistical support during the cruise. We are grateful to Steve Walsh (UNC), Carlos Mena (USFQ) and Phil Page (UNC) for their efforts in coordinating the Galápagos Marine Expeditions. Others include Diego Páez-Rosas (GSC), Juan Pablo Muñoz (GSC), Daniela Alarcon (GSC), Eduardo Espinoza (GNP), Jennifer Suarez (GNP) and the crew of the M/V Sierra Negra. We thank Sara Haines for assistance with processing and visualizing observations.
Supplementary Material
The Supplementary Material for this article can be found online at: https://www.frontiersin.org/articles/10.3389/fmars.2022.811979/full#supplementary-material
References
Abad D., Albaina A., Aguirre M., Laza-Martínez A., Uriarte I., Iriarte A., et al. (2016). Is Metabarcoding Suitable for Estuarine Plankton Monitoring? A Comparative Study With Microscopy. Mar. Biol. 163, 1–13. doi: 10.1007/s00227-016-2920-0
Anderson S. R., Menden-Deuer S. (2017). Growth, Grazing, and Starvation Survival in Three Heterotrophic Dinoflagellate Species. J. Euk. Microbiol. 64, 213–225. doi: 10.1111/jeu.12353
Atwood A. R., Sachs J. P. (2014). Separating ITCZ-And ENSO-Related Rainfall Changes in the Galápagos Over the Last 3 Kyr Using D/H Ratios of Multiple Lipid Biomarkers. Earth Planet. Sci. Lett. 404, 408–419. doi: 10.1016/j.epsl.2014.07.038
Berge T., Hansen P. J., Moestrup Ø. (2008). Feeding Mechanism, Prey Specificity and Growth in Light and Dark of the Plastidic Dinoflagellate Karlodinium Armiger. Aquat. Microb. Ecol. 50, 279–288. doi: 10.3354/ame01165
Binder J., Anderson D. M. (1987). Physiological and Environmental Control of Germination in Scrippsiella Trochoidea (Dinophyceae) Resting Cysts. J. Phycol. 23, 99–107. doi: 10.1111/j.0022-3646.1987.00099.x
Bolyen E., Rideout J. R., Dillon M. R., Bokulich N. A., Abnet C. C., Al-Ghalith G. A., et al. (2019). Reproducible, Interactive, Scalable and Extensible Microbiome Data Science Using QIIME 2. Nat. Biotechnol. 37, 852–857. doi: 10.1038/s41587-019-0209-9
Bringué M., Pospelova V., Pak D. (2013). Seasonal Production of Organic-Walled Dinoflagellate Cysts in an Upwelling System: A Sediment Trap Study From the Santa Barbara Basin, California. Mar. Micropaleontol. 100, 34–51. doi: 10.1016/j.marmicro.2013.03.007
Buitenhuis E. T., Rivkin R. B., Sailley S., Le Quéré C. (2010). Biogeochemical Fluxes Through Microzooplankton. Global Biogeochem. Cy. 24, GB4015. doi: 10.1029/2009GB003601
Calbet A., Landry M. R. (2004). Phytoplankton Growth, Microzooplankton Grazing, and Carbon Cycling in Marine Systems. Limnol. Oceanogr. 49, 51–57. doi: 10.4319/lo.2004.49.1.0051
Callahan B. J., McMurdie P. J., Rosen M. J., Han A. W., Johnson A. J. A., Holmes S. P. (2016). DADA2: High-Resolution Sample Inference From Illumina Amplicon Data. Nat. Methods 13, 581–583. doi: 10.1038/nmeth.3869
Carnicer O., de la Fuente P., Canepa A., Keith I., Rebolledo-Monsalve E., Diogène J., et al. (2019). Marine Dinoflagellate Assemblage in the Galápagos Marine Reserve. Front. Mar. Sci. 6. doi: 10.3389/fmars.2019.00235
Cermeno P., Maranón E., Pérez V., Serret P., Fernández E., Castro C. G. (2006). Phytoplankton Size Structure and Primary Production in a Highly Dynamic Coastal Ecosystem (Ría De Vigo, NW-Spain): Seasonal and Short-Time Scale Variability. Estuar. Coast. Shelf S. 67, 251–266. doi: 10.1016/j.ecss.2005.11.027
Cohen N. R., McIlvin M. R., Moran D. M., Held N. A., Saunders J. K., Hawco N. J., et al. (2021). Dinoflagellates Alter Their Carbon and Nutrient Metabolic Strategies Across Environmental Gradients in the Central Pacific Ocean. Nat. Microbiol. 6, 173–186. doi: 10.1038/s41564-020-00814-7
Cuvelier M. L., Allen A. E., Monier A., McCrow J. P., Messié M., Tringe S. G., et al. (2010). Targeted Metagenomics and Ecology of Globally Important Uncultured Eukaryotic Phytoplankton. Proc. Nati. Acad. Sci. USA. 107, 14679–14684. doi: 10.1073/pnas.1001665107
De Vargas C., Audic S., Henry N., Decelle J., Mahé F., Logares R., et al. (2015). Eukaryotic Plankton Diversity in the Sunlit Ocean. Science 348, 1261605. doi: 10.1126/science.1261605
Dugdale R. C., Goering J. J. (1967). Uptake of New and Regenerated Forms of Nitrogen in Primary Productivity. Limnol. Oceanogr. 12, 196–206. doi: 10.4319/lo.1967.12.2.0196
Eppley R. W., Rogers J. N., McCarthy J. J. (1969). Half-Saturation Constants for Uptake of Nitrate and Ammonium by Marine Phytoplankton. Limnol. Oceanogr. 14, 912–920. doi: 10.4319/lo.1969.14.6.0912
Feldman G. C. (1986). “Patterns of Phytoplankton Production Around the Galápagos Islands,” in Tidal Mixing and Plankton Dynamics (New York, NY: Springer), 77–106. doi: 10.1007/978-1-4612-4966-5_3
Gifford D. J. (1985). Laboratory Culture of Marine Planktonic Oligotrichs (Ciliophora, Oligotrichida). Mar. Ecol. Prog. Ser. Oldendorf. 23, 257–267. doi: 10.3354/meps023257
Gong W., Marchetti A. (2019). Estimation of 18S Gene Copy Number in Marine Eukaryotic Plankton Using a Next-Generation Sequencing Approach. Front. Mar. Sci. 6. doi: 10.3389/fmars.2019.00219
Hansen P. J. (1992). Prey Size Selection, Feeding Rates and Growth Dynamics of Heterotrophic Dinoflagellates With Special Emphasis on Gyrodinium Spirale. Mar. Biol. 114, 327–334. doi: 10.1007/BF00349535
Hansen B., Bjornsen P. K., Hansen P. J. (1994). The Size Ratio Between Planktonic Predators and Their Prey. Limnol. Oceanogr. 39. doi: 10.3389/fmars.2019.00219
Jang S. H., Jeong H. J., Yoo Y. D. (2018). Gambierdiscus Jejuensis Sp. Nov., an Epiphytic Dinoflagellate From the Waters of Jeju Island, Korea, Effect of Temperature on the Growth, and Its Global Distribution. Harm. Algae. 80, 149–157. doi: 10.1016/j.hal.2018.11.007
Jeong H. J., Kim S. K., Kim J. S., Kim S. T., Yoo Y. D., Yoon J. Y. (2001). Growth and Grazing Rates of the Heterotrophic Dinoflagellate Polykrikos Kofoidii on Red-Tide and Toxic Dinoflagellates. J. Euk. Microbiol. 48, 298–308. doi: 10.1111/j.1550-7408.2001.tb00318.x
Jeong H. J., Park K. H., Kim J. S., Kang H., Kim C. H., Choi H. J., et al. (2003). Reduction in the Toxicity of the Dinoflagellate Gymnodinium Catenatum When Fed on by the Heterotrophic Dinoflagellate Polykrikos Kofoidii. Aquat. Microb. Ecol. 31, 307–312. doi: 10.3354/ame031307
Jeong H. J., Yoo Y. D., Kim J. S., Seong K. A., Kang N. S., Kim T. H. (2010). Growth, Feeding and Ecological Roles of the Mixotrophic and Heterotrophic Dinoflagellates in Marine Planktonic Food Webs. Ocean. Sci. J. 45, 65–91. doi: 10.1016/j.hal.2015.07.009
Jephcott T. G., Alves-de-Souza C., Gleason F. H., Van Ogtrop F. F., Sime-Ngando T., Karpov S. A., et al. (2016). Ecological Impacts of Parasitic Chytrids, Syndiniales and Perkinsids on Populations of Marine Photosynthetic Dinoflagellates. Fungal Ecol. 19, 47–58. doi: 10.1016/j.funeco.2015.03.007
Kim S. J., Jeong H. J., Kang H. C., You J. H., Ok J. H. (2019). Differential Feeding by Common Heterotrophic Protists on Four Scrippsiella Species of Similar Size. J. Phycol. 55, 868–881. doi: 10.1111/jpy.12864
Kislik E., Mantilla G., Torres G., Borbor-Córdova M. (2017). Biological Hotspots in the Galápagos Islands: Exploring Seasonal Trends of Ocean Climate Drivers to Monitor Algal Blooms. Int. J. Bioeng. Life Sci. 11, 824–834. doi: 10.5281/zenodo.1314831
Le Bescot N., Mahé F., Audic S., Dimier C., Garet M. J., Poulain J., et al. (2016). Global Patterns of Pelagic Dinoflagellate Diversity Across Protist Size Classes Unveiled by Metabarcoding. Environ. Microbiol. 18, 609–626. doi: 10.1111/1462-2920.13039
Lee K. H., Jeong H. J., Kim H. J., Lim A. S. (2017). Nitrate Uptake of the Red Tide Dinoflagellate Prorocentrum Micans Measured Using a Nutrient Repletion Method: Effect of Light Intensity. Algae 32, 139–153. doi: 10.4490/algae.2017.32.5.20
Lin Y., Cassar N., Marchetti A., Moreno C., Ducklow H., Li Z. (2017). Specific Eukaryotic Plankton are Good Predictors of Net Community Production in the Western Antarctic Peninsula. Sci. Rep. 7, 1–11. doi: 10.1038/s41598-017-14109-1
Litaker R. W., Vandersea M. W., Kibler S. R., Reece K. S., Stokes N. A., Steidinger K. A., et al. (2003). Identification of Pfiesteria Piscicida (Dinophyceae) and Pfiesteria-Like Organisms Using Internal Transcribed Spacer-Specific PCR Assays. J. Phycol. 39, 754–761. doi: 10.1046/j.1529-8817.2003.02112.x
Magazzu G., Decembrini F. (1995). Primary Production, Biomass and Abundance of Phototrophic Picoplankton in the Mediterranean Sea: A Review. Aquat. Microb. Ecol. 9, 97–104. doi: 10.3354/ame009097
Martin M. (2011). Cutadapt Removes Adapter Sequences From High-Throughput Sequencing Reads. EMBnet. J. 17, 10–12. doi: 10.14806/ej.17.1.200
Martin J. H., Coale K. H., Johnson K. S., Fitzwater S. E., Gordon R. M., Tanner S. J., et al. (1994). Testing the Iron Hypothesis in Ecosystems of the Equatorial Pacific Ocean. Nature 371, 123–129. doi: 10.1038/371123a0
Moity N., Delgado B., Salinas-de-León P. (2019). Mangroves in the Galápagos Islands: Distribution and Dynamics. PloS One 14, e0209313. doi: 10.1371/journal.pone.0209313
Nakamura Y., Suzuki S. Y., Hiromi J. (1995). Growth and Grazing of a Naked Heterotrophic Dinoflagellate, Gyrodinium Dominans. Aquat. Microb. Ecol. 9, 157–164. doi: 10.3354/ame009157
Neave E. F., Seim H., Gifford S. M., Torano O., Johnson Z. I., Páez-Rosas D., et al. (2021). Protistan Plankton Communities in the Galápagos Archipelago Respond to Changes in Deep Water Masses Resulting From the 2015/16 El Niño. Environ. Microbiol 24, 1746–1759. doi: 10.1111/1462-2920.15863
Nehring S. (1994). Scrippsiella Spp. Resting Cysts From the German Bight (North Sea): A Tool for More Complete Check-Lists of Dinoflagellates. Neth. J. Sea. Res. 33, 57–63. doi: 10.1016/0077-7579(94)90051-5
Not F., Latasa M., Scharek R., Viprey M., Karleskind P., Balagué V., et al. (2008). Protistan Assemblages Across the Indian Ocean, With a Specific Emphasis on the Picoeukaryotes. Deep. Sea. Res. I. 55, 1456–1473. doi: 10.1016/j.dsr.2008.06.007
Olli K., Anderson D. M. (2002). High Encystment Success of the Dinoflagellate Scrippsiella Cf. Lachrymosa in Culture Experiments. J. Phycol. 38, 145–156. doi: 10.1046/j.1529-8817.2002.01113.x
Palacios D. M. (2004). Seasonal Patterns of Sea-Surface Temperature and Ocean Color Around the Galápagos: Regional and Local Influences. Deep. Sea. Res. II. 51, 43–57. doi: 10.1016/j.dsr2.2003.08.001
Parsons T. B., Maita Y., Lall C. M. (1984). A Manual of Chemical and Biochemical Methods of Seawater Analysis (Oxford: Pergqmon Press).
Powell A. J., Lewis J., Dodge J. D. (1992). The Palynological Expressions of Post-Palaeogene Upwelling: A Review Vol. 64 (Geological Society, London: Special Publications), 215–226. doi: 10.1144/GSL.SP.1992.064.01.14
Quast C., Pruesse E., Yilmaz P., Gerken J., Schweer T., Yarza P., et al. (2012). The SILVA Ribosomal RNA Gene Database Project: Improved Data Processing and Web-Based Tools. Nucleic Acids Res. 41, D590–D596. doi: 10.1093/nar/gks1219
Raven J. A. (1987). Physiological Consequences of Extremely Small Size for Autotrophic Organisms in the Sea. Photosynthetic Picoplankton. Can. Bull. Fish. Aquat. Sci. 214, 1–70.
Riemann B., Simonsen P., Stensgaard L. (1989). The Carbon and Chlorophyll Content of Phytoplankton From Various Nutrient Regimes. J. Plankton. Res. 11, 1037–1045. doi: 10.1093/plankt/11.5.1037
Rodriguez F., Chauton M., Johnsen G., Andresen K., Olsen L. M., Zapata M. (2006). Photoacclimation in Phytoplankton: Implications for Biomass Estimates, Pigment Functionality and Chemotaxonomy. Mar. Biol. 148, 963–971. doi: 10.1007/s00227-005-0138-7
Ronquist F., Huelsenbeck J. P. (2003). MrBayes 3: Bayesian Phylogenetic Inference Under Mixed Models. Bioinformatics 19, 1572–1574. doi: 10.1093/bioinformatics/btg180
Sakamoto C. M., Millero F. J., Yao W., Friederich G. E., Chavez F. P. (1998). Surface Seawater Distributions of Inorganic Carbon and Nutrients Around the Galápagos Islands: Results From the PlumEx Experiment Using Automated Chemical Mapping. Deep. Sea. Res. II. 45, 1055–1071. doi: 10.1016/S0967-0645(98)00013-7
Satta C. T., Anglès S., Garcés E., Lugliè A., Padedda B. M., Sechi N. (2010). Dinoflagellate Cysts in Recent Sediments From Two Semi-Enclosed Areas of the Western Mediterranean Sea Subject to High Human Impact. Deep. Sea. Res. II. 57, 256–267. doi: 10.1016/j.dsr2.2009.09.013
Schaeffer B. A., Morrison J. M., Kamykowski D., Feldman G. C., Xie L., Liu Y., et al. (2008). Phytoplankton Biomass Distribution and Identification of Productive Habitats Within the Galápagos Marine Reserve by MODIS, a Surface Acquisition System, and in-Situ Measurements. Remote Sens. Environ. 112, 3044–3054. doi: 10.1016/j.rse.2008.03.005
Schlitzer R. (2013) Ocean Data View. Available at: http://odv.awi.de (Accessed November 08, 2021).
Schmoker C., Hernández-León S., Calbet A. (2013). Microzooplankton Grazing in the Oceans: Impacts, Data Variability, Knowledge Gaps and Future Directions. J. Plankton. Res. 35, 691–706. doi: 10.1093/plankt/fbt023
Schroeder A., Stanković D., Pallavicini A., Gionechetti F., Pansera M., Camatti E. (2020). DNA Metabarcoding and Morphological Analysis-Assessment of Zooplankton Biodiversity in Transitional Waters. Mar. Environ. Res. 160, 104946. doi: 10.1016/j.marenvres.2020.104946
Sherr E. B., Sherr B. F. (1993). “Preservation and Storage of Samples for Enumeration of Heterotrophic Protists,” in Handbook of Methods in Aquatic Microbial Ecology (Boca Raton, FL:CRC Press), 207–212.
Shin H. H., Park J. S., Kim Y. O., Baek S. H., Lim D., Yoon Y. H. (2012). Dinoflagellate Cyst Production and Flux in Gamak Bay, Korea: A Sediment Trap Study. Mar. Micropaleontol. 94, 72–79. doi: 10.1016/j.marmicro.2012.06.005
Siano R., Alves-de-Souza C., Foulon E., Bendif E. M., Simon N., Guillou L., et al. (2011). Distribution and Host Diversity of Amoebophryidae Parasites Across Oligotrophic Waters of the Mediterranean Sea. Biogeosciences 8, 267–278. doi: 10.5194/bg-8-267-2011
Slawyk G., Collos Y., Auclair J. C. (1977). The Use of the 13C and 15N Isotopes for the Simultaneous Measurement of Carbon and Nitrogen Turnover Rates in Marine Phytoplankton. Limnol. Oceanogr. 22, 925–932. doi: 10.4319/lo.1977.22.5.0925
Stamatakis A. (2006). RAxML-VI-HPC: Maximum Likelihood-Based Phylogenetic Analyses With Thousands of Taxa and Mixed Models. Bioinformatics 22, 2688–2690. doi: 10.1093/bioinformatics/btl446
Stoecker D. K. (1999). Mixotrophy Among Dinoflagellates 1. J. Eukaryotic. Microbiol. 46 (4), 397–401. doi: 10.1111/j.1550-7408.1999.tb04619.x
Stoecker D. K., Capuzzo J. M. (1990). Predation on Protozoa: Its Importance to Zooplankton. J. Plankton. Res. 12, 891–908. doi: 10.1093/plankt/12.5.891
Sweet W. V., Morrison J. M., Kamykowski D., Schaeffer B. A., Banks S., McCulloch A. (2007). Water Mass Seasonal Variability in the Galápagos Archipelago. Deep. Sea. Res. I. 54, 2023–2035. doi: 10.1016/j.dsr.2007.09.009
Tamura K., Dudley J., Nei M., Kumar S. (2007). MEGA4: Molecular Evolutionary Genetics Analysis (MEGA) Software V. 4.0. Mol. Biol. Evol. 24, 1596–1599. doi: 10.1093/molbev/msm092
Taylor A. G., Landry M. R. (2018). Phytoplankton Biomass and Size Structure Across Trophic Gradients in the Southern California Current and Adjacent Ocean Ecosystems. Mar. Ecol. Prog. Ser. 592, 1–17. doi: 10.3354/meps12526
Tillmann U. (2004). Interactions Between Planktonic Microalgae and Protozoan Grazers. J. Euk. Microbiol. 51, 156–168. doi: 10.1111/j.1550-7408.2004.tb00540.x
Torres G. (2015). Evaluación De Mareas Rojas Durante 1968-2009 En Ecuador. Acta Oceanogr. Pac. 20, 89–98.
Utermöhl H. (1958). Zur Vervollkommnung Der Quantitativen Phytoplankton-Methodik: Mit 1 Tabelle Und 15 Abbildungen Im Text Und Auf 1 Tafel. Internat. Vereinigung. für. Theoretische. Und. Angewandte. Limnol.: Mitt. 9, 1–38. doi: 10.1080/05384680.1958.11904091
Verity P. G. (1991). Measurement and Simulation of Prey Uptake by Marine Planktonic Ciliates Fed Plastidic and Aplastidic Nanoplankton. Limnol. Oceanogr. 36, 729–750. doi: 10.4319/lo.1991.36.4.0729
Wang Z. H., Qi Y. Z., Yang Y. F. (2007). Cyst Formation: An Important Mechanism for the Termination of Scrippsiella Trochoidea (Dinophyceae) Bloom. J. Plankton. Res. 29, 209–218. doi: 10.1093/plankt/fbm008
Keywords: upwelling, red tide, bloom, heterotrophic protist, microzooplankton, metabarcoding, trophic mode
Citation: Jang SH, Lim P, Torano O, Neave EF, Seim H and Marchetti A (2022) Protistan Communities Within the Galápagos Archipelago With an Emphasis on Micrograzers. Front. Mar. Sci. 9:811979. doi: 10.3389/fmars.2022.811979
Received: 09 November 2021; Accepted: 13 April 2022;
Published: 18 May 2022.
Edited by:
Catharina Alves-de-Souza, University of North Carolina Wilmington, United StatesReviewed by:
Chih-Ching Chung, National Taiwan Ocean University, TaiwanOlga Carnicer, Dalhousie University, Canada
Heather McNair, University of Rhode Island, United States
Laure Guillou, Centre National de la Recherche Scientifique (CNRS), France
Copyright © 2022 Jang, Lim, Torano, Neave, Seim and Marchetti. This is an open-access article distributed under the terms of the Creative Commons Attribution License (CC BY). The use, distribution or reproduction in other forums is permitted, provided the original author(s) and the copyright owner(s) are credited and that the original publication in this journal is cited, in accordance with accepted academic practice. No use, distribution or reproduction is permitted which does not comply with these terms.
*Correspondence: Adrian Marchetti, amarchetti@unc.edu
†Present address: Erika F. Neave, School of Biological and Environmental Sciences, Liverpool John Moores University, Liverpool, United Kingdom and Department of Life Sciences, Natural History Museum, London, United Kingdom