Nocturnal Eyes in Slipper Lobsters (Decapoda Scyllaridae): Physiological and Ecological Implications of Habitat Depths for Visual Traits
 Oki Hayasaka
 Hao-Yi Chang3
  Li-Chun Li
 Yung-Che Tseng
 Yi Ta Shao
- 1Faculty of Fisheries, Kagoshima University, Kagoshima, Japan
- 2Marine Research Station, Institute of Cellular and Organismic Biology, Academia Sinica, Taipei, Taiwan
- 3Institute of Marine Biology, National Taiwan Ocean University, Keelung, Taiwan
- 4Center of Excellence for the Oceans, National Taiwan Ocean University, Keelung, Taiwan
- 5Intelligent Maritime Research Center, National Taiwan Ocean University, Keelung, Taiwan
The light characteristics of an ecosystem drive evolutionary adaptations in visual traits, enhancing the diversity and abundance of species living there. The visual systems of crustaceans are highly diverse and often correspond to the optical properties of their preferred environments. Although habitat depth is known to greatly influence visual specialization in marine crustaceans, it remains unclear whether depth drives visual adaptions in nocturnal species. Slipper lobsters (Scyllaridae) are nocturnal benthic marine crustaceans distributed throughout a wide range of depths. In order to understand the visual adaptive capabilities of slipper lobsters inhabiting different depths, we characterized the eye structures of a shallow-water species (Parribacus japonicas), an intermediate-depth species (Scyllarides squammosus) and a deep-water species (Ibacus novemdentatus). Moreover, we measured by electroretinogram (ERG) the spectral sensitivities and temporal resolutions for each species using the following light stimuli: UV (λmax 386 nm), blue (λmax 462 nm), green (λmax 518 nm), yellow (λmax 590 nm), and red (λmax 632 nm). Our histological experiments show that all three species possess a typical superposition compound eye with square facets, and their ERG measurements revealed a single sensitivity peak for each species. Notably, peak spectral sensitivity corresponded to habitat depth, with the estimated peak for I. novemdentatus (493.0 ± 9.8 nm) being similar to that of S. squammosus (517.4 ± 2.1 nm), but lower than that of P. japonicus (537.5 ± 9.9 nm). Additionally, the absolute sensitivities at respective peak wavelengths for I. novemdentatus and P. japonicus were higher than that of S. squammosus. No differences were observed among the three species for maximum critical flicker fusion frequency (CFFmax) across light stimuli. However, P. japonicus had lower CFFmax values than the other two species. These data suggest that all three nocturnal slipper lobsters are likely monochromatic and well adapted to dim light environments. Significantly, the deep-water slipper lobster displayed higher spectral sensitivities at shorter wavelengths than the shallow water species, but temporal resolution was not compromised.
Introduction
Light plays an important role in aquatic ecosystems. In underwater environments, light penetration influences various biogeochemical processes that determine the primary productivity of the ecosystem and also impact the activities and behavioral patterns of marine organisms (Mascarenhas and Keck, 2018). Optical properties in ocean systems are largely influenced by depth, as water molecules scatter and absorb downwelling sunlight to affect spectral bandwidth and reduce intensity (Pope and Fry, 1997). In clear pelagic seas, seawater quickly absorbs longer light wavelengths, whereas shorter wavelengths can penetrate deeper, giving deep open oceans a pronounced blue color. In contrast, absorption and scattering by suspended particles, such as detritus and dissolved organic matter, may reduce the blue/green light transition distance in turbid systems (Gallegos et al., 1990). This red-shift in coastal waters and estuaries may reduce the penetration depth of blue and green light (Renema, 2018). At night or in deep-water regions that sunlight cannot reach, bioluminescence is the primary source of illumination and it plays important roles in both intra- and inter-specific interactions (reviewed in Haddock et al., 2010; Martini and Haddock, 2017).
Crustaceans are found in all parts of the marine environment and they exhibit a remarkable degree of sensory system variation. The evolutionary adaptations that drive variability in visual traits are thought to be attributable to light availability in those habitats. For example, eye size and structure of Sergestes spp. (Sergestidae) vary considerably according to habitat depth (Welsh and Chace, 1938). Similarly, differential spectral sensitivity has been reported for crustaceans inhabiting distinct optical environments. For instance, most decapods studied to date are either monochromatic or dichromatic, but some taxa inhabiting shallow-water or reef regions may possess more than two types of photoreceptors to perceive color (reviewed in Marshall et al., 2003). Taxa inhabiting shallow-water areas often have multiple visual pigments tuned to absorb longer wavelengths, such as red or yellow light (reviewed in Marshall et al., 1999). In contrast, deep-sea crustaceans cannot detect such longer wavelengths, with these species only having one short-wavelength visual pigment for UV/blue or green light (reviewed in Marshall et al., 1999). In addition to color perception, temporal resolution is important for animals, as this property determines their ability to detect movement. Species with greater sensitivity to light intensity often exhibit slower photoreceptor transduction and longer summation times, representing a potential adaptive trade-off for light-limited environments (reviewed in Marshall et al., 2003). Frank (2000) showed that mesopelagic crustaceans at greater habitat depths display lower critical flicker fusion frequencies (CFFs), a measure of temporal resolution. Apart from depth, crustaceans that actively move at night are expected to exhibit adaptations to dim-light environments (Gerrish et al., 2009). Although habitat depth is known to drive visual adaption in crustaceans, it is unclear if such depth-related visual adaptive shifts occur in nocturnal species.
Slipper lobsters (Scyllaridae) are closely related to furry or spiny lobsters (Palinuridae) and can be recognized by their enlarged and flattened antennae (Lavalli and Spanier, 2007). The family comprises a total of 20 known genera and 89 species distributed across four subfamilies (Arctidinae, Ibacinae, Scyllarinae, and Theninae) (Yang et al., 2012). All species are found in warm waters worldwide, residing at depths ranging from very shallow to > 800 m (Webber and Booth, 2007). Many slipper lobsters—especially those of the genera Scyllarides, Parribacus, and Ibacus—are commercially important (Spanier and Lavalli, 2007), and these are considered emerging species of aquacultural value in many Asian countries (Rudloe, 1983; Wakabayashi et al., 2019). Slipper lobsters are primarily nocturnal (Lavalli et al., 2007). Nevertheless, their stalked eyes are well developed (Lau et al., 2009), suggesting that they potentially possess a wide field of vision. A previous study showed that the vertical positions and relative distances between the eyes, endowing the visual angle of the stereopsis field, vary according to habitat and/or depth ranges (Spanier et al., 2011). Furthermore, gross anatomical and ultrastructural comparisons of rhabdom structure have indicated that the slipper lobster may be sensitive to polarized light (Lau et al., 2009). Although those studies have addressed some important features of the slipper lobster visual system, visual traits of nocturnal species have not yet been thoroughly evaluated (reviewed in Lavalli et al., 2007).
In this study, we aimed to identify properties of the visual systems of nocturnal slipper lobsters inhabiting different depths. We examined three slipper lobster species, i.e., the Japanese mitten lobster (Parribacus japonicus, Ibacinae), the blunt slipper lobster (Scyllarides squammosus, Arctidinae), and the smooth fan lobster (Ibacus novemdentatus, Ibacinae) (Figure 1; Yang et al., 2012). These three species are common Scyllaridae in the waters of northeastern Taiwan. Both P. japonicus (shallow water: 0–25 m depth; Wahyudin et al., 2017) and S. squammosus (intermediate depth: 17.5–90.5 m depth, but most abundant at 25–35 m; O’Malley, 2011) inhabit the euphotic zone, though P. japonicus has occasionally been recorded in the intertidal zone. In contrast, I. novemdentatus is usually captured in deeper waters of the mesophotic and aphotic zones (50–300 m depth, Groeneveld et al., 2019). We examined the anatomical features of each species’ eye by conventional histological methods. Then, we studied how the visual systems respond after dark adaption to better understand how visual traits impact nocturnal behavioral patterns. We applied electroretinograms (ERG) to test species’ spectral sensitivities and temporal visual responses using a series of light-emitting diodes (LED).
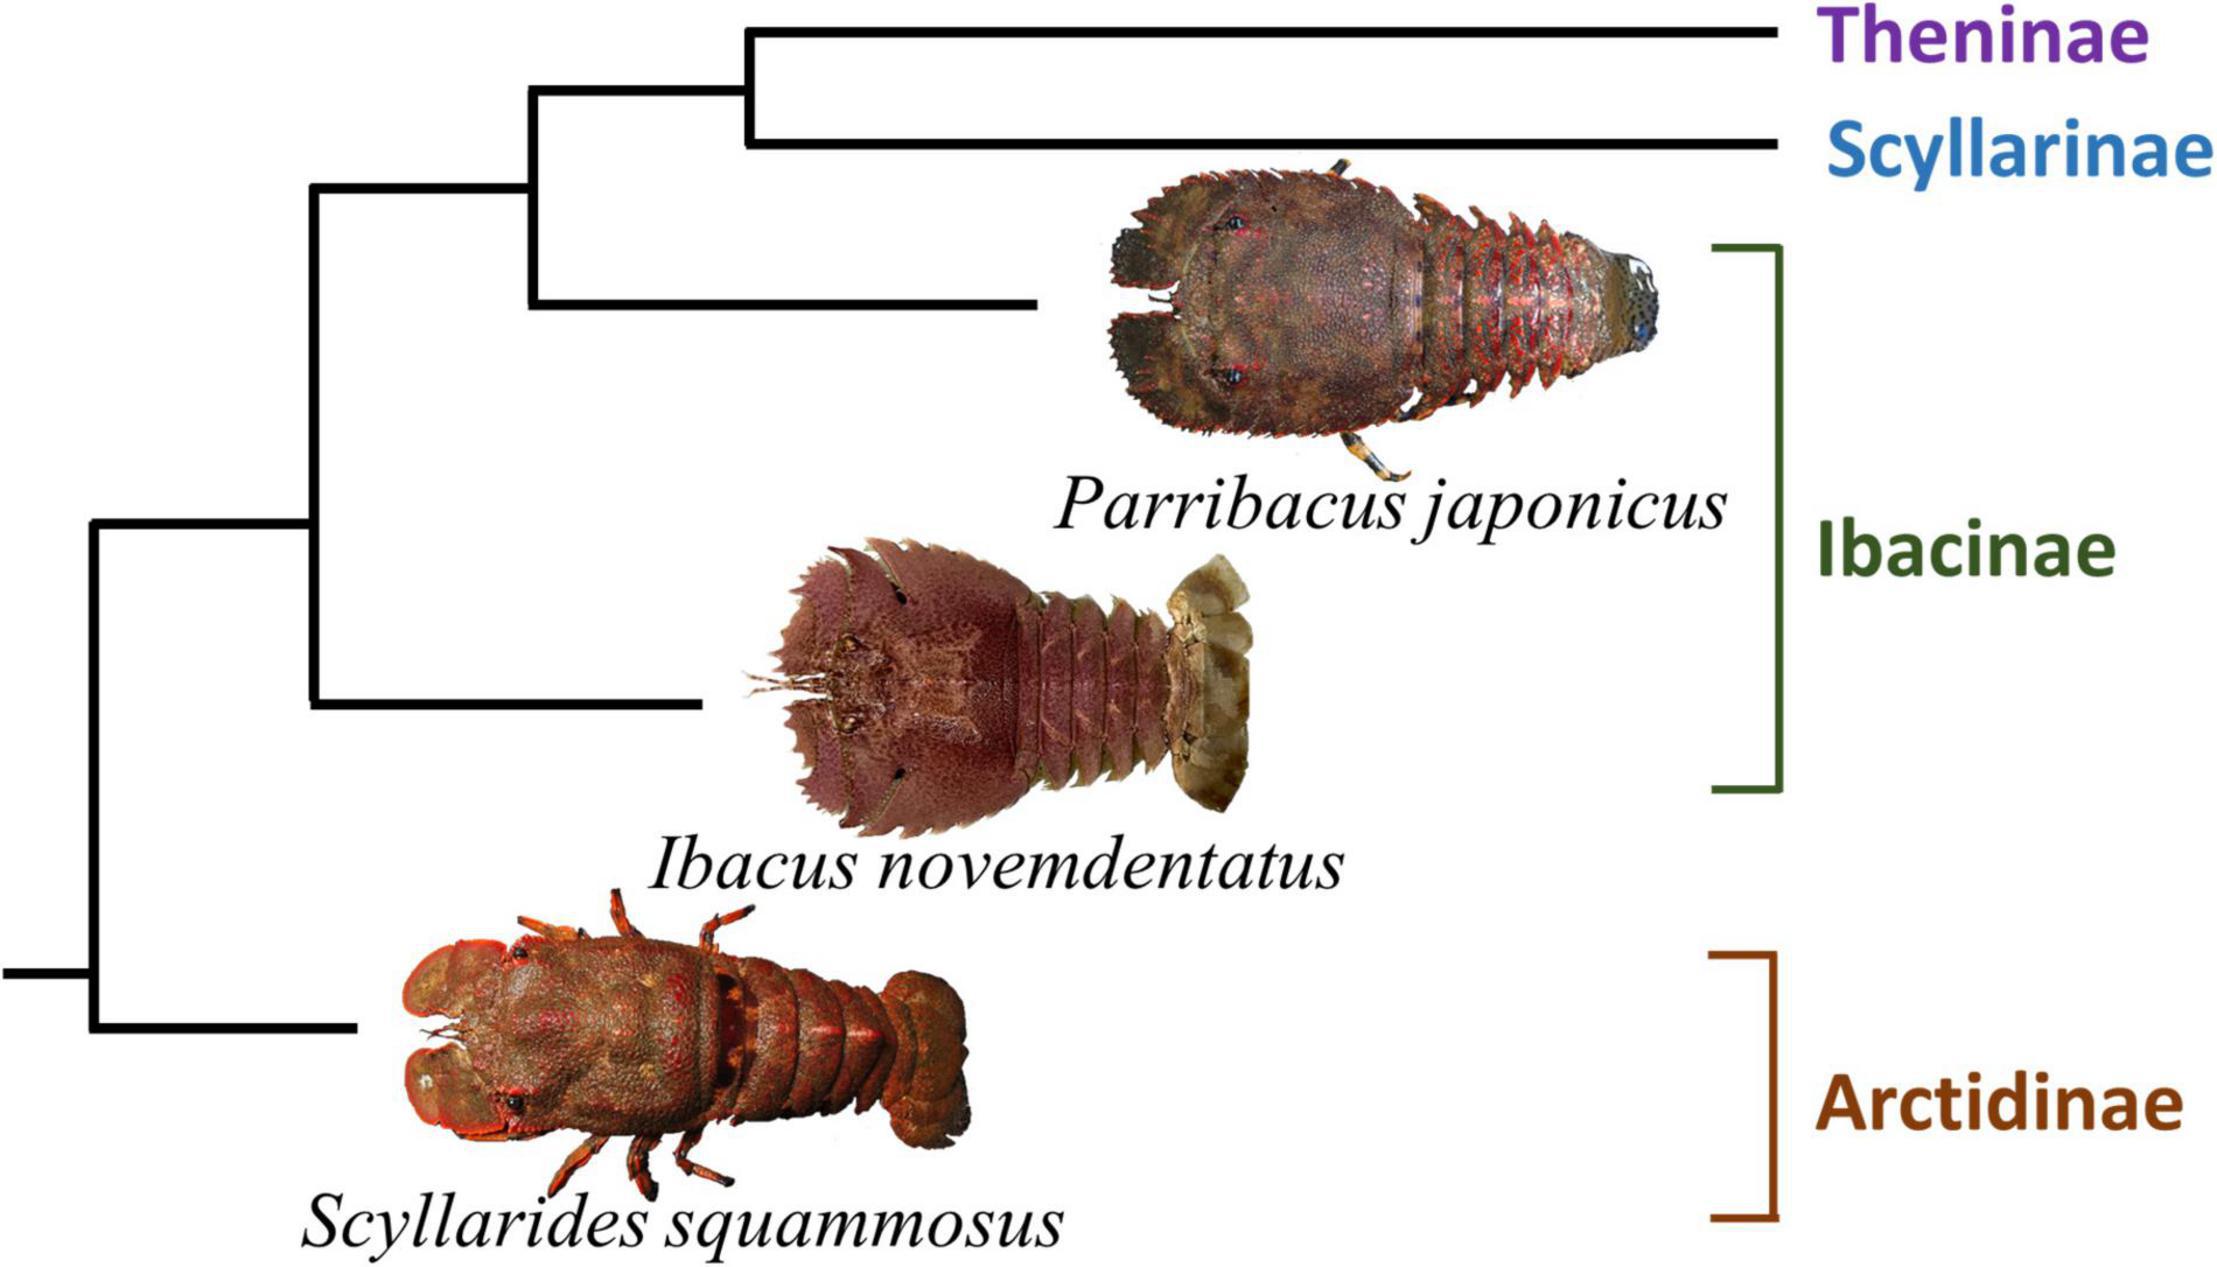
Figure 1. A cladogram showing the evolutionary relationships among the three focus species of this study (based on Yang et al., 2012).
Materials and Methods
Experimental Animals
Living P. japonicas (20.02 ± 1.10 cm, mean total length ± Standard Error, n = 6), S. squammosus (17.48 ± 1.24 cm, n = 5) and I. novemdentatus (16.30 ± 0.37 cm, n = 5) were obtained from the Heping Island Fish Market and Wushi Harbor. P. japonicas and S. squammosus were captured off the northeastern coast of Taiwan by scuba divers with permits issued by a local fishermen’s association. Both species were collected at depths of 5–35 m 2 h after sunset. I. novemdentatus specimens were collected during the night at depths of 200–400 m by a trawler vessel, which was operated by licensed fishermen.
I. novemdentatus specimens were packaged in bags of seawater and oxygen, and covered with black plastic to protect them from ambient light, before being brought from Wushi Harbor to a laboratory in National Taiwan Ocean University (NTOU). Before experiments, I. novemdentatus were kept in 90-L cooler boxes with aerated seawater at a density of one lobster per 30 L. The temperature of the room was controlled at 18°C, and the light:dark photoperiod was set to L8D16 with dim light (c. 10 lx) during the light period. The lobsters were fed with frozen shrimp and clams twice per week, and seawater was replaced after feeding. The purchased P. japonicas and S. squammosus specimens were reared in the Chaojing Ocean Center (National Museum of Marine Science & Technology). The animals were kept in 100-L aquaria with a natural photoperiod and running seawater at 25°C. As for I. novemdentatus, frozen shrimp and clams were provided as a food source. Three days before each experiment, individual P. japonicas or S. squammosus were moved to NTOU and kept in the same conditions as described above for I. novemdentatus. All experiments were conducted during the 16-h dark period, adhered to 3R ethical principles (replacement, reduction, and refinement) (Russell and Burch, 1959), and followed the guidelines on animal experiments of the Institutional Animal Care and Use Committee of National Taiwan Ocean University, Taiwan.
Electrophysiology Apparatus
A simplified and low-cost ERG apparatus was assembled following Kanmizutaru et al. (2005) and it was used to determine spectral sensitivities and temporal responses of slipper lobsters. The animals were tied onto an eppendorf tube rack (21.3 × 11.3 × 2.7 cm) using fine cable ties and wrapped in nylon mesh. The right eyestalk was fixed upward using Scotch removable mounting putty. This experimental setup was then placed on a desktop vibration isolation plate (54 × 64 cm, Herz Co., Yokohama, Japan) located inside a lightproof test chamber (76 cm × 82 cm × 84 cm). The internal layer of the chamber was covered with a copper screen (0.173 mm, 60 mesh) to provide electric shielding. During recordings, a small tube was used to irrigate lobster mouthparts with precooled oxygenated seawater.
A recording electrode (an epoxy-insulated tungsten microelectrode, 76.2 mm in length, 245 μm in diameter, 5 MΩ; A-M System, WA, United States) was placed on the midline of the right eye. A reference electrode of similar specifications was placed in a hole on the carapace near the eye that had been made using a pen-type mini grinder (Octopus, Taipei, Taiwan) with a fine drill head (0.8 mm, Tamiya, Shizuoka, Japan). EEG paste (Ten20® conductive EEG paste, D.O. Weaver and Co., Aurora, Co, United States) was used to cover the ends of the electrodes, thereby enhancing conductivity of evoked potentials from the tissue to the electrodes.
Retina-evoked potentials were enhanced using a DP-301 differential amplifier (Warner Instruments, Hamden, CT, United States) and fed into software (LabChart v8, AD Instruments, Sydney, Australia) through a PowerLab 4/35 analog-digital converter (AD Instruments). The amplifier’s band pass filter was set at 0.1–10 kHz, and the analog-digital converter sampling frequency was fixed at 40 kHz.
Light stimuli were generated using LEDs, which are smaller and cheaper than conventional lamps with narrow band-pass filters (Matsumoto et al., 2010). Moreover, the short response time of LEDs can be used to test temporal responses, and their light intensities can be adjusted precisely by setting the pulse width (duty cycle). For our experiments, a white light LED fitted with a 50% long-wave pass edge filter (450 nm, Titan Electro-Optics Co., Taipei, Taiwan) was used for preliminary ERG tests to determine appropriate dark-adaption timespans (Figure 2). Additionally, five monochromatic LEDs—UV, blue, green, yellow, and red—were used for ERG experiments (Table 1). An infrared (IR) LED with a peak emission of 780 nm (λmax) was applied in a preliminary test, but no ERG response was observed under IR flash stimulation. Hence, we did not explore IR light responses any further. The LEDs were powered by an LP2002D adjustable DC power supply (Lodestar Electronics Co., Taipei, Taiwan). A collecting mirror was mounted on each LED, condensing the light beam angle to 12°. A BU-1A05J ultra-high speed relay (0.25 mS operating time and 0.05 mS release time, Toward Co., Hsinchu, Taiwan) was used to control the duty cycle of LEDs along with a DF1906 function synthesizer (NF Co., Yokohama, Japan). Duty cycles were adjusted from 25 to 100% (Supplementary Data 1) at a frequency of 250 Hz, which is higher than the known critical flicker fusion frequencies of most crustaceans. A PowerLab A/D converter controlled the on/off switch according to the synthesizer trigger function. During ERG tests, the light source was placed above the lobster and pointed directly at the fixed eye at a distance of 5 cm (red) or 15 cm (other colors). All operations were performed in a dark room maintained at a temperature of 18–20°C and under dim red light (∼680 nm).
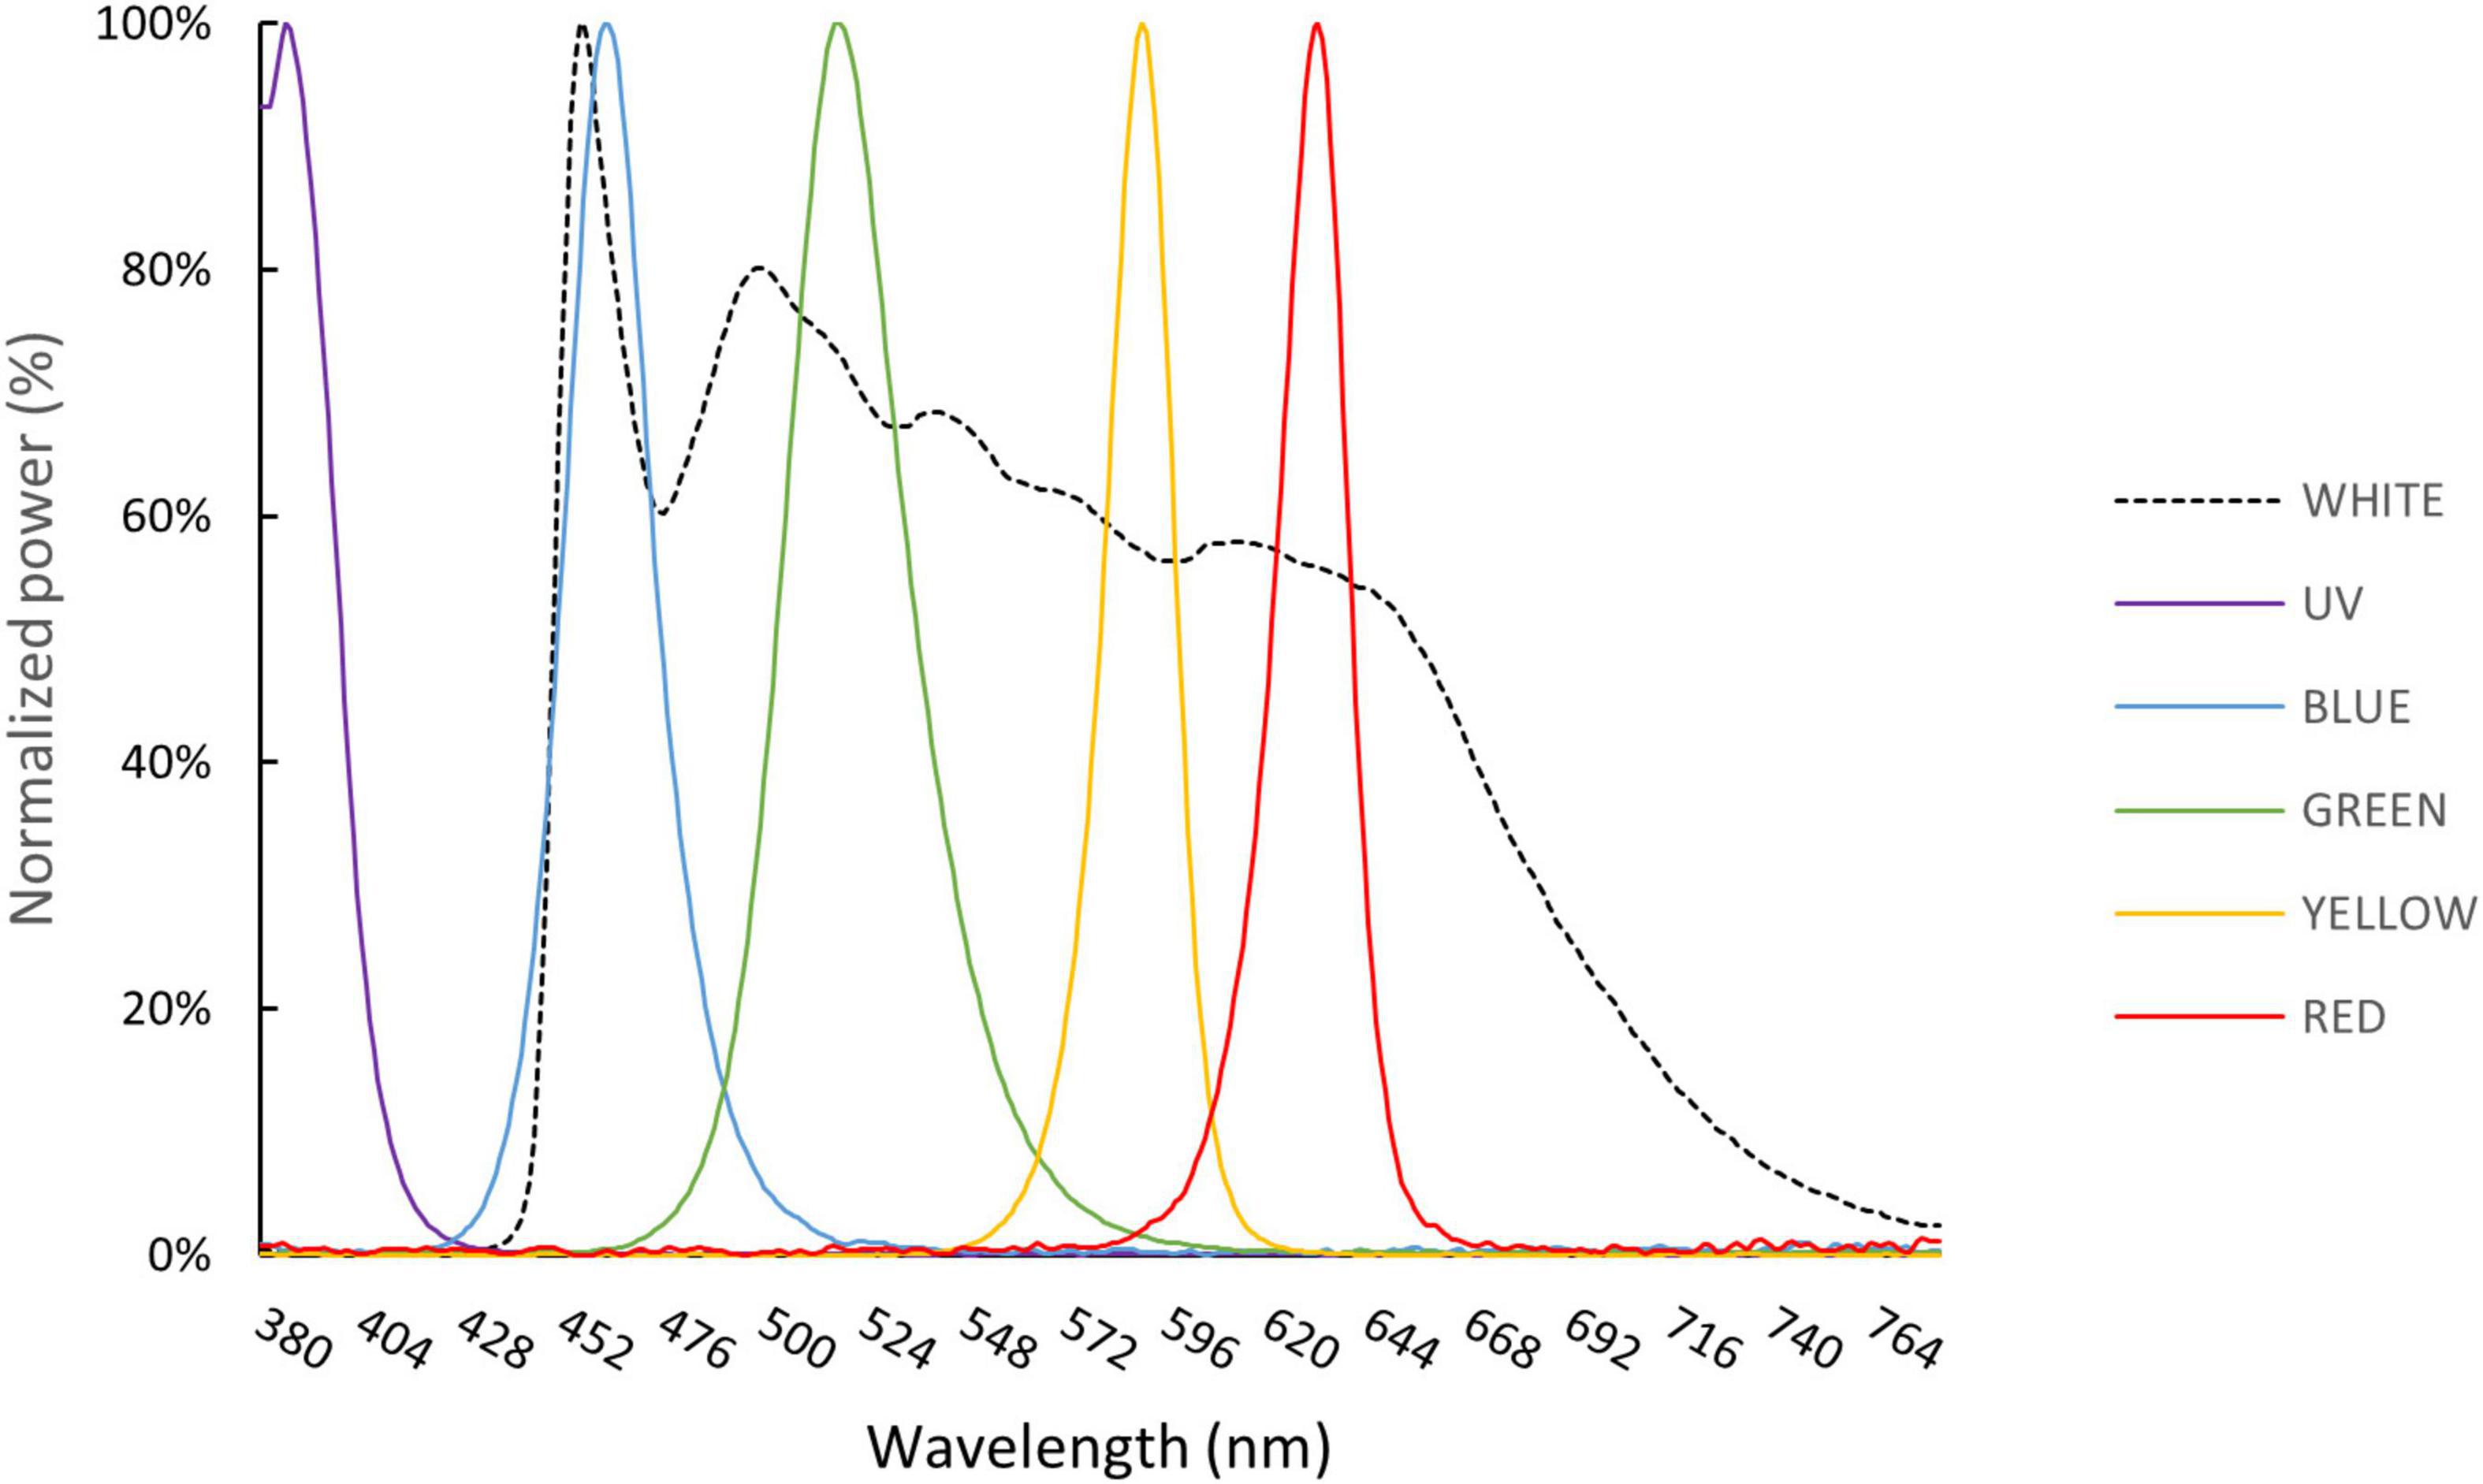
Figure 2. Spectral emissions for each color of LED utilized in this study, measured at a distance of 15 cm and standardized to the peak emission.
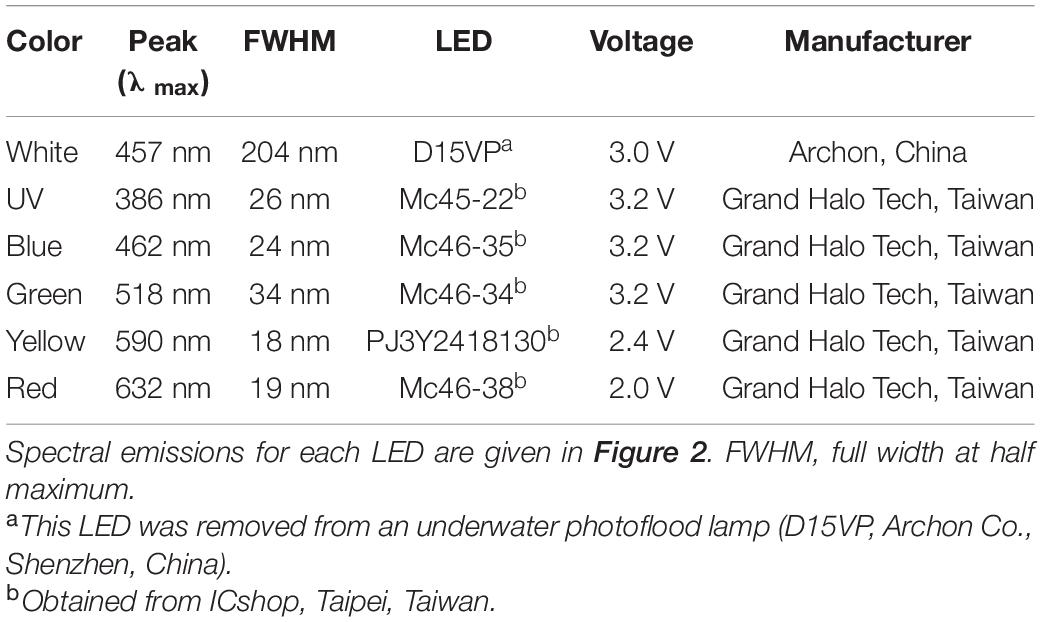
Table 1. LEDs used as light sources for the ERG recordings.
Spectral Sensitivity
Before spectral sensitivity tests, each lobster was restrained and placed in the test chamber for dark adaption; 1 h for P. japonicas and S. squammosus, and 2 h for I. novemdentatus. A preliminary test demonstrated these times to be sufficiently long to obtain the maximum response amplitude (Supplementary Data 2). The duration of the light stimulus was 100 ms, and a series of neutral density (ND) filters (Titan Electro-Optics Co., Taipei, Taiwan) were used to reduce the light intensity in 14 stages, from −0.3 to −4.2 log units (0.3 unit per stage). At each stage, the output of the LED was adjusted between 25–100% duty cycle (Supplementary Data 3).
ERGs were collected starting from the lowest light stimulus (-4.2 log of ND filters and 25% duty cycle), and were adjusted in a stepwise fashion with a minimum scale of 1% duty cycle increase in stimulus intensity (Supplementary Data 3). Peak light intensity at each wavelength and step was determined using a MK350N spectrometer (UPRtek Co., Hsinchu, Taiwan) and converted to photon flux (mol/m2/s). Stimulus flashes were given at 1 min intervals until we obtained a defined criterion response of 30 μV above the average of background noise (in our system, the noise was usually below 20 μV) (Frank and Case, 1988; Frank et al., 2012). Before meeting the response criterion, the light stimulus was below the threshold sensitivity, so the light flashes would not cause light-adaption in the eye (Frank et al., 2012; Caves et al., 2016).
To compare the spectral sensitivity data, we plotted the reciprocal of the intensity required to produce the criterion response for each color. In addition, curve fitting was performed on the reciprocal of the thresholds for each lobster normalized to a 0–100% scale, where 100% corresponded to the region of the spectrum at which highest sensitivity was observed. To estimate the peak of spectral sensitivity of each species, we fitted an absorbance curve to the spectral sensitivity data for each individual using a visual pigment template (Stavenga et al., 1993) based on the least sum of squares method (Nørgaard et al., 2008). Data fitting was performed using R software with the package “Perceptual Analysis, Visualization and Organization of Spectral Color Data (pavo)” (Maia et al., 2013, 2019). The correlation between spectral sensitivity data and the template curve was evaluated by a Pearson correlation test (SPSS v. 20). A dataset was excluded if the coefficient (r) between the spectral sensitivity data and the template curve was < 0.95 or the significance value (p) was > 0.05.
Temporal Resolution
Critical flicker fusion frequency (CFF) is defined as the highest flicker rate that the eye can follow at any intensity. CFF increases as the stimulus intensity rises, until it reaches a plateau (Frank, 1999). In our study, we used the maximum CFF (CFFmax) in response to square pulses of light with a constant 50% duty cycle generated by the DF1906 function synthesizer to quantify the temporal resolution for each species.
The LEDs used for these experiments were the same as those used in the spectral sensitivity test (Table 1). The test was initiated at an irradiance level that could clear ERG signals. PowerLab was used to control flash duration, and the duration of the pulse trains was 1 s. The response to a dim-light test flash at an intensity of approximately the threshold level was monitored between every pulse train. Subsequently, flickering stimuli were not given until the response to the test flash had recovered to the dark-adapted level. After every pulse train, the ERG signal of the time domain was analyzed by Fast Fourier Transform (FFT). If the power of the FFT at the frequency of stimulation was significantly greater than the background noise, the animal was considered able to resolve a stimulus of that frequency (Ryan et al., 2017). The frequency of the stimulus pulse was increased by 1–2 Hz from 20 Hz until fusion occurred. Upon reaching the CFF, the light intensity was increased by 0.3 log for the following pulse train. CFFmax was defined at the stimulus intensity that no longer resulted in a higher flicker rate (Frank and Case, 1988; Frank et al., 2012).
Morphology and Anatomical Structure
After the ERG tests, the three species of lobsters were euthanized under light adaption using an ice slurry (Diggles, 2019). Then, the eyestalks were cut off, and the eyes were split into halves with a razor blade. For histological observation, the eyes were fixed in Bouin’s solution at room temperature, followed by dehydration through a graded ethanol series (70, 80, 90, and 100%) for 1 h in each grade. Samples were next incubated three times in histo-clear for 1 h on a shaker (S101; Yisheng Technology, Co., Ltd., Pingtung County, Taiwan), and then the samples were dipped in paraffin. Sagittal sections across the middle part of the eye were made at 10 μm thickness using a microtome (RM2245; Leica Biosystem, Wetzlar, Germany) and placed on glass microscope slides. Sections were deparaffinized in histo-clear for 10 min and dehydrated through a graded ethanol series (100, 90, 80, and 70%) for 10 min in each grade. Sections were stained with hematoxylin and eosin and then dehydrated through a progressive aqueous-ethanol series (70–100%). Finally, the samples were mounted in Entellan new (Merck Millipore, Burlington, MA, United States) and covered with a coverslip. The structure of the eye was observed under a light microscope (ApoTome.2; Carl Zeiss, Aalen, Germany).
Eyes collected for scanning electron microscopy were fixed immediately in a mixture of 4% paraformaldehyde and 2.5% glutaraldehyde, buffered with 0.1 M phosphate buffer (pH 7.2) for 1 day, and then post-fixed for 2 h in 2% OsO4 solution with 0.1 M phosphate buffer (pH 7.2). The samples were then rinsed three times in the phosphate buffer and dehydrated through a graded series of ethanol for 30 min at each grade. After samples were critical point dried (Hitachi HCP-2 critical point dryer), the tissues were mounted on stubs and coated with gold (Hitachi E101 ion sputter). The tissues were then examined with a scanning electron microscope (Hitachi S-2400) at 15 kV. Light micrographs were used for measurements of clear-zone width, and scanning electron micrographs were used for measurements of the surface area of each facet.
Statistics
As some of the data were not normally distributed according to the Shapiro-Wilk normality test (p < 0.05), non-parametric statistical analyses were deployed. Multiple group comparisons were performed using both the Friedman test and the one-way Kruskal-Wallis test, followed by post hoc analysis with a Dunn test (Olsvik et al., 2005). Data from just two groups were compared using the non-parametric Mann-Whitney U-test (SPSS v. 20).
Results
Anatomical Structures of Slipper Lobster Eyes
First, we evaluated the gross morphological features of the eyes of each species. The distance between the eyes (ED) of S. squammosus was 68.9 ± 0.8% (mean ± SE) of the anterior carapace width (ACW, Spanier et al., 2011), which was significantly higher than that of I. novemdentatus (21.6 ± 0.5%) and P. japonicus (49.0 ± 1.1%) [df = 2, p = 0.001 and 0.042, respectively; Dunn’s post hoc comparison after one-way Kruskal-Wallis test (p = 0.001)]. Notably, the ED:ACW ratio was not statistically different between I. novemdentatus and P. japonicus [df = 2, p = 0.35; Dunn’s post hoc comparison after one-way Kruskal-Wallis test (p = 0.001)].
All three examined species had ellipsoid eyes with square facets in an orthogonal array (Figure 3). The outlines of the facets delineated the corresponding ommatidia, and a small concavity was observed at the center of each facet (Figure 3). The average areas of corneal facets were 3,091 ± 176 μm2 for S. squammosus, 3044 ± 166 μm2 for I. novemdentatus, and 2,943 ± 161 μm2 for P. japonicas, which were not statistically different among species (df = 2, p = 0.67; one-way Kruskal-Wallis test).
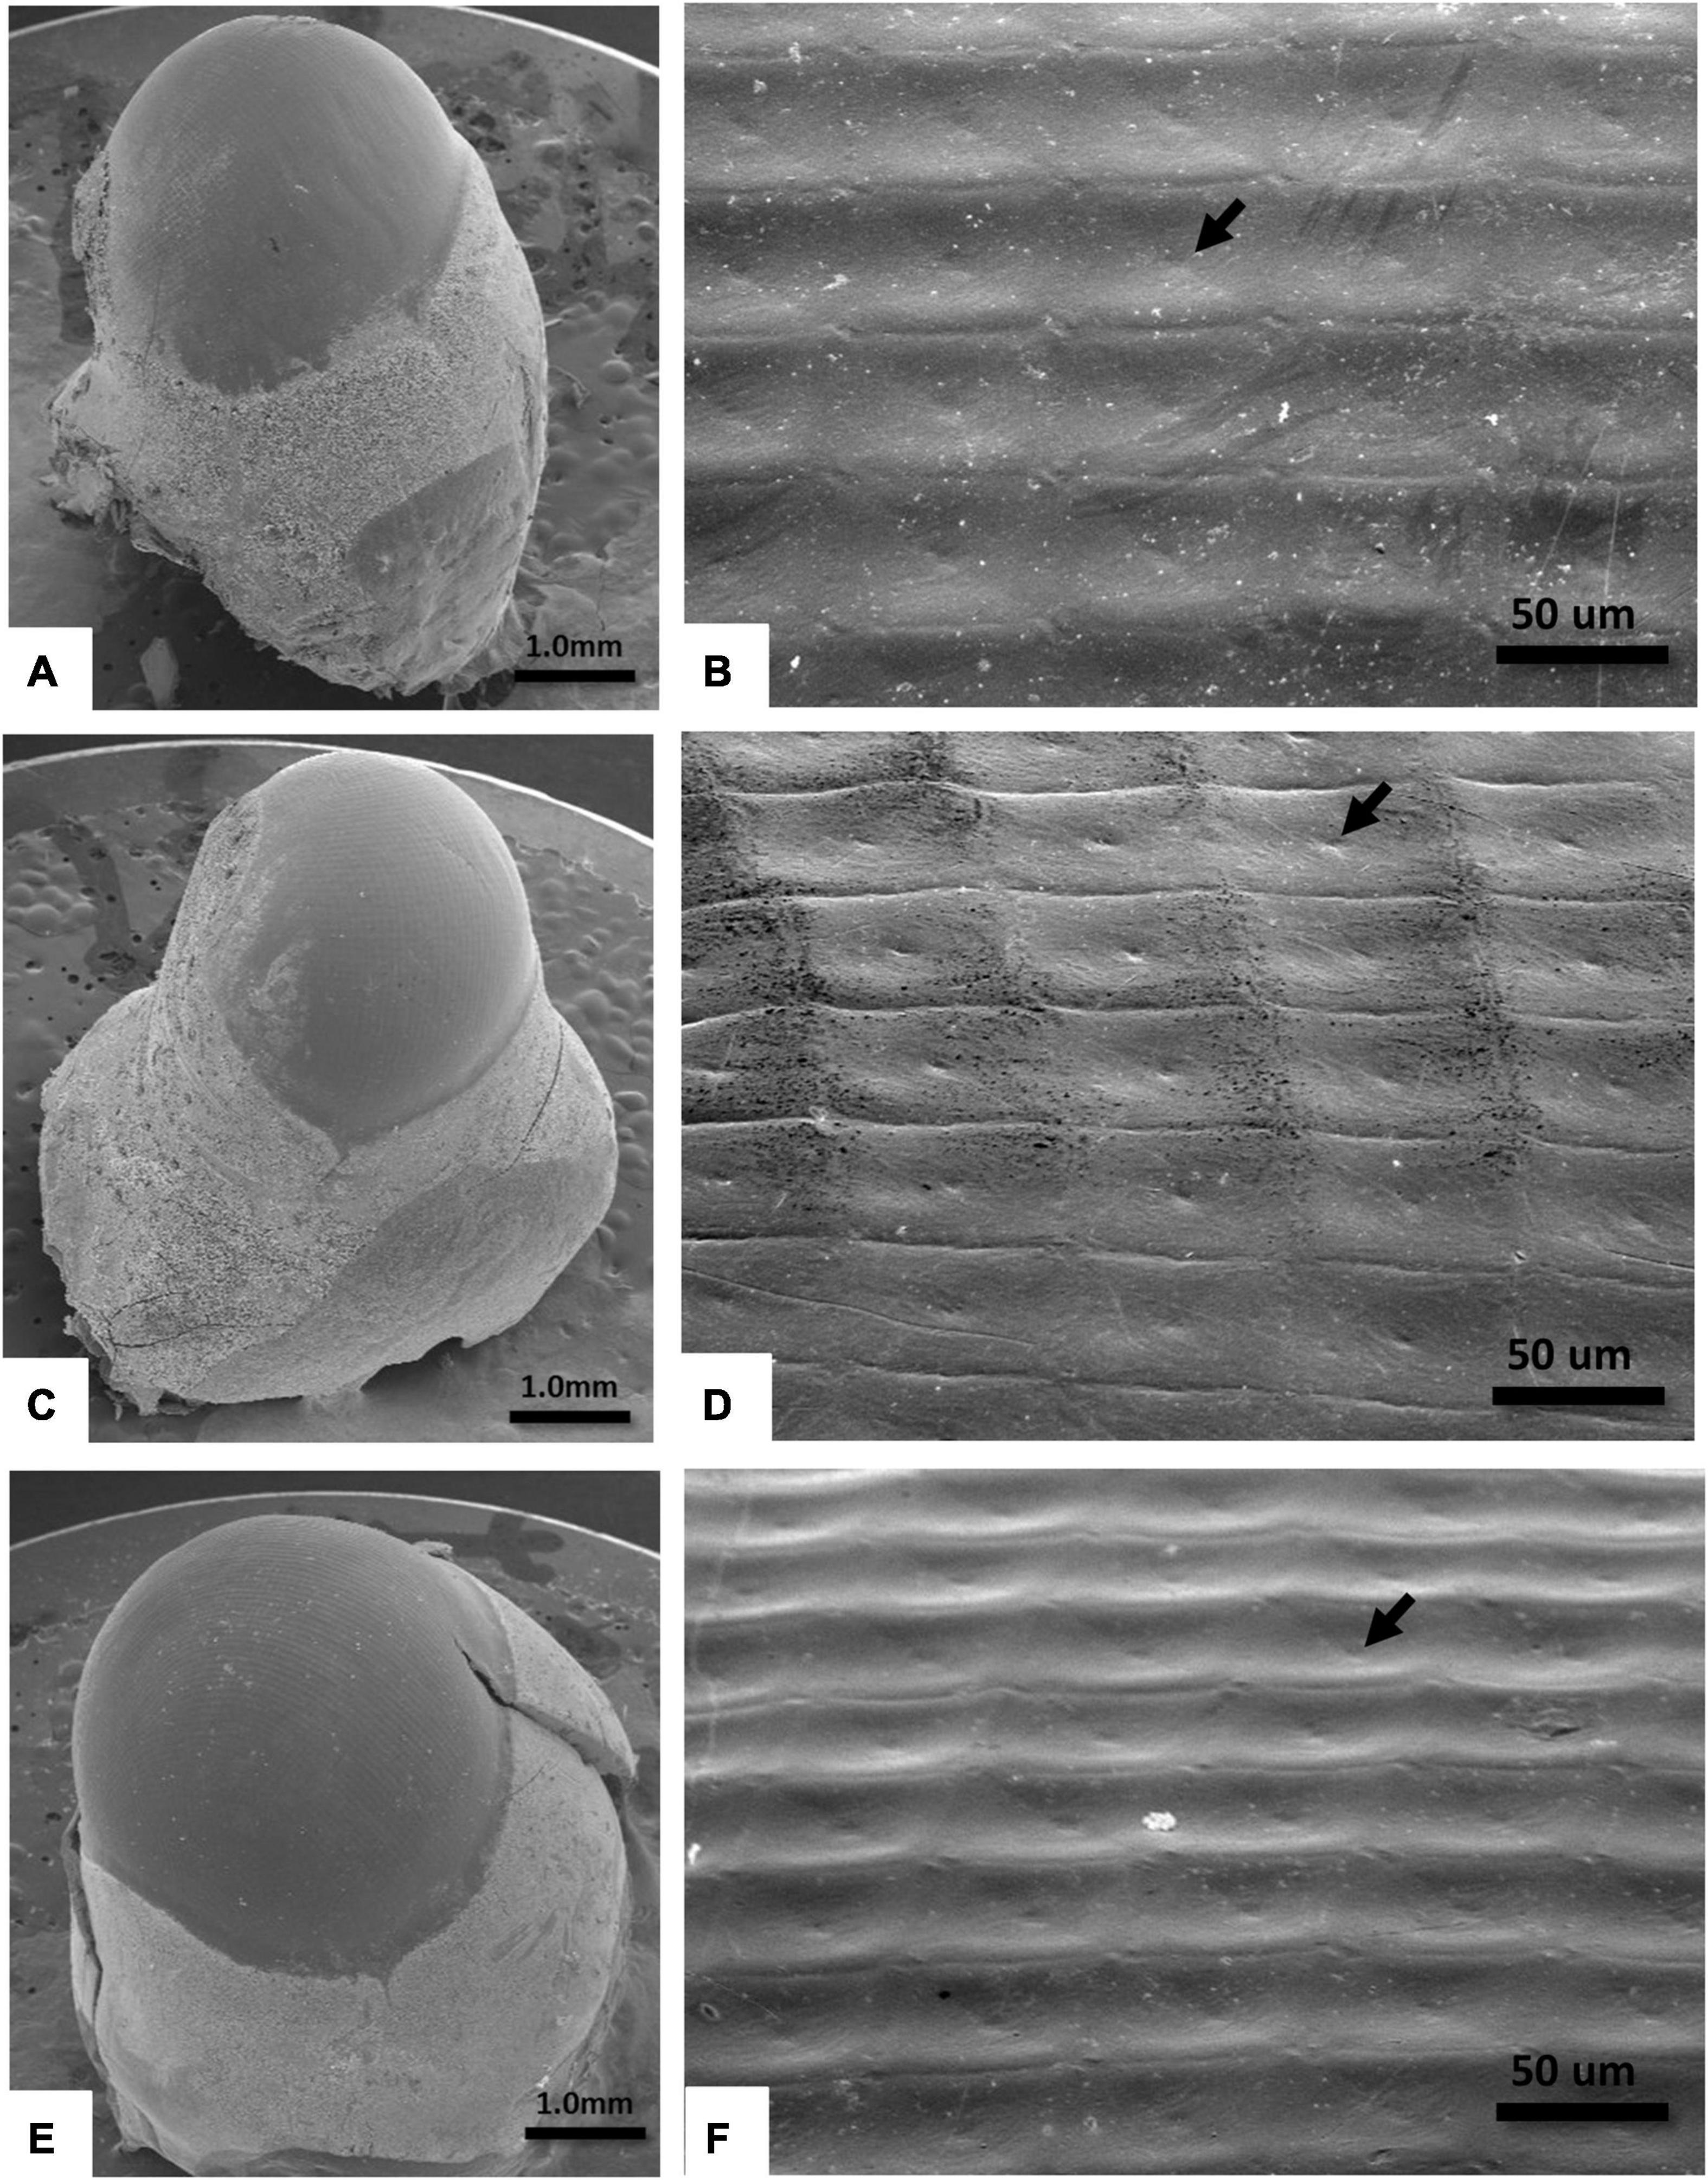
Figure 3. SEM images of the right eye of slipper lobsters. (A,B) S. squammosus 15× and 400×, (C,D) I. novemdentatus 15× and 400×, and (E,F) P. japonicas 15× and 400×. The arrow points to the concavity on the facet.
Although the clear zone between outer structures and the retina were far narrower in P. japonicas [0.300 ± 0.022 μm, df = 2, p = 0.001 in comparison to both other species; Dunn’s post hoc comparison after one-way Kruskal-Wallis test (p < 0.001)] than for the other two species (S. squammosus: 0.450 ± 0.020 μm, I. novemdentatus: 0.349 ± 0.007 μm), histological sections showed that all three species had a typical superposition eye (Figure 4).
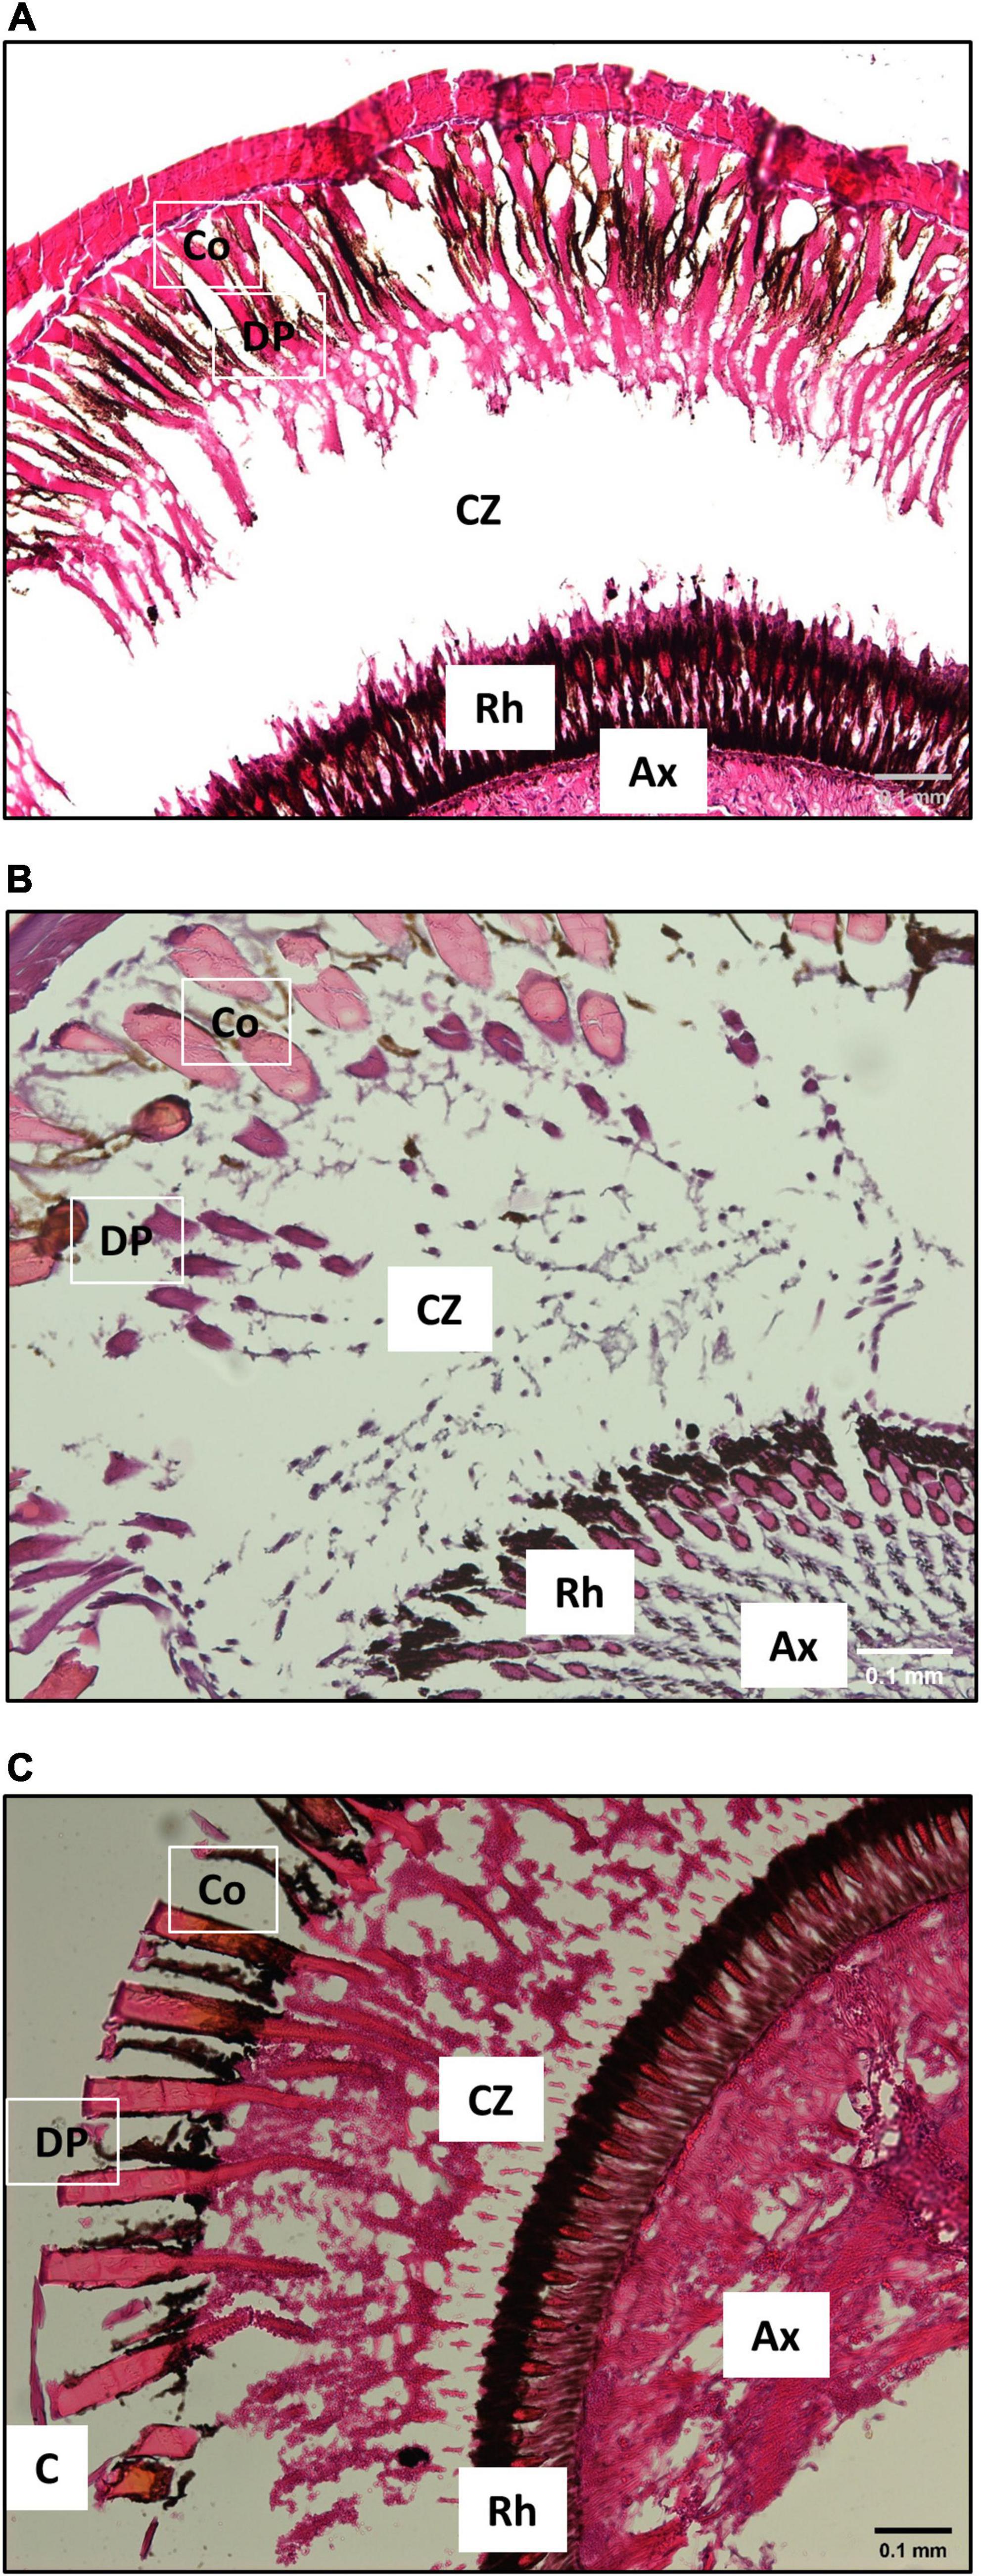
Figure 4. Representative histological sections of slipper lobster eyes (10×). All three species had a clear zone between the rhabdoms and the distal pigment cone cell, a hallmark of superposition eyes. (A) S. squammosus, (B) I. novemdentatus and (C) P. japonicas. C: cornea, Co: cones, DP: distal pigment, CZ: clear zone, Rh: rhabdoms and Ax: axons. Scale bar represents 0.1 mm.
Spectral Sensitivity
Next, we evaluated ERG responses in the slipper lobsters for several regions of the light spectrum, i.e., UV (λmax 386 nm), blue (λmax 462 nm), green (λmax 518 nm), yellow (λmax 590 nm), and red (λmax 632 nm) (Figure 5). Our data reveal that all three species had distinct dark-adapted sensitivities to different spectra (df = 4, S. squammosus p = 0.001; I. novemdentatusr p = 0.001; P. japonicas p = 0.022, Friedman test). Additionally, intermediate-depth S. squammosus and deep-water I. novemdentatus displayed higher dark-adapted sensitivities to blue and green wavelengths than red light [df = 4, S. squammosus p = 0.004 and 0.001; I. novemdentatus p = 0.003 and 0.002, respectively; Dunn’s post hoc comparison after one-way Kruskal-Wallis test (p < 0.001 in both species)]. However, the shallow-water species P. japonicas appeared to be most sensitive to yellow light, and its yellow sensitivity was significantly greater than for red light [df = 4, p = 0.014, respectively; Dunn’s post hoc after one-way Kruskal-Wallis test (p = 0.003)]. Additionally, our results indicate that intermediate-depth S. squammosus displays an overall lower light sensitivity compared to the other two species. More specifically, its sensitivities were significantly lower than deep-water I. novemdentatus for shorter UV and blue wavelengths [df = 2, p = 0.045 and 0.047, respectively; Dunn’s post hoc comparison after one-way Kruskal-Wallis test (p = 0.044 and 0.038)], and its sensitivities were also lower than shallow-water P. japonicus for the yellow spectrum [df = 2, p = 0.014; Dunn’s post hoc after one-way Kruskal-Wallis test (p = 0.008)] (Figure 6).
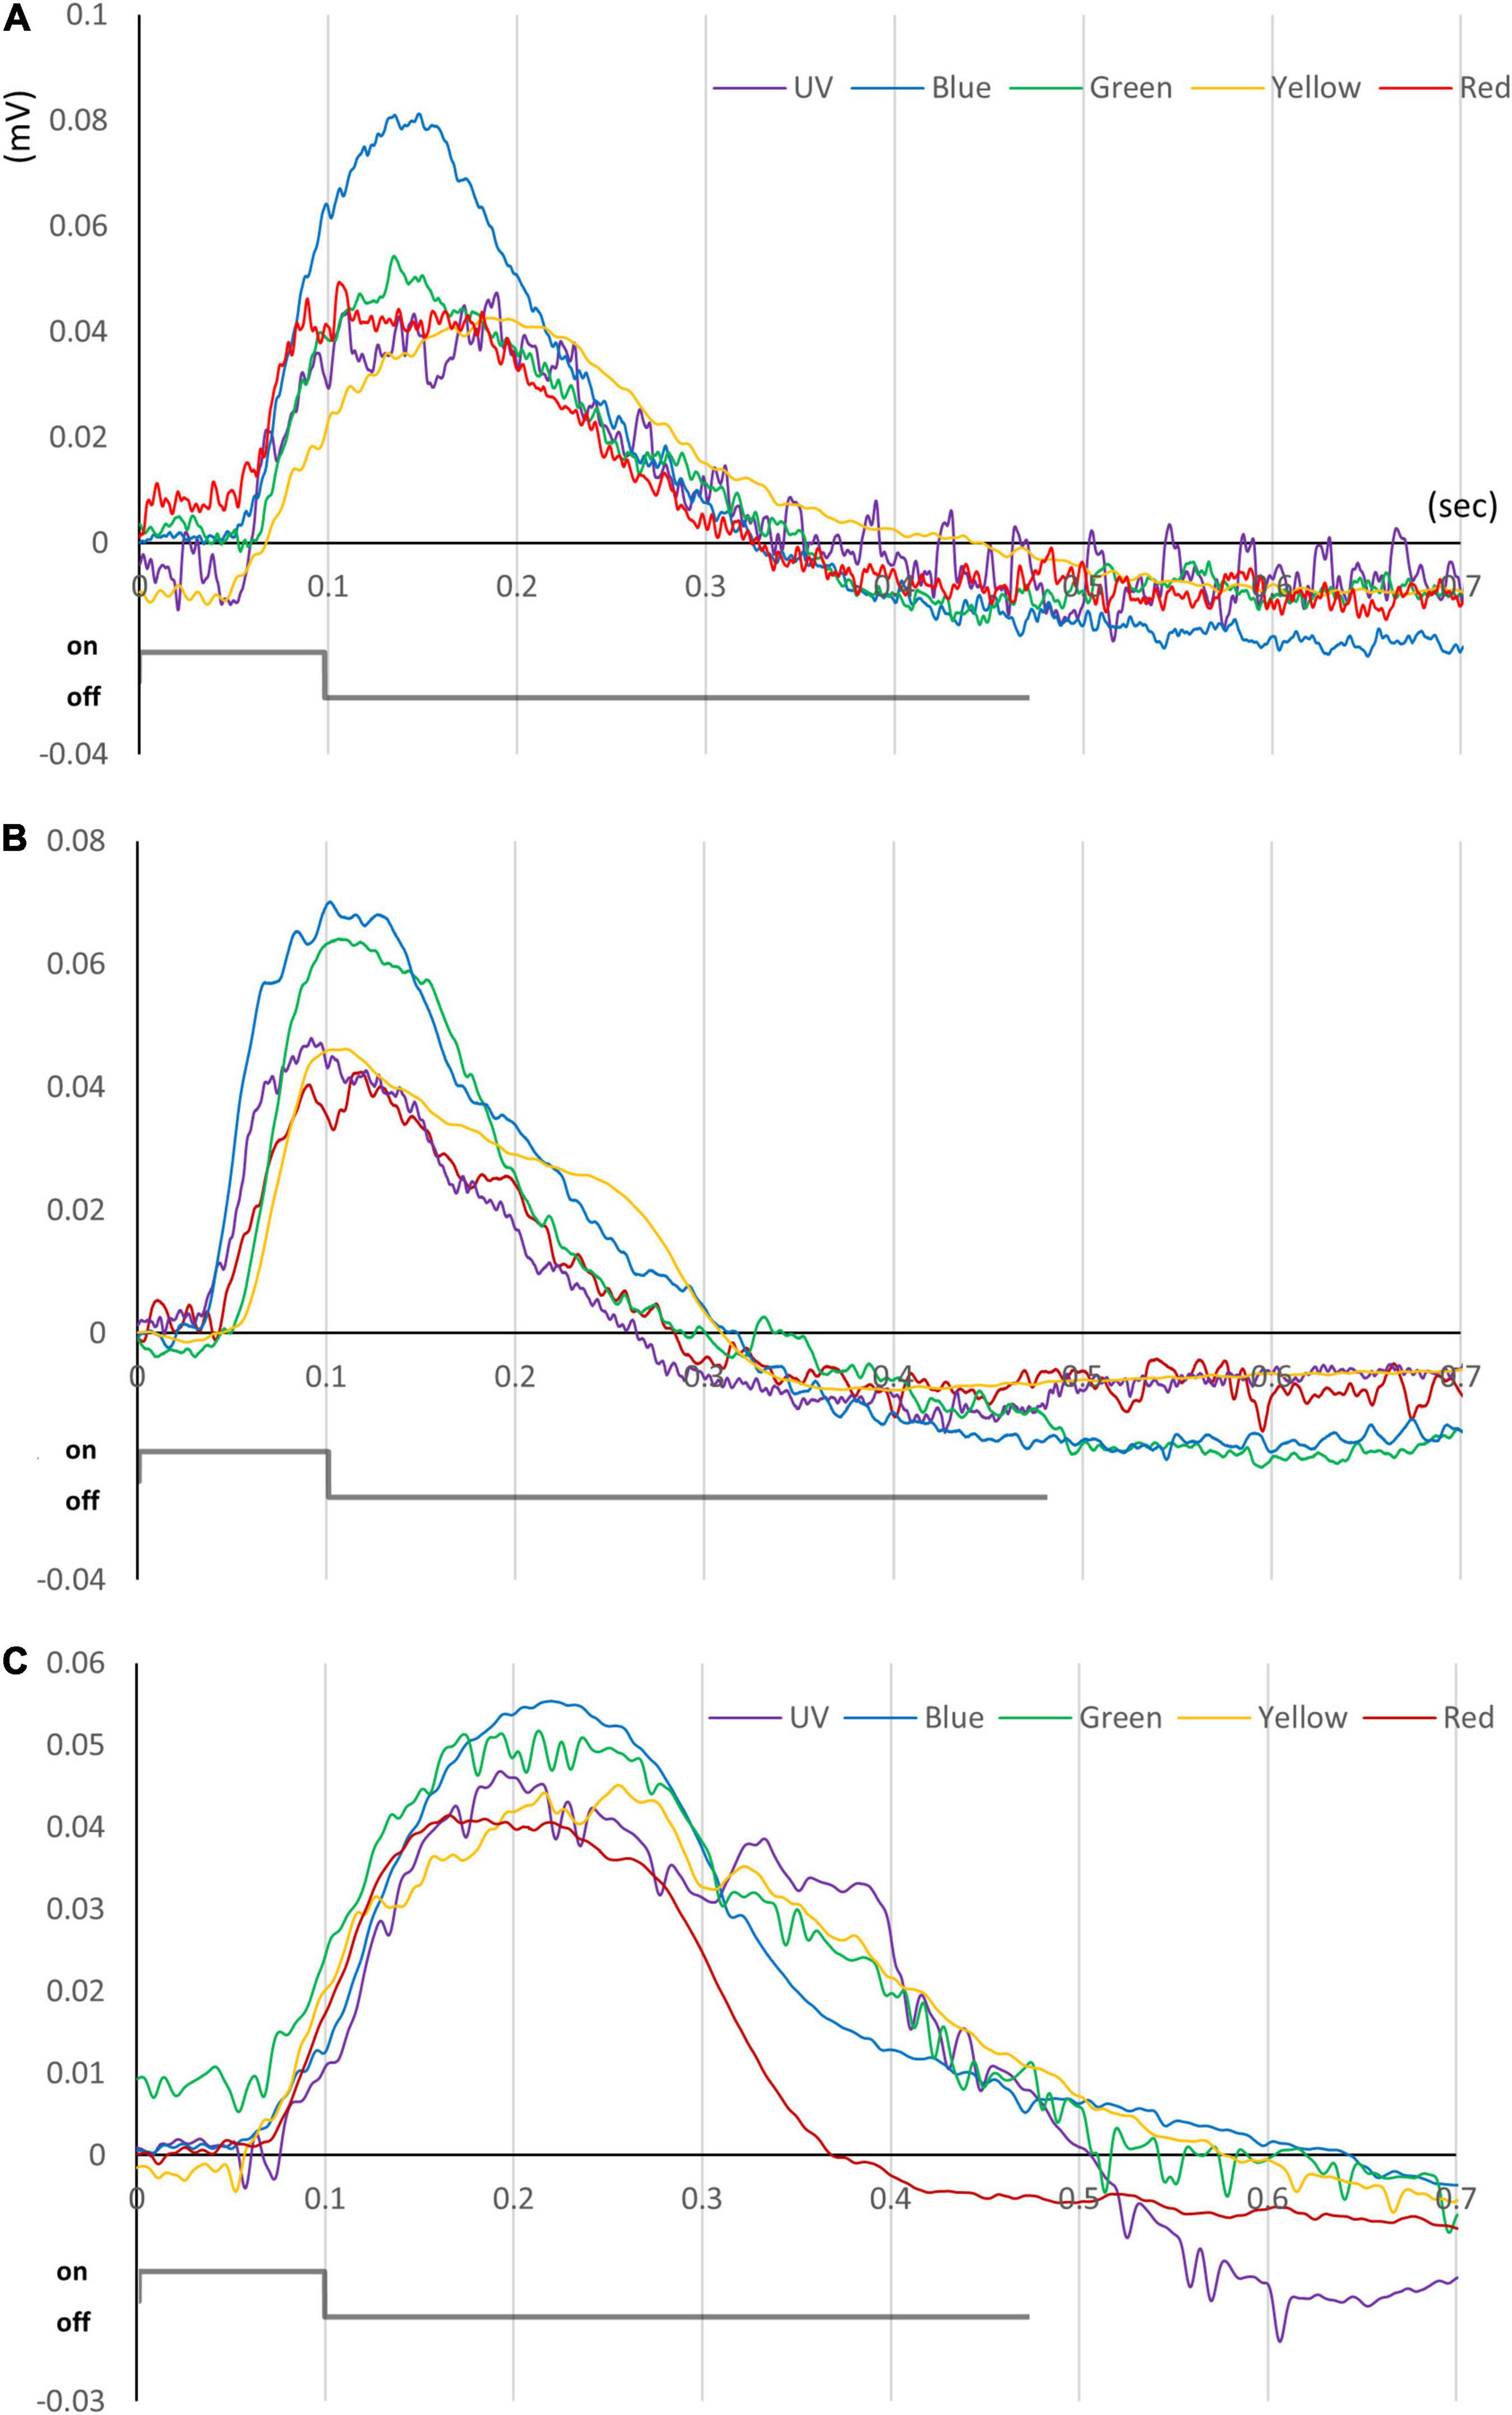
Figure 5. ERG traces for slipper lobsters. Data for (A) S. squammosus, (B) I. novemdentatus, and (C) P. japonicas are shown. Typical ERG traces taken from appropriate light stimuli for each spectrum. The color of each line represents the color of each stimulus. The intensities of the color stimuli were c. 10– 2–100 mol/m2/s for I. novemdentatus and c. 10– 1–101 mol/m2/s for S. squammosus and P. japonicas.
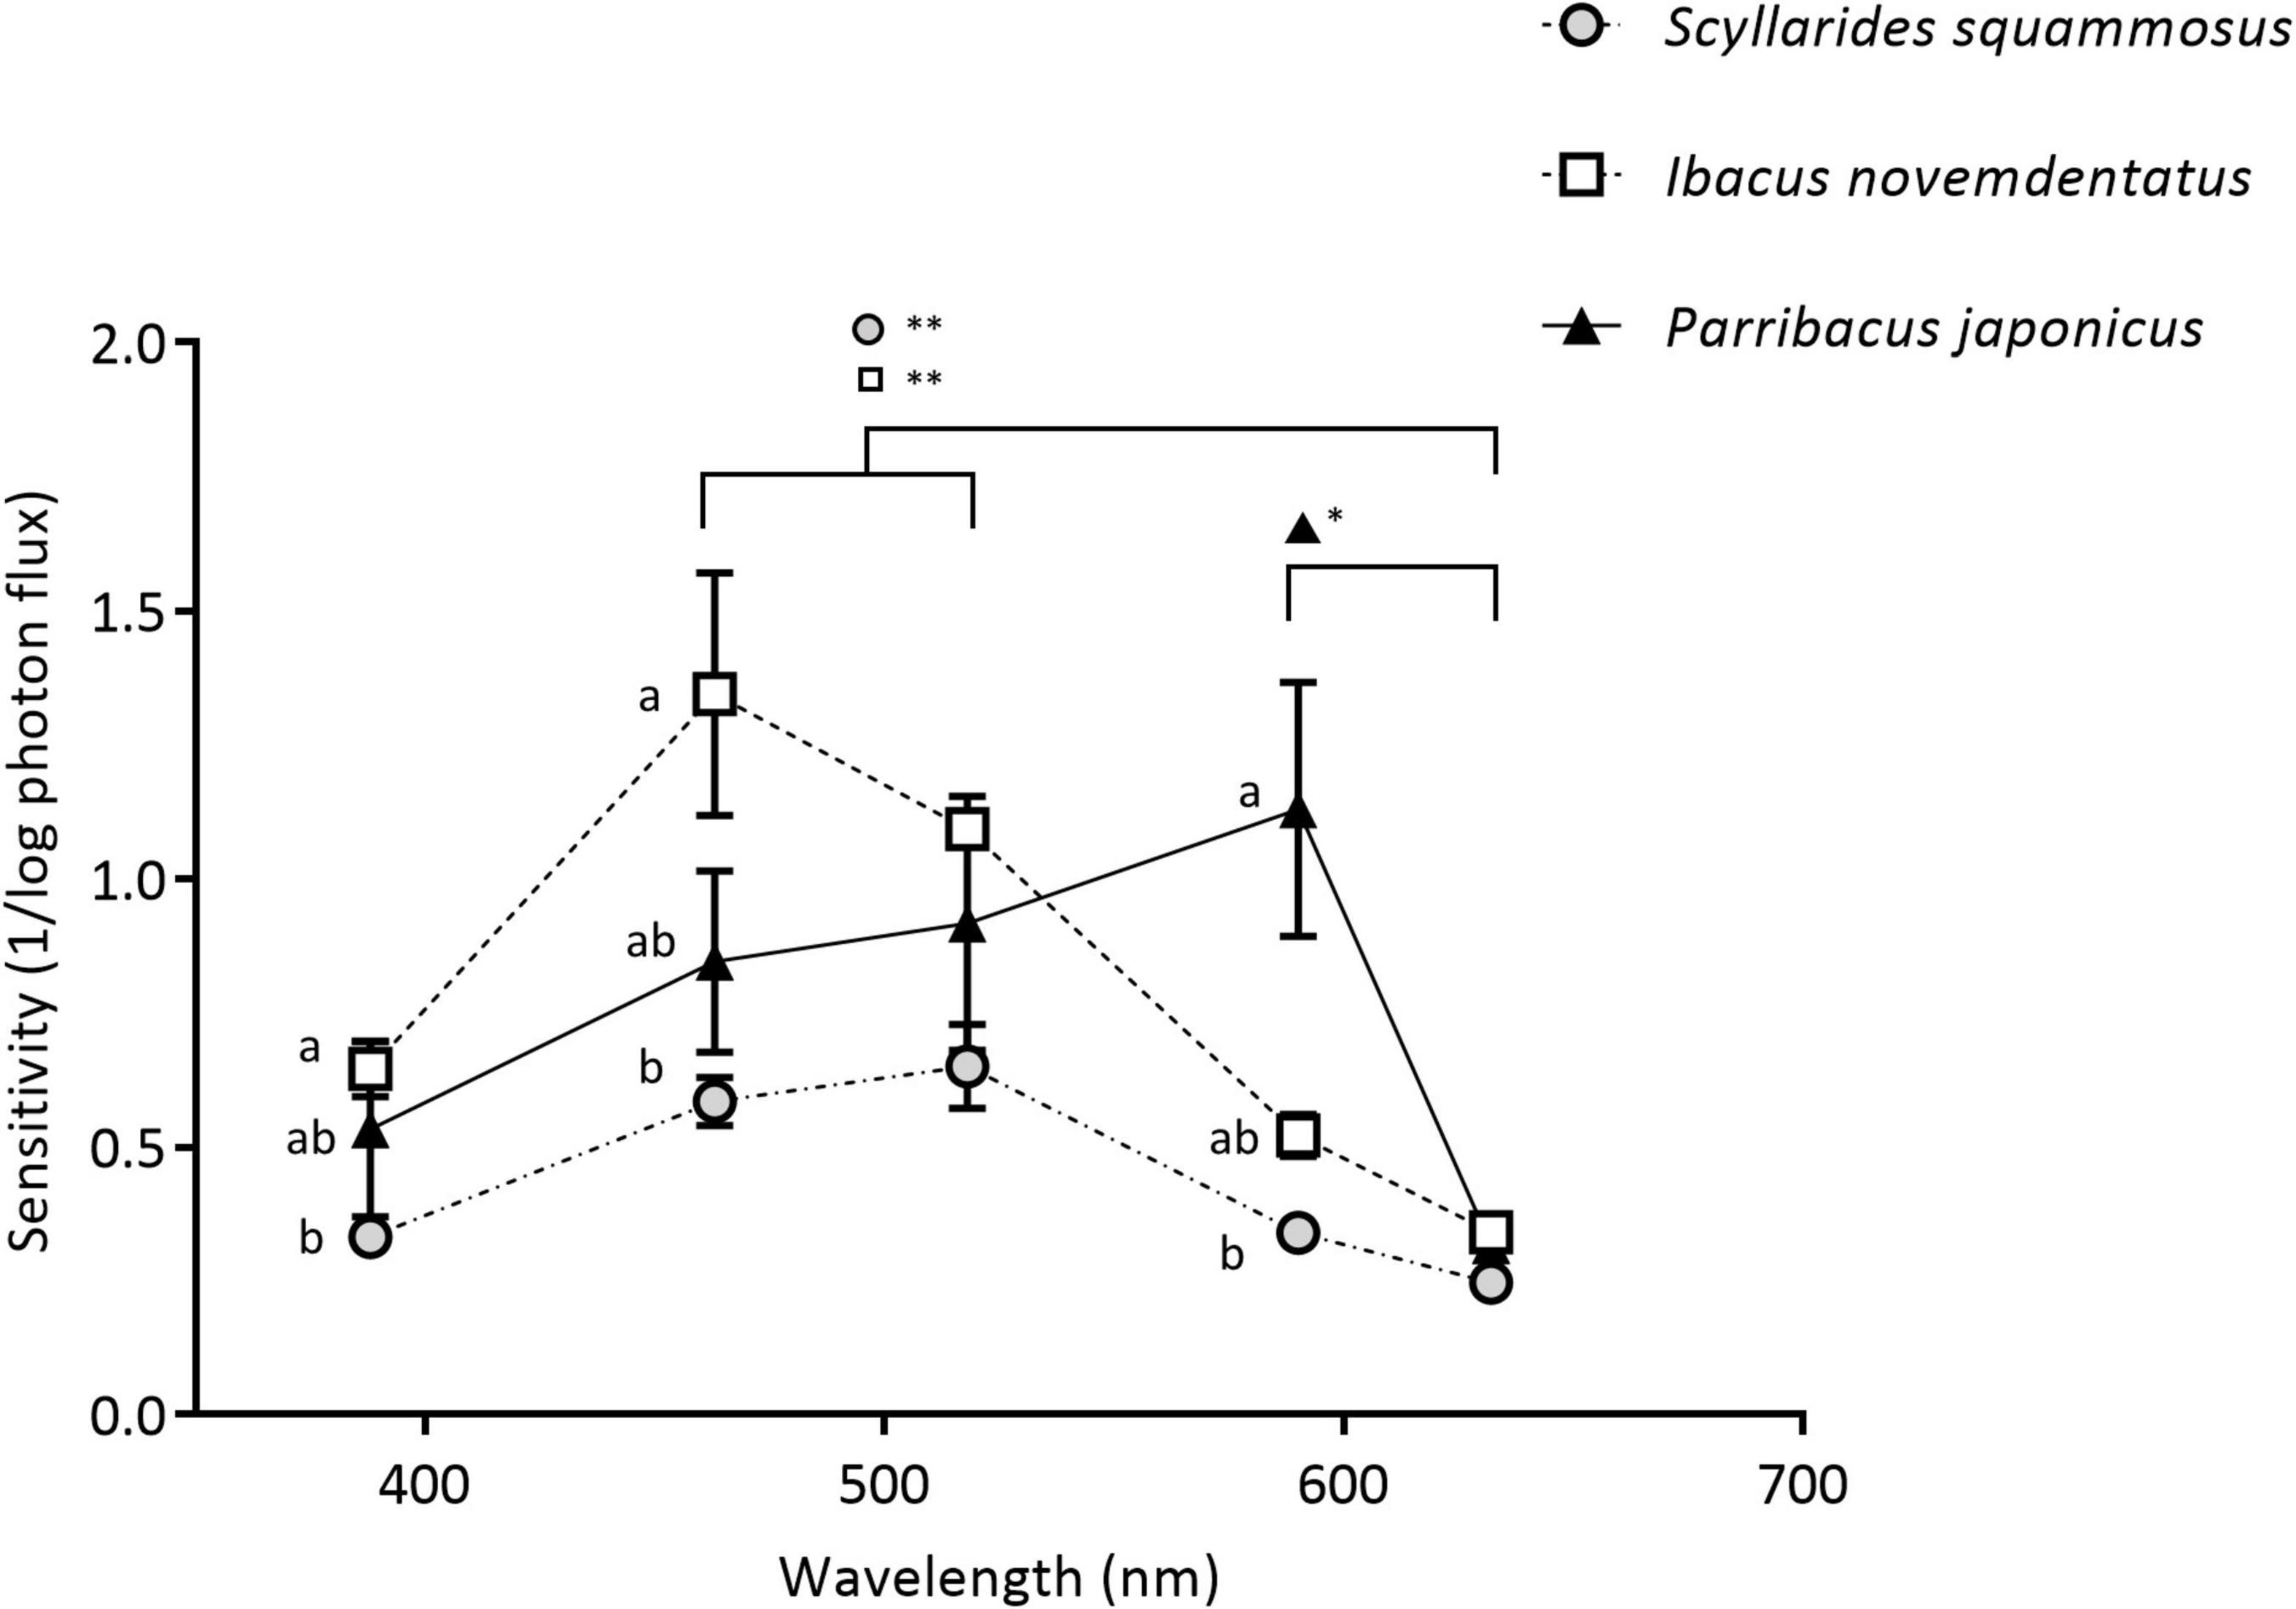
Figure 6. ERG absolute spectral sensitivities. Dark-adapted spectral sensitivities were measured in S. squammosus (n = 5), I. novemdentatus (n = 5) and P. japonicas (n = 6). Data are presented as the reciprocal of the intensity in log scale; mean ± SEM. *p < 0.05 or **p < 0.005 among the spectra. The symbols with different letters indicate a significant difference between species (p < 0.05).
A single peak absorbance curve was fitted to the spectral sensitivity data for each individual specimen. We excluded two samples of P. japonicas (Pearson’s r = 0.855 and 0.651; p = 0.065 and 0.234, respectively) and one sample of S. squammosus (Pearson’s r = 0.700; p = 0.188) from our statistical analysis. The remaining data revealed that the wavelengths for estimated peak sensitivities were distinct for the three species (Figure 7). The peak wavelength for deep-water I. novemdentatus (493.0 ± 9.8 nm; means ± SE, n = 5) was lower than that of shallow-water P. japonicas (537.5 ± 9.9 nm, n = 4) [df = 2, p = 0.010 for each comparison; Dunn’s post hoc comparison after one-way Kruskal-Wallis test (p = 0.013)], but there was no significant difference between the peak wavelengths for I. novemdentatus and S. squammosus (517.4 ± 2.1 nm, n = 4).
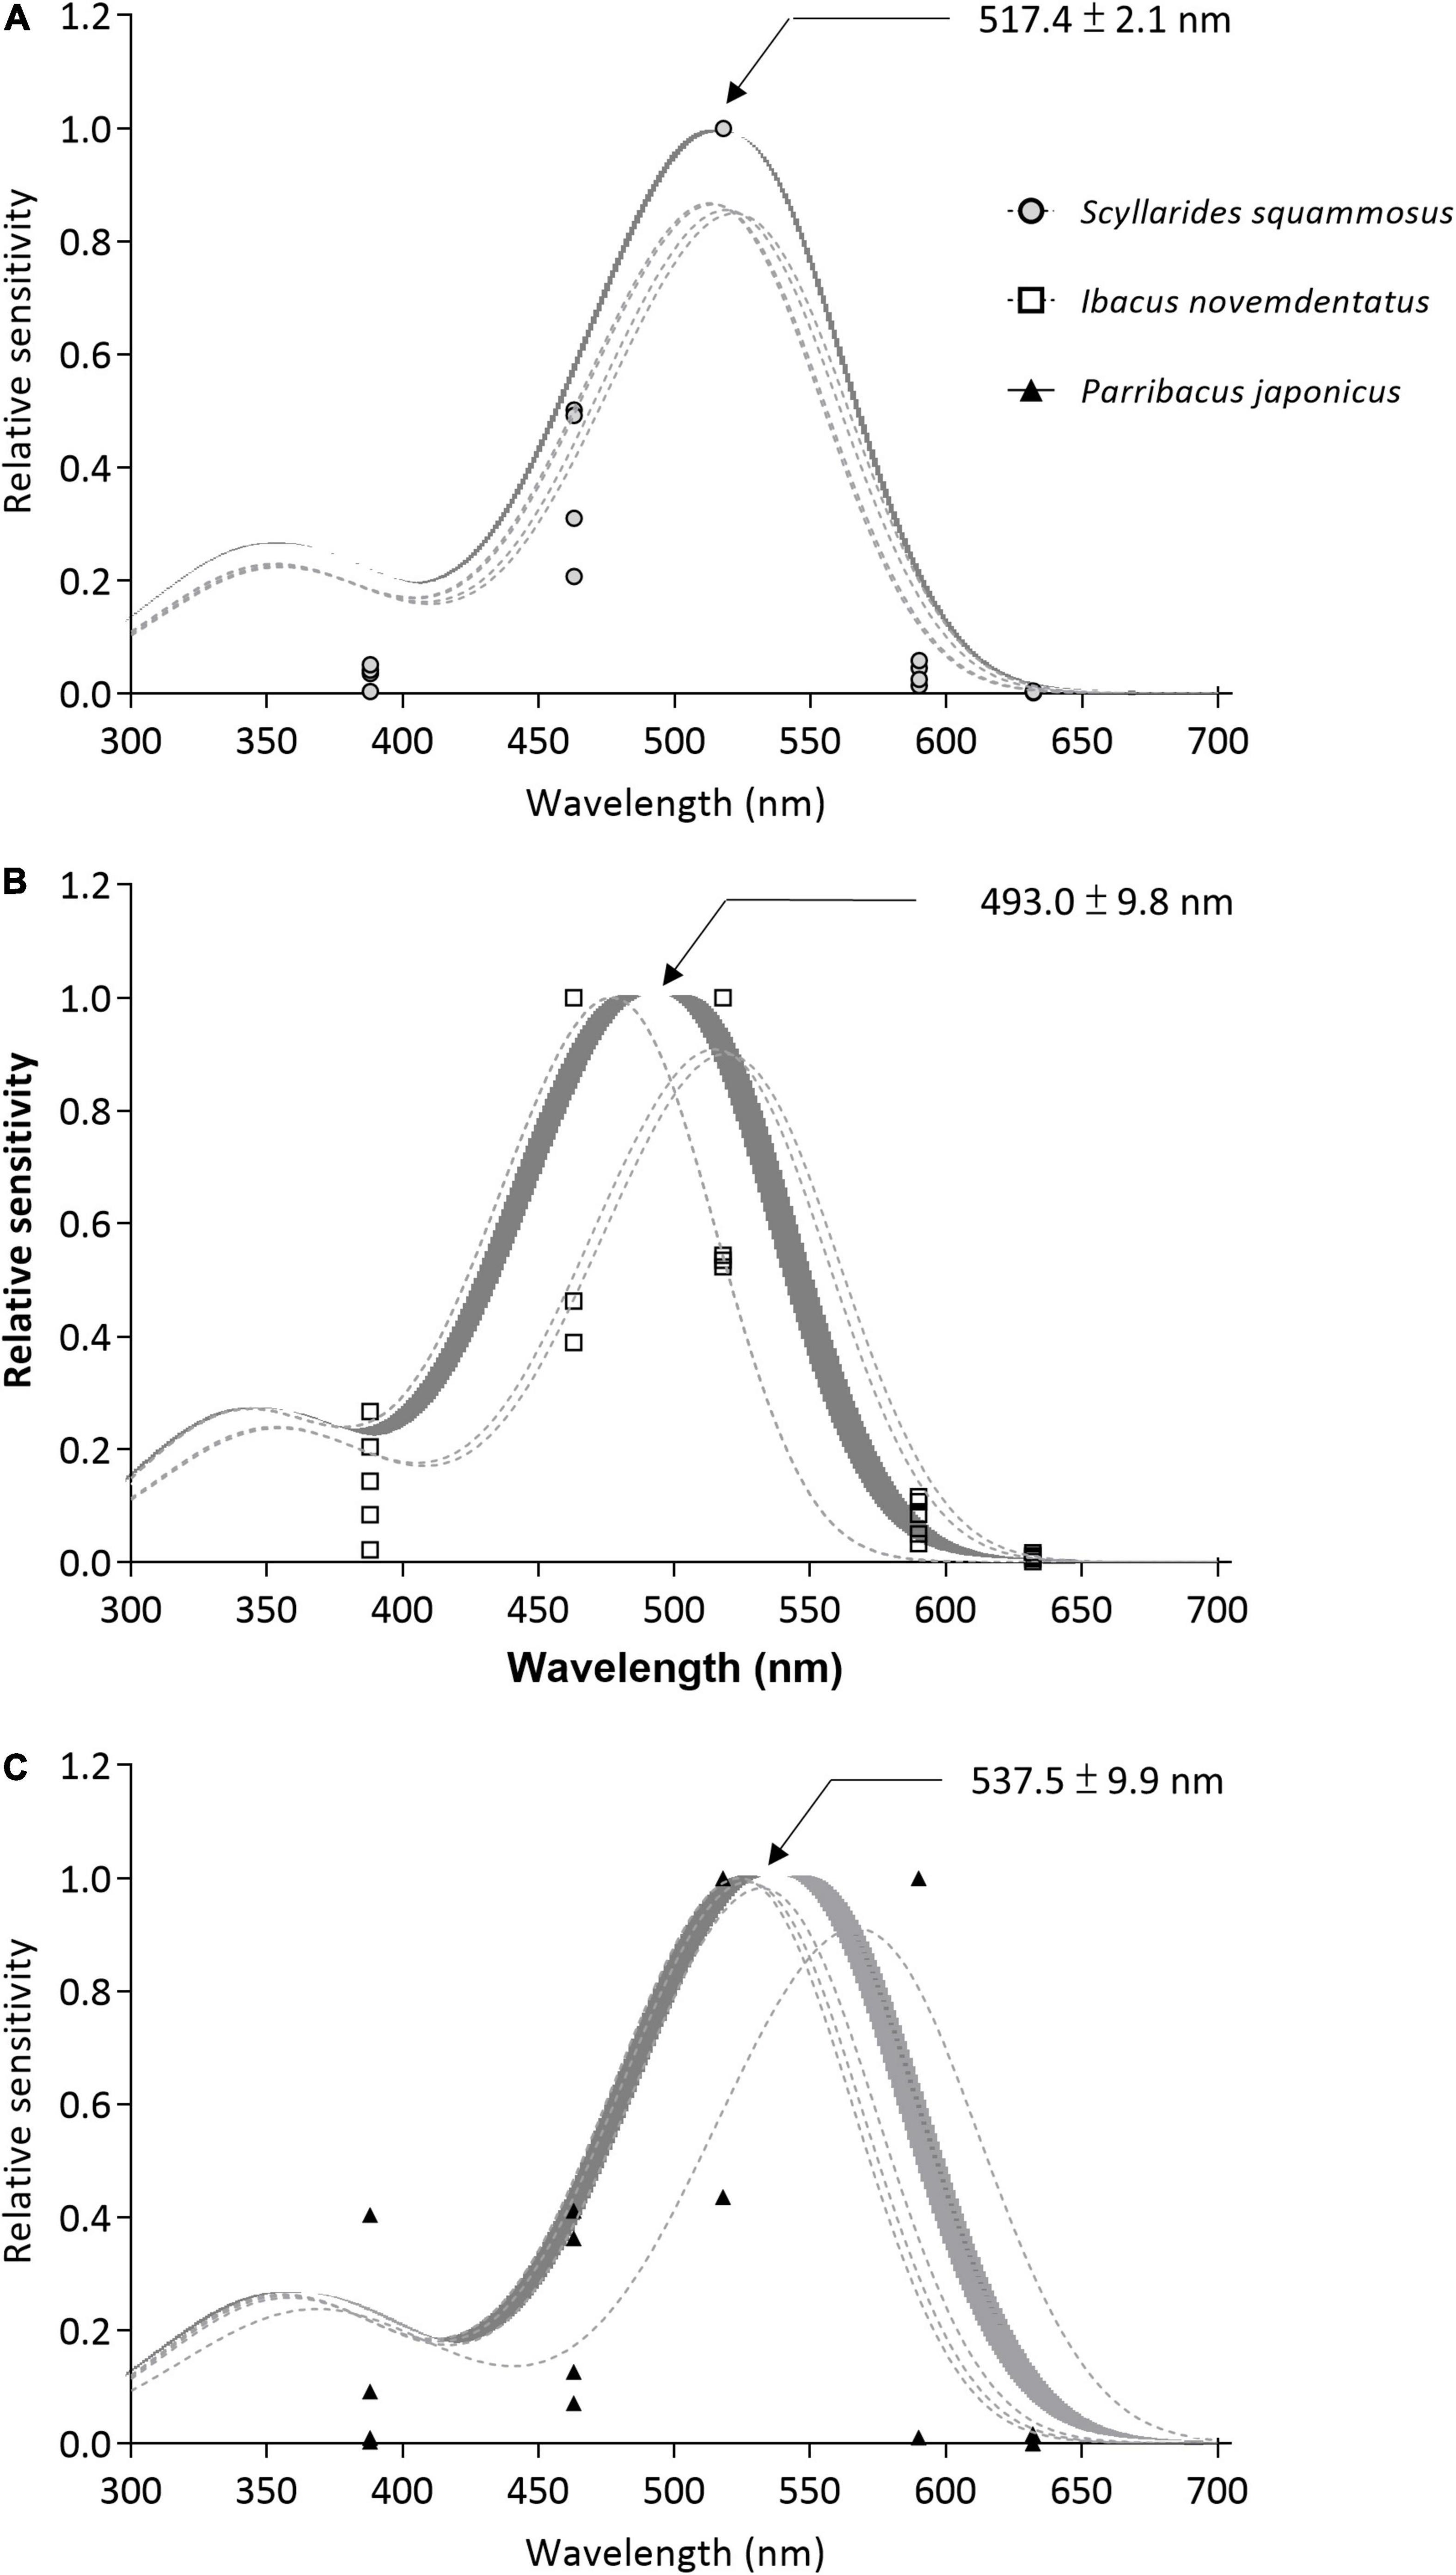
Figure 7. Spectral sensitivity curves. (A) S. squammosus (n = 4), (B) I. novemdentatus (n = 5), and (C) P. japonicas (n = 4). The gray lines indicate curves that were fitted to the sensitivity data of each individual. The solid line shows the curve that was fitted to the mean values, and the shaded area indicates the standard error.
Temporal Resolution
In addition to evaluating spectral sensitivities, we also measured ERG responses under the flicker test for all three species (Figure 8). CFFmax values did not differ among colors for the three species (df = 4, I. novemdentatus p = 0.504; S. squammosus p = 924; P. japonicus p = 247; Friedman test). Overall, shallow-water P. japonicus displayed the lowest CFFmax of all three tested species. The CFFmax for P. japonicus was significantly lower than that of deep-water I. novemdentatus for UV, green, yellow, and red wavelengths [df = 2, p = 0.013, 0.004, 0.005, and 0.004, respectively; Dunn’s post hoc comparison after one-way Kruskal-Wallis test (p = 0.017, 0.005, 0.006, and 0.005)] (Figure 9).
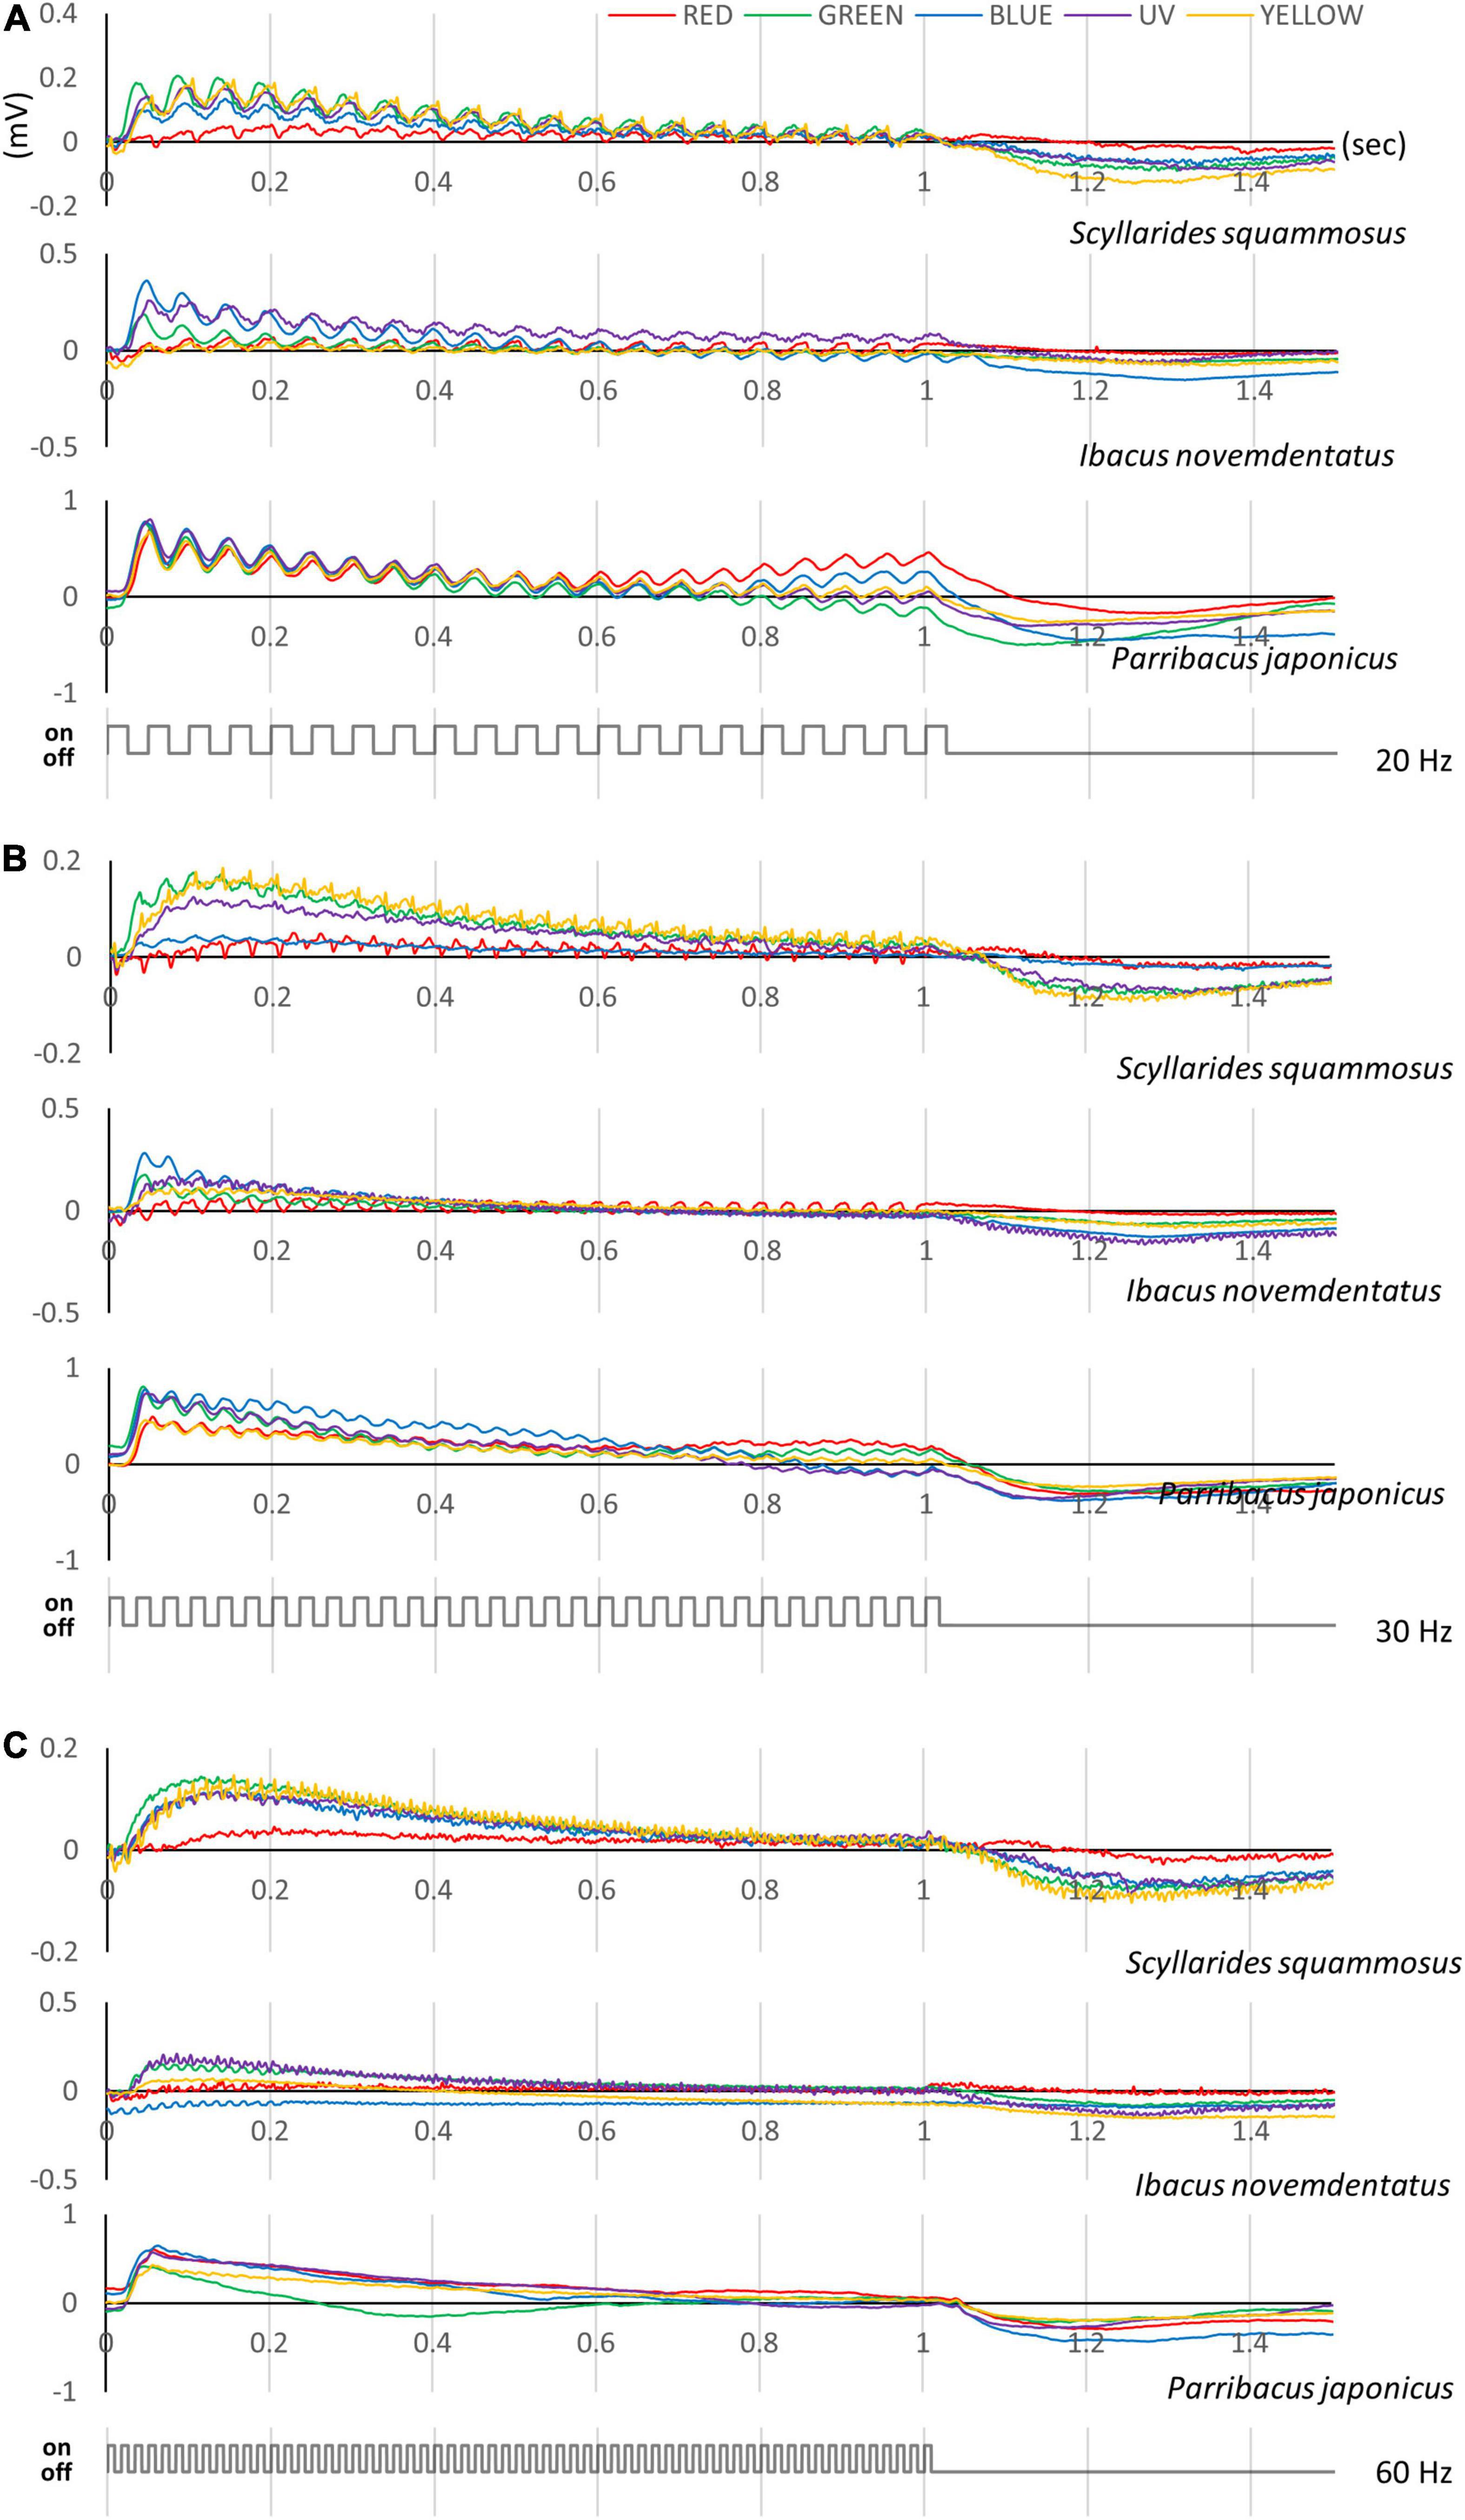
Figure 8. Flicker ERG responses of slipper lobsters. Data for (A) S. squammosus, (B) I. novemdentatus, and (C) P. japonicas are shown. Typical flicker ERG traces taken from appropriate light stimuli for each spectrum at 20, 40, and 60 Hz. The color of each line represents the color of each spectrum. The intensities of the color stimuli were c. 10– 1–101 mol/m2/s for I. novemdentatus and c. 10– 1–102 mol/m2/s for S. squammosus and P. japonicas.
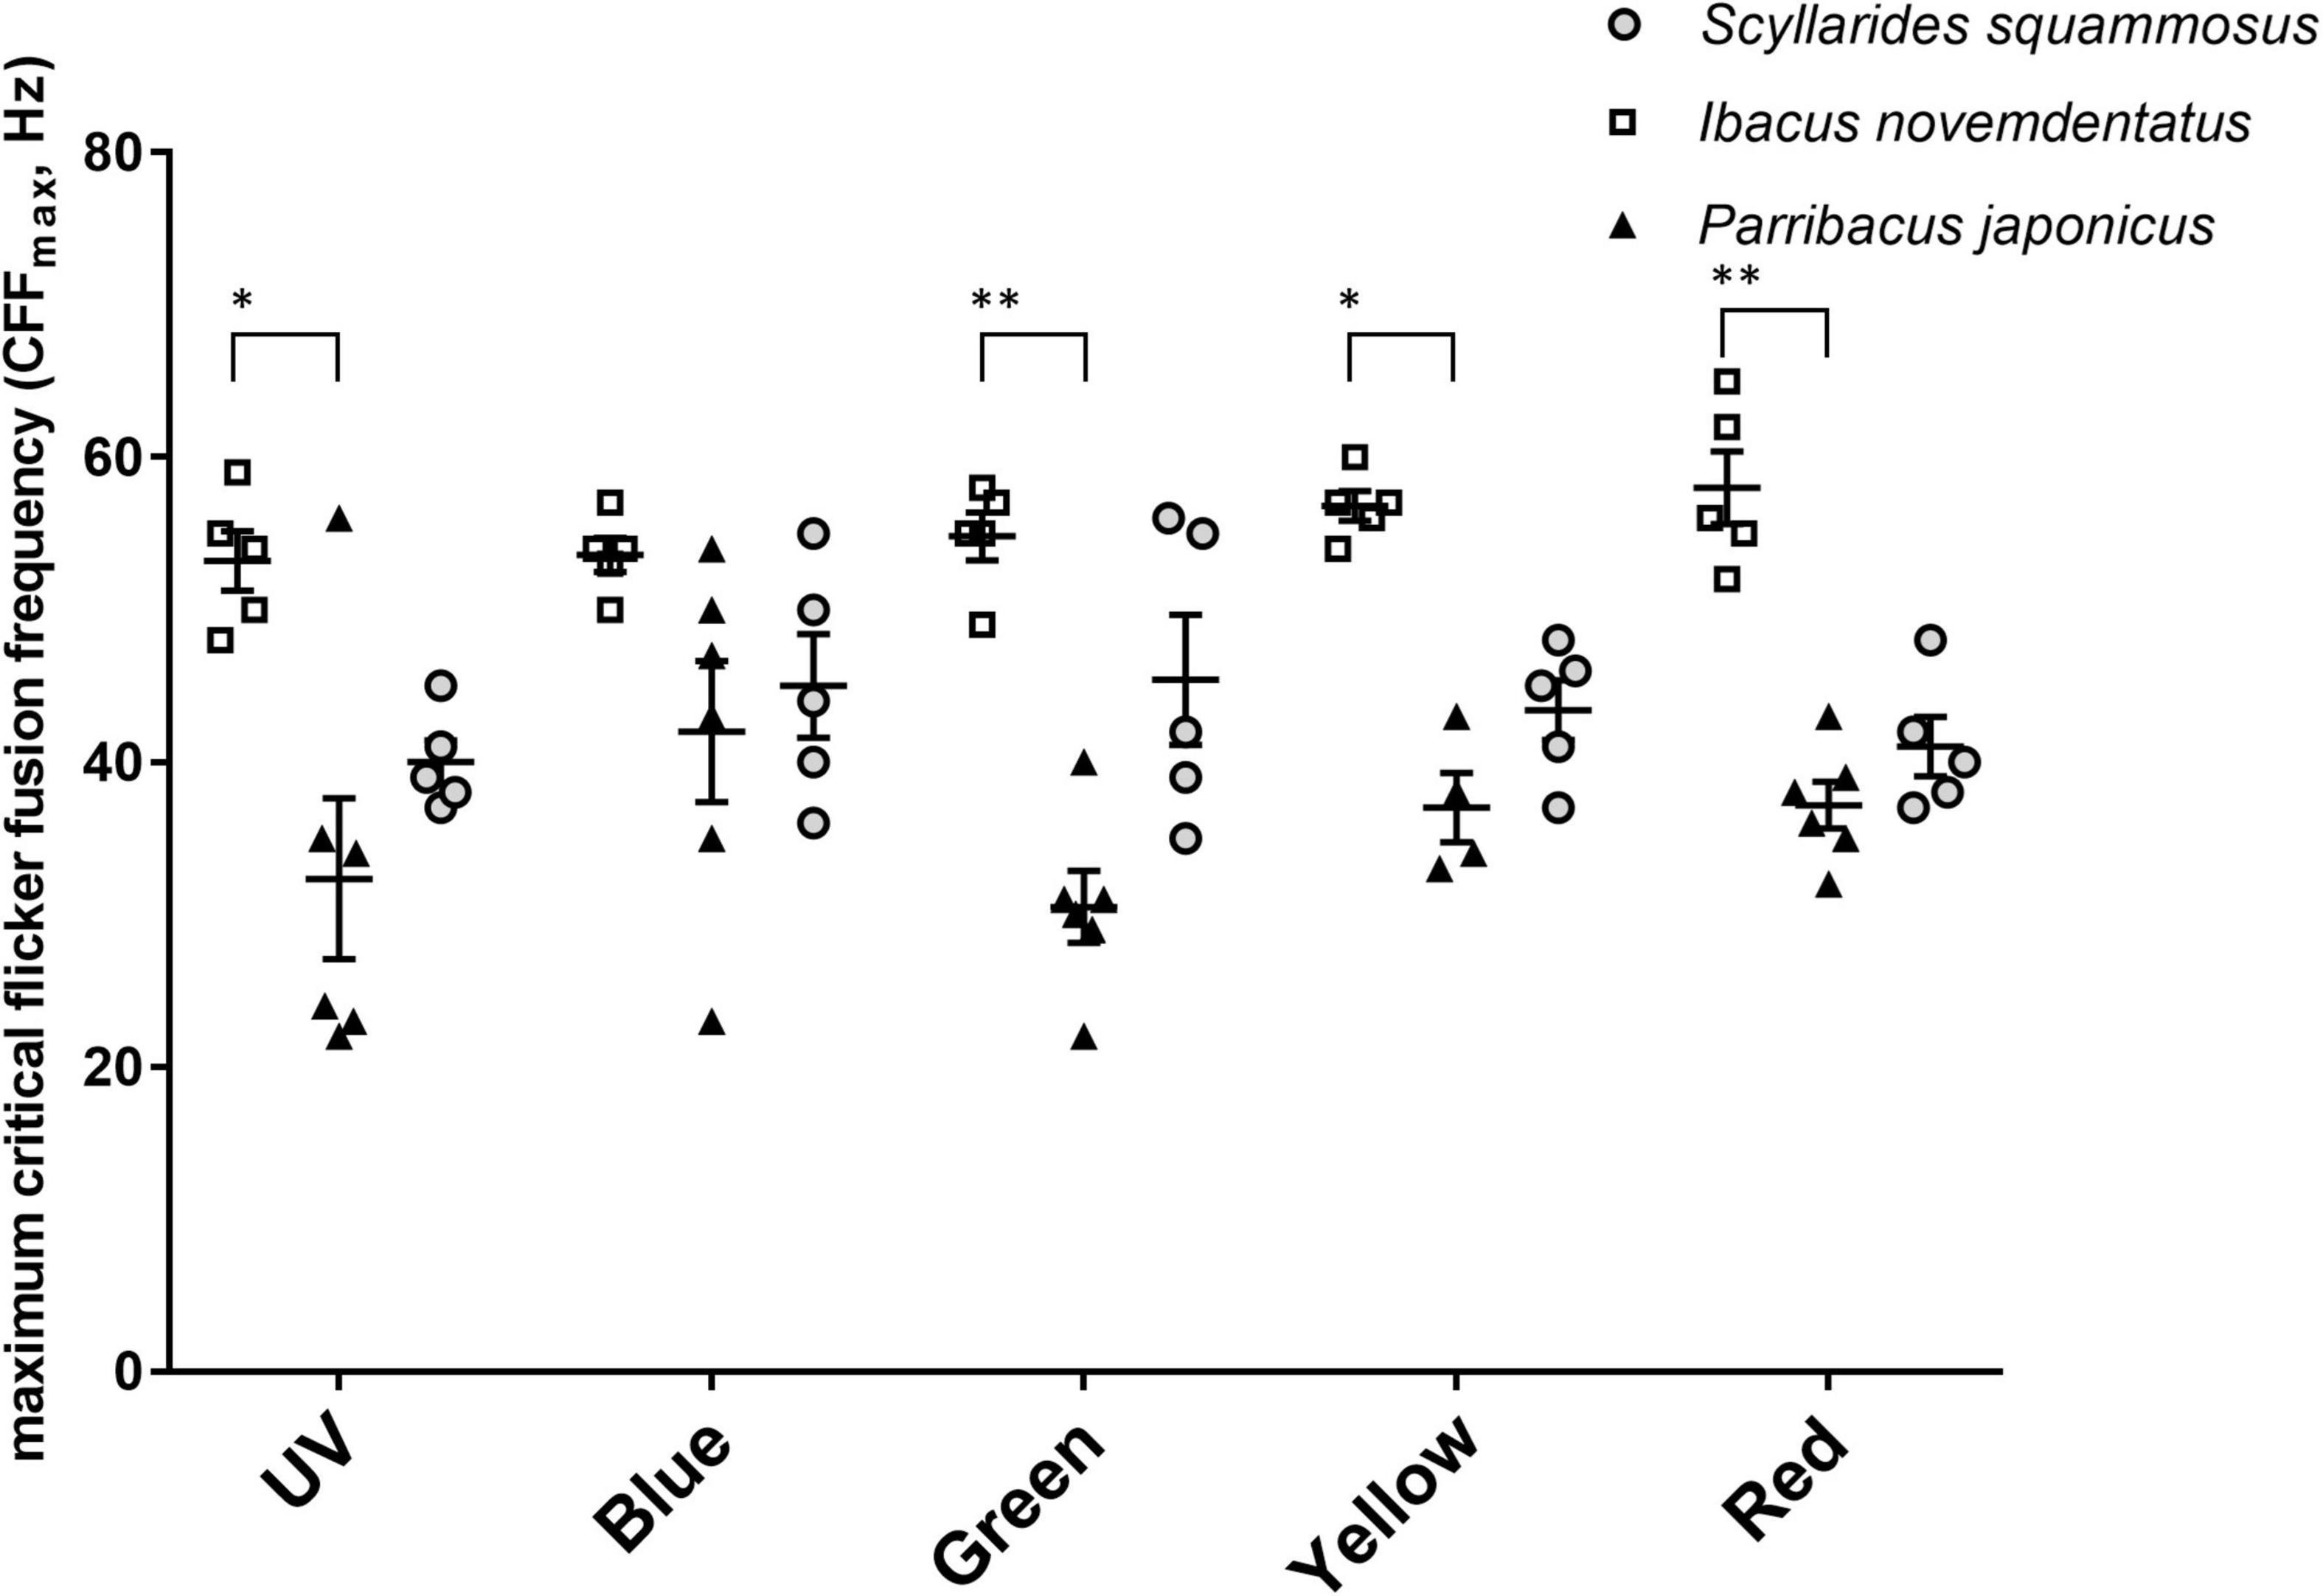
Figure 9. Maximum critical flicker fusion frequency (CFFmax). CFFmax values (mean ± SEM) for S. squammosus (n = 5), I. novemdentatus (n = 5), and P. japonicas (n = 6) are shown. *p < 0.05 or **p < 0.005 represent significant differences among spectra.
Discussion
In this study, we provide essential biological information regarding the visual system of nocturnal slipper lobsters residing at various vertical depths in the Pacific Ocean. Our analyses indicate diverse spectral and temporal sensitivities among nocturnal species from different habitat depths. Our morphological analysis revealed all three nocturnal slipper lobster species possess square facets in their eyes, implying that they have “refracting” superposition eyes in which images are focused by reflecting light off the sides of the four-sided crystalline cones (Land, 1976). Moreover, we observed a clear zone between the rhabdoms and distal pigment. Meyer-Rochow and Gál (2004) suggested that such clear zones enhance light sensitivity and they may be relatively large in species inhabiting dim-light environments. Apposition eyes are thought to be an ancestral crustacean trait and may be present in the early life stages of most decapods (reviewed in Luque et al., 2019). However, the compound eyes of slipper lobsters with their superposition optical structures may improve vision under dim-light conditions (reviewed in Meyer-Rochow, 2001; Cronin and Porter, 2008). Such refracting superposition eyes have also been reported for other benthic decapods in deep-water systems, such as the crab superfamilies Homolodromioidea, Dromioidea, and Homoloidea (Luque et al., 2019), and this type of eye is associated with some nocturnal arthropods (Meyer-Rochow and Gál, 2004). Given their possession of these specialized eye structures, we infer that these slipper lobsters have excellent dim-light vision, which would assist them in their nocturnal activity patterns (Lavalli et al., 2007; Goldstein et al., 2015) and facilitate adaptation to habitats of different depths.
Studies comparing the temporal resolution and visual sensitivity of marine decapods to different colors are relatively uncommon. For species having compound eyes harboring multiple classes of photoreceptors, different wavelengths of monochromatic light could stimulate those various photoreceptors. Accordingly, multiple monochromic wavelengths of light stimuli would result in more than one CFFmax value in a flicker ERG test (Nakagawa and Eguchi, 1994). Our data revealed only one peak in each of the slipper lobster spectral sensitivity curves, and the temporal resolutions did not differ significantly among colors. Therefore, these nocturnal species likely only possess one class of photoreceptor, and probably display monochromatic vision, at least under dark adaption. Although some decapods, such as panchromatic mantis shrimp (Odontodactylidae) have multiple visual pigments for photosensitivity (Marshall and Oberwinkler, 1999; Thoen et al., 2014), the spectral sensitivities of most decapods that have been studied to date are either monochromatic or dichromatic (reviewed in Marshall et al., 1999). Those species typically have two distinct peaks at UV/blue (∼400 nm) and blue-green (480–540 nm) wavelengths, or only one peak at a wavelength of 470–500 nm (reviewed in Marshall et al., 2003). However, no significant correlations between the number of spectral sensitivities and habitat depth or light environment have yet been reported. Several cleaner shrimps inhabiting shallow coral reefs, e.g., Lysmata amboinensis (Lysmatidae), Ancylomenes pedersoni (Palaemonidae), and Urocaridella antonbruunii (Palaemonidae), present a single sensitivity peak (Frank et al., 2012). Hermit crabs are considered shallow-water or terrestrial species, and three Paguridae (Pagurus annulipes, P. longicarpus, and P. pollicaris) were found to display a single absorption peak in visual pigment curves (Cronin and Forward, 1988). Some deep-sea shrimps (Oplophoridae: e.g., Janicella spinacauda, Oplophorus gracilirostris, O. spinosus, and Systellaspis debilis) (Frank and Case, 1988) and some littoral crabs (Portunidae: Callinectes sp. and Carcinus sp.) (Martin and Mote, 1982) have two spectral sensitivity peaks.
The light environment of the photic zone is mainly dominated by sunlight (reviewed in Mascarenhas and Keck, 2018) but, at mesopelagic depths, bioluminescence is the primary source of external light. In deep-water regions, a blue-shifted sunlight spectrum exists, and bioluminescence from decomposers, such as bacteria, may be an important visual cue for deep-sea scavengers to find food (Widder, 2010). It is generally believed that the most common bioluminescence emission spectrum is blue, with the second most common spectral range being green (Widder, 2010). For example, in situ observations have demonstrated that the emitted light spectra of marine creatures collected at depths of 500–1,000 m are mostly blue-green, with a peak at 455–535 nm and a full-width half-max (FWHM) of 30–80 nm (Johnsen et al., 2012). The spectral sensitivity peaks (λmax) of diverse decapods that inhabit varying depths, i.e., species within Palinuridae, Chirostylidae, Eumunididae, Galatheidae, Munidopsidae, Nephropidae, Gecarcinidae, Grapsidae, Ocypodidae, Polychiidae, Portunidae, Sesarmidae, Varunidae, Alpheidae, Alvinocarididae, Eugonatonotidae, Lysmatidae, Oplophoridae, Oplophoroidea, Palaemonidae, Pandalidae, Pasiphaeidae, Penaeidae, Penaeoidea, and Sergestidae (details of the species and respective references are shown in Supplementary Data 4), indicate that λmax might shift toward blue (λmax 470–490 nm) with increasing depth (Figure 10; Grober, 1990; Layne et al., 1997; Marshall et al., 2003; Matsuda and Wilder, 2010, 2014; Frank et al., 2012; Caves et al., 2016; Kingston et al., 2019, 2020; Jessop et al., 2020; Qian, 2020). Additionally, although UV light cannot penetrate to abyssal depths (>1,000 m), some Oplophoridae decapods there exhibit a single spectral peak at a wavelength as low as 400 nm (reviewed in Marshall et al., 2003; Figure 10). Nevertheless, we acknowledge that the regression curve shown in Figures 10, 11 was built from published data on a limited number of species, and the data cited therein was derived from various scales and experimental approaches. Based on our measurements, the peak sensitivity of deep-water I. novemdentatus is at a similar wavelength to that of other decapod species inhabiting regions below the mesophotic zone [e.g., Eugonatonotus crassus (Eugonatonotidae), Heterocarpus ensifer (Pandalidae), Eumunida picta (Eumunididae), Munidopsis erinacea (Munidopsidae), and Munidopsis tridentate (Munidopsidae)] (Frank et al., 2012). These species are typically found at depths of 525–700 m (i.e., in the aphotic zone), and their spectral peaks range from 487 to 497 nm (Figure 10).
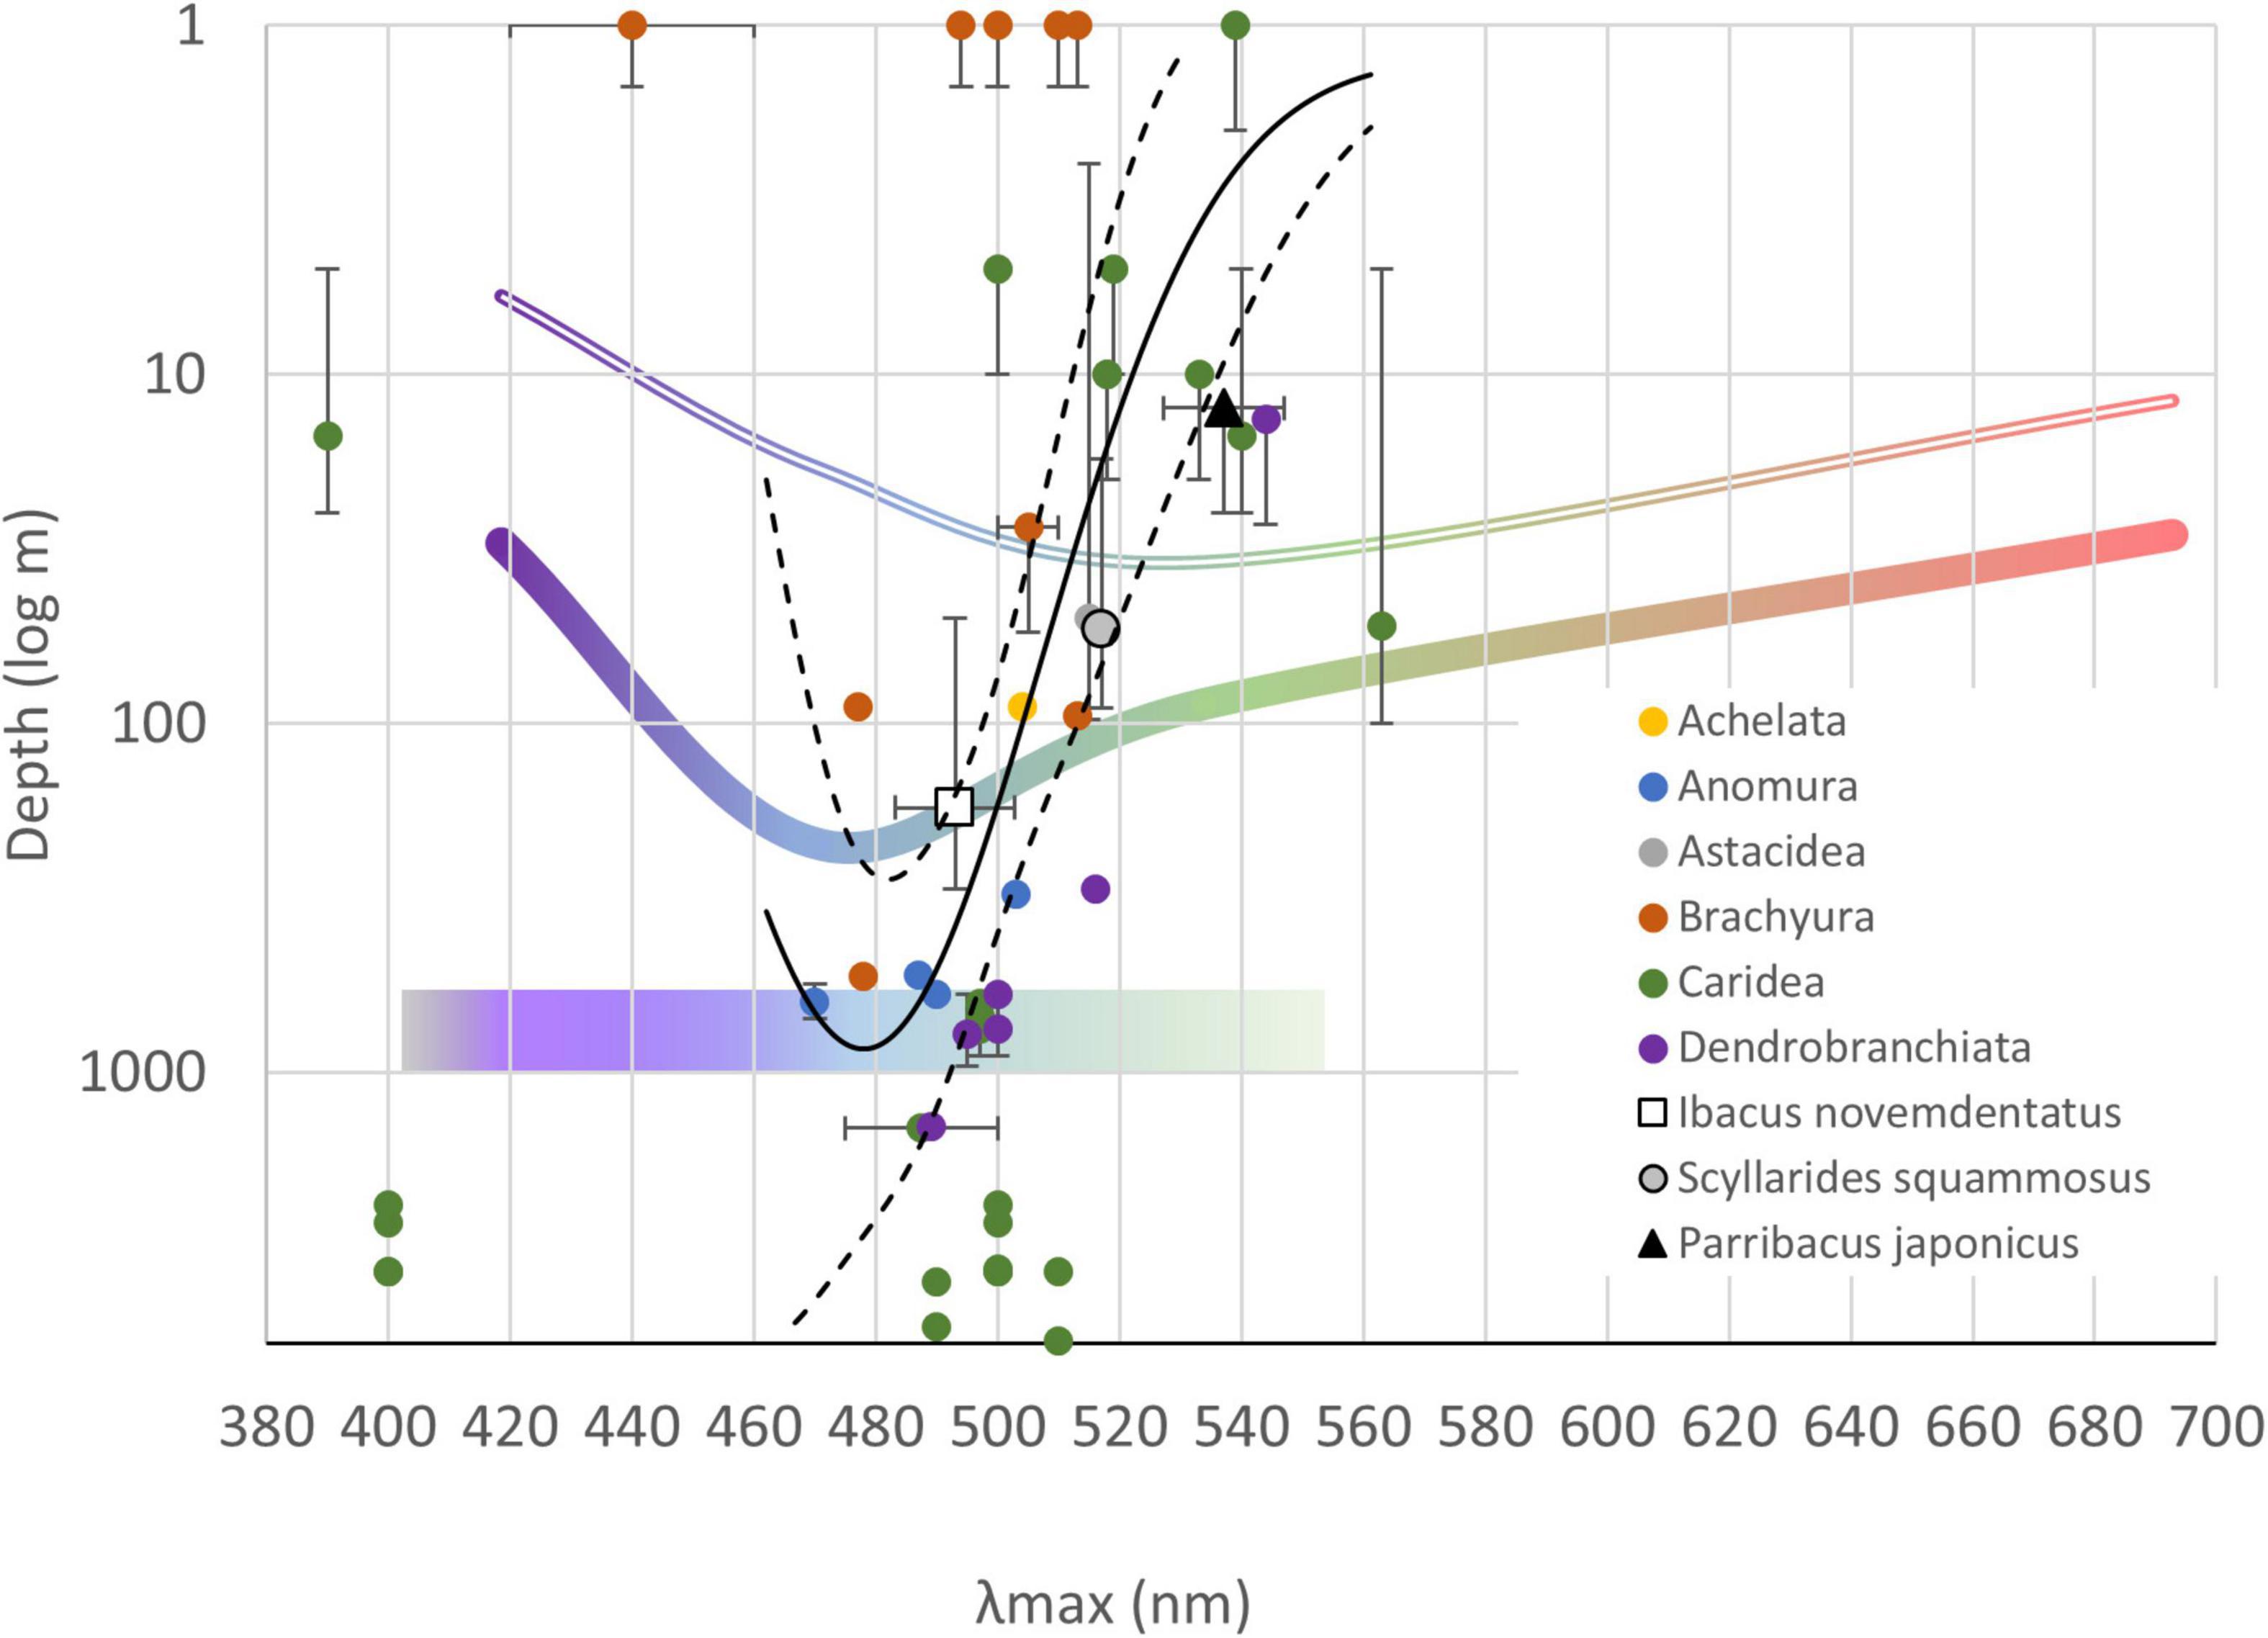
Figure 10. Peak spectral sensitivities (λmax) and the inhabited depths for slipper lobsters and other decapods. The mean peak wavelengths are shown along the horizontal axis; the error bars indicate maximum and minimum range of peak wavelengths that have been reported for each species (see Supplementary Data 4 for details). The means of inhabiting depth are shown along the vertical axis, and the error bars indicate the range of depths (in log scale) reported in the literature or cited in an online database (https://www.sealifebase.ca/). The colored curves show sunlight penetration in the open ocean (thick line) or coastal waters (double thin line) (re-plotted from Mohamed, 2019). The colored bar at 1,000 log m shows the bioluminescence spectra of creatures found between 500–1,000 m (Johnsen et al., 2012). A Gaussian regression curve (solid black line) was fitted to the plots (except for dichromatic species) by the least squares method (R2 = 0.30). The 90% confidence level is shown (dashed lines).
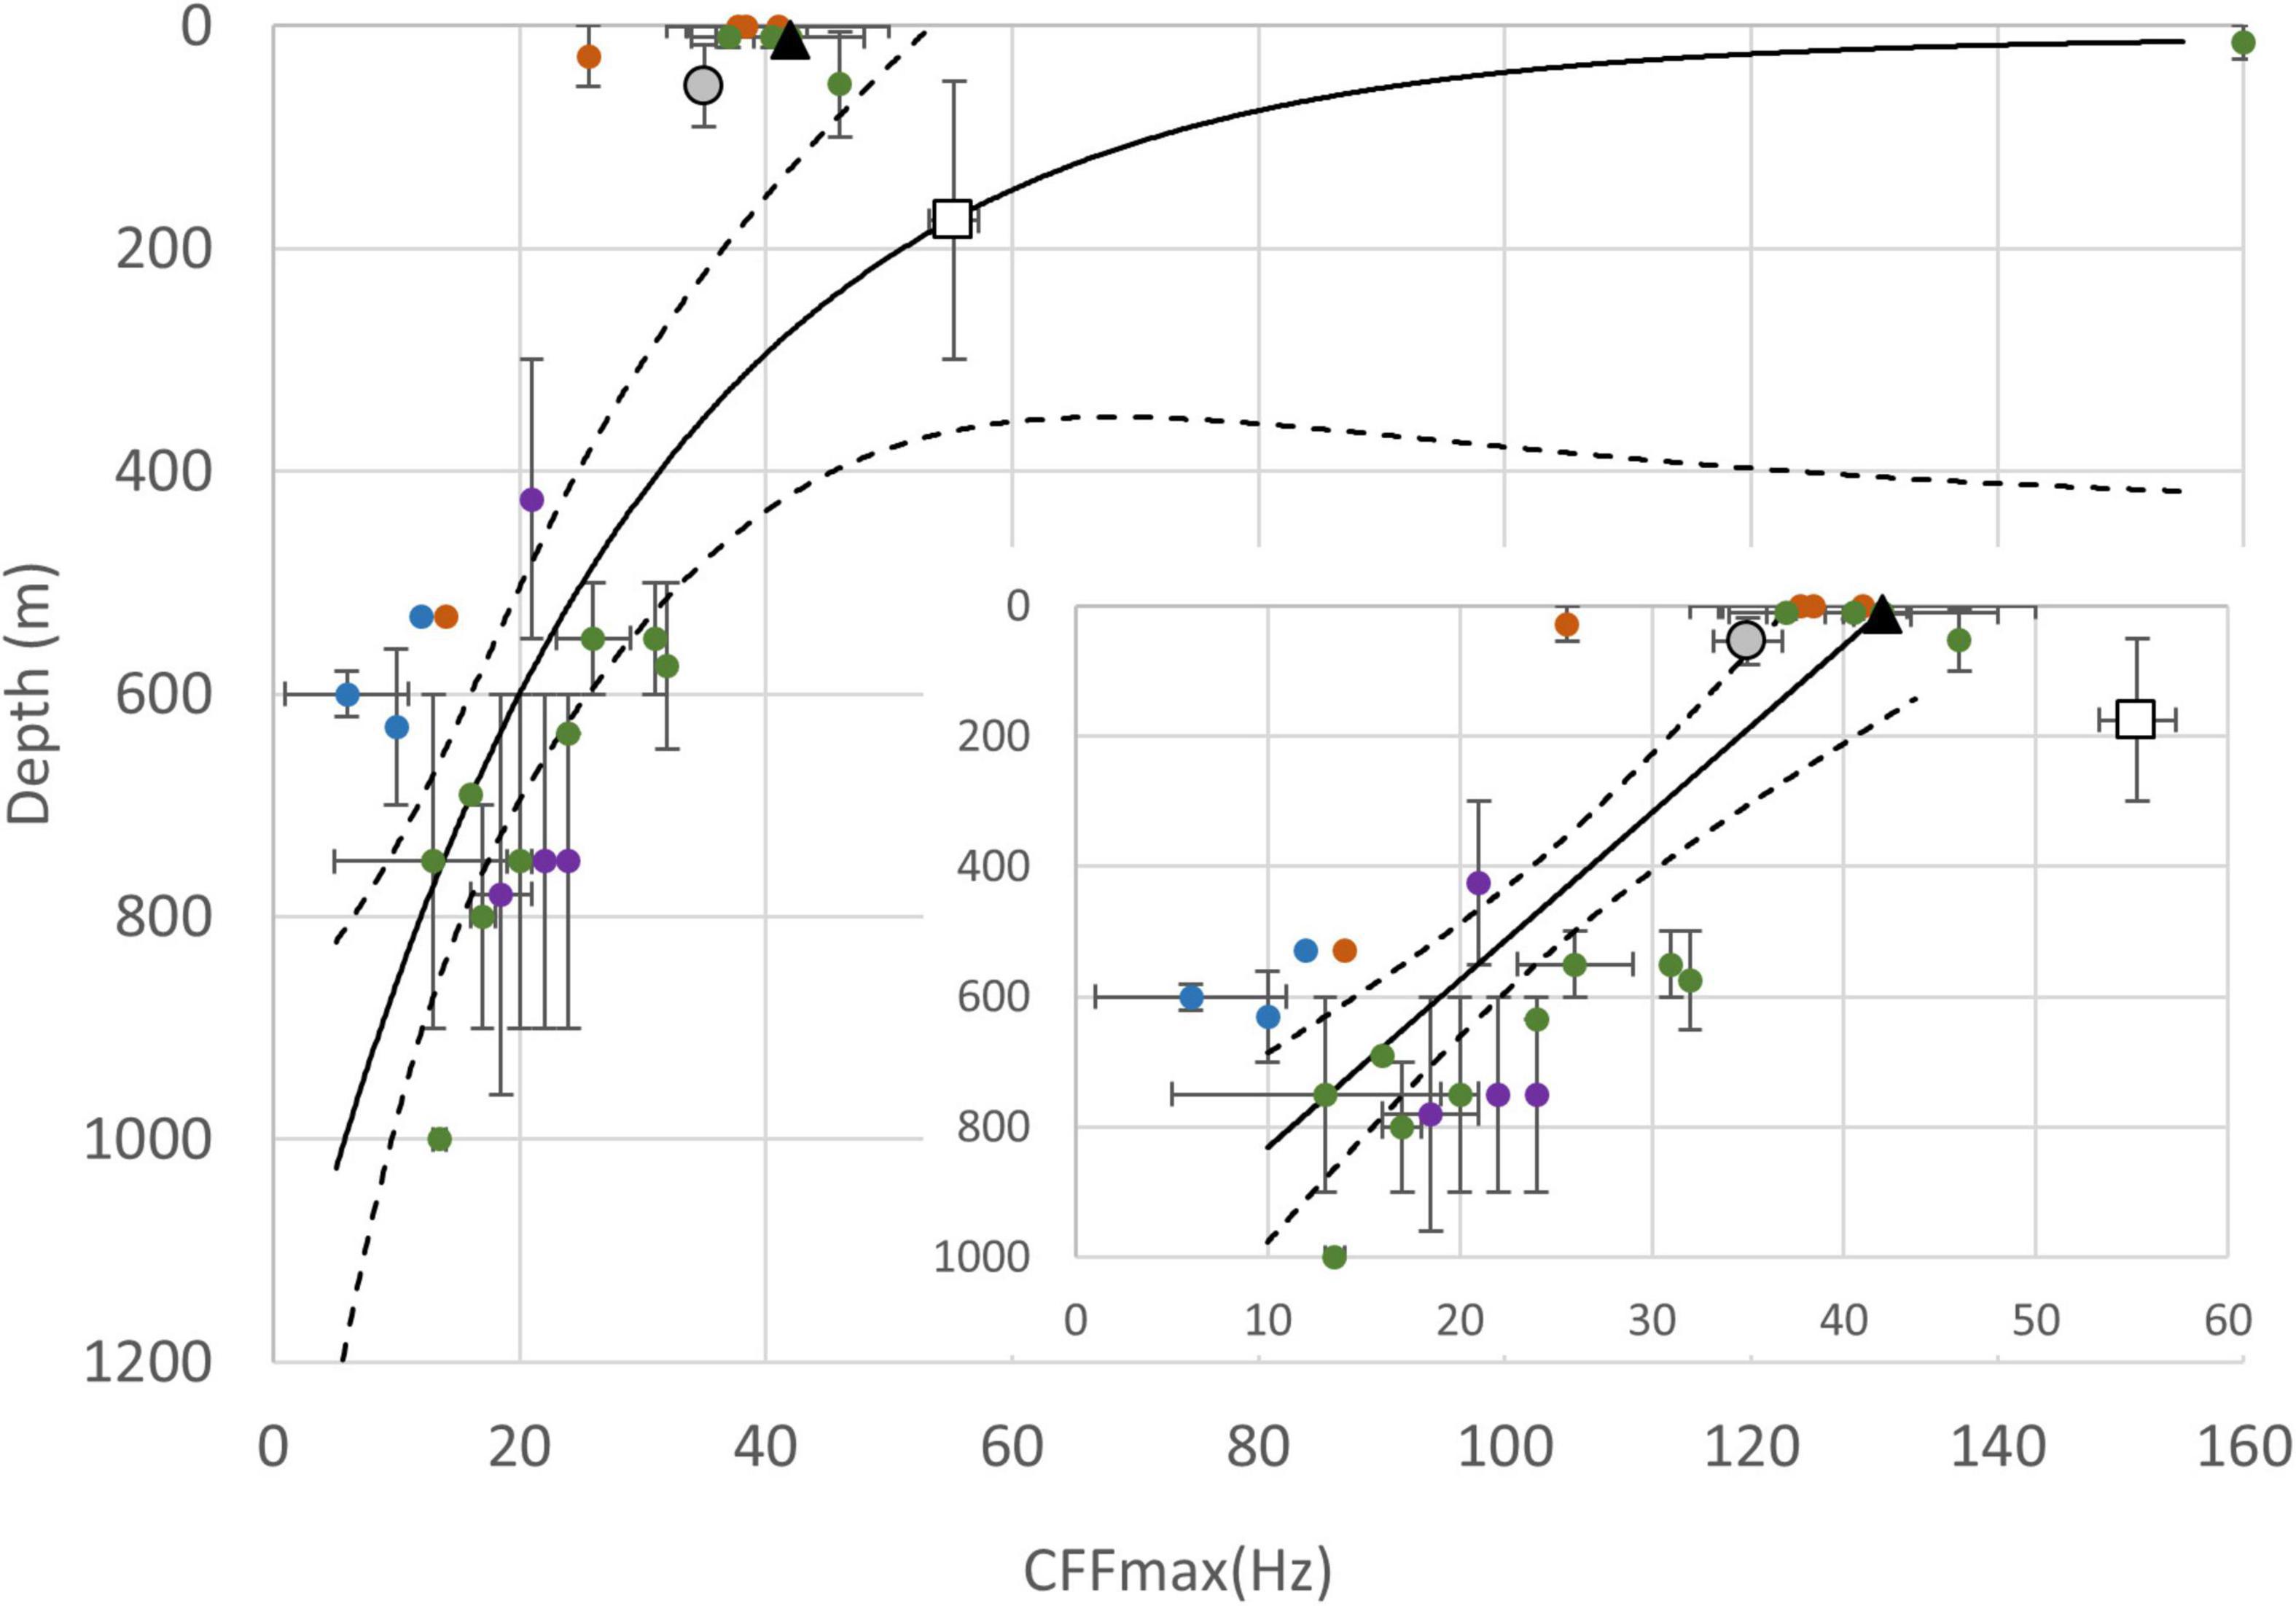
Figure 11. The maximum critical flicker fusion frequencies (CFFmax) and the inhabited depths of slipper lobsters and other decapods. The mean CFFmax are shown along the horizontal axis and the error bar indicates the maximum and minimum range for CFFmax reported for each species (see Supplementary Data 4 for details). The means of inhabited depth are shown along the vertical axis, and the error bar indicates the range of depths reported in the literature or cited in an online database (https://www.sealifebase.ca/). A one-phase decay exponential regression curve (solid line) or linear regression (small inset figure) was fitted to the plots of the main figure or mini-figure by the least squares method (R2 = 0.47 or 0.51, respectively). The 90% confidence level is shown (dashed lines).
Slipper lobsters in the euphotic zone, especially P. japonicus, may be more sensitive to longer wavelengths than shorter ones. Previous studies have shown that decapods living in coastal waters display spectral sensitivity peaks at relatively longer wavelengths. For example, Portunus xantusii (Portunidae) (Grober, 1990), Hemigrapsus edwardsii (Brachyura), Leptograpsus variegtus (Brachyura) (reviewed in Marshall et al., 2003), and some cleaner shrimps (Lysmata amboinensis, Ancylomenes pedersoni and Urocaridella antonbruunii) (Caves et al., 2016) are most sensitive to light at 510–533 nm (Figure 10). ERG experiments have also shown that decapods living in shallow freshwater or turbid water systems, such as freshwater Macrobrachium rosenbergii (Palaemonidae) (Matsuda and Wilder, 2014) and Palaemonetes paludosus (Palaemonidae) (Goldsmith and Fernandez, 1968), may have sensitivity peaks at even longer wavelengths, such as 563 or 539 nm. Likewise, euryhaline Litopenaeus vannamei (Penaeidae) that usually inhabits mangroves and estuarine systems exhibits a visual sensitivity peak at 544 nm (Matsuda and Wilder, 2010), probably due to the high turbidity of such habitats.
The visual systems of aquatic animals often reflect their light environments (Guthrie and Muntz, 1993). In particular, sensitivity to luminal intensity and the temporal properties of crustacean visual systems have been shown to vary according to ecological and phylogenetic constraints (reviewed in Luque et al., 2019). Therefore, a trade-off between visual sensitivity and temporal resolution has been hypothesized, since increased photoreceptor integration time may enhance photon capture and contribute to greater sensitivity to dim light. However, an increased temporal summation time is expected to reduce temporal resolution (reviewed in Marshall et al., 2003). For species living in dim light, the benefit of improved photon capture may far outweigh the loss in temporal resolution. For instance, many nocturnal and deep-sea crustaceans have highly sensitive superposition eyes, but also display high spatial and long temporal summation times that reduce resolution (reviewed in Warrant, 2004). Regrettably, due to technical difficulties, we could not conduct in situ habitat spectral assessments, which may provide more profound insights into the relevance of spectral sensitivity to optical environments.
Visual response dynamics are expected to match the particular habitat and lifestyle of a given marine species (Autrum, 1958). By plotting CFFmax values against habitat depth for several species, we observed a roughly exponential regression curve that indicated that the CFFmax is generally reduced with greater vertical depth for decapods from the families Chirostylidae, Eumunididae, Munidopsidae, Ocypodidae, Polychiidae, Portunidae, Sesarmidae, Alpheidae, Eugonatonotidae, Lysmatidae, Oplophoridae, Palaemonidae, Pandalidae, Pasiphaeidae, Penaeoidea, and Sergestidae (see Supplementary Data 4 for details and Figure 11; Grober, 1990; Layne et al., 1997; Collin et al., 2000; Frank, 2003; Frank et al., 2012; Matsuda and Wilder, 2014; Caves et al., 2016; Kingston et al., 2019, 2020; Qian, 2020). This result may be expected because at greater depths, the environment is darker at greater depths than in shallow waters. Furthermore, our data show that the temporal resolution of euphotic S. squammosus and P. japonicas is similar to shallow-water or terrestrial decapods (from 25.6 Hz for Portunus xantusii to 39 Hz for Lysmata amboinensis) (Grober, 1990; Matsuda and Wilder, 2014; Caves et al., 2016; Jessop et al., 2020; Qian, 2020). Notably, the highest measured CFFmax (> 160 Hz) among crustaceans was reported for the snapper shrimp (Alpheus heterochaelis) (Kingston et al., 2020). Both the shallow-water and intermediate-depth slipper lobsters we sampled were within the linear regression range of CFFmax values (Figure 11). However, deep-water I. novemdentatus displayed a relatively higher CFFmax than most other decapods found in the mesophotic zone or those occurring at depths > 400 m (Figure 11). Thus, our results indicate that the absolute sensitivity of deep-water I. novemdentatus is higher than that of the intermediate-depth species, S. squammosus, but not at the evolutionary expense of temporal responsiveness. It remains unclear if I. novemdentatus undertakes diurnal vertical migration, as reported for some other mesopelagic crustaceans (review in Brierley, 2014). Nevertheless, the high temporal resolution of I. novemdentatus suggests that it could possess visual acuity similar to that of euphotic species.
In summary, our morphological and electrophysiological results indicate that nocturnal S. squammosus, P. japonicas, and I. novemdentatus are well adapted to dim-light environments. For each species, our data suggest the presence of a single-class photoreceptor supporting monochromatic vision, but all species detected spectra ranging from 386 to 632 nm. Among the three species we assessed, absolute visual sensitivities and the wavelengths of highest sensitivity differed, with these differences potentially reflecting the different habitat depths and light environments they inhabit. Overall, the deep-water slipper lobster, I. novemdentatus, seems to have the best temporal resolution when compared to other slipper lobsters or decapods inhabiting the same depth range. Moreover, its spectral sensitivity conforms to the visual features displayed by other species of the aphotic zone, potentially enabling it to forage by detecting bioluminescence. This study of the visual abilities of nocturnal slipper lobsters not only contributes to our understanding of the basic biology of these three species, but it may also have important applications in designing fishing gear and practices to improve efficiencies and prevent bycatch, both of which can promote environmental sustainability.
Data Availability Statement
The original contributions presented in the study are included in the article/Supplementary Material, further inquiries can be directed to the corresponding author/s.
Author Contributions
YS, H-YC, OH, and Y-CT conceived and designed the experiments. YS, H-YC, L-CL, and OH performed the experiments. L-CL and OH analyzed the data. YS and Y-CT contributed to reagents, materials, and analysis tools. YS, OH, and Y-CT wrote the manuscript. All authors contributed to the article and approved the submitted version.
Funding
This study was supported by grants from the Ministry of Science and Technology, Taiwan (108-2621-M-019-002-MY3 and 109-2621-M-019-001) to YS. We very much appreciate the support from the Center of Excellence for the Oceans and Intelligent Maritime Research Center, National Taiwan Ocean University, from its Featured Areas Research Center Program within the framework of the Higher Education Sprout Project by the Ministry of Education (MOE) in Taiwan.
Conflict of Interest
The authors declare that the research was conducted in the absence of any commercial or financial relationships that could be construed as a potential conflict of interest.
Publisher’s Note
All claims expressed in this article are solely those of the authors and do not necessarily represent those of their affiliated organizations, or those of the publisher, the editors and the reviewers. Any product that may be evaluated in this article, or claim that may be made by its manufacturer, is not guaranteed or endorsed by the publisher.
Acknowledgments
We would like to thank Chih-Wei Chen for help with R software and Wen-Chun Fu and various undergraduates who worked hard during their summer vacations and who were supported by the National Museum of Marine Science and Technology. The manuscript was edited for language usage by Marcus J. Calkins and John O’Brien. We are also thankful for the comments from two reviewers, which helped to improve our article. We also like to thank Chi-Chang Lee at the Marine Research Station (ICOB, Academia Sinica) for animals’ rearing during the experiments.
Supplementary Material
The Supplementary Material for this article can be found online at: https://www.frontiersin.org/articles/10.3389/fmars.2022.807347/full#supplementary-material
Supplementary Data 1 | The intensity of each stimulus was adjusted by modulating the duty cycle of pulse width from 100 to 25%.
Supplementary Data 2 | Changes in ERG magnitude in response to 100 ms of c. 1200 lx white LED stimulus at different elapsed times after changing from light (c. 60 lx, 10 min) to dark conditions. Response magnitude is represented relative to the maximum response for each species. The arrows on the X-axis indicate the elapsed time for saturated adaption time.
Supplementary Data 3 | Peak irradiance of different LEDs. A series of neutral density (ND) filters and four duty cycle settings (25–100%) were used to reduce the light intensity.
Supplementary Data 4 | References cited for Figures 10, 11.
Supplementary Data 5 | Raw data of spectral sensitivity.
Supplementary Data 6 | Raw data of CFFmax.
References
Autrum, H. (1958). Electrophysiological analysis of the visual systems in insects. Exp. Cell Res. Suppl. 5, 426–439. doi: 10.1016/0003-3472(58)90028-9
Brierley, A. S. (2014). Diel vertical migration. Curr. Biol. 24, R1074–R1076. doi: 10.1016/j.cub.2014.08.054
Caves, E. M., Frank, T. M., and Johnsen, S. (2016). Spectral sensitivity, spatial resolution and temporal resolution and their implications for conspecific signalling in cleaner shrimp. J. Exp. Biol. 219, 597–608. doi: 10.1242/jeb.122275
Collin, S. P., Marshall, N. J., and Frank, T. M. (2000). Temporal resolution in mesopelagic crustaceans. Philos. Trans. R. Soc. Lond. B Biol. Sci. 355, 1195–1198.
Cronin, T. W., and Forward, R. B. (1988). The visual pigments of crabs. J. Comparat. Physiol. A 162, 463–478. doi: 10.1007/BF00612512
Cronin, T. W., and Porter, M. L. (2008). Exceptional variation on a common theme: the evolution of crustacean compound eyes. Evolut. Educ. Outreach 1, 463–475. doi: 10.1007/s12052-008-0085-0
Diggles, B. K. (2019). Review of some scientific issues related to crustacean welfare. ICES J. Mar. Sci. 76, 66–81. doi: 10.1093/icesjms/fsy058
Frank, T. M. (1999). Comparative study of temporal resolution in the visual systems of mesopelagic crustaceans. Biol. Bull. 196, 137–144. doi: 10.2307/1542559
Frank, T. M. (2000). Temporal resolution in mesopelagic crustaceans. Philos. Trans. R. Soc. Lond. B Biol. Sci. 355, 1195–1198. doi: 10.1098/rstb.2000.0666
Frank, T. M. (2003). Effects of Light Adaptation on the Temporal Resolution of Deep-sea Crustaceans1. Integrat. Comparat. Biol. 43, 559–570. doi: 10.1093/icb/43.4.559
Frank, T. M., and Case, J. F. (1988). Visual spectral sensitivities of bioluminescent deep-sea crustaceans. Biol. Bull. 175, 261–273. doi: 10.2307/1541567
Frank, T. M., Johnsen, S., and Cronin, T. W. (2012). Light and vision in the deep-sea benthos: II. Vision in deep-sea crustaceans. J. Exp. Biol. 215, 3344–3353. doi: 10.1242/jeb.072033
Gallegos, C. L., Correll, D. L., and Pierce, J. W. (1990). Modeling spectral diffuse attenuation, absorption, and scattering coefficients in a turbid estuary. Limnol. Oceanogr. 35, 1486–1502. doi: 10.4319/lo.1990.35.7.1486
Gerrish, G. A., Morin, J. G., Rivers, T. J., and Patrawala, Z. (2009). Darkness as an ecological resource: the role of light in partitioning the nocturnal niche. Oecologia 160, 525–536. doi: 10.1007/s00442-009-1327-8
Goldsmith, T. H., and Fernandez, H. R. (1968). Comparative studies of crustacean spectral sensitivity. Zeitschrift für Vergleichende Physiol. 60, 156–175. doi: 10.1007/BF00878449
Goldstein, J. S., Dubofsky, E. A., and Spanier, E. (2015). Into a rhythm: Diel activity patterns and behaviour in Mediterranean slipper lobsters, Scyllarides latus. ICES J. Mar. Sci. 72, i147–i154. doi: 10.1093/icesjms/fsv008
Grober, M. S. (1990). Luminescent Flash Avoidance in the Nocturnal Crab Portunus Xantusii: II. Cardiac and Visual Responses to Variations in Simulated Luminescent Flashes. J. Exp. Biol. 148, 427–448. doi: 10.1242/jeb.148.1.427
Groeneveld, J. C., Zacarias, L. D., and Singh, S. P. (2019). Smooth fan lobster Ibacus novemdentatus in the southwestern Indian Ocean: an overlooked fisheries resource? Afr. J. Mar. Sci. 41, 305–312. doi: 10.2989/1814232X.2019.1654545
Guthrie, D. M., and Muntz, W. R. A. (1993). “Role of vision in fish behaviour,” in ‘Behaviour of Teleost Fishes’, ed. T. J. Pitcher (Berlin: Springer Nature), 89–128. doi: 10.1007/978-94-011-1578-0_4
Haddock, S. H., Moline, M. A., and Case, J. F. (2010). Bioluminescence in the sea. Annu. Rev. Mar. Sci. 2, 443–493. doi: 10.1146/annurev-marine-120308-081028
Jessop, A. L., Ogawa, Y., Bagheri, Z. M., Partridge, J. C., and Hemmi, J. M. (2020). Photoreceptors and diurnal variation in spectral sensitivity in the fiddler crab Gelasimus dampieri. J. Exp. Biol. 223:jeb230979. doi: 10.1242/jeb.230979
Johnsen, S., Frank, T. M., Haddock, S. H., Widder, E. A., and Messing, C. G. (2012). Light and vision in the deep-sea benthos: I. Bioluminescence at 500–1000 m depth in the Bahamian Islands. J. Exp. Biol. 215, 3335–3343. doi: 10.1242/jeb.072009
Kanmizutaru, T., Anraku, K., and Toyoda, S. (2005). Light perception capability of pallial eyes in Japanese moon scallop Amusium japonicum as determined by electroretinogram. Nippon Suisan Gakkaishi 71, 928–934. doi: 10.2331/suisan.71.928
Kingston, A. C. N., Lucia, R. L., Havens, L. T., Cronin, T. W., and Speiser, D. I. (2019). Vision in the snapping shrimp Alpheus heterochaelis. J. Exp. Biol. 222:209015. doi: 10.1242/jeb.209015
Kingston, A. C., Chappell, D. R., and Speiser, D. I. (2020). A snapping shrimp has the fastest vision of any aquatic animal. Biol. Lett. 16:20200298. doi: 10.1098/rsbl.2020.0298
Land, M. F. (1976). Superposition images are formed by reflection in the eyes of some oceanic decapod crustacea. Nature 263, 764–765. doi: 10.1038/263764a0
Lau, S. T., Spanier, E., and Meyer-Rochow, V. B. (2009). Anatomy and ultrastructural organisation of the eye of the Mediterranean slipper lobster, Scyllarides latus: preliminary results. N Z. J. Mar. Freshw. Res. 43, 233–245. doi: 10.1080/00288330909509997
Lavalli, K. L., and Spanier, E. (2007). “Introduction to the biology and fisheries of slipper lobsters,” in The Biology and Fisheries of the Slipper Lobster, eds K. L. Lavalliand and E. Spanier (Boca Raton, FL: CRC Press), 3–24.
Lavalli, K. L., Spanier, E., and Grasso, F. (2007). “Behavior and sensory biology of slipper lobsters,” in The Biology and Fisheries of the Slipper lobster, eds K. L. Lavalli and E. Spanier (Boca Raton, FL: CRC Press), 147–196.
Layne, J. E., Wicklein, M., Dodge, F. A., and Barlow, R. B. (1997). Prediction of maximum allowable retinal slip speed in the fiddler crab, Uca pugilator. Biol. Bull. 193, 202–203. doi: 10.1086/BBLv193n2p202Luque
Luque, J., Allison, W. T., Bracken-Grissom, H. D., Jenkins, K. M., Palmer, A. R., Porter, M. L., et al. (2019). Evolution of crab eye structures and the utility of ommatidia morphology in resolving phylogeny. BioRxiv 2019:786087. doi: 10.1101/786087
Maia, R., Eliason, C. M., Bitton, P. P., Doucet, S. M., and Shawkey, M. D. (2013). pavo: an R package for the analysis, visualization and organization of spectral data. Methods Ecol. Evolut. 4, 906–913. doi: 10.1111/2041-210X.12069
Maia, R., Gruson, H., Endler, J. A., and White, T. E. (2019). pavo 2: new tools for the spectral and spatial analysis of colour in R. Methods Ecol. Evolut. 10, 1097–1107. doi: 10.1111/2041-210X.13174
Marshall, N. J., and Oberwinkler, J. (1999). The colorful world of the mantis shrimp. Nature 401, 873–874. doi: 10.1038/44751
Marshall, N. J., Cronin, T. W., and Frank, T. M. (2003). Visual adaptations in crustaceans: chromatic, developmental, and temporal aspects. Sens. Process. Aquat. Environ. 2003, 343–372. doi: 10.1007/978-0-387-22628-6_18
Marshall, N. J., Kent, J., and Cronin, T. (1999). “Visual adaptations in crustaceans: spectral sensitivity in diverse habitats,” in Adaptive mechanisms in the ecology of vision, eds S. Archer, M. B. Djamgoz, E. Loew, J. C. Partridge, and S. Vallerga (Dordrecht: Springer), 285–327. doi: 10.1016/0042-6989(94)90221-6
Martin, F. G., and Mote, M. I. (1982). Color receptors in marine crustaceans: A second spectral class of retinular cell in the compound eyes of Callinectes and Carcinus. J. Comparat. Physiol. 145, 549–554. doi: 10.1007/BF00612820
Martini, S., and Haddock, S. H. (2017). Quantification of bioluminescence from the surface to the deep sea demonstrates its predominance as an ecological trait. Sci. Rep. 7:45750. doi: 10.1038/srep45750
Mascarenhas, V., and Keck, T. (2018). Marine Optics and Ocean Color Remote Sensing. YOUMARES 8–Oceans Across Boundaries: Learning from each other, 41. Cham: Springer-Verlag.
Matsuda, K., and Wilder, M. N. (2010). Difference in light perception capability and spectral response between juveniles and sub-adults of the whiteleg shrimp Litopenaeus vannamei as determined by electroretinogram. Fisher. Sci. 76, 633–641. doi: 10.1007/s12562-010-0253-3
Matsuda, K., and Wilder, M. N. (2014). Eye structure and function in the giant freshwater prawn Macrobrachium rosenbergii. Fisher. Sci. 80, 531–541. doi: 10.1007/s12562-014-0734-x
Matsumoto, T., Ihara, H., Ishida, Y., Yamamoto, S., Murata, O., and Ishibashi, Y. (2010). Spectral sensitivity of juvenile chub mackerel (Scomber japonicus) in visible and ultraviolet light. Fish Physiol. Biochem. 36, 63–70. doi: 10.1007/s10695-008-9289-z
Meyer-Rochow, V. B. (2001). The crustacean eye: dark/light adaptation, polarization sensitivity, flicker fusion frequency, and photoreceptor damage. Zool. Sci. 18, 1175–1197. doi: 10.2108/zsj.18.1175
Meyer-Rochow, V. B., and Gál, J. (2004). Dimensional Limits for arthropod eyes with superposition optics. Vis. Res. 44, 2213–2223. doi: 10.1016/j.visres.2004.04.009
Mohamed, G. A. N. I. (2019). Shallow Water Empirical Remote Sensing Bathymetry Using the Blue/Green and Red Spectrum Regions. J. Sci. Res. Rep. 22, 1–8. doi: 10.9734/jsrr/2019/v22i330091
Nakagawa, T., and Eguchi, E. (1994). Differences in Flicker Fusion Frequencies of the Five Spectral Photoreceptor Types in the Swallowtail Butterfly’s Compound Eye. Zool. Sci. 11, 759–762.
Nørgaard, T., Nilsson, D. E., Henschel, J. R., Garm, A., and Wehner, R. (2008). Vision in the nocturnal wandering spider Leucorchestris arenicola (Araneae: Sparassidae). J. Exp. Biol. 211, 816–823. doi: 10.1242/jeb.010546
Olsvik, P. A., Kristensen, T., Waagbø, R., Rosseland, B. O., Tollefsen, K. E., Baeverfjord, G., et al. (2005). mRNA expression of antioxidant enzymes (SOD, CAT and GSH-Px) and lipid peroxidative stress in liver of Atlantic salmon (Salmo salar) exposed to hyperoxic water during smoltification. Comparat. Biochem. Physiol. Part C Toxicol. Pharmacol. 141, 314–323. doi: 10.1016/j.cbpc.2005.07.009
O’Malley, J. M. (2011). Spatiotemporal variation in the population ecology of scaly slipper lobsters Scyllarides squammosus in the Northwestern Hawaiian Islands. Mar. Biol. 158, 1887–1901. doi: 10.1007/s00227-011-1701-z
Pope, R. M., and Fry, E. S. (1997). Absorption spectrum (380–700 nm) of pure water. II. Integrating cavity measurements. Appl. Optics 36, 8710–8723. doi: 10.1364/ao.36.008710
Qian, R. (2020). Comparative Study of Spectral Sensitivity, Irradiance Sensitivity, Spatial Resolution and Temporal Resolution in the Visual Systems of Aratus pisonii and Ocypode quadrata. Ph. D. thesis. Fort Lauderdale, FL: Nova southeastern university.
Renema, W. (2018). Terrestrial influence as a key driver of spatial variability in large benthic foraminiferal assemblage composition in the Central Indo-Pacific. Earth Sci. Rev. 177, 514–544. doi: 10.1016/j.earscirev.2017.12.013
Rudloe, A. (1983). Preliminary studies of the mariculture potential of the slipper lobster, Scyllarides nodifer. Aquaculture 34, 165–169. doi: 10.1016/0044-8486(83)90300-9
Russell, W. M. S., and Burch, R. L. (1959). The principles of humane experimental technique. MJA 1:500. doi: 10.5694/j.1326-5377.1960.tb73127.x
Ryan, L. A., Hemmi, J. M., Collin, S. P., and Hart, N. S. (2017). Electrophysiological measures of temporal resolution, contrast sensitivity and spatial resolving power in sharks. J. Comparat. Physiol. A 203, 197–210. doi: 10.1007/s00359-017-1154-z
Spanier, E., and Lavalli, K. L. (2007). “Slipper lobster fisheries—present status and future perspectives,” in The biology and fisheries of the slipper lobster, eds K. L. Lavalli and E. Spanier (Florida, FL: CRC Press), 391–406.
Spanier, E., Lavalli, K. L., and Weihs, D. (2011). “Comparative morphology in slipper lobsters: possible adaptations to habitat and swimming, with emphasis on lobsters from the Mediterranean and adjacent seas,” in ATTI IX colloquium crustacea Mediterranea, eds D. Pessani, T. Tirelli, and C. Froglia (Torino: Museo Regionale di Scienze Naturali), 111–130. doi: 10.1201/9781420005165.ch6
Stavenga, D. G., Smits, R. P., and Hoenders, B. J. (1993). Simple exponential functions describing the absorbance bands of visual pigment spectra. Vis. Res. 33, 1011–1017. doi: 10.1016/0042-6989(93)90237-q
Thoen, H. H., Martin, J. How, Tsyr-Huei, Chiou, and Justin, Marshall (2014). A Different from of Color Vision in Mantis Shrimp. Science 343, 411–413. doi: 10.1126/science.1245824
Wahyudin, R. A., Hakim, A. A., Qonita, Y., Boer, M., Farajallah, A., Mashar, A., et al. (2017). Lobster diversity of Palabuhanratu Bay, South Java, Indonesia with new distribution record of Panulirus ornatus, P. polyphagus and Parribacus antarcticus. Aquacult. Aquar. Conserv. Legislat. 10, 308–327.
Wakabayashi, K., Tanaka, Y., and Phillips, B. F. (2019). “Culture of Slipper Lobster Larvae (Decapoda: Achelata: Scyllaridae) Fed Jellyfish as Food,” in Lobsters: biology, fisheries and aquaculture, eds E. V. Radhakrishnan, B. F. Phillips, and G. Achamveetil (Singapore: Springer), 519–540. doi: 10.1007/978-981-32-9094-5_11
Warrant, E. (2004). Vision in the dimmest habitats on earth. J. Comparat. Physiol. A 190, 765–789. doi: 10.1007/s00359-004-0546-z
Webber, W. R., and Booth, J. D. (2007). Taxonomy and evolution. In The biology and fisheries of the slipper lobster. Florida, FL: CRC Press, 39–66.
Welsh, J. H., and Chace, F. A. Jr. (1938). EYES OF DEEP-SEA CRUSTACEANS: II. SERGESTIDAE. Biol. Bull. 74, 364–375. doi: 10.2307/1537810
Widder, E. A. (2010). Bioluminescence in the Ocean: Origins of Biological, Chemical, and Ecological Diversity. Science 328, 704–708. doi: 10.1126/science.1174269
Keywords: spectrum sensitivity, temporal resolution, slipper lobster, nocturnal animal behaviors, habitat depth, mesopelagic animal
Citation: Hayasaka O, Chang H-Y, Li L-C, Tseng Y-C and Shao YT (2022) Nocturnal Eyes in Slipper Lobsters (Decapoda Scyllaridae): Physiological and Ecological Implications of Habitat Depths for Visual Traits. Front. Mar. Sci. 9:807347. doi: 10.3389/fmars.2022.807347
Received: 02 November 2021; Accepted: 03 February 2022;
Published: 24 February 2022.
Edited by:
Menghong Hu, Shanghai Ocean University, ChinaReviewed by:
Jason Goldstein, Wells National Estuarine Research Reserve, United StatesRussell Wyeth, St. Francis Xavier University, Canada
Copyright © 2022 Hayasaka, Chang, Li, Tseng and Shao. This is an open-access article distributed under the terms of the Creative Commons Attribution License (CC BY). The use, distribution or reproduction in other forums is permitted, provided the original author(s) and the copyright owner(s) are credited and that the original publication in this journal is cited, in accordance with accepted academic practice. No use, distribution or reproduction is permitted which does not comply with these terms.
*Correspondence: Yi Ta Shao, itshao@mail.ntou.edu.tw