Assessing bias in aerial surveys for cetaceans: Results from experiments conducted with the franciscana dolphin
 Federico Sucunza1,2,3*
  Daniel Danilewicz2,3
  Artur Andriolo1,3 Franciele R. de Castro3
  Marta Cremer4 Pablo Denuncio5
  Emanuel Ferreira6 Paulo A. C. Flores7 Paulo H. Ott2,8 Martin S. Perez2 Dan Pretto7 Camila M. Sartori4
  Eduardo R. Secchi9
  Alexandre N. Zerbini1,3,10,11,12
- 1Laboratório de Ecologia Comportamental e Bioacústica, Programa de Pós-graduação em Biodiversidade e Conservação da Natureza, Universidade Federal de Juiz de Fora, Juiz de Fora, MG, Brazil
- 2Grupo de Estudos de Mamíferos Aquáticos do Rio Grande do Sul, Torres, RS, Brazil
- 3Instituto Aqualie, Juiz de Fora, MG, Brazil
- 4Laboratório de Ecologia e Conservação de Tetrápodes Marinhos e Costeiros, Unidade São Francisco do Sul, Universidade da Região de Joinville, São Francisco do Sul, SC, Brazil
- 5Departamento de Ciencias Marinas, Instituto de Investigaciones Marinas y Costeras, Facultad de Ciencias Exactas y Naturales, Universidad Nacional de Mar del Plata, Mar del Plata, Argentina
- 6Associação R3 Animal, Florianópolis, SC, Brazil
- 7Centro Nacional de Pesquisa e Conservação de Mamíferos Aquáticos, Instituto Chico Mendes para a Conservação da Biodiversidade, Florianópolis, SC, Brazil
- 8Universidade Estadual do Rio Grande do Sul, Osório, RS, Brazil
- 9Laboratório de Ecologia e Conservação da Megafauna Marinha, Instituto de Oceanografia, Universidade Federal do Rio Grande (FURG), Rio Grande, RS, Brazil
- 10Joint Institute for the Study of the Atmosphere and Ocean, University of Washington and Marine Mammal Laboratory, Alaska Fisheries Science Center, Seattle, WA, United States
- 11Marine Ecology and Telemetry Research, Seabeck, WA, United States
- 12Cascadia Research Collective, Olympia, WA, United States
Line transect aerial surveys are widely used for estimating abundance of biological populations, including threatened species. However, estimates obtained with data collected from aircraft are often underestimated because of visibility bias and bias in estimating group sizes from a fast-moving platform. An assessment of multiple sources of bias in aerial surveys were carried out in Brazilian coastal waters by experiments on multiple survey platforms (i.e., boat, airplane and helicopter). These studies focused on evaluating visibility bias (perception and availability bias) and potential differences in the estimation of group sizes from different types of platforms used in franciscana (Pontoporia blainvillei) abundance surveys. The ultimate goal was to develop correction factors to improve accuracy of estimates of density and population size for this threatened dolphin. Estimates of density and group sizes computed from boats were assumed to be unbiased and were compared to estimates of these quantities obtained from an airplane in the same area and period. In addition, helicopter surveys were conducted in two areas where water turbidity differed (clear vs. murky waters) to determine surfacing-diving intervals of franciscana groups and to estimate availability for aerial platforms. Abundance computed from the aerial survey data underestimated the true abundance by about 4-5 times, with ~70% of the total bias resulting from visibility bias (~80% from availability bias and ~20% from perception bias) and ~30% from bias in estimates of group size. The use of multiple survey platforms in contrasting habitats provided the opportunity to compute correction factors that can be used to refine range wide abundance estimates of the threatened franciscana given certain assumptions are met. Visibility bias and group size bias were substantial and clearly indicate the importance for accounting for such correction factors to produce unequivocal population assessment based on aerial survey data.
1 Introduction
Aircrafts are widely used to conduct surveys for wildlife populations, mainly because they provide the opportunity to search large and/or inaccessible areas in a relatively short period of time (Hiby and Hammond, 1989; Andriolo et al., 2010; McLellan et al., 2019). However, aerial surveys are commonly plagued by imperfect counts of individuals or groups that are within the sampling area (Caughley, 1974; Barlow et al., 1988; Heide-Jørgensen et al., 2007; Sucunza et al., 2020). Bias results from a variety of factors and, if not properly accounted for, can lead to equivocal population assessments and conservation actions.
Aerial surveys for cetaceans are often carried out using line transect methods (Buckland et al., 2001; Buckland et al., 2004). These methods assume that all individuals or group of individuals are seen on the survey trackline (g(0) = 1) and that group sizes are accurately estimated (Buckland et al., 2001). Because cetaceans spend periods of time underwater and are, therefore, unavailable to be seen, neither of these assumptions often hold during aircraft-based surveys (Laake et al., 1997; Pollock et al., 2006; Sucunza et al., 2018; Boyd et al., 2019). Marsh and Sinclair (1989) defined two categories for visibility bias (referred here as animals or group of animals missed on the survey line): i) availability bias occurs when animals are unavailable to be detected by an observer (e.g. on a plane) because they are submerged, and ii) perception bias occurs when animals are available but not detected (e.g. due to observer fatigue, environmental conditions). In addition, for species that live in groups, a variable proportion of the individuals within a group may be concurrently available to be counted which often makes the estimation of group size of marine mammals inaccurate and imprecise (Gilpatrick, 1993; Boyd et al., 2019; Gerrodette et al., 2019). The relatively high speed of the aircrafts reduces the time an observer has to search through a given area, resulting in a higher proportion of undetected animals as well as in underestimation of the total number of individuals in a group. In this sense, experiments to investigate the magnitude of bias in aerial surveys are essential to produce robust estimates of density and abundance and, consequently, improve conservation strategies.
The franciscana (Pontoporia blainvillei) is a small dolphin endemic to coastal waters off the eastern coast of South America. The species occurs in waters typically shallower than 30 m (Danilewicz et al., 2009) between Itaúnas, Brazil (18°25’S) and Golfo San Matías, Argentina (41°10’S) (Crespo et al., 1998; Siciliano et al., 2002). The species is regarded as one of the most threatened small cetaceans in the western South Atlantic Ocean due to high, possibly unsustainable, bycatch levels as well as increasing habitat degradation throughout its range (Ott et al., 2002; Secchi et al., 2003; Secchi et al., 2021) and is listed as Vulnerable by the IUCN Red List of Threatened Species (Zerbini et al., 2017).
Aerial surveys have been considered the most appropriate survey method to estimate abundance of franciscana dolphins (Secchi et al., 2001; Crespo et al., 2002). However, developing abundance estimates from aerial surveys for this species has been challenging because franciscana dolphins are small in size (maximum length ~170cm), are generally found in small groups (1-10 individuals), and live in areas where murky waters match the grayish-brown color of their bodies (Crespo et al., 2002; Cremer et al., 2022; Danilewicz et al., 2022). In addition, individuals are inconspicuous and typically surface for periods of only less than 2 s (Bordino et al., 1999; Cremer et al., 2022). For this reason, they are difficult to detect from fast-moving platforms (Crespo et al., 2002).
Surface-based observations have suggested that franciscana groups seen from airplanes are often two to four times smaller than those seen from stationary or slow moving platforms (Bordino et al., 1999; Cremer and Simões-Lopes, 2008; Crespo et al., 2010; Danilewicz et al., 2010), indicating that negative biases in estimates of the size of groups from a fast-moving aerial platform can be substantial. These challenges have been also reported for other species of small dolphins such as the harbor porpoise (Phocoena phocoena) and the Hector’s dolphin (Cephalorhynchus hectori) (see Slooten et al., 2004; Nachtsheim et al., 2021).
In this study, experiments to investigate potential sources of visibility bias and group size bias in aerial surveys of franciscana dolphins are described and correction factors to improve abundance estimates of the species are proposed. While the methods proposed here were applied to the franciscana, they can be extended to improve estimation of abundance of most marine megafauna species.
2 Materials and methods
Two experiments were conducted to estimate visibility bias and group size bias in abundance estimates from data recorded during aircraft-based surveys in southern and southeastern Brazil (Figure 1). Experiment 1 used simultaneous aerial and boat surveys to assess differences in density and group sizes of franciscanas between the two platforms (see Figure 1 lower) and experiment 2 used helicopters to evaluate surface and diving behavior of franciscanas and to assess the proportion of time they are available to observers in aerial platforms (see Figure 1 upper). Preliminary results of experiment 1 were provided by Zerbini et al. (2011). In the present study, that dataset was refined and re-analyzed, and the results presented here supersedes those from this preliminary report.
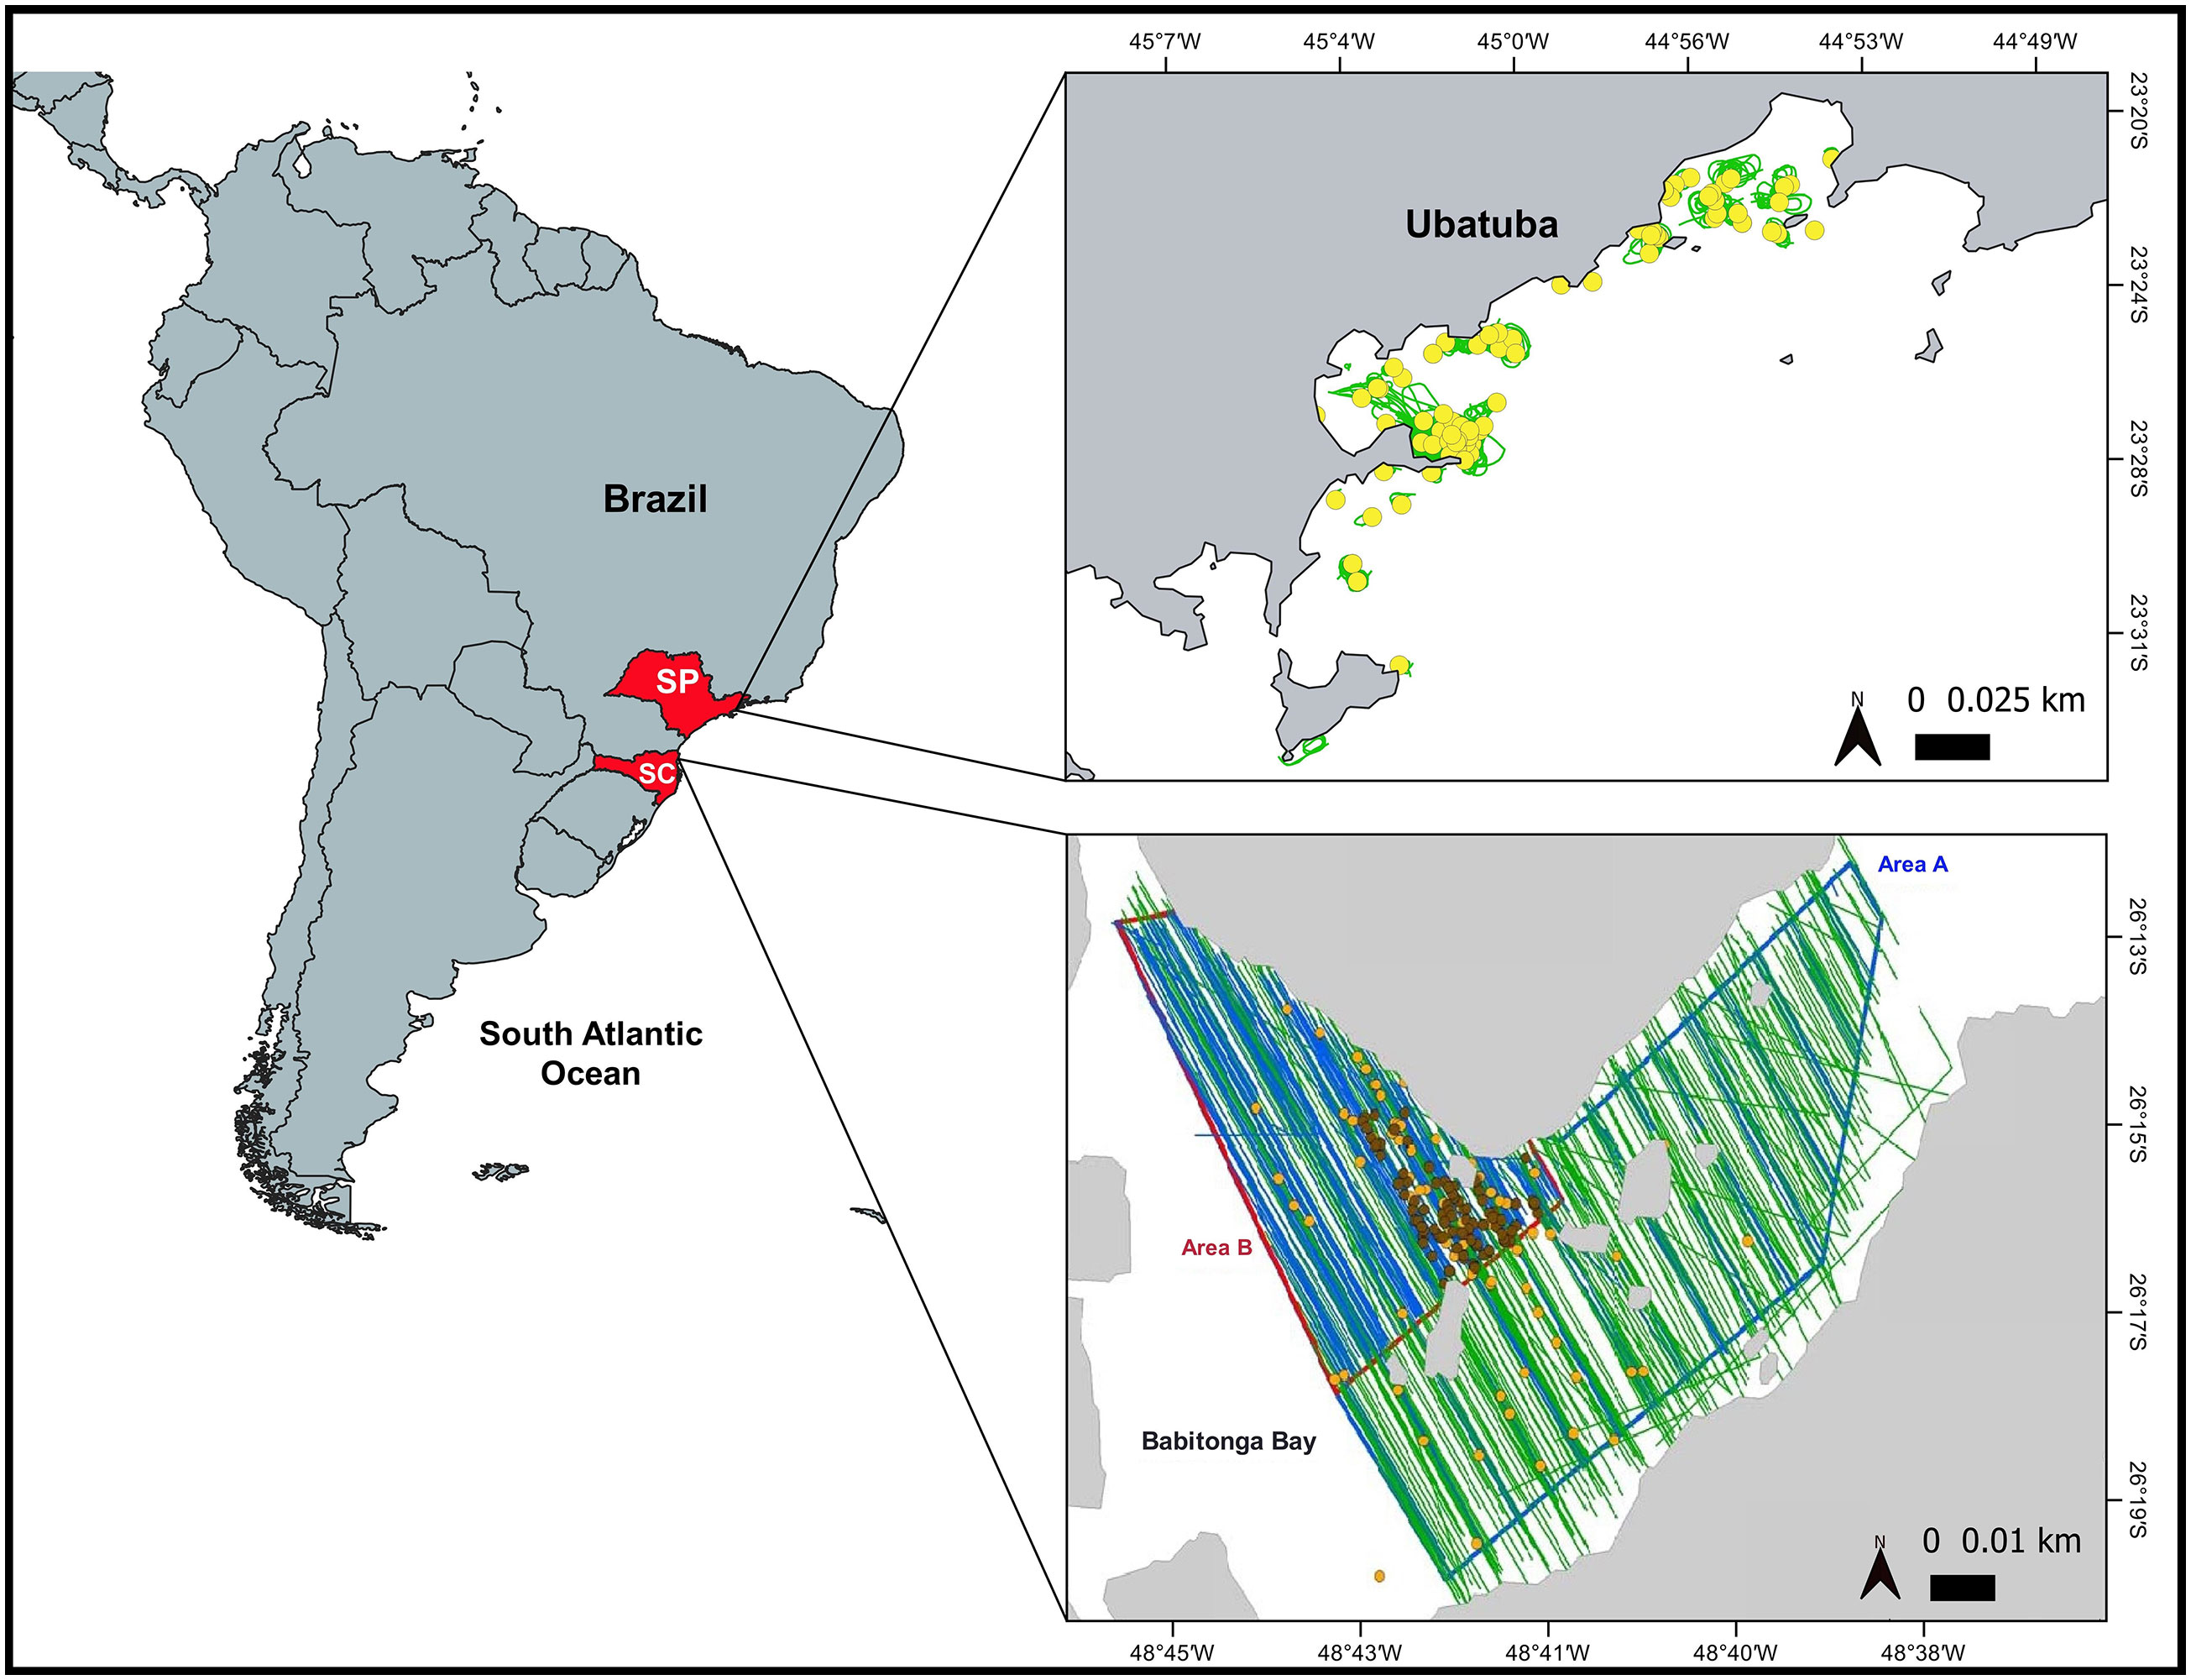
Figure 1 Lower map of Babitonga Bay, Santa Catarina State (SC), southern Brazil, showing survey areas A and B, realized trackline effort from aircraft (green lines) and from boats (blue lines), and franciscana sightings for both aircraft (yellow dots) and boats (brown dots); upper map of Ubatuba, São Paulo State (SP), southeastern Brazil, showing realized trackline effort (green lines) and franciscana sightings (yellow dots) from helicopter.
2.1 Experiment 1
2.1.1 Study area and survey design
Concomitant aerial and boat-based surveys were conducted in Babitonga Bay (26°16’S, 048°42’W), southern Brazil from 13 to 24 February 2011. Babitonga Bay is a shallow (average depth 6 m), small estuarine area with waters typically murky, located in northern Santa Catarina State (SC), southern Brazil (Cremer and Simões-Lopes, 2008) (Figure 1 lower). The bay is fed by several rivers and is connected to the South Atlantic Ocean through a 1.7 km wide channel (Cremer and Simões-Lopes, 2008). Babitonga Bay presents a number of advantages for the type of study intended here: (1) it is a region where franciscana dolphins predictably occur in relatively large densities throughout the year and show limited or no avoidance to small boats, (2) group sizes seen in the bay are assumed to be representative of those seen through most of the franciscana range and (3) the bay is relatively protected and therefore provides good weather conditions (e.g. relatively calm waters) for sighting surveys (Cremer and Simões-Lopes, 2008).
A planned area of 160km2 (Area A, Figure 1 lower) was defined based on locations where franciscanas are known to occur (e.g. Cremer and Simões-Lopes, 2008). Aerial and boat surveys followed design-based line transect methods (Buckland et al., 2001). A sampling grid of 16-17 equally spaced (at 600 m from each other) tracklines was proposed. To ensure sampling was random and independent for each platform, the starting point of the grid was randomly selected for each realization of the design for both survey platform types. The total trackline length (74 km) was specified in a way that the planned area could be fully surveyed by two boats in a period of four hours. This period was chosen to maximize sampling during calm weather, typically observed in this region between dawn and noon. In this four-hour period, the airplane could complete 3-4 realizations of the trackline design.
After the first two survey days, it became clear that franciscana dolphins were concentrated in a smaller region within the planned region. Based on this information and because of identified restrictions for the navigability of some planned tracklines, the sampling area for the boat surveys was reduced (Area B – 16.48 km2, Figure 1 lower) to maximize records of franciscana groups. The trackline design, however, maintained the same line spacing as the original design. The sampling strategy was not modified for the airplane because it could cover the entire survey area (Area A) much faster and because sample sizes collected on the first two days indicated that sufficient sightings (60-80 records, Buckland et al., 2001) would be recorded for estimation of detection probability for this platform. For the purpose of the analysis presented here, only data collected in Area B for both platforms are considered for density estimation.
2.1.2 Field methods
Sampling occurred under good weather conditions and calm seas (Beaufort sea state< 3). Water transparency was measured with a Secchi disc at the beginning, middle and end of every boat transect and cloud cover was registered once changes were observed. The aircraft and the boats did not divert from the transect line to investigate detected groups of franciscana dolphins, following a “passing mode” survey (Hammond et al., 2021).
2.1.2.1 Aerial surveys
Visual surveys were made from a high-wing, twin-engine Aerocommander 500B aircraft at an approximately constant altitude of 150 m (500 ft) and a speed of 170-200 km/h (~90-110 knots). The aircraft had four observation positions (two on each side of the plane), with bubble and flat windows available for front and rear observers, respectively. Different window configurations resulted in a partial overlap in the front and rear observer’s field of view (beyond 80 m from the trackline). Observers worked independently during on effort periods, with neither visual nor acoustic communication. The beginning and the end of each transects were informed to the observers by the pilot. Data were recorded by each observer on audio digital recorders and every record was time-referenced based on digital watches synchronized to a GPS. Environmental data (e.g. Beaufort sea state, water transparency, intensity of glare) was recorded at the beginning and end of each transect or whenever conditions changed. When a group of dolphins was detected, the species and the size of the group were recorded. The declination angle between the horizon and the sighting was obtained using an inclinometer when the group passed abeam of the observer. Additional information such as presence of calves, Beaufort sea state, and water transparency were also recorded along with each sighting.
2.1.2.2 Boat surveys
Visual surveys were conducted with two small (5 and 6 m) open boats equipped with 40 and 60 hp outboard engines and a crew of four people: two observers, a data recorder and a pilot. The observers were located at the bow of the boat and searched for dolphin groups with naked eyes. Observers on the left and right of the bow searched for a 0-50° to the port and starboard, respectively. Once a group was detected, information on the estimated radial distance to the group, the radial angle (measured with an angle board), the species and the group size were relayed to the recorder and registered in a standard data sheet. The recorder was not involved in searching or distance estimation, but assisted the observers in identifying species, tracking detected groups, and estimating group size and composition. Sightings recorded during transit between transects or from or to the harbor were considered “off-effort” sightings.
There is evidence that group size estimation during passing mode can be biased low because observers do not spend sufficient time to obtain an accurate count of the individuals in a group (Gerrodette et al., 2019). To assess whether this occurred in this study, the boats returned to areas of high density after the end of certain transect lines and randomly approached franciscana groups. A count of individuals in the group during these ‘off-effort’/‘closing’ approaches was then compared to group size estimation on the transect lines.
2.1.2.3 Distance calibration experiments
Because observers on the boats estimated the radial distance for the groups with naked eyes, experiments were conducted to assess measurement error in distance estimation and to correct for such error for each individual observer. The experiment was repeated three times during the study, the first before the surveys started, the second halfway through the survey period and the last one at the end of the study. During these experiments, five observers (two for each boat and a standby observer) stood in a fixed platform and independently estimated their distance from a moored object painted with colors resembling the franciscana color pattern. This object was placed at various known distances (measured with a GPS) from the platform. The experiment was conducted in a location with similar visibility conditions to those found in the survey area and the distances at which the moored object was placed from the observers were within the range franciscana groups were seen in boat surveys previously conducted in Babitonga Bay (Cremer and Simões-Lopes, 2008). For each of the three experiments, 12 distance estimates were obtained for each observer. True (measured) and estimated distances were used to correct for bias in radial distance estimation in a regression framework (Williams et al., 2007).
2.1.3 Analytical methods
2.1.3.1 Magnitude of bias in group size estimates from the airplane
A generalized linear model (GLM) with a Poisson error structure was used to assess differences in group sizes estimated from the boats and the airplane. This potential difference is interpreted here as the bias in groups size estimates from the airplane, assuming that estimates from the boats were unbiased. The GLM takes the following form:
Where: yi is the observed group size, is the expected group size, β0 is the intercept, β1… βk are the coefficients for the x1…xk predictor variables (distance - numerical covariate, and platform - factor covariate with two levels “boat” and “airplane”).
Four models were proposed and the Akaike weight wi was calculated for each model “i” as a representation of the probability of the model considered to be the most supported model given the data within the full set of models (Burnham and Anderson, 2002). Model selection was performed comparing model Second-order Akaike Information Criterion (AICc). Model assumptions were verified by plotting residuals versus fitted values and versus each covariates in the model (Zuur and Ieno, 2016). The variance of the bias in group size estimates from the airplane was approximated by the delta method (Seber, 1982).
Because the perspective from what constitute a group may differ for observers searching from boats or airplanes, in this study observers from both platforms were instructed to use the same group definition: an aggregation of dolphins in close proximity of each other (within ~10 body lengths), moving in the same direction and in apparent association (Shane, 1990).
2.1.3.2 Estimation of detection probability
Detection probability was estimated using Conventional (CDS) and Multiple Covariate Distance Sampling (MCDS) methods (Buckland et al., 2001; Marques and Buckland, 2003). MCDS differs from CDS as it allows for the inclusion of multiple covariates in the estimation of detection probability (Marques and Buckland, 2003). Only the half-normal and the hazard-rate detection functions were proposed to fit distance data for both platforms. Exploratory analyses indicated that adequate fits were obtained by modeling unbinned (boat) and binned perpendicular distance data (plane grouping intervals: 0-29m, 29-59m, 59-129m, 129-198m, 198-268m) and by right truncating the boat perpendicular distance data at 180 m. Beaufort sea state (factor covariate with two levels: “calm”, Beafourt sea state between 0 and 1, and “high” between 2 and 3), glare (factor covariate with two levels “presence” and “absence”) and group size (numerical covariate) were considered as covariates to model distance data from the airplane and from the boats. Models with each one of those covariates and with permutations of them were selected based on the fit of the model as judged by the goodness of fit tests (Buckland et al., 2001). Selected models were ranked according to the Akaike Information Criterion (AIC), and model averaging was performed to incorporate unconditional model selection variance in the estimates and confidence intervals (Burnham and Anderson, 2002). Analyses were performed using a set of customized functions (mrds v.2.2.0, Laake et al., 2018) in R, version 4.1.1 (R Core Team, 2021). Only data recorded by the front observers in the airplane (bubble windows) were considered in the analysis presented in this study because the field of view between front and rear observers only partially overlapped. Perpendicular distance estimated from the boats were corrected for each observer considering the calibration experiments described above prior to estimation of detection probability for that platform.
2.1.3.3 Group size, density, and abundance estimation
Abundance of groups (Ng) and individuals (Ni) was estimated using the Horvitz-Thompson (H-T) estimator following Marques and Buckland (2003). Variance was estimated using the analytical estimator of Innes et al. (2002). Log-normal 95% confidence intervals (Buckland et al., 2001) were computed after unconditional variance was derived (Zerbini et al., 2006).
2.1.3.4 Computing a correction factor for aerial surveys
A factor to correct for visibility and group size biases in aerial survey-based estimates of density was computed from the following ratio:
and variance for this CF was approximated by the delta method (Seber, 1982).
This CF assumes that no visibility bias occurred in the density estimated by the boat survey (i.e. g(0)boat = 1) and that the size of the group detected from this platform was accurately estimated.
2.2 Experiment 2
2.2.1 Assessment of availability of franciscana groups
Data on availability of franciscana groups was obtained from helicopter surveys conducted in Babitonga Bay (SC) from 23 to 31 January 2014 (Sucunza et al., 2018), and in Ubatuba (23°28’S, 045°03’W), State of São Paulo (SP), southeastern Brazil (Figure 1 upper) from 28 November to 15 December 2016. Studies conducted in Babitonga Bay have proved useful to assess availability of franciscana dolphins (Sucunza et al., 2018). However, the visibility conditions (typically murky and shallow waters) in this region are similar to that in many parts of the range of the species (Amaral et al., 2018). Therefore, sampling in more heterogeneous habitats was required for correction factors to be more representative of all franciscana habitats. In this sense, new helicopter surveys were conducted in Ubatuba, a relatively high-density area for this species (Sucunza et al., 2020) and a region with contrasting environmental conditions from those of Babitonga Bay (i.e. clearer, deeper and open sea waters) (Figure 2).
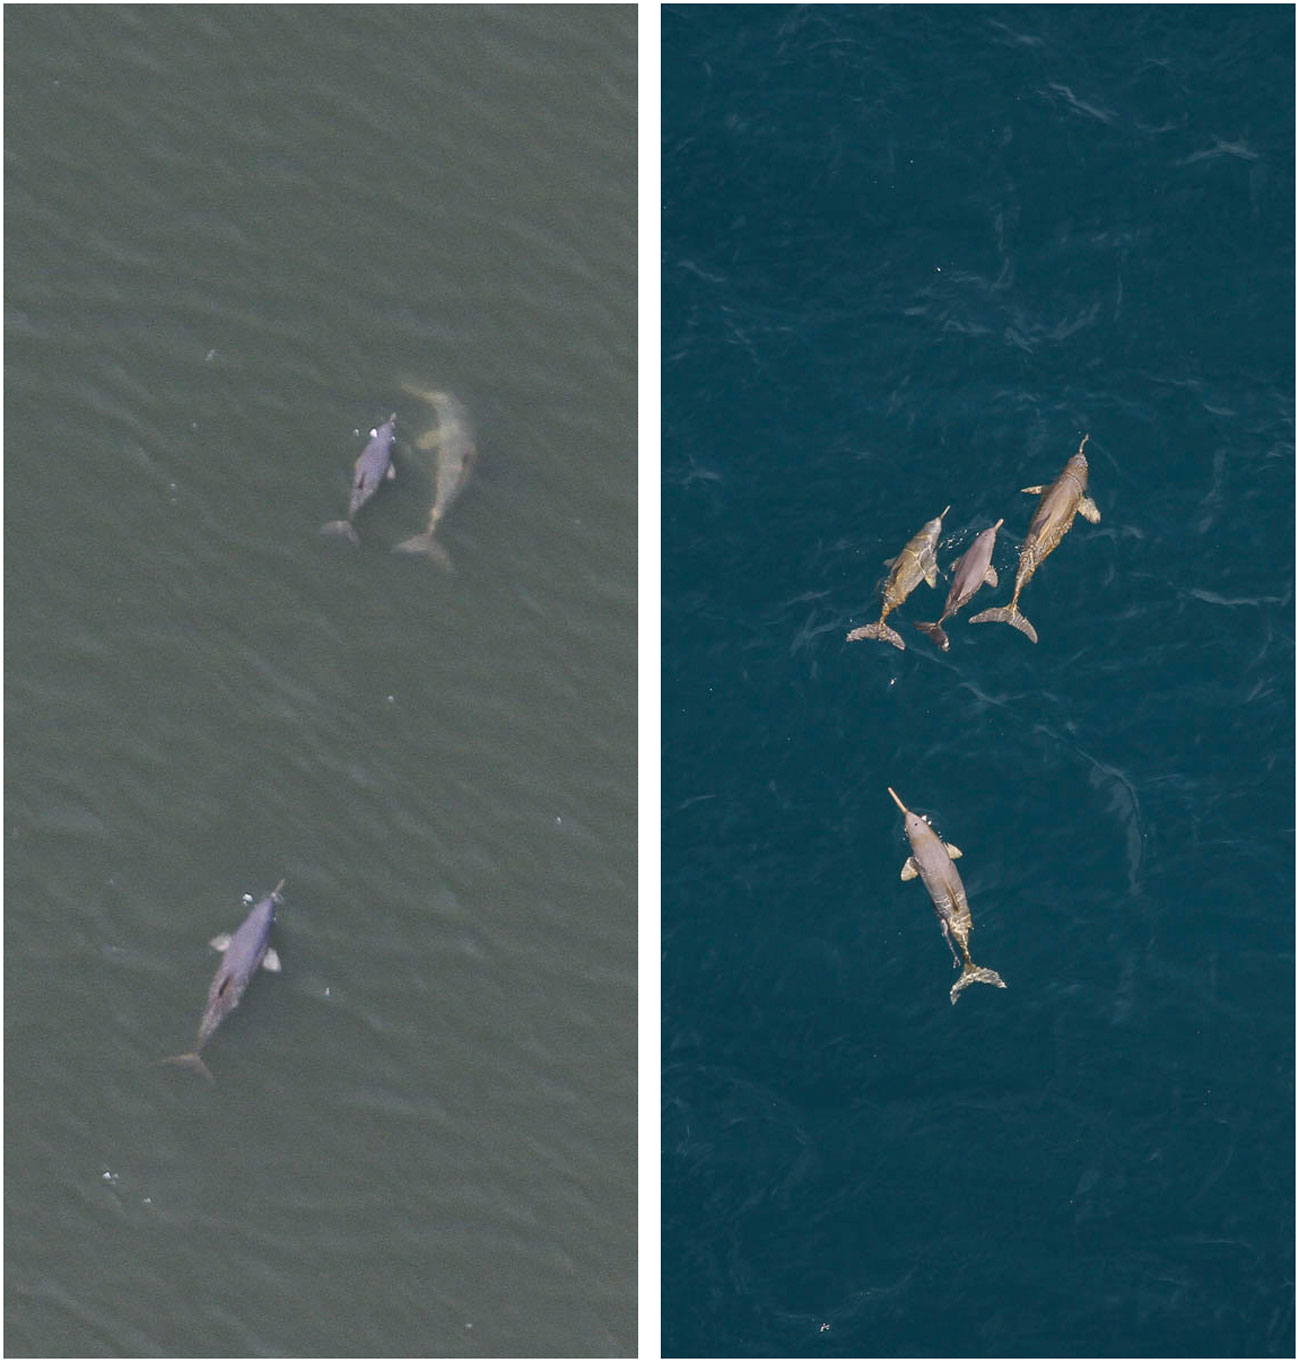
Figure 2 Franciscana (Pontoporia blainvillei) groups classified as available to detection from the air. Note differences in water turbidity between Babitonga Bay (left - murky waters) and Ubatuba (right - clear waters).
A four-seat helicopter Robinson R44 was used during visual surveys in both regions. Flights were conducted at 150 m (500 ft), an altitude consistent with that flown during aerial surveys to estimate abundance of franciscana dolphins (Secchi et al., 2001; Crespo et al., 2010; Danilewicz et al., 2010; Sucunza et al., 2020). Surveys were carried out during the morning in calm conditions (Beaufort sea state< 3), and had an average duration of 4 h. To maximize visibility for the observers, the doors of the helicopter were detached. Two observers with substantial experience in aerial surveys and familiar with the identification of the franciscana searched for groups of dolphins on the left side of the helicopter. Once a group was detected, the pilot hovered over it and each observer recorded surfacing and dive times independently. A group was defined as above (Shane, 1990). Each observer was responsible for recording biological (e.g. group size, presence of calves) and environmental (e.g. Beaufort sea state, water color) variables. Data were recorded by each observer on audio digital recorders and every record was time-referenced based on digital watches synchronized to a GPS. Depth and water transparency (measured with a Secchi disc) at the location of each sighting were recorded from boats operating in the same area and in radio communication with the helicopter. A detailed description of data collection protocols is presented in Sucunza et al. (2018).
A surfacing interval was defined as the period of time in which at least one individual in a group of franciscanas was visually available, at or near the surface, to the observer in a helicopter (Figure 2) while a diving interval was defined as the period of time in which all individuals of the group were not visible. A surface-dive cycle was defined as the period from the beginning of one surfacing interval to the next. The proportion of time at surface was calculated as the ratio between a surfacing period and a surface-dive cycle.
Generalized linear mixed-effects model (GLMM) were used to evaluate the effects of biological and environmental predictors on the proportion at surface (the response variable) using the package nlme (Pinheiro and Bates, 2019) in the open-source software R (R Core Team, 2021). Model-averaged parameters were estimated for each predictor variable following the modeling procedures described in Sucunza et al. (2018).
To estimate the probability of franciscana group(s) be visually available within the visual range of a passing observer in a fixed-wing aircraft, the model proposed by Barlow et al. (1988) was used:
where s, t, and d, correspond, respectively, to the mean time of each individual surfacing interval, the window of time during which a franciscana group is in the observer’s view (t = 6 seconds, Sucunza et al., 2018) and the mean time of each individual diving interval. Variance of Pr was estimated by the delta method (Seber, 1982), given by the equation presented by Crespo et al. (2010).
Additional data on franciscana availability was obtained using an artificial franciscana model (Figure 3). The model was of size (total length ~150 cm) and coloration identical to an adult franciscana dolphin as it was constructed based on the features of a fresh carcass from a mature individual of this species by-caught in southern Brazil. The experiment followed the methods proposed by Pollock et al. (2006). The model was positioned at different depths in the water column, and each observer in the helicopter recorded if the model was or not recognizable for detection of a passing observer in a fixed-wing aircraft. Depth and water transparency at the location where the model was displayed were also recorded.
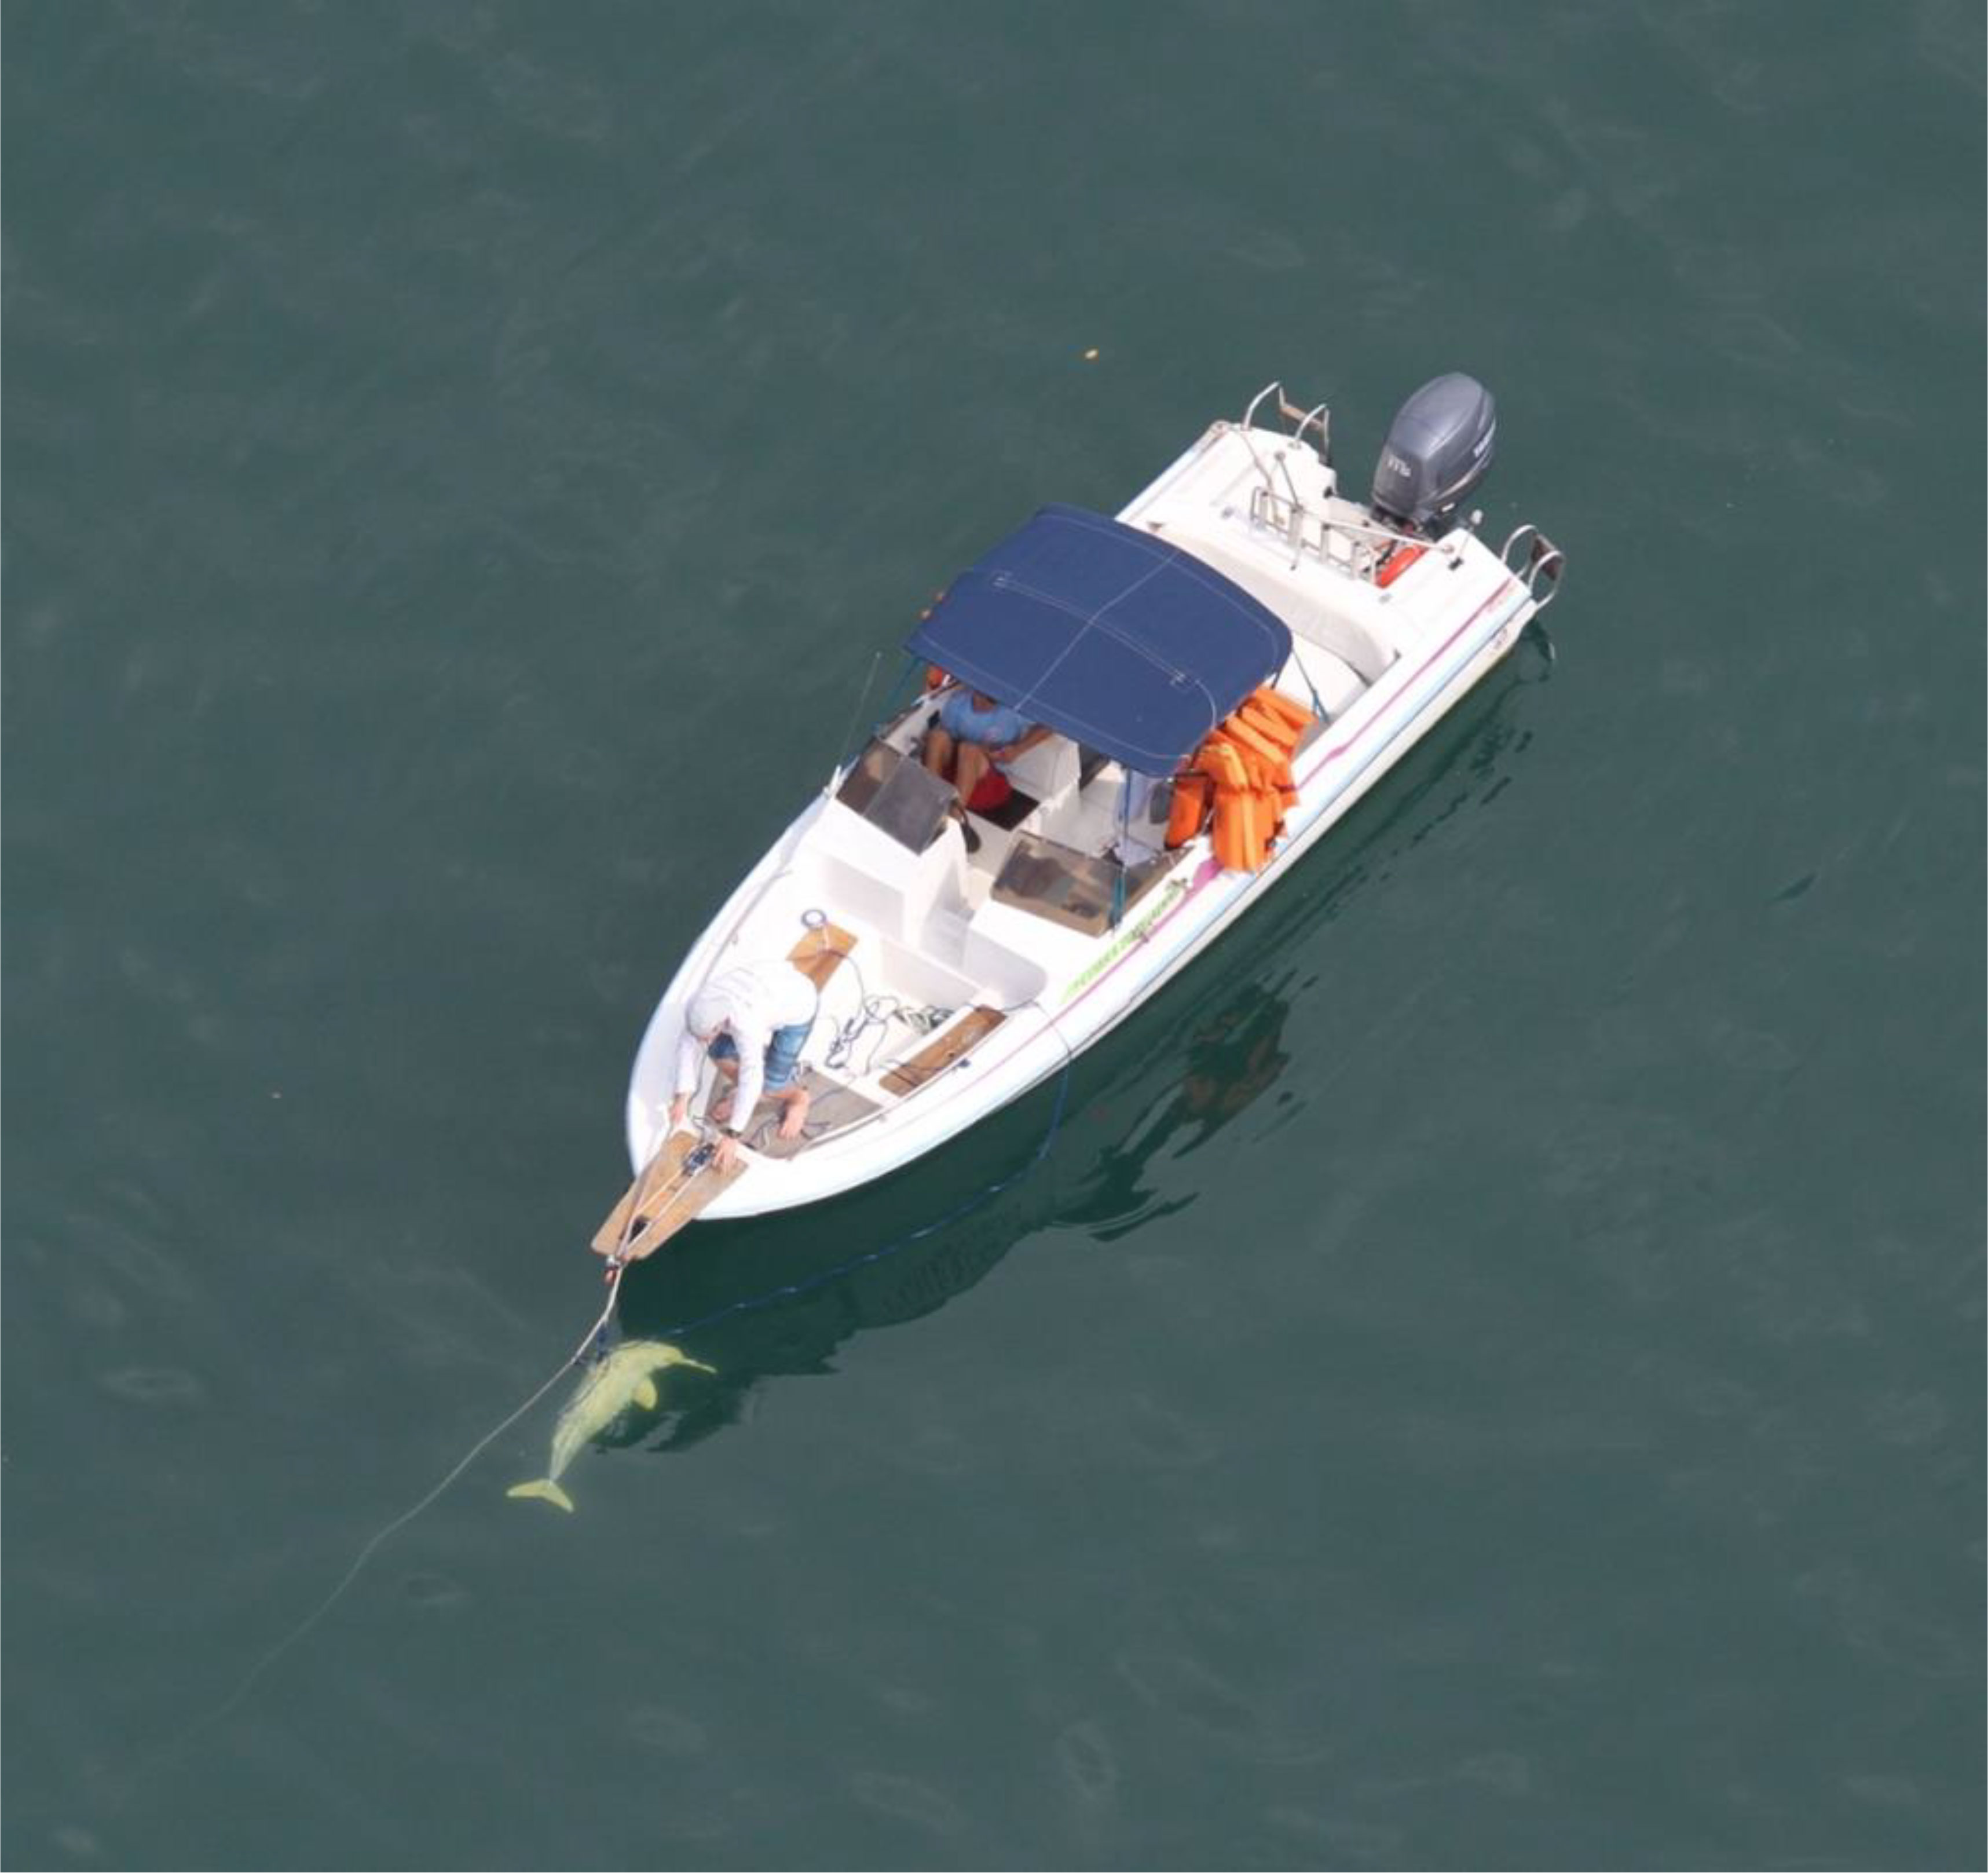
Figure 3 Artificial franciscana model used to obtain additional data on franciscana dolphins availability. The model was of size (total length ~150 cm) and coloration identical to an adult franciscana dolphin.
3 Results
3.1 Experiment 1
The realized effort in areas A and B by boat and aircraft is summarized in Table 1. In nearly 1,900 km of trackline sampled by both platforms together, a total of 356 franciscana groups was recorded.
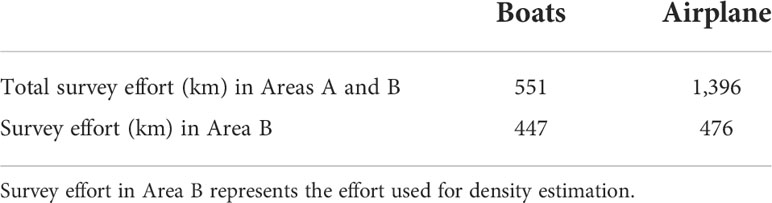
Table 1 Survey effort conducted by boats and airplane to estimate density of franciscana dolphins in Babitonga Bay, southern Brazil, in February 2011.
3.1.1 Group size
Group size statistics for the franciscana aerial and boat surveys in Babitonga Bay are summarized in Table 2. Group sizes varied between 1 and 7 individuals for both platforms.
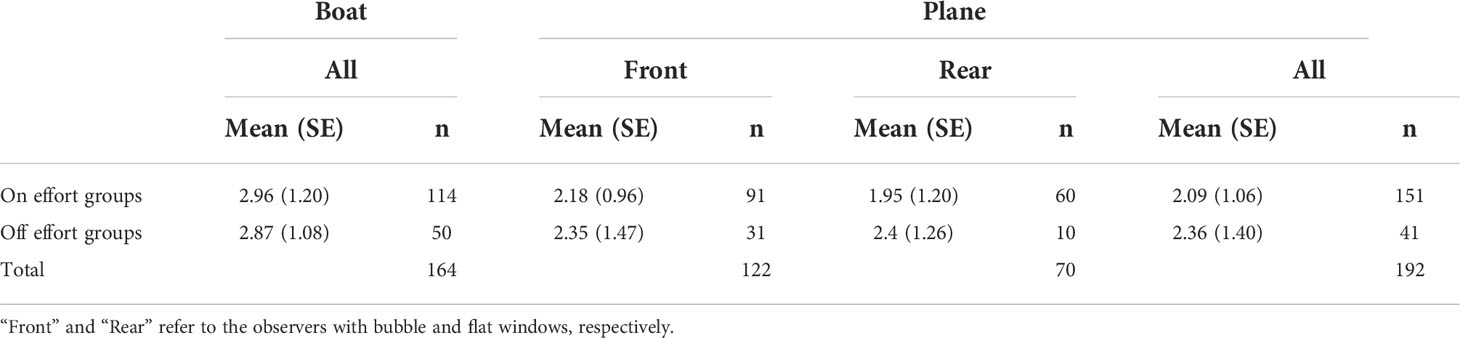
Table 2 Summary of mean (standard error, SE, in parenthesis) group sizes of franciscana dolphins recorded from two different platform types in Babitonga Bay, southern Brazil, in February 2011.
The GLM with distance and platform was the best model selected by AICc (Table 3), and the interaction between these two variables was not significant. The selected model suggested that group size estimates from the aircraft were significantly smaller than those from the boat. Predicted group sizes for each platform computed from the model parameters estimates indicated that groups seen from the boat are, on average, 36% (CV = 0.11) larger than those seen from the airplane (Table 4).
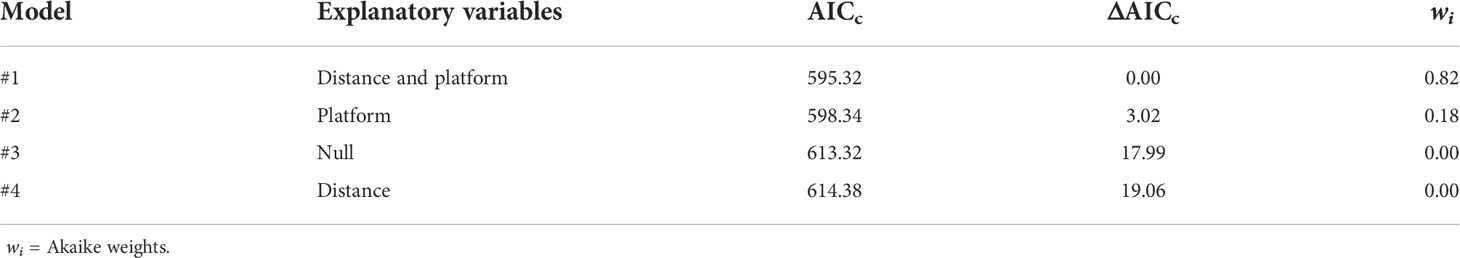
Table 3 Models proposed to assess differences in group size estimation between boat and aircraft.
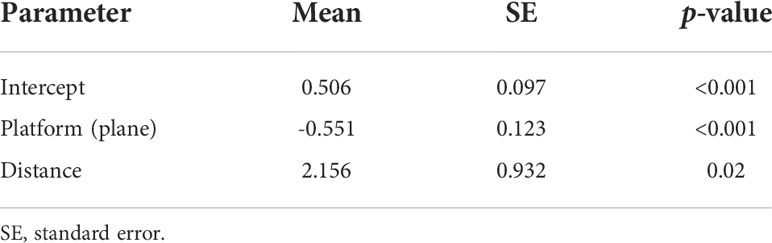
Table 4 Model parameter estimates for the best model (#1) in Table 3, above.
There was no significant difference in group sizes estimated by observer on the boat while surveying the transect lines (passing mode, mean = 2.96, SE = 1.20) and when groups were approached off effort (mean = 2.87, SE = 1.08) for a more accurate estimation of the number of individuals in the group (t-test = -0.46, p-value = 0.65).
3.1.2 Distance calibration
Radial distance data were log-transformed to address the observed heteroscedasticity problem in the least-square regression (Zuur et al., 2009). One out of five observers tended to underestimate distance by 9% on average. All other observers overestimated distance by on average 8-40%. Results of the calibration experiment are summarized in Table 5.
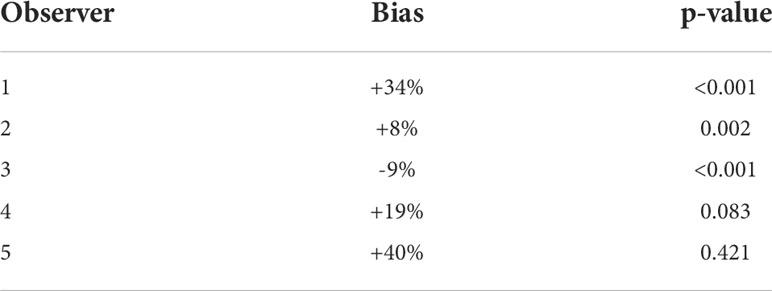
Table 5 Observer bias in estimating radial distance from calibration experiments.
3.1.3 Density and abundance estimates and correction factor computation
The hazard rate model with size covariate or with Beaufort sea state covariate provided the best fit for perpendicular distance data for airplane and boats, respectively (Figure 4). Franciscana densities estimated by boat (3.20 ind/km2, 95% CI = 2.09-4.88) and plane (0.67 ind/km2, 95% CI = 0.39-1.15) were significantly different and the ratio of the two resulted in a correction factor of 4.76 (CV=0.25). Quantities related to density and abundance estimation are summarized in Table 6.
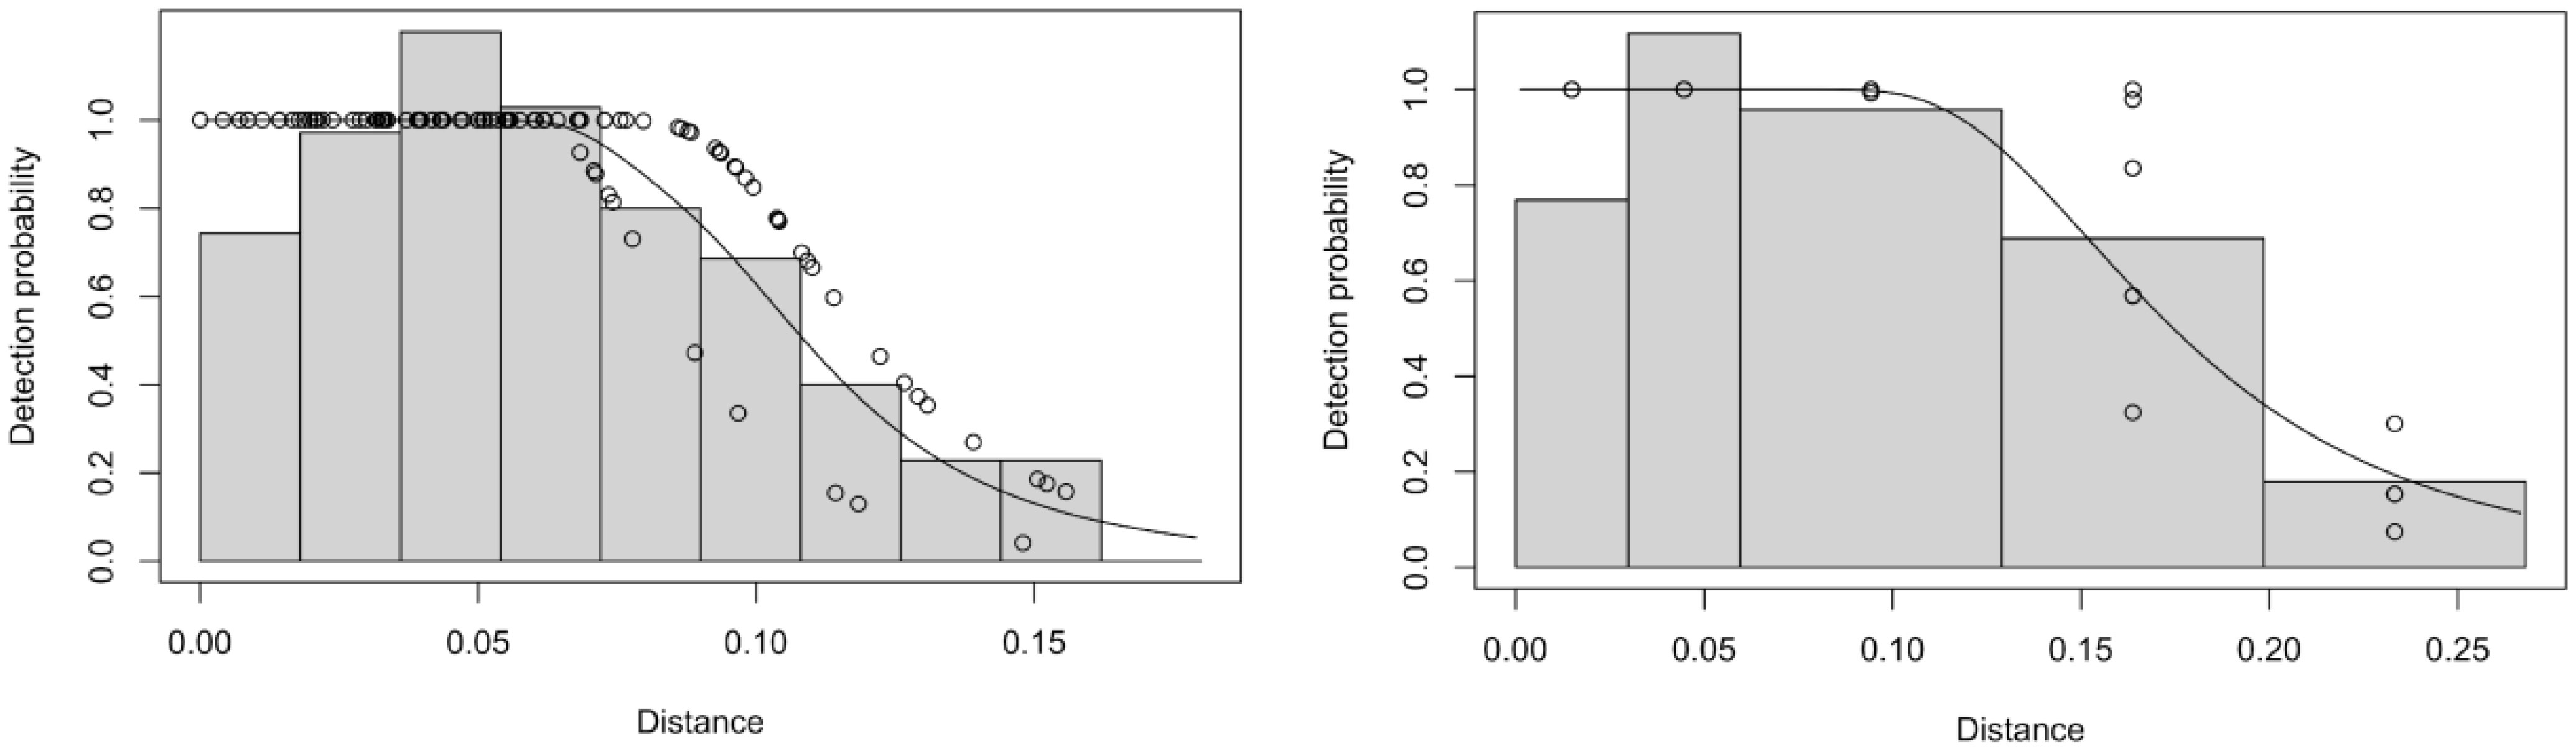
Figure 4 Detection probability functions fit to perpendicular distance (in kilometer) data collected in Babitonga Bay, southern Brazil, in February 2011, by the boats (left) and the aircraft (right).
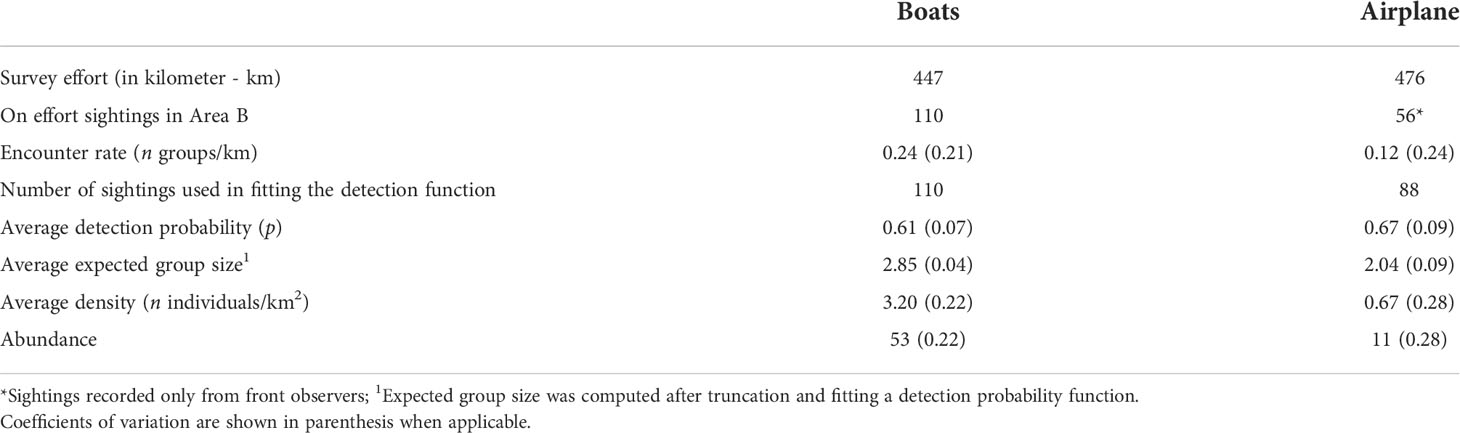
Table 6 Quantities used for estimation of density of franciscana dolphins in Babitonga Bay, southern Brazil, in February 2011.
3.2 Experiment 2
A total of 45 hours was flown during the helicopter experiments in Babitonga Bay (15hs) and Ubatuba (30hs). A total of 373 complete surface-dive cycles was recorded for 167 franciscana groups. Biological and environmental variables recorded in both areas are summarized in Table 7. The mean depth from the water surface at which the franciscana model became recognizable to the observers on the aerial platform at 150 m of altitude vary significantly between the areas from 1.06 m (SE = 0.25, range = 0.60 – 1.40 m) in Babitonga Bay and 2.12 m (SE = 0.18, range = 2.00 – 2.25 m) in Ubatuba (t-test = -6.81, p-value = 0.01).
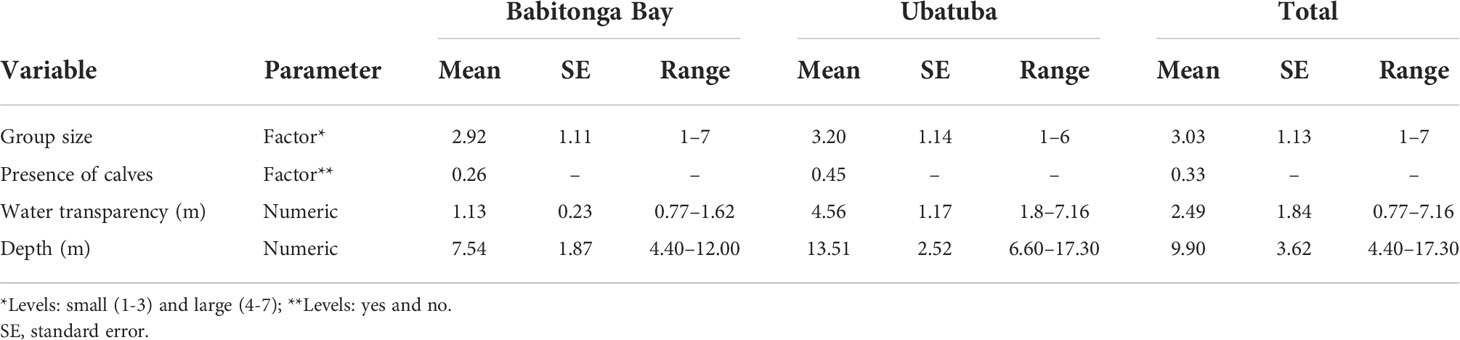
Table 7 Summary of biological and environmental variables recorded in Babitonga Bay and Ubatuba and tested in the generalized mixed-effects models.
The most parsimonious GLMM only included group size as the predictor variable, suggesting a significant positive effect of larger groups on the proportion of time at surface (Table 8). Group was the most important predictor variable (RI = 1.0) and was a significant predictor in some but not all models. All the other predictor variables were non-significant in all models.
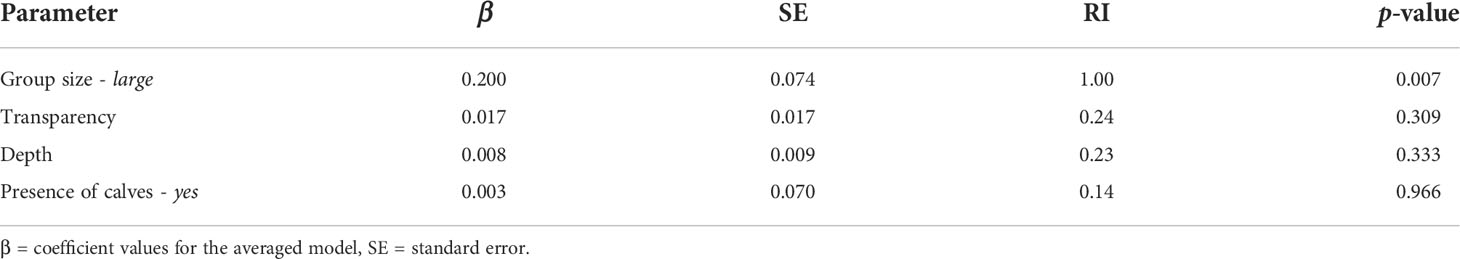
Table 8 Model-averaged predictor coefficients and relative importance (RI).
Surfacing and dive intervals were significantly smaller in Babitonga Bay than in Ubatuba (p-value =<0.001), but the proportion of time at surface did not vary significantly between the study areas (Babitonga Bay = 0.36, Ubatuba = 0.34, p-value = 0.32) (Table 9). The estimated window of time (t = 6 seconds, Sucunza et al., 2018), resulted in an estimation of availability of 0.39 (CV = 0.39) for both areas combined (Table 9).
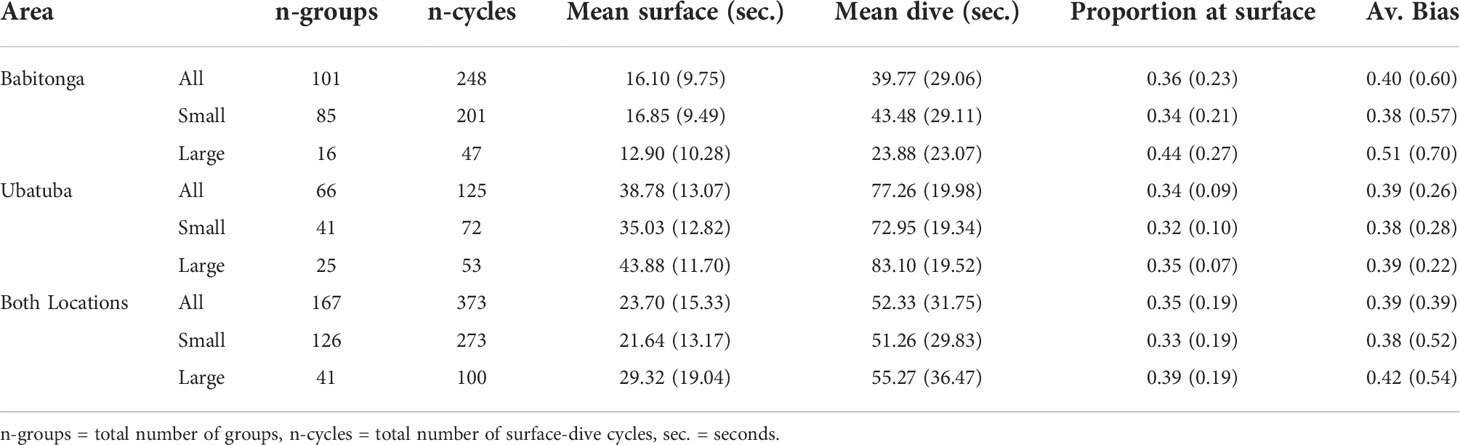
Table 9 Summary of franciscana groups surface-dive cycles data recorded during helicopter experiments in Babitonga Bay and Ubatuba, and estimated availability bias (Av. Bias).
4 Discussion
This study clearly demonstrates that estimates of franciscana density/abundance from aircraft are biased low to a relatively large extent if no correction is applied for visibility and group size biases. Bias in these two quantities correspond to the main factors affecting estimates of density and abundance of other cetacean species (e.g. Cockcroft et al., 1992; Fuentes et al., 2015; Williams et al., 2016; Williams et al., 2017), and, although a variety of techniques have been developed to correct for these biases (e.g. Marsh and Sinclair, 1989; Laake et al., 1997; Borchers et al., 2006; Pollock et al., 2006; Thomson et al., 2012; Gerrodette et al., 2019), addressing these issues is a challenge frequently not achieved (Caughley, 1974; Gu and Swihart, 2004; Barlow, 2015). The present results indicate that abundance estimates computed from aerial surveys can underestimate the true abundance of franciscana dolphins by about 4-5 times. The experiments developed in this study allowed for successful estimation of a CF for aerial surveys as well as to provide a breakdown of the visibility and group size biases and are relevant for other cetacean species.
Because cetaceans remain at the surface for relatively short periods of time, observers tend to underestimate the number of individuals in a group (Gilpatrick, 1993; Boyd et al., 2019; Gerrodette et al., 2019). The fast speed of the aircraft reduces the period of time that a group is within the observer‘s view, reducing the time available to precisely count and thus increasing the magnitude that group sizes are underestimated. Results of this study show that there is a significant negative bias (~36%) in the estimated size of franciscana groups in aerial surveys. Based on the small group size observed for the franciscana in this study, and the positive effect of group size on the group size bias (Gerrodette et al., 2019), these results demonstrate the significant relevance to account for group size bias during aerial surveys of cetacean species, especially those that form large aggregations.
The methods used to access the group size bias in this study relies on the assumption that observers from the boats and from the aircraft used the same group definition and that estimates of group size from the boats were unbiased. Both assumptions were considered to be achieved in this study because there were no doubt between observers about group definition, and because groups seen off effort during boats surveys (i.e. those for which group sizes were estimated after observers spent significant more time with the animals) were not statistically different from those seen during passing mode while sampling survey lines. In addition, the range and mean group size estimated from the boats in this study (mean = 2.96, SE = 1.12, range = 1-7) were nearly identical to those obtained during an independent experiment conducted from helicopter in the same area at a different time period (mean = 2.92, SE = 1.11, range = 1-7, Sucunza et al., 2018). Considering the exceptional view from the helicopter, these similarities strongly support the assumption that group definition was consistent between surface- and aerial-based observers and that estimates of group size from the boats were unbiased. However, if group sizes estimated from the boats are biased low, the group size bias computed here for the airplane is also negatively biased.
Another way of assessing bias in group size estimates from the aircraft would be to compare the expected group sizes computed with the Horvitz-Thompson abundance estimates. In the estimates presented above, the mean expected group size estimated from the plane is 40% smaller than those from the boats. This figure is different, but comparable to that computed with the GLM analysis (a 36% difference between boat and airplane estimates of group size). The difference between the average group sizes computed from the GLM analysis and the H-T estimator likely occurs because the sample sizes in the two approaches are different. The GLM analysis is preferred here because of the greater sample size used.
During aircraft surveys, the window of time that an observer has to search on a specific area of the ocean is primarily conditioned by the aircraft speed (Caughley, 1974). Increasing speed negatively affects the probability of detection of available groups (perception bias) as well as the probability that a group becomes available during the passage of the aircraft (availability bias). Although perception bias can be computed from data recorded during line-transect surveys (Laake and Borchers, 2004; Pollock et al., 2006; Southwell and Low, 2009; Hammond et al., 2013), estimation of availability typically requires additional effort, such as the independent estimates of the availability processes produced in this study. The possibility to clearly define a franciscana group as visually available or unavailable in murky and clear waters was key to the unambiguous estimation of the availability process, and should be taken into account when planning similar experiments.
Environmental variables (e.g. water transparency, depth) have been demonstrated to affect availability of marine species (Slooten et al., 2004; Pollock et al., 2006, Thomson et al., 2012). However, in the present experiments, only the size of the group had a significant effect on the availability of franciscana groups. This apparent lack of effects of environmental variables on the availability process of franciscana dolphins was previously reported by Sucunza et al. (2018), who credited it to the relatively narrow range of the values recorded of the environmental covariates in Babitonga Bay. In the present study, data from Sucunza et al. (2018) were combined with surface-dive data recorded in Ubatuba, where waters are deeper and clearer than those found in Babitonga Bay. Although the mean surface and dive intervals varied significantly between both areas, the proportion of time at surface was very similar, which may explain, at least partly, why environmental covariates may have little effect on the availability of franciscana groups seen from the air.
A potential shortcoming of the present analysis is that no information is available on the surface-dive cycles of franciscana dolphins in shallow and clear waters. Although such features are not typical of the franciscana habitat (Amaral et al., 2018), the availability of individuals in areas where the bottom can be seen should equal 1. Based on the observations of the franciscana model, it can be assumed that franciscana dolphins are potentially available to be seen only if they are within 2 m from the surface in clear waters and 1 m in turbid waters. Since franciscana dolphins are not typically seen in habitats with waters shallower than 2 m, it would be assumed that the present estimates of availability bias are accurate. The information recorded from the franciscana model could be used with dive data recorded from time-depth recorder tags to refine availability bias estimates.
If one assumes that 36% of the bias in estimates of franciscana abundance from aerial surveys comes from underestimation of group sizes, the fraction of the correction factor computed above that correspond to visibility bias is 3.05 [=4.76*(1-0.36)], which is equivalent to an estimate of g(0) = 0.328 (=1/3.05). Because the average total availability of franciscana groups estimated in this study is equal to 0.39, the proportion of groups available that were missed by the observers can be estimated at 16% [=1-(0.328/0.39)]. Similar values were reported for a franciscana aerial survey for which perception bias was computed at 13-23% (Sucunza et al., 2020) using mark-recapture distance sampling methods (MRDS, Borchers et al., 1998; Borchers et al., 2006). It is interesting to note that some of the observers changed between the present study and the surveys reported in Sucunza et al. (2020), but all had relatively similar experiences. Thus, these results suggest a similar rate of miss-detection of franciscana groups between observers with similar experience. These results are also consistent with those from Laake et al. (1997) who reported that experienced observers missed 14% of available groups while inexperienced observers missed up to 77% of the available groups during aerial surveys for harbor porpoise (Phocoena phocoena), a species with similar size to the franciscana, in coastal waters of Washington State, USA. In the present study perception bias was not assessed during experiment 1 (e.g. by using MRDS methods) because of inconsistencies in matching groups seen by observers in the airplane’s front or rear window during the aerial surveys conducted in Babitonga Bay.
4.1 Application of the correction factor to existing and future franciscana abundance estimates
The use of the correction factor computed here to adjust existing and future estimates of franciscana abundance requires considerations about the field of view and the speed of the aircraft, flight altitude and experience of the observers. If differences between aircrafts result in different fields of view such as in previous abundance estimates of franciscanas in southern Brazil and Argentina (Secchi et al., 2001; Crespo et al., 2010), the correction factor is likely not applicable. For surveys using the same aircraft used in the present study and observers with similar experience the use of the correction factor is valid and should be performed.
The new estimates of availability of franciscana groups reported in this study as well as the independent estimate of groups size bias can be used to correct aerial surveys of franciscana dolphins because the type of aircraft has limited influence in the estimation of both quantities. Although the experience of the observer potentially affects group size estimates, inexperienced observers should magnify this negative bias and, thus, the use of these corrections would produce conservative results. Experiments to address availability of franciscana groups to aerial platforms are recommended in other regions to compute improved and/or area-specific correction factors. However, the availability of franciscana groups reported here appears to be a robust estimate considering that surveys were carried out in two locations with different environmental characteristics but consistent with those found throughout most of the species range.
Data availability statement
The original contributions presented in the study are included in the article/supplementary material. Further inquiries can be directed to the corresponding author.
Ethics statement
Experiment 2 was performed in accordance with approvals granted by the Instituto Chico Mendes de Conservação da Biodiversidade (ICMBio - permit #56339-1).
Author contributions
The experiments to evaluate visibility and group size bias in franciscana aerial surveys were designed by AA, DD, FS and AZ. Field work was planned by MC, DD, FS and AZ. All authors participated in at least one of the field seasons. FS and AZ compiled data and performed statistical analysis. FS drafted the final manuscript. All authors contributed to the article and approved the submitted version. Any views or opinions expressed here are those of the authors and do not necessarily reflect the views of the US National Marine Fisheries Service-NOAA Fisheries.
Funding
The authors wish to thank the IWC Small Cetacean Voluntary Fund, Instituto Chico Mendes para Conservação da Biodiversidade (Brazilian Government) and the Brazilian Biodiversity Fund for funding to conduct this study.
Acknowledgments
The authors are greatly indebted to Jeff Laake for advice on survey design, data analysis, and during preparation of this manuscript. Logistical support during field activities was provided by Yatch Clube de Joinville, Gustavo Miranda, Ana K. Moraes, Annelise C. Holz, Beatriz Schulze, Luiz Claudio P. de S. Alves, Natacha Zimmermann, Pamela S. Actis, Renan Paitach and Rodrigo Belesso. Ecophocus Taxi Aéreo crew’s and the pilot of the helicopter Paulo Camejo were key in safely completing this study. The Coordination for the Improvement of Higher Education Personnel (CAPES) provided a scholarship to FS (Process 1548067).
Conflict of interest
The authors declare that the research was conducted in the absence of any commercial or financial relationships that could be construed as a potential conflict of interest.
The reviewer FDOL declared a shared affiliation with the authors PACF, DP to the handling editor at the time of review.
Publisher’s note
All claims expressed in this article are solely those of the authors and do not necessarily represent those of their affiliated organizations, or those of the publisher, the editors and the reviewers. Any product that may be evaluated in this article, or claim that may be made by its manufacturer, is not guaranteed or endorsed by the publisher.
References
Amaral K. B., Danilewicz D., Zerbini A., Di Beneditto A. P., Andriolo A., Alvares D. J., et al. (2018). Reassessment of the franciscana pontoporia blainvillei (Gervais & d’Orbigny 1844) distribution and niche characteristics in Brazil. J. Exp. Mar. Biol. Ecol. 508, 1–12. doi: 10.1016/j.jembe.2018.07.010
Andriolo A., Kinas P. G., Engel M. H., Martins C. C. A., Rufino A. M. (2010). Humpback whales within the Brazilian breeding ground: Distribution and population size estimate. Endangered Species Res. 11, 233–243. doi: 10.3354/esr00282
Barlow J. (2015). Inferring trackline detection probabilities, g(0), for cetaceans from apparent densities in different survey conditions. Mar. Mammal Sci. 31, 923–943. doi: 10.1111/mms.12205
Barlow J., Oliver C. W., Jackson T. D., Taylor B. L. (1988). Harbor porpoise, phocoena phocoena, abundance estimation for California, Oregon, and Washington: II. aerial surveys. Fishery Bull. 86, 433–444. Available at: https://fisherybulletin.nmfs.noaa.gov/index.php/content/harbor-porpoise-phocoena-phocoena-abundance-estimation-california-oregon-and-washington-ii.
Borchers D. L., Buckland S. T., Goedhart P. W., Clarke E. D., Hedley S. L. (1998). Horvitz-Thompson estimators for double-platform line transect surveys. Biometrics 54, 1221–1237. doi: 10.2307/2533652
Borchers D. L., Laake J. L., Southwell C., Paxton C. G. M. (2006). Accommodating unmodeled heterogeneity in double-observer distance sampling surveys. Biometrics 62, 372–378. doi: 10.1111/j.1541-0420.2005.00493.x
Bordino P., Thompson G., Iñíguez M. (1999). Ecology and behaviour of the franciscana (Pontoporia blainvillei) in bahía anegada, Argentina. J. Cetacean Res. Manage. 1, 213–222. Available at: https://www.sciencebase.gov/catalog/item/50575c94e4b01ad7e02743ad.
Boyd C., Hobbs R. C., Punt A. E., Shelden E. W., Sims C. L., Wade P. R. (2019). Bayesian Estimation of group size for a costal cetacean using aerial survey data. Mar. Mammal Sci., 35(4) , 1322–1346. doi: 10.1111/mms.12592
Buckland S. T., Anderson D. R., Burnham K. P., Laake J. L., Borchers D. L., Thomas L. (2001). Introduction to distance sampling: Estimating abundance of wildlife populations (New York: Oxford University Press).
Buckland S. T., Anderson D. R., Burnham K. P., Laake J. L., Borchers D. L., Thomas L. (2004). Advanced distance sampling: Estimating abundance of biological population (New York: Oxford University Press).
Burnham K. P., Anderson D. R. (2002). Model selection and multimodel inference: A practical information-theoretic approach. 2nd ed (New York: Springer).
Cockcroft V. G., Ross G. J. B., Peddemors V. M., Borchers D. L. (1992). Estimates of abundance and undercounting of bottlenose dolphins off northern natal, south Africa. South Afr. J. Wildlife Res. 22, 102–109. doi: 10.10520/EJC116909
Cremer M. J., Danilewicz D., Sucunza F., Berninsone L. G., Paitach R. L., Wells R. S. (2022). “Behavior and movement patterns of franciscana dolphins,” in The franciscana dolphin: On the edge of survival. Eds. Cremer M. J., Simões-Lopes P. C. (San Diego: Academic Press), 149–174.
Cremer M. J., Simões-Lopes P. C. (2008). Distribution, abundance and density estimates of franciscanas, Pontoporia blainvillei (Cetacea: Pontoporiidae), in babitonga bay, southern Brazil. Rev. Bras. Zool 25, 397–402. doi: 10.1590/S0101-81752008000300003
Crespo E. A., Harris G., González R. (1998). Group size and distributional range of the franciscana, Pontoporia blainvillei. Mar. Mammal Sci. 14, 845–849. doi: 10.1111/j.1748-7692.1998.tb00768.x
Crespo E. A., Pedraza S. N., Grandi M. F., Dans S. L., Garaffo G. V. (2010). Abundance and distribution of endangered franciscana dolphins in Argentine waters and conservation implication. Mar. Mammal Sci. 26, 17–35. doi: 10.1111/j.1748-7692.2009.00313.x
Crespo E. A., Secchi E. R., Rosa L. D., Kinas P. G., Danilewicz D., Bordino P. (2002). Report of the working group on abundance estimates. Latin Am. J. Aquat. Mammals 1, 65–66. doi: 10.5597/lajam00009
Danilewicz D., Denuncio P., Secchi E. R., Tanios G. (2022). “The life history of franciscana dolphins,” in The franciscana dolphin: On the edge of survival. Eds. Cremer M. J., Simões-Lopes P. C. (San Diego: Academic Press), 85–110.
Danilewicz D., Moreno I. B., Ott P. H., Tavares M., Azevedo A. F., Secchi E. R., et al. (2010). Abundance estimate for a threatened population of franciscana dolphins in southern coastal Brazil: Uncertainties and management implications. J. Mar. Biol. Assoc. United Kingdom 90, 1659–1666. doi: 10.1017/S0025315409991482
Danilewicz D., Secchi E. R., Ott P. H., Moreno I. B., Bassoi M., Borges-Martins M. (2009). Habitat use patterns of franciscana dolphins (Pontoporia blainvillei) off southern Brazil in relation to waters depth. J. Mar. Biol. Assoc. United Kingdom 89, 943–949. doi: 10.1017/S002531540900054X
Fuentes M. M. P. B., Bel I., Hagihara R., Hamann M., Hazel J., Huth A., et al. (2015). Improving in-water estimates of marine turtle abundance by adjusting aerial survey counts for perception and availability biases. J. Exp. Mar. Biol. Ecol. 471, 77–83. doi: 10.1016/j.jembe.2015.05.003
Gerrodette T., Perryman W. L., Oedekoven C. S. (2019). Accuracy and precision of dolphin group size estimates. Mar. Mammal Sci. 35, 22–39. doi: 10.1111/mms.12506
Gilpatrick J. J.W. (1993). Method and precision in estimation of dolphin school size with vertical aerial photography. Fishery Bull. 91, 641–648. Available at: https://fisherybulletin.nmfs.noaa.gov/content/method-and-precision-estimation-dolphin-school-size-vertical-aerial-photography.
Gu W., Swihart K. (2004). Absent or undetected? effects of non-detection of species occurrence on wildlife-habitat models. Biol. Conserv. 116, 195–203. doi: 10.1016/S0006-3207(03)00190-3
Hammond P. S., Francis T. B., Heinemann D., Long K. J., Moore J. E., Punt A. E., et al. (2021). Estimating the abundance of marine mammal populations. Front. Mar. Sci. 8. doi: 10.3389/fmars.2021.735770
Hammond P. S., Macleod K., Berggren P., Borchers D. L., Burt L., Cañadas A., et al. (2013). Cetacean abundance and distribution in European Atlantic shelf waters to inform conservation and management. Biol. Conserv. 164, 107–122. doi: 10.1016/j.biocon.2013.04.010
Heide-Jørgensen M. P., Laidre K., Borchers D., Samarra F., Stern H. (2007). Increasing abundance of bowhead whales in west Greenland. Biol. Lett. 3, 577–580. doi: 10.1098/rsbl.2007.0310
Hiby A. R., Hammond P. S. (1989). “Survey techniques for estimating abundance of cetaceans,” in Report of the international whaling commission (Special issue), vol. 11. , 47–80.
Innes S., Heide-Jørgensen M. P., Laake J. L., Laidre K. L., Cleator H. J., Richard P., et al. (2002). Survey of belugas and narwhals in the Canadian high Arctic in 1996 Vol. 4 (North Atlantic Marine Mammal Commission Scientific Publication), 4, 169–190.
Laake J., Borchers D., Thomas L., Miller D., Bishop J. (2018) Mrds: Mark-recapture distance sampling. r package version 2.2.0. Available at: https://cran.r-project.org/package5mrds.
Laake J. L., Borchers D. L. (2004) Methods for incomplete detection at distance zero. in Advanced distance sampling: Estimating abundance of biological populations. Eds. Buckland S. T., Anderson D. R., Burnham K. P., Laake J. L., Borchers D. L., Thomas L. Oxford University Press. 108–189
Laake J. L., Calambokidis J., Osmek S. D., Rugh D. J. (1997). Probability of detecting harbour porpoise from aerial surveys: Estimating g(0). J. Wildlife Manage. 61, 63–75. doi: 10.2307/3802415
Marques F. F. C., Buckland S. T. (2003). Incorporating covariates into standard line transect analyses. Biometrics 59, 924–935. doi: 10.1111/j.0006-341X.2003.00107.x
Marsh H., Sinclair D. F. (1989). Correcting for visibility bias in strip transect aerial surveys of aquatic fauna. J. Wildlife Manage. 53, 1017–1024. doi: 10.2307/3809604
McLellan W. A., McAlarney R. J., Cummings E. W., Read A. J., Paxton C. G. M., Bell J. T., Pabst D. A., et al (2018). Distribution and abundance of beaked whales (Family Ziphiidae) off Cape Hatteras, North Carolina, U.S.A. Marine Mammal Science 34:997–1017.
Nachtsheim D. A., Viquerat S., Ramírez-Martínez N. C., Unger B., Siebert U., Gilles A. A. (2021). Small cetacean in a human high-use area: Trends in harbor porpoise abundance in the north Sea over two decades. Front. Mar. Sci. 7. doi: 10.3389/fmars.2020.606609
Ott P. H., Secchi E. R., Moreno I. B., Danilewicz D., Crespo E. A., Bordino P., et al. (2002). Report of the working group on fishery interactions. Latin Am. J. Aquat. Mammals 1, 55–64. doi: 10.5597/lajam00008
Pinheiro J., Bates D. (2019). Nlme: Linear and nonlinear mixed effects models. r. package version 3. 1–140.
Pollock K. H., Marsh H., Lawler I. R., Alldredge M. W. (2006). Estimating animal abundance in heterogeneous environments: An application to aerial surveys for dugongs. J. Wildlife Manage. 70, 255–262. doi: 10.2193/0022-541X(2006)70[255:EAAIHE]2.0.CO;2
R Core Team (2021). R: A language and environment for statistical computing (Vienna, Austria: R Foundation for Statistical Computing). Available at: https://www.R-project.org/.
Seber G. A. F. (1982). The estimation of animal abundance and related parameters. 2nd edition (Charles Griffin & Company Ltd, London).
Secchi E. R., Cremer M. J., Danilewicz D., Lailson-Brito J. (2021). A synthesis of the ecology, human-related threats and conservation perspectives for the endangered franciscana dolphin. Front. Mar. Sci. 8. doi: 10.3389/fmars.2021.617956
Secchi E. R., Ott P. H., Crespo E. A., Kinas P. G., Pedraza S. N., Bordino P. (2001). A first estimate of franciscana (Pontoporia blainvillei) abundance off southern Brazil. J. Cetacean Res. Manage. 3, 95–100. Available at: http://repositorio.furg.br/handle/1/930.
Secchi E. R., Ott P. H., Danilewicz D. S. (2003). “Effects of fishing by-catch and conservation status of the franciscana dolphin, pontoporia blainvillei,” in Marine mammals: Fisheries, tourism and management issues. Eds. Gales N., Hindell M., Kirkwood R. (CSIRO Publishing, Australia), Pages 174–191.
Shane S. H. (1990). “Behavior and ecology of the bottlenose dolphin at sanibel island, Florida,” in The bottlenose dolphin. Eds. Leatherwood S., Reeves R. R. (San Diego: Academic Press), 245–265.
Siciliano S., Di Beneditto A. P., Ramos R. (2002). A toninha, Pontoporia blainvillei (Gervais & D’Orbigny 1884) (Mammalia: Cetacea) nos estados do Rio de Janeiro e espírito Santo, costa sudeste do brasil: Caracterização dos hábitats e possíveis fatores de isolamento das populações. Boletim do Museu Nacional Nova Série Zool 146, 1–15.
Slooten E., Dawson S. M., Rayment W. J. (2004). Aerial surveys for coastal dolphins: Abundance of hector’s dolphins off the south island west coast, new Zealand. Mar. Mammal Sci. 20, 477–490. doi: 10.1111/j.1748-7692.2004.tb01173.x
Southwell C., Low M. (2009). Black and white or shades of grey? detectability of adélia penguins during shipboard surveys in the Antarctic pack-ice. J. Appl. Ecol. 46, 136–143. doi: 10.1111/j.1365-2664.2008.01584.x
Sucunza F., Danilewicz D., Andriolo A., Azevedo A. F., Secchi E. R., Zerbini A. N. (2020). Distribution, habitat use, and abundance of the endangered franciscana in southeastern and southern Brazil. Mar. Mammal Sci. 36, 421–435. doi: 10.1111/mms.12650
Sucunza F., Danilewicz D., Cremer M., Andriolo A., Zerbini A. N. (2018). Refining estimates of availability bias to improve assessment of the conservation status of an endangered dolphin. PloS One 13, e0194213. doi: 10.1371/journal.pone.0194213
Thomson J. A., Cooper A. B., Burkolder D. A., Heithaus M. R., DILL L. M. (2012). Heterogeneous pattern of availability for detection during visual surveys: Spatiotemporal variation in sea turtle dive-surfacing behaviour on a feeding ground. Methods Ecol. Evol. 3, 378–387. doi: 10.1111/j.2041-210X.2011.00163.x
Williams P. J., Hooten M. B., Womble J. N., Bower M. R. (2017). Estimating occupancy and abundance using aerial images with imperfect detection. Methods Ecol. Evol. 8, 1679–1689. doi: 10.1111/2041-210X.12815
Williams R., Leaper R., Zerbini A. N., Hammond P. S. (2007). Methods for investigating measurement error in cetacean line-transect surveys. J. Mar. Biol. Assoc. U. k 87, 313–320. doi: 10.1017/S0025315407055154
Williams R., Moore J. E., Gomez-Salaz C., F. Trujilo, Burt L. (2016). Searching for trends in river dolphin abundance: Designing surveys for looming threats, and evidence for opposing trends of two species in the Colombian Amazon. Biol. Conserv. 195, 136–145. doi: 10.1016/j.biocon.2015.12.037
Zerbini A. N., Danilewicz D., Secchi E. R., Andriolo A., Cremer M., Flores P. A. C., et al. (2011). “Assessing bias in abundance estimates from aerial surveys to improve conservation of threatened franciscana dolphins,” in Preliminary results from a survey conducted off southern Brazil (Tromsø, Norway: IWC Scientific Committee), 13pp.
Zerbini A. N., Waite J. M., Laake J. L., Wade P. R. (2006). Abundance, trends and distribution of baleen whales off western Alaska and the central Aleutian islands. Deep-sea Res. I 53, 1772–1790. doi: 10.1016/j.dsr.2006.08.009
Zerbini A. N., Secchi E., Crespo E., Danilewicz D., Reeves R. (2017)Pontoporia blainvillei. In: IUCN 2017 (The IUCN Red List of Threatened Species). Available at: www.iucnredlist.org (Accessed 30 January 2018).
Zuur A. F., Ieno E. N., Walker N. J., Saveliev A. A., Smith G. M. (2009). Mixed effects models and extensions in ecology with r (New York: Springer).
Keywords: abundance estimation, aerial survey, availability bias, perception bias, group size bias, cetaceans, threatened species, franciscana dolphin
Citation: Sucunza F, Danilewicz D, Andriolo A, de Castro FR, Cremer M, Denuncio P, Ferreira E, Flores PAC, Ott PH, Perez MS, Pretto D, Sartori CM, Secchi ER and Zerbini AN (2022) Assessing bias in aerial surveys for cetaceans: Results from experiments conducted with the franciscana dolphin. Front. Mar. Sci. 9:1016444. doi: 10.3389/fmars.2022.1016444
Received: 11 August 2022; Accepted: 28 September 2022;
Published: 08 November 2022.
Edited by:
Salvatore Siciliano, Escola Nacional de Saúde Pública Sergio Arouca (Fiocruz), BrazilReviewed by:
Maria Danise De Oliveira Alves, Faculdade Frassinetti do Recife, BrazilFabia De Oliveira Luna, Centro Nacional de Pesquisa e Conservação de Mamíferos Aquáticos (CMA), Brazil
Alexandra Costa, Instituto Bicho D’agua: Conservação Socioambiental, Brazil
Copyright © 2022 Sucunza, Danilewicz, Andriolo, de Castro, Cremer, Denuncio, Ferreira, Flores, Ott, Perez, Pretto, Sartori, Secchi and Zerbini. This is an open-access article distributed under the terms of the Creative Commons Attribution License (CC BY). The use, distribution or reproduction in other forums is permitted, provided the original author(s) and the copyright owner(s) are credited and that the original publication in this journal is cited, in accordance with accepted academic practice. No use, distribution or reproduction is permitted which does not comply with these terms.
*Correspondence: Federico Sucunza, fsucunza@gmail.com