A Novel Method for Using Small Unoccupied Aerial Vehicles to Survey Wildlife Species and Model Their Density Distribution
 Christophe Cleguer
 Natalie Kelly
 Julian Tyne
 Martin Wieser
 David Peel
 Amanda Hodgson
- 1Centre for Sustainable Aquatic Ecosystems, Harry Butler Institute, Murdoch University, Murdoch, WA, Australia
- 2Australian Antarctic Division, Department of Agriculture, Water and the Environment, Kingston, TAS, Australia
- 3South Atlantic Environmental Research Institute, Stanley, Falkland Islands
- 4Independent Researcher in Photogrammetry, Vienna, Austria
- 5CSIRO Data61, Hobart, TAS, Australia
There is growing interest from research and conservation groups in the potential for using small unoccupied aerial vehicles (UAVs; <2 kg) to conduct wildlife surveys because they are affordable, easy to use, readily available and reliable. However, limitations such as short flight endurance, and in many situations, aviation regulations, have constrained the use of small UAVs in survey applications. Thus, there is a need to refine survey methods adapted to small UAVs that conform to standard operations within aviation law. We developed a novel survey approach based on a grid sampling design using two multirotor UAVs (Phantom 4 Pros) flying simultaneously, within visual line of sight, from our vessel base-station. We used this approach to assess the fine-scale distribution and abundance of dugongs (Dugong dugon) in the remote waters of the Pilbara, Western Australia during three field seasons across 2 years. We surveyed 64 non-overlapping survey cells in random order one or more times and obtained complete image coverage of each surveyed cell of our 31 km2 survey area. Our sampling design maximizes sampling effort while limiting survey time by surveying four cells, two at a time, from one location. Overall, we conducted 240 flights with up to 17 flights per day (mean = 14 flights per day) and could obtain complete coverage of up to 11.36 km2per day. A total of 149 dugongs were sighted within the 50,482 images which we manually reviewed. Spatially-explicit models of dugong density distribution (corrected for availability and perception bias) were produced using general additive models to identify areas more or less used by dugongs (range of corrected dugong densities across all field season = 0.002–1.79 dugongs per 0.04 km2). Dugong abundance estimates ranged from 47 individuals in June 2019 (CV = 0.17) to 103 individuals in May 2018 (CV = 0.36). Our method, which proved convincing in a real-word application by its feasibility, ease of implementation, and achievable surface coverage has the potential to be used in a wide range of applications from community-based local-scale surveys, to long-term repeated/intensive surveys, and impact assessments and environmental monitoring studies.
Introduction
A new promising and powerful approach to conducting wildlife surveys is to use unoccupied aerial vehicles (UAVs) and associated aerial imaging technology to collect highly accurate, detailed and verifiable data about the animals of interest and surveyed area (Gonzalez et al., 2016). Small UAVs (<2 kg) are receiving a lot of attention from researchers interested in conducting intensive, repeatable wildlife surveys because they are widely available, relatively affordable and easy to operate (Jones et al., 2006; Chabot, 2009; Watts et al., 2010; Chabot and Bird, 2015). Nonetheless, using small UAVs and aerial imagery requires us to develop aerial survey designs and analytical methods that are adapted to this new technology and to aviation law. In many places around the world the legal horizontal range of UAV operations is restricted to within visual line of sight, which severely limits the area that can be surveyed. These aviation restrictions on flight range reduce the benefits of UAVs that have extended flight endurance, leaving small systems a preferred option for wildlife aerial surveys (Sweeney et al., 2015; Kiszka et al., 2016). However, to date there has been little focus on developing an aerial survey methodology that augments the capabilities of small UAVs in the context of strict aviation regulations.
Although this paper lends itself to wildlife surveys in general, our focus in this study was on the use of small UAVs to conduct surveys of marine megafauna. Marine megafauna play important roles in shaping ecosystems (Atwood et al., 2015; Marsh et al., 2018) and they can be excellent indicators of habitat condition, as their distribution reflects that of their prey and or habitats (Hooker and Gerber, 2004; Hays et al., 2018). Thus, assessing marine megafauna distribution, habitat use, and abundance can be informative for the critical habitats they use, as well as for species conservation (Augé et al., 2018). Aerial surveys are an established and widely used approach to assess the distribution, habitat use and abundance of marine megafauna at broad spatial scales (100’s to hundreds of 1,000’s of km2) (Pollock et al., 2006; Koski et al., 2009). For example, aerial surveys conducted by observers on board light aircraft (hereafter ‘occupied aerial surveys’) have been used to monitor populations of marine megafauna species such as dugongs and sea turtles (Marsh et al., 2004; Sobtzick et al., 2017), elasmobranchs (e.g., review by Kiszka and Heithaus, 2018), and cetaceans (e.g., Hammond et al., 2017). The limitations associated with occupied surveys include (1) the inaccuracy in the flight path data and imprecision in the flight telemetry data (e.g., pitch, yaw, and roll of the aircraft) required to calculate the surveyed area and the position of a sighted animal, means this technique is not appropriate for surveys at the local spatial scale (10s km2) (i.e., it is difficult to fly occupied aircraft along flight paths with the precision needed at a small spatial scale), (2) the need for a high level of expertise in the operational phase (i.e., highly certified aircraft pilot and experienced observers), (3) running costs, which prohibit surveys in many situations, and don’t allow for high intensity and/or repeated surveys of an area, (4) pilot and passenger safety (Wiegmann and Taneja, 2003), and (5) limited to no use in remote locations where there is no access to a runway or fuel (Watts et al., 2010).
Unoccupied aerial vehicles and aerial imagery processing techniques offer the opportunity to overcome these limitations because (1) they can provide sufficient accuracy and precision in the data collected to support fine scale surveys of small areas, (2) off-the-shelf small UAVs require a relatively low level of expertise during the data collection phase compared to occupied surveys, (3) the relatively low costs of operating UAVs and the precision of flight parameters offer the possibility of conducting surveys in areas not previously surveyed, as well as intensive and repetitive surveys at little or no extra cost, (4) UAVs can be operated in a wide range of locations (e.g., challenging terrains, remote areas) and environmental conditions (e.g., wind regimes and ambient temperature) while virtually eliminating human risk (people have died during wildlife surveys: see review by Hodgson et al., 2013), and reducing carbon emissions and wildlife disturbance through reduced noise compared to conventional methods such as vessel or occupied aerial surveys (Hodgson et al., 2013; Mulero-Pázmány et al., 2017), and (5) using UAVs to survey wildlife offers the increased ability to standardize survey techniques, as most aspects of the survey methodology and data processing have the potential to be automated.
Nonetheless, transitioning from occupied to UAV surveys and the subsequent change to collecting aerial images rather than human observations requires a re-think of the traditional methodology used in aerial surveys (Linchant et al., 2015; Hodgson et al., 2017; Baxter and Hamilton, 2018). Essential first steps in this transition include gaining an understanding of how detections from traditional occupied survey platforms compare to aerial images captured from either occupied or unoccupied platforms (e.g., Bröker et al., 2019; Garcia-Garin et al., 2020), and assessing the probability of detecting animals using UAVs (e.g., Hodgson et al., 2017). These fields of research have advanced over the recent years (see Colefax et al., 2018 for a recent review on this topic, and Doukari et al., 2019 for an example of recent published protocols for mapping coastal areas) and it is expected that research will gradually move from proof-of-concept studies to focus on hypothesis testing and scientific inference based on UAV-collected data (Barnas et al., 2020). For this to be achieved there is a need to develop UAV-adapted wildlife survey methods – from the survey design through to the data analysis – that consider (1) the advantages and limitation of this new technology (e.g., flight and sensor capabilities), (2) regulatory constraints in the use of UAVs (i.e., aviation licensing and operation regulations), and (3) the mobility of the animals and the associated spatial scale of interest.
Our aim was to (1) investigate how to best adapt the use of small multi-rotor UAVs in the context of wildlife surveys under flight range limitations set by aviation authority regulations, and (2) apply a spatial modeling approach to imagery data to estimate the density distribution of the species of interest. Small multi-rotor UAVs have all the advantages inherent to any other UAV systems described above, but with the added benefits of their (1) small size and vertical take-off landing capabilities, which makes them particularly easy to transport and to operate (e.g., multirotor UAVs can typically be launched and retrieved manually in very confined spaces), and (2) ease of use and low cost relative to other types and/or larger UAVs. One of the main limitations of multirotor UAVs is their relatively short flight durations of typically 12–40 min (Colefax et al., 2018). A number of test-of-concept studies have evaluated the potential of small UAVs to detect and survey marine megafauna at the local spatial scale in sharks and rays (Hensel et al., 2018; Kiszka and Heithaus, 2018), marine turtles (Sykora-Bodie et al., 2017). But there has been limited research on finding an optimized survey design (i.e., for particular research questions) for these small aircrafts under strict aviation regulations. Finally, despite the wide use of line transect methods in wildlife aerial surveying (Fleming and Tracey, 2008), to our knowledge exploration of how these methods can be applied to aerial imagery data for spatial modeling and abundance estimation have been rarely published (although see Rexstad et al., 2012).
The present study focused on the dugong (Dugong dugon), a coastal seagrass specialist listed as Vulnerable to extinction on the IUCN Red List at a global scale (Marsh and Sobtzick, 2019). The dugong range spans the coastal and island waters of 46 countries, over 90% of which are developing or least developed countries with limited research capacity (Marsh et al., 2011). In many parts of its range (East Africa, India, South and most of South East Asia) the dugong is Critically Endangered, and its status is unknown in half of its range due to a lack of information on its distribution, abundance, and mortality rates and causes (Marsh and Sobtzick, 2019). The Dugong Memorandum of Understanding on the Conservation and Management of Dugongs and their Seagrass Habitats throughout their Range (Dugong MoU) under the United Nations Environment Program (UNEP) Convention on Migratory Species (CMS) has highlighted the need to (1) develop new participatory methods to collect information to help fast-track the conservation of dugongs and seagrasses, and (2) for those methods to be easily transferable to local communities to empower them in taking ownership over the conservation of their local resources (Donna Kwan pers. comm.).
Occupied aerial surveys of dugongs have been successful in providing information on the distribution and abundance of dugongs over large spatial-scales in some 20 countries within the species’ range (see Marsh et al., 2011 for review; Hines et al., 2012). However, in many places within the dugong range, accessing an occupied-aircraft can be difficult and in remote places the conditions and hence safety of those aircrafts is questionable. As a result using marine vessels combined with small UAVs are an attractive alternative. Occupied aerial surveys have also been used to conduct local-scale dugong surveys to gain some insights on the distribution and habitat use of the species in places like small bays and with the view of informing conservation planning at those scales. However, the accuracy of occupied survey data is too coarse to make robust inferences on the fine-scale habitat use of dugongs (e.g., Cleguer, 2015). In recent years, research and conservation practitioners have invested in small UAV systems and attempted to conduct local trial surveys but all have emphasized the need for an established standardized UAV survey method for improved conservation outcomes1.
Our research offers a novel method for conducting aerial surveys of marine megafauna using small multi-rotor UAVs in the context of strict civil aviation regulations. Our approach features standardized grid sampling, flight planning, data collection and processing procedures. Finally, our approach to analyzing our data was adapted to our survey design and the nature of imagery data, to create spatially explicit models of dugong density across the survey area, as well as abundance estimates. We believe that our method is applicable to a range of wildlife species and spatial scales.
Materials and Methods
Project Overview
This UAV survey method was developed for the remote waters of Exmouth Gulf in the Pilbara, Western Australia. The study was part of a larger project with the aim of gaining an understanding of the distribution and movement patterns of dugongs in response to available resources and linking seagrass habitat condition to its use by dugongs. During our UAV surveys we collected still images of the sea surface to detect dugongs. In this paper we follow the standardized protocol for reporting the use of UAVs in wildlife research described by Barnas et al. (2020).
Study Sites
Aerial surveys were conducted in Exmouth Gulf in north-western Australia (Figures 1A,B) in May and November 2018 and June 2019. Exmouth Gulf is a wide and semi-enclosed embayment, which covers an area of approximately 4,000 km2, encompassing a diversity of marine habitats which are vital in supporting several populations of marine mammals. The entire Gulf and surrounding areas including the Ningaloo reef have recently been proposed to be listed as an “Important Marine Mammal Area” because of the vital role these regions play in supporting threatened iconic marine mammal species (IUCN Marine Mammal Protected Areas Task Force, 2020). Large-scale occupied aerial surveys of dugongs between 1989 and 2018 consistently identify the nearshore eastern waters of the Gulf as critical feeding and nursing habitat (Preen et al., 1997; Prince, 2001; Hodgson, 2007; Bayliss et al., 2018). Our study area was located in one of the two dugong high density areas identified during those past large-scale occupied aerial surveys.
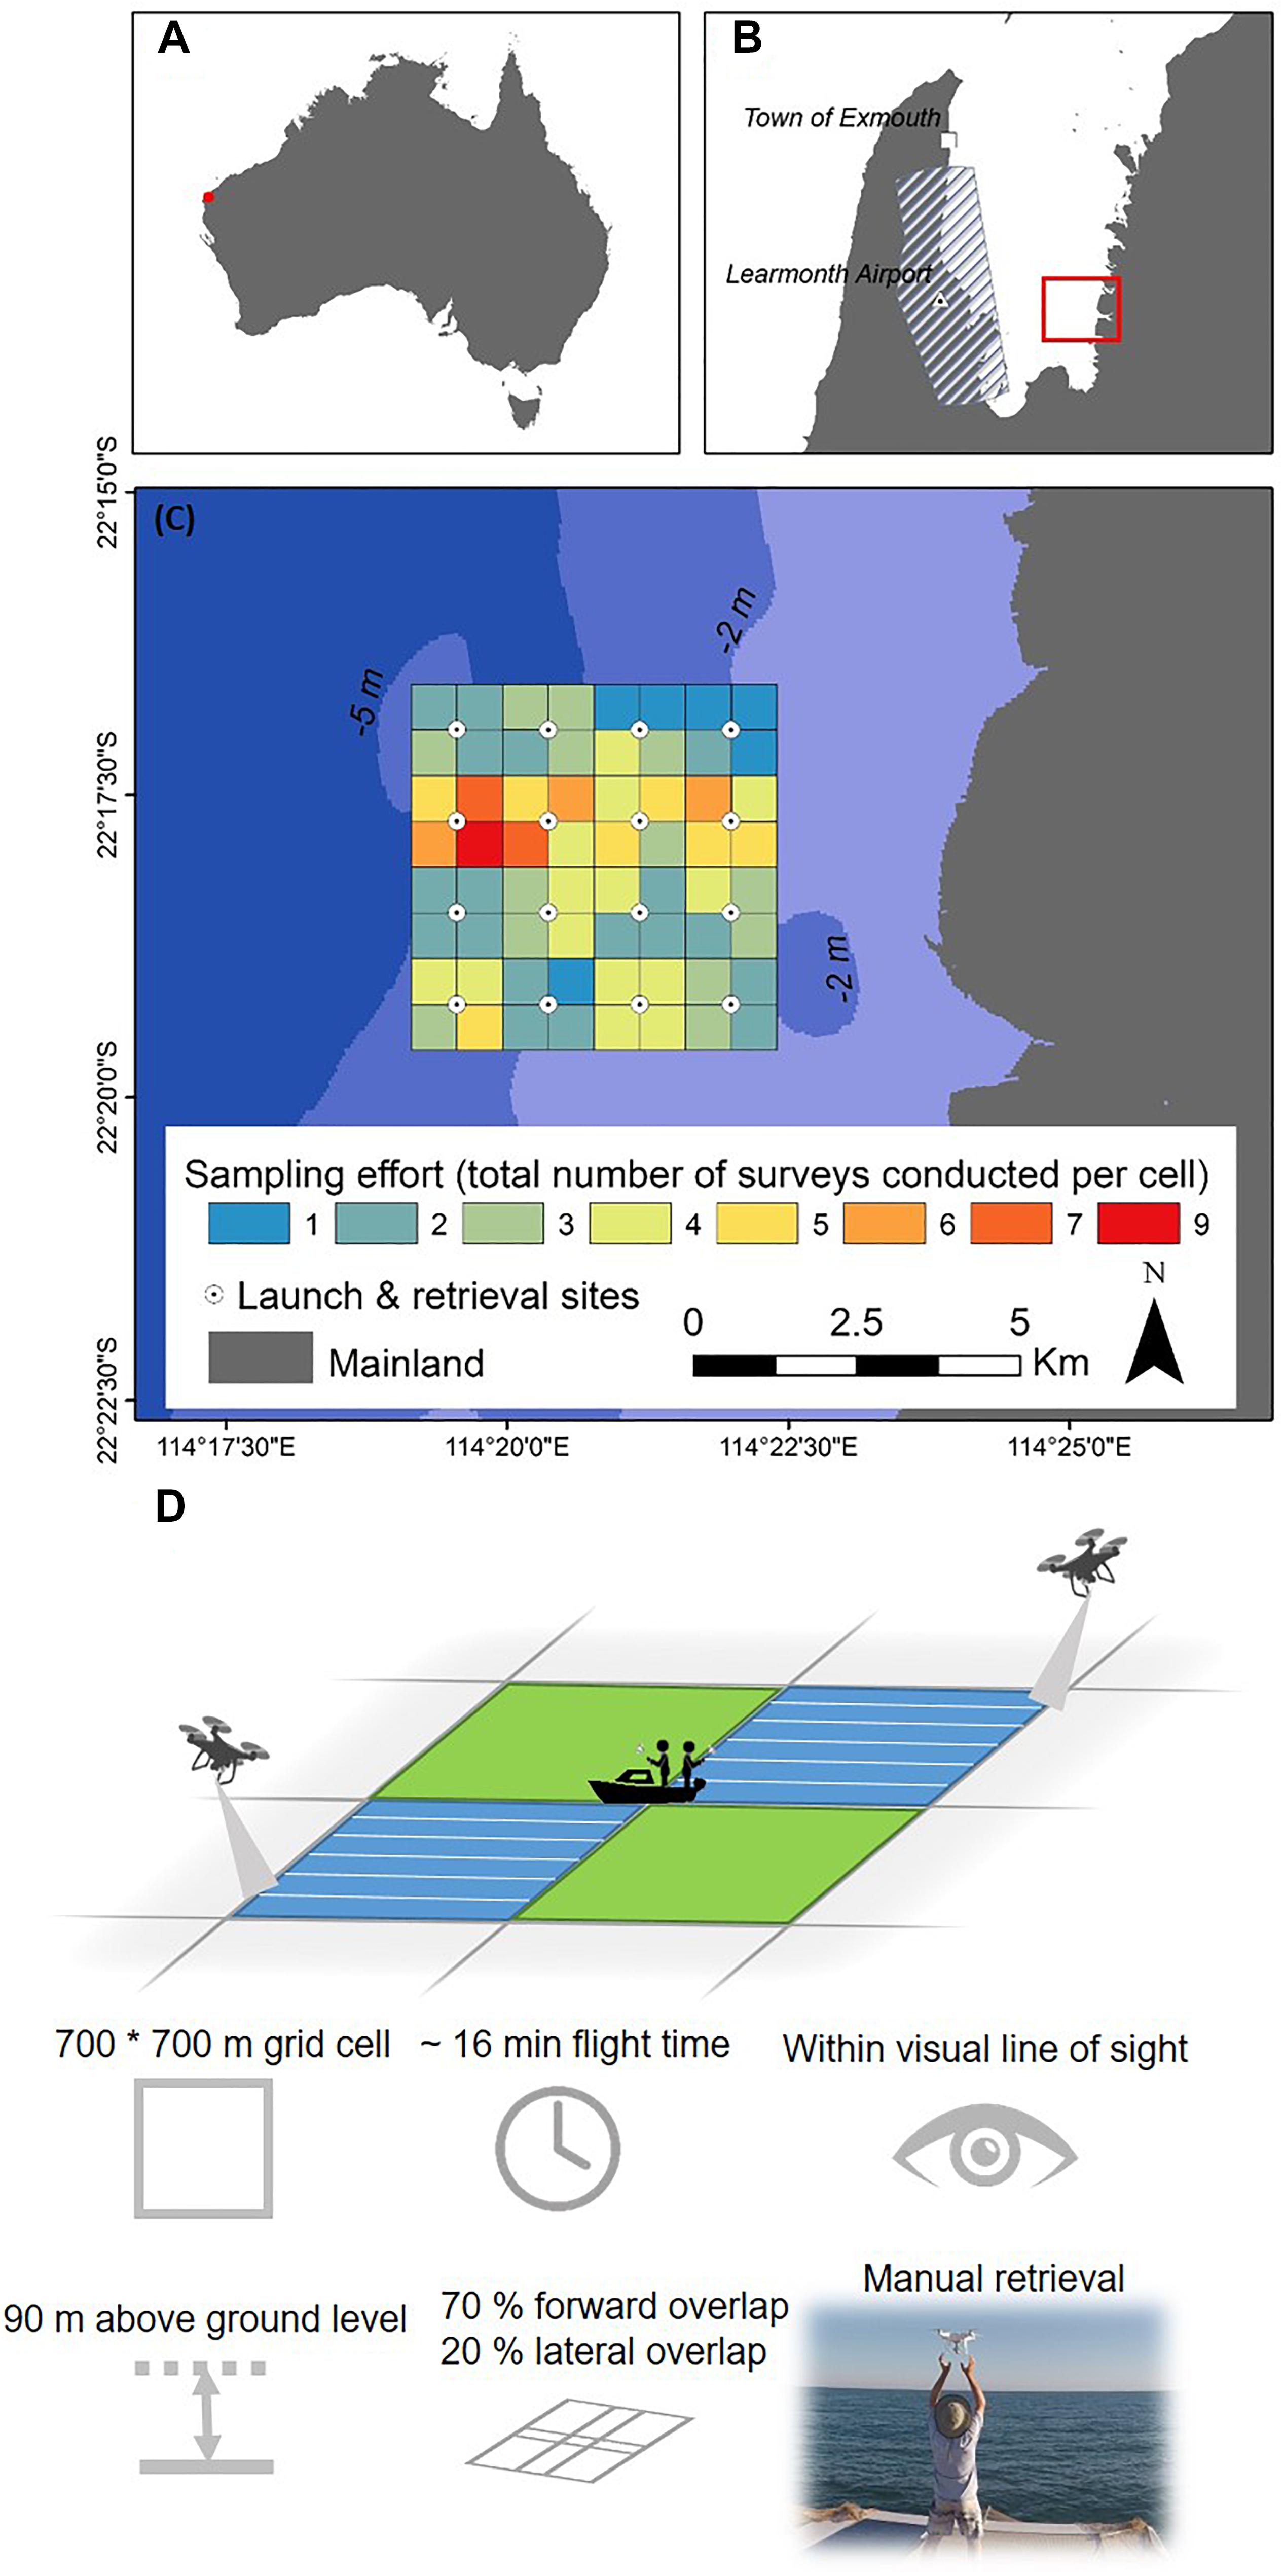
Figure 1. (A,B) Study site location (in red; hashed polygon represents controlled air space); (C) survey grid and sampling effort (the blue shaded layer represents the bathymetry); (D) diagrammatic representation of a grid survey operation and flight parameters, the green and blue cells can all be surveyed from the same launch and retrieve location (the vessel location); in this scenario the blue cells are surveyed simultaneously by using two UAVs.
UAV System, Survey Design and Operation Details
Platform Specification
Survey flights were conducted using the Phantom 4 Pro v1 systems (hereafter ‘P4Pro’) manufactured by DJI2. The P4Pro is relatively low cost (∼2,000 USD start price as of 2017), user-friendly, multirotor aircraft widely used in both recreational and commercial/research applications. Three aircrafts were necessary for this study: two primary systems and one backup. Technical specifications of the P4Pro are detailed in Table 1.
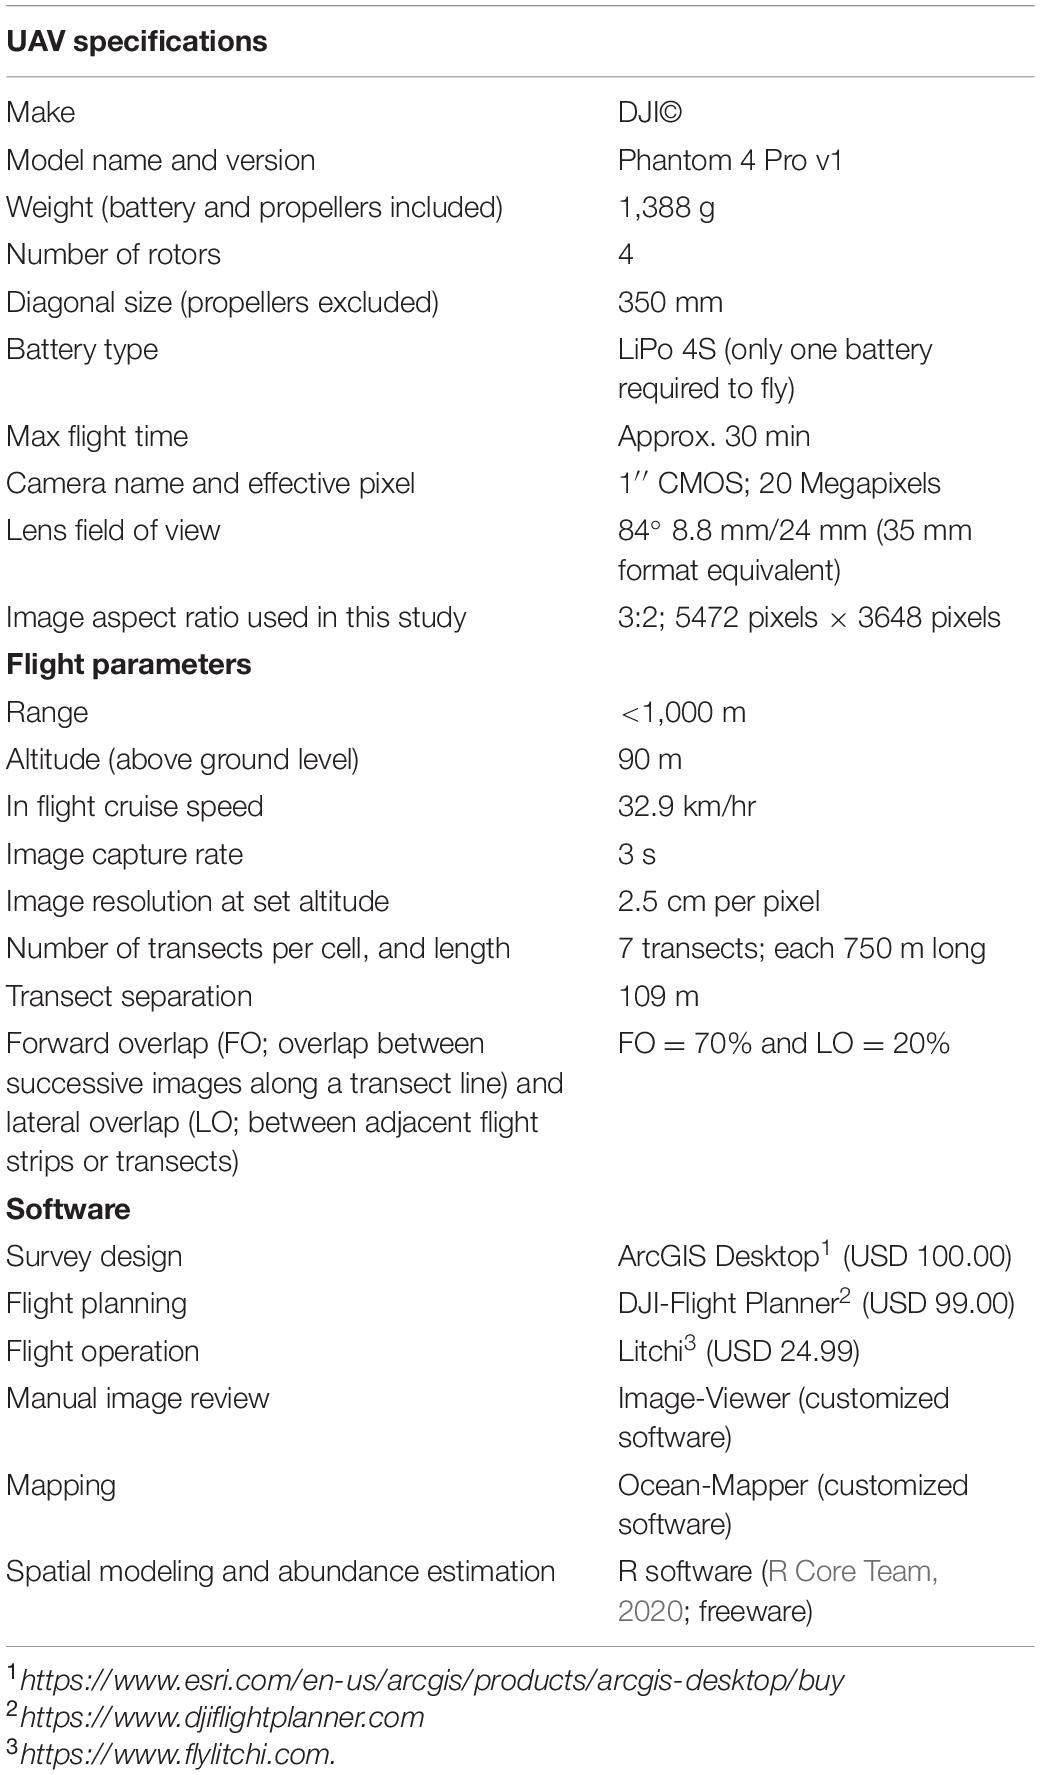
Table 1. Drone and software specifications, and flight parameters.
Survey Design
Our aim was to conduct aerial surveys to assess the distribution and abundance of dugongs over an area as large as possible (albeit limited by our vessel operations) and as rapidly as possible while considering several limitations. Our survey operations were undertaken from a live-aboard vessel due to the remote nature of the study site (i.e., there was no land access to the site). The vessel was shared with seagrass scientists who were conducting in situ benthos sampling work in our study area using the vessel’s small tender. Thus for safety reasons the larger vessel (our operation platform) had to remain within 2 NM of the tender, thereby limiting our take-off and landing boundaries to this radius distance. The area within this radius became our study area (size = 31.36 km2; Figure 1).
We used a grid sampling approach inspired by large-scale occupied aerial surveys of manatees in Florida conducted by Martin et al. (2015), whereby a grid of cells is overlaid on the survey area and cells are randomly selected and surveyed. We assumed equal probability of dugong sightings across the survey area as the area was within the 15 m depth contour, well within the dugong’s suitable depth range (Marsh et al., 2011). The survey area was divided into 64 non-overlapping survey cells of identical shape (square) and size (edge size = 0.7 km, area size = 0.49 km2) using the ‘fishnet’ tool in ArcGIS (version 10.4.1, Esri® 2018; Table 1). Each survey cell was subsequently saved as a Keyhole Markup Language file (hereafter ‘KML’ file). The constraints considered in the design of the survey cells were that we wanted to (1) survey each cell with complete coverage (i.e., the entire surface area of the cell was covered in the imagery) within one P4Pro flight while taking into account the flight capabilities of this UAV, (2) ensure our operations fell into the ‘excluded category’ (i.e., operating a sub 2 kg UAV for commercial purposes) and within the ‘standard operating conditions’ set by the Australian Civil Aviation Authority with one of the rules being to operate within visual line of sight3 (although we would recommend to operators to conduct their own assessment of what line of sight might represent in their specific circumstances), and (3) limit flight time to less than 70% of the UAV battery charge (i.e., maximum 20 min flight time), to ensure a sufficient battery charge buffer for safe landing. The grid was randomly placed within the area of interest and 16 sampler points (i.e., the UAV take-off and landing position) were placed over the grid, each one being located in corner of four cells within the grid.
Given the novelty of our survey approach, one of our objectives was to explore what sampling intensity we could achieve at the scale of the entire study area (i.e., the range in the number of cells we could survey in a day, over the duration of the survey period) under a range of environmental variables (e.g., different wind regimes, cloud cover, etc.), and logistical constraints (e.g., we had no prior knowledge on the time required to commute between survey cells using a large vessel). Furthermore, there was no information available on the fine-scale distribution, movement behavior (hence random movement was assumed in this study, particularly within a day, but also across the entire survey period) or the approximate number of dugongs present within the area (except for the coarse dugong distribution data collected during past large-scale surveys conducted in Exmouth Gulf; Bayliss et al., 2018). Under these circumstances, we randomly selected which cells of the grid (and their chronological order) would be surveyed each day. We chose to sample with replacement between days (i.e., sets of four cells that were surveyed on one day could be selected for sampling the next day). The decision for sampling with replacement was based on the fact that the entire survey area was small, relative to the broader regional dugong habitat area, and animals may move substantially from 1 day to the next (e.g., Sheppard et al., 2006; Cleguer et al., 2020b).
Launch and Retrieval
We anchored our vessel (launch and retrieval site) at the meeting point of four adjacent cells. This allowed us to survey each of those four cells from one location whilst remaining within visual line of sight of the UAV which minimized commute time to the start of each survey cell, and provided the opportunity to survey two cells simultaneously using two UAVs (Figures 1C,D). It is important to consider the potential for marine fauna to respond to the vessel movements by either approaching or moving away and thereby biasing survey results. We always surveyed with our engine off and with our boat at anchor, and allowed a time lag of 10 min before UAV operations began. Dugongs display minimal response to slow moving vessels (Hodgson, 2007) but other species may be more sensitive.
Flights were conducted autonomously until the UAV returned over the anchored vessel after a completed survey. No specialized launching equipment was required. The pilot in command took manual control only to land the aircraft on the vessel’s deck or into an assistant’s hands (our flight procedure library is provided in Supplementary Material 1). Flights were conducted at least 1 h after sunrise and 1 h before sunset to avoid collecting images with low light intensity. We avoided surveying when glare and wind were high (midday and Beaufort sea state ≥ 3). Hodgson et al. (2017) found that sea state had no significant effect on sighting rates, suggesting that UAV surveys could be conducted in a wider range of wind conditions than traditional occupied surveys. Thus, we set the maximum wind limit of UAV operations to 30 km/hr (above the maximum wind conditions generally set at ∼18 km/hr in occupied aerial surveys) as beyond this limit, we could visually observe the UAV stability being affected. Environmental conditions, including average wind (in km/hr) and cloud cover (in octas), were recorded at the start of each flight (Supplementary Material 1).
Flight Planning and Method of Operation
The KML of each survey cell was imported into the flight planning software ‘DJI-Flight Planner’ (©AeroScientific; Table 1 and Supplementary Material 2) in order to enter our flight parameters, which, according to our design, were the same for all cells. Still image capture was favored over video recording to maximize image quality and prevent image motion from affecting image clarity, and hence, animal detectability. The camera, was installed on a gimbal to reduce inflight vibrations and it was always positioned at a 90° angle (nadir, facing straight down).
The survey altitude was set at 90 m above ground level which provided the most adequate area coverage/image resolution ratio using the P4Pro. At this altitude, the image covered a surface area of 136 m × 90 m for an on-ground image resolution (also commonly named ground sampling distance or ‘GSD’) of 2.5 cm per pixel, well within the resolution proven sufficient to detect dugongs (Hodgson et al., 2013). We chose this conservative approach to ensure that we would collect images of good quality in the face of other potential factors affecting image quality (e.g., lighting conditions, UAV motion induced by environmental effects). The forward image overlap (between successive images) was set at 70% to maximize the chance of detecting animals that are masked by sun glitter and/or identifying animals initially captured at awkward body angles (Hodgson et al., 2013, Figure 2). After several trial flights in a range of wind conditions (i.e., from no wind to constant winds of 30 km/hr with gusts of up to 35 km/hr) we determined that a 20% lateral image overlap (between adjacent flight strips or transects) was a conservative value to ensure full coverage even in windy conditions that pushed the UAV slightly off-course. Choosing transect angle is difficult as there are many considerations, including sun angle. On long survey days we surveyed the entire day, so the sun angle and sun glitter position and footprint varied across the day. The orientation of our transects were set in respect to wind direction, to ensure that the prevailing winds (coming from the south-west) would come in an approximately perpendicular angle to the transects, and hence reduce the effect of wind on flight speed (and hence on image quality for example). All steps of the flight planning process in DJI-Flight Planner are detailed in Supplementary Material 2). Finally, we used a mobile device (Ipad mini v2, Apple Inc.) connected to the P4Pro’s Radio-Controller to operate the UAV via the ‘Litchi’ flight assistance application (©VC Technology Ltd.) (Table 1; details of the pre-flight settings are provided in Supplementary Material 3).
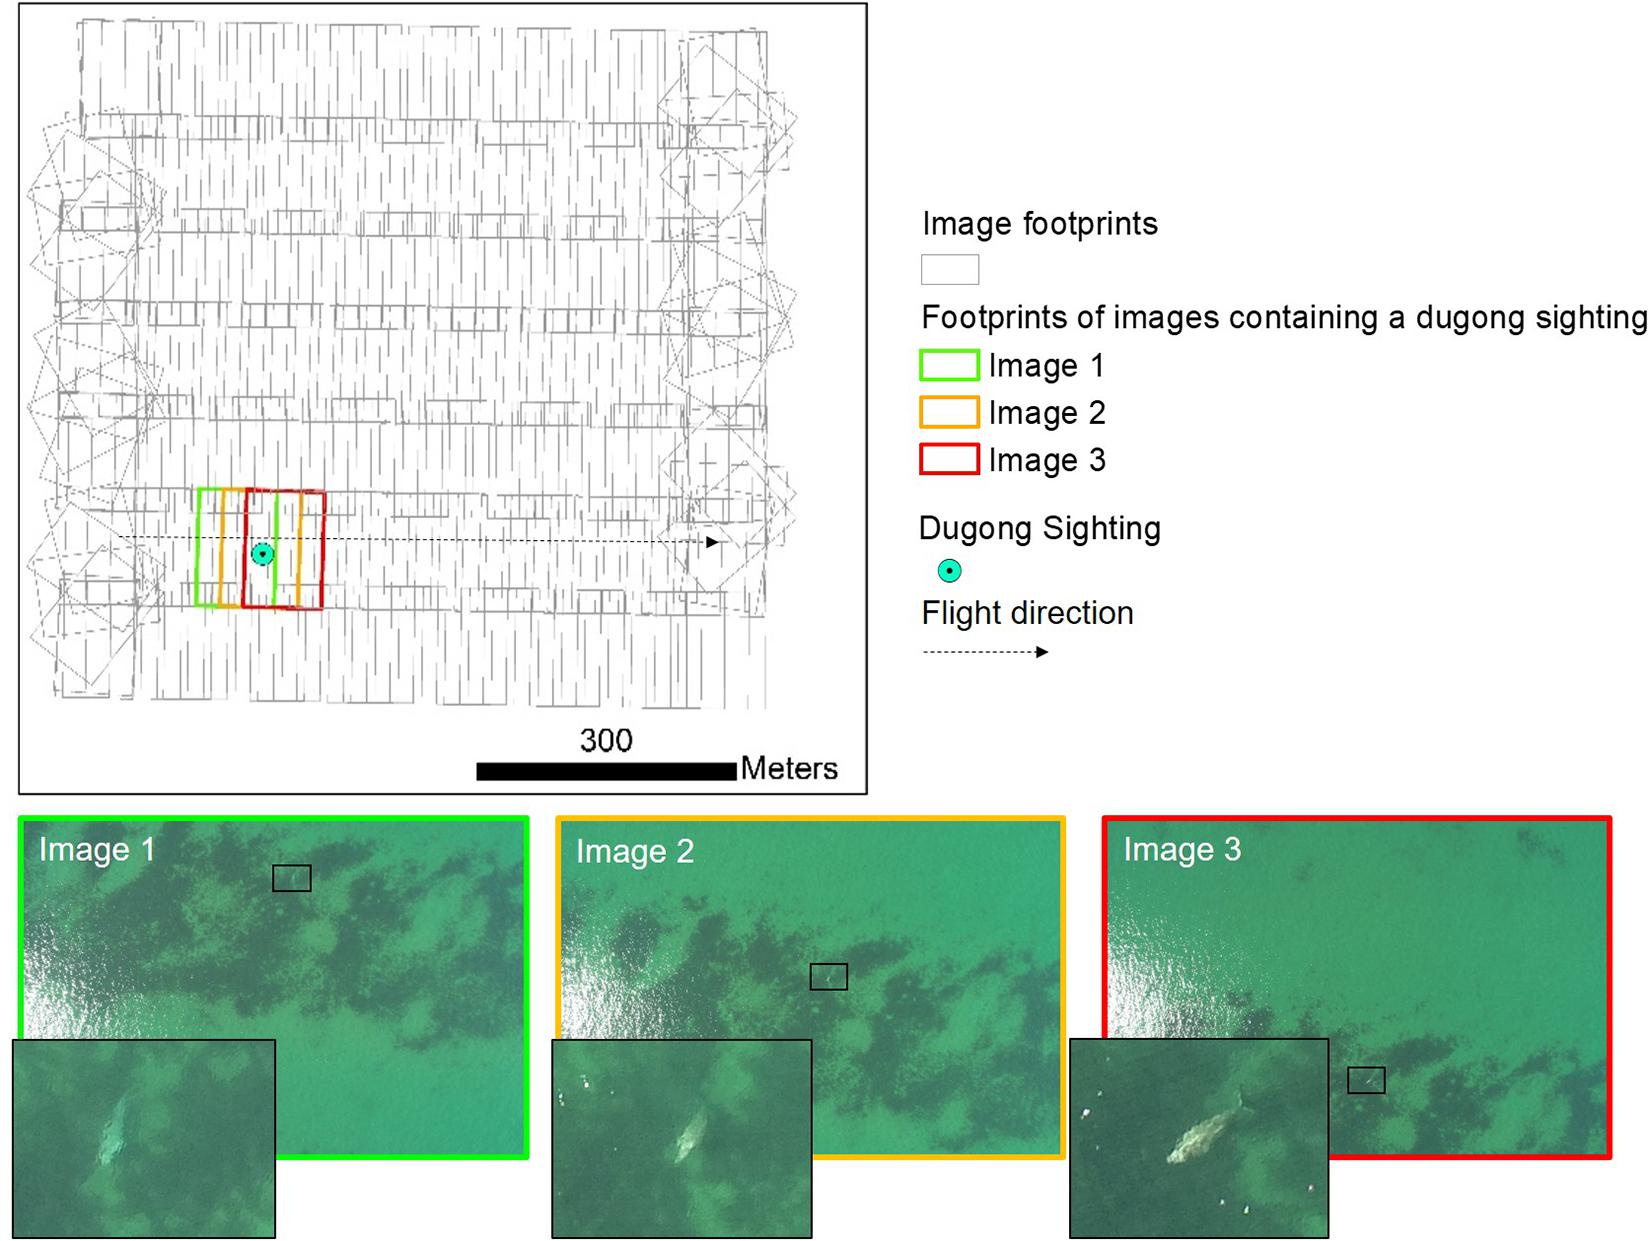
Figure 2. Example of a series of three consecutive images taken at 3 s intervals along a transect line. Each image contains the same individual dugong but its identification becomes certain only in the third image.
Each captured image was tagged in real-time and information such as image capture time (hh:mm:ss local time), flight altitude (meters above ground level), image location (GNSS coordinates with average on-ground error of ∼1 m), and the three-dimensional rotation data from the aircraft (roll, pitch, and yaw, in degrees) at the time of image capture (to the nearest second) were assigned to each image and stored in the ‘Exchangeable Image File Format’ (EXIF) data. All images were automatically stored on the camera’s memory card (1.9 GB of imagery were typically collected in a single flight and stored onto a 64 GB mini SD card) and downloaded post flight.
Image Processing
Review
All the images collected during the surveys were manually reviewed post flight by trained observers using a customized image review program written in Python 3.7 (Figure 3A) which standardizes the manual processing method. The observer manually draws a box around each individual animal sighting and the software records the location as pixel x-, y-coordinates of the top left and bottom right corner of the box. A pop-up window allows the observer to enter information for each individual sighting [taxa, single/mother/calf, certainty of taxa identification (a binary category: certain or not certain), the animal’s position in the water column, whether the animal is a resight due to the forward overlap in the images (some animals were visible across several consecutive images; detecting a resight was eased by the low number of animals and group of animals seen in consecutive images and the short time laps between image capture), and the environment within the image (i.e., glare, water visibility, and sea state; Hodgson et al., 2013)]. To reduce the risk of double counts due to the side overlap in the images we identified dugong sightings made in images that were overlapping with each other from one transect to the other and we removed the sightings made in one of the two adjacent transect for those images. All entered data per flight are saved in a text file which is subsequently used for mapping and analysis.
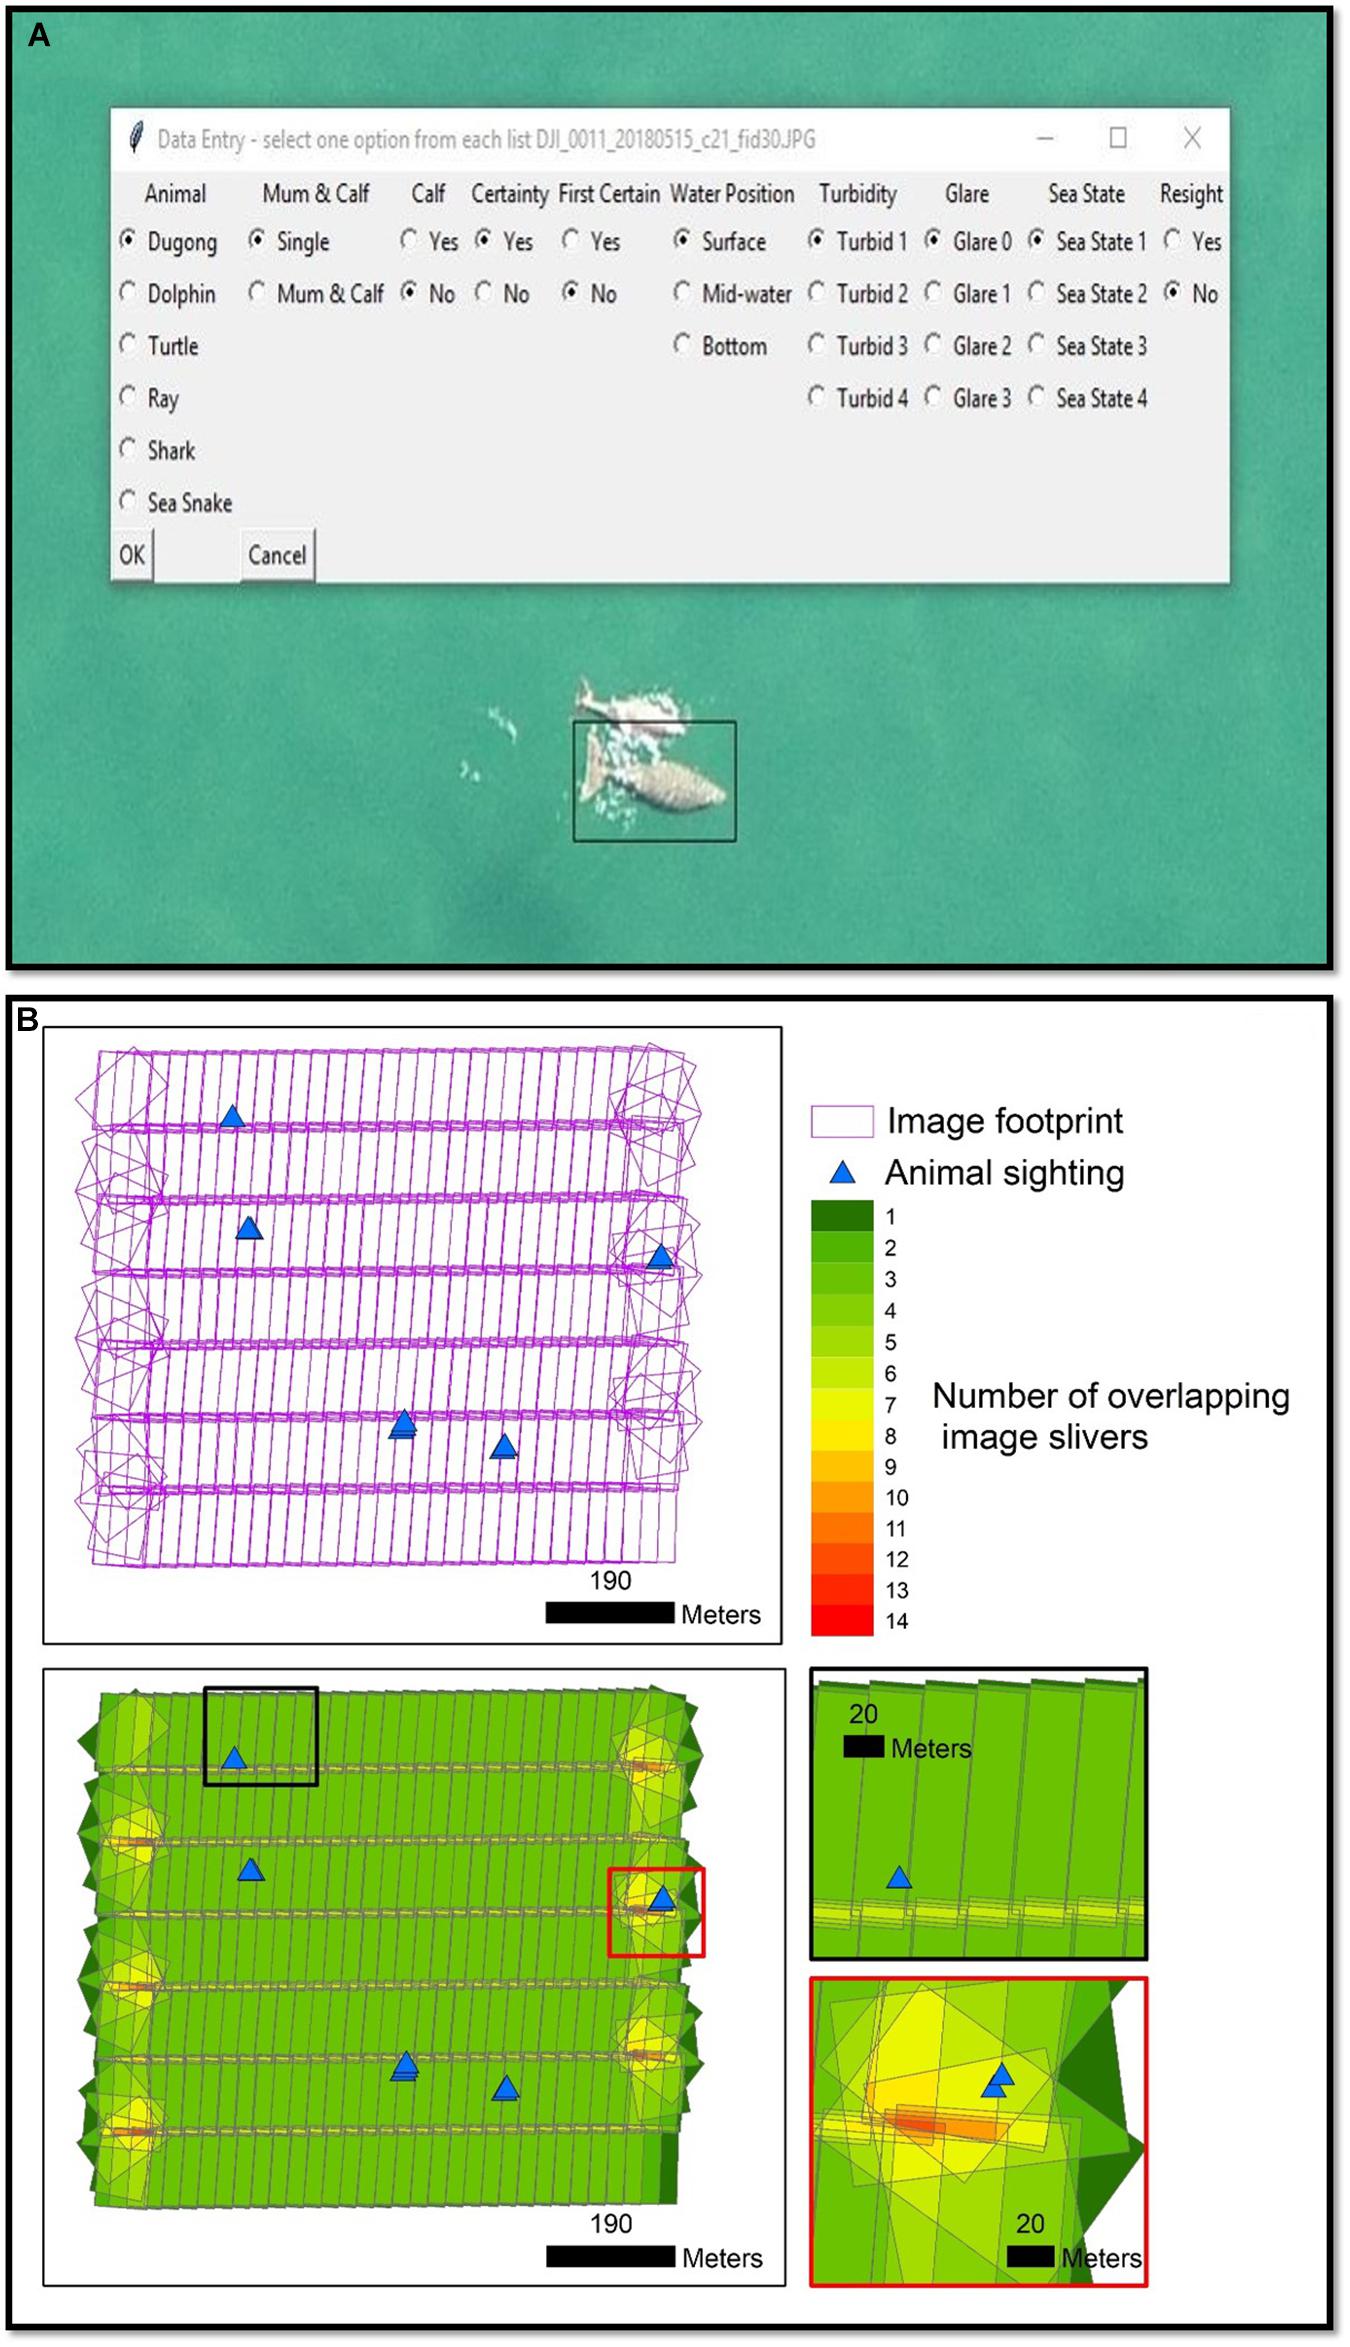
Figure 3. Manual image review (A) and mapping (B) process. The term “animal sighting” here refers to a single individual sighting (e.g., a single dugong, or a mum or calf in a mum-calf group).
Each image was searched by one observer and, in the event of dugongs being detected, the identification and environment condition assessment was verified by the lead author, who had the final say in confirming sightings’ certainty. The time spent searching each image varied, depending on the complexity of the image, which was affected by glare (sun glitter), the benthic substrate, water depth, and sea conditions. We have not recorded image review time but estimate that it took an average of 15 s to review an image. Observers generally searched the image left to right and top to bottom, zooming in on each quarter of the image for closer inspection if fauna were detected.
Mapping and Filtering
The outline of all collected images (image footprints) and the position of the dugong sightings was mapped using customized software, OceanMapper (©Martin Wieser; Figure 3B) developed as part of this study and which is similar to the software VADAR described in Hodgson et al. (2017). OceanMapper allowed us to map the image footprints by extracting data from the EXIF associated with each image, including the global navigation satellite system (GNSS) position, altitude above ground (∼1 m horizontal and 2 m vertical accuracy) and UAV rotation (yaw, pitch and roll to ∼1° accuracy). Mean error between on-ground checkpoints and digital surface models generated using P4Pro operations was reported at 0.01 m (Rogers et al., 2020). The text files created during the image review (including pixel XY image coordinates of each individual animal) were imported to OceanMapper to georeference our sightings. OceanMapper created two shapefiles; a polygon shapefile for the image footprints, and a point shapefile for the animal sightings. These georeferenced files were then imported into ArcGIS to conduct subsequent analyses.
Only the dugong sightings qualified as ‘certain’ were retained for mapping and analyses. Individual animals resighted (counted multiple times) in successive images along each transect (i.e., within forward overlap) were removed from the dataset.
Analysis
Image Fragmentation and Area Cover Segmentation
The images were fragmented into image slivers according to their overlap with other images (Figure 3B) using the ‘feature to polygon’ and ‘spatial join’ tools in ArcGIS. Spatial coverage of the imagery data was segmented into grids based on spatial location within the broader survey area, and not on position within an individual transect (c.f., the concept of a transect segment for subsequent spatial modeling, as described by Hedley and Buckland, 2004; Miller et al., 2013). This decision was made due to the positive spatial overlap between transects, which led to transect sampling units no longer being spatially independent. Furthermore, given the speed at which transects were flown (32.9 km/h; Table 1), we assumed animals did not move substantially between areas covered by adjacent transects (a gross estimate of dugong swimming speed range from other studies is 0.5–4 km/hr; Sheppard et al., 2006; Campbell et al., 2010). As such, the survey area was gridded using the fishnet polygon tool in ArcGIS. A grid dimension of 200 m × 200 m was selected as a compromise between having enough spatial samples across the survey area to adequately parameterise a density surface model, but not allowing the grids to be so small that they represent only one or less image footprints, as that may introduce excessive spatial auto-correlation between nearby grids. An image sliver was assigned to a 200 m × 200 m grid cell if its centroid coordinate was situated within that grid cell. Where images were taken over the same patch of water, but on multiple days, slivers from different days were treated as completely separate sample units. For each grid cell, for each unique flying day, the total area covered by image slivers was calculated, along with the number of dugong individuals detected within that grid cell. The extent of the study area was truncated for the May 2018 field season so as to avoid extrapolation beyond the achieved image coverage (Figure 4).
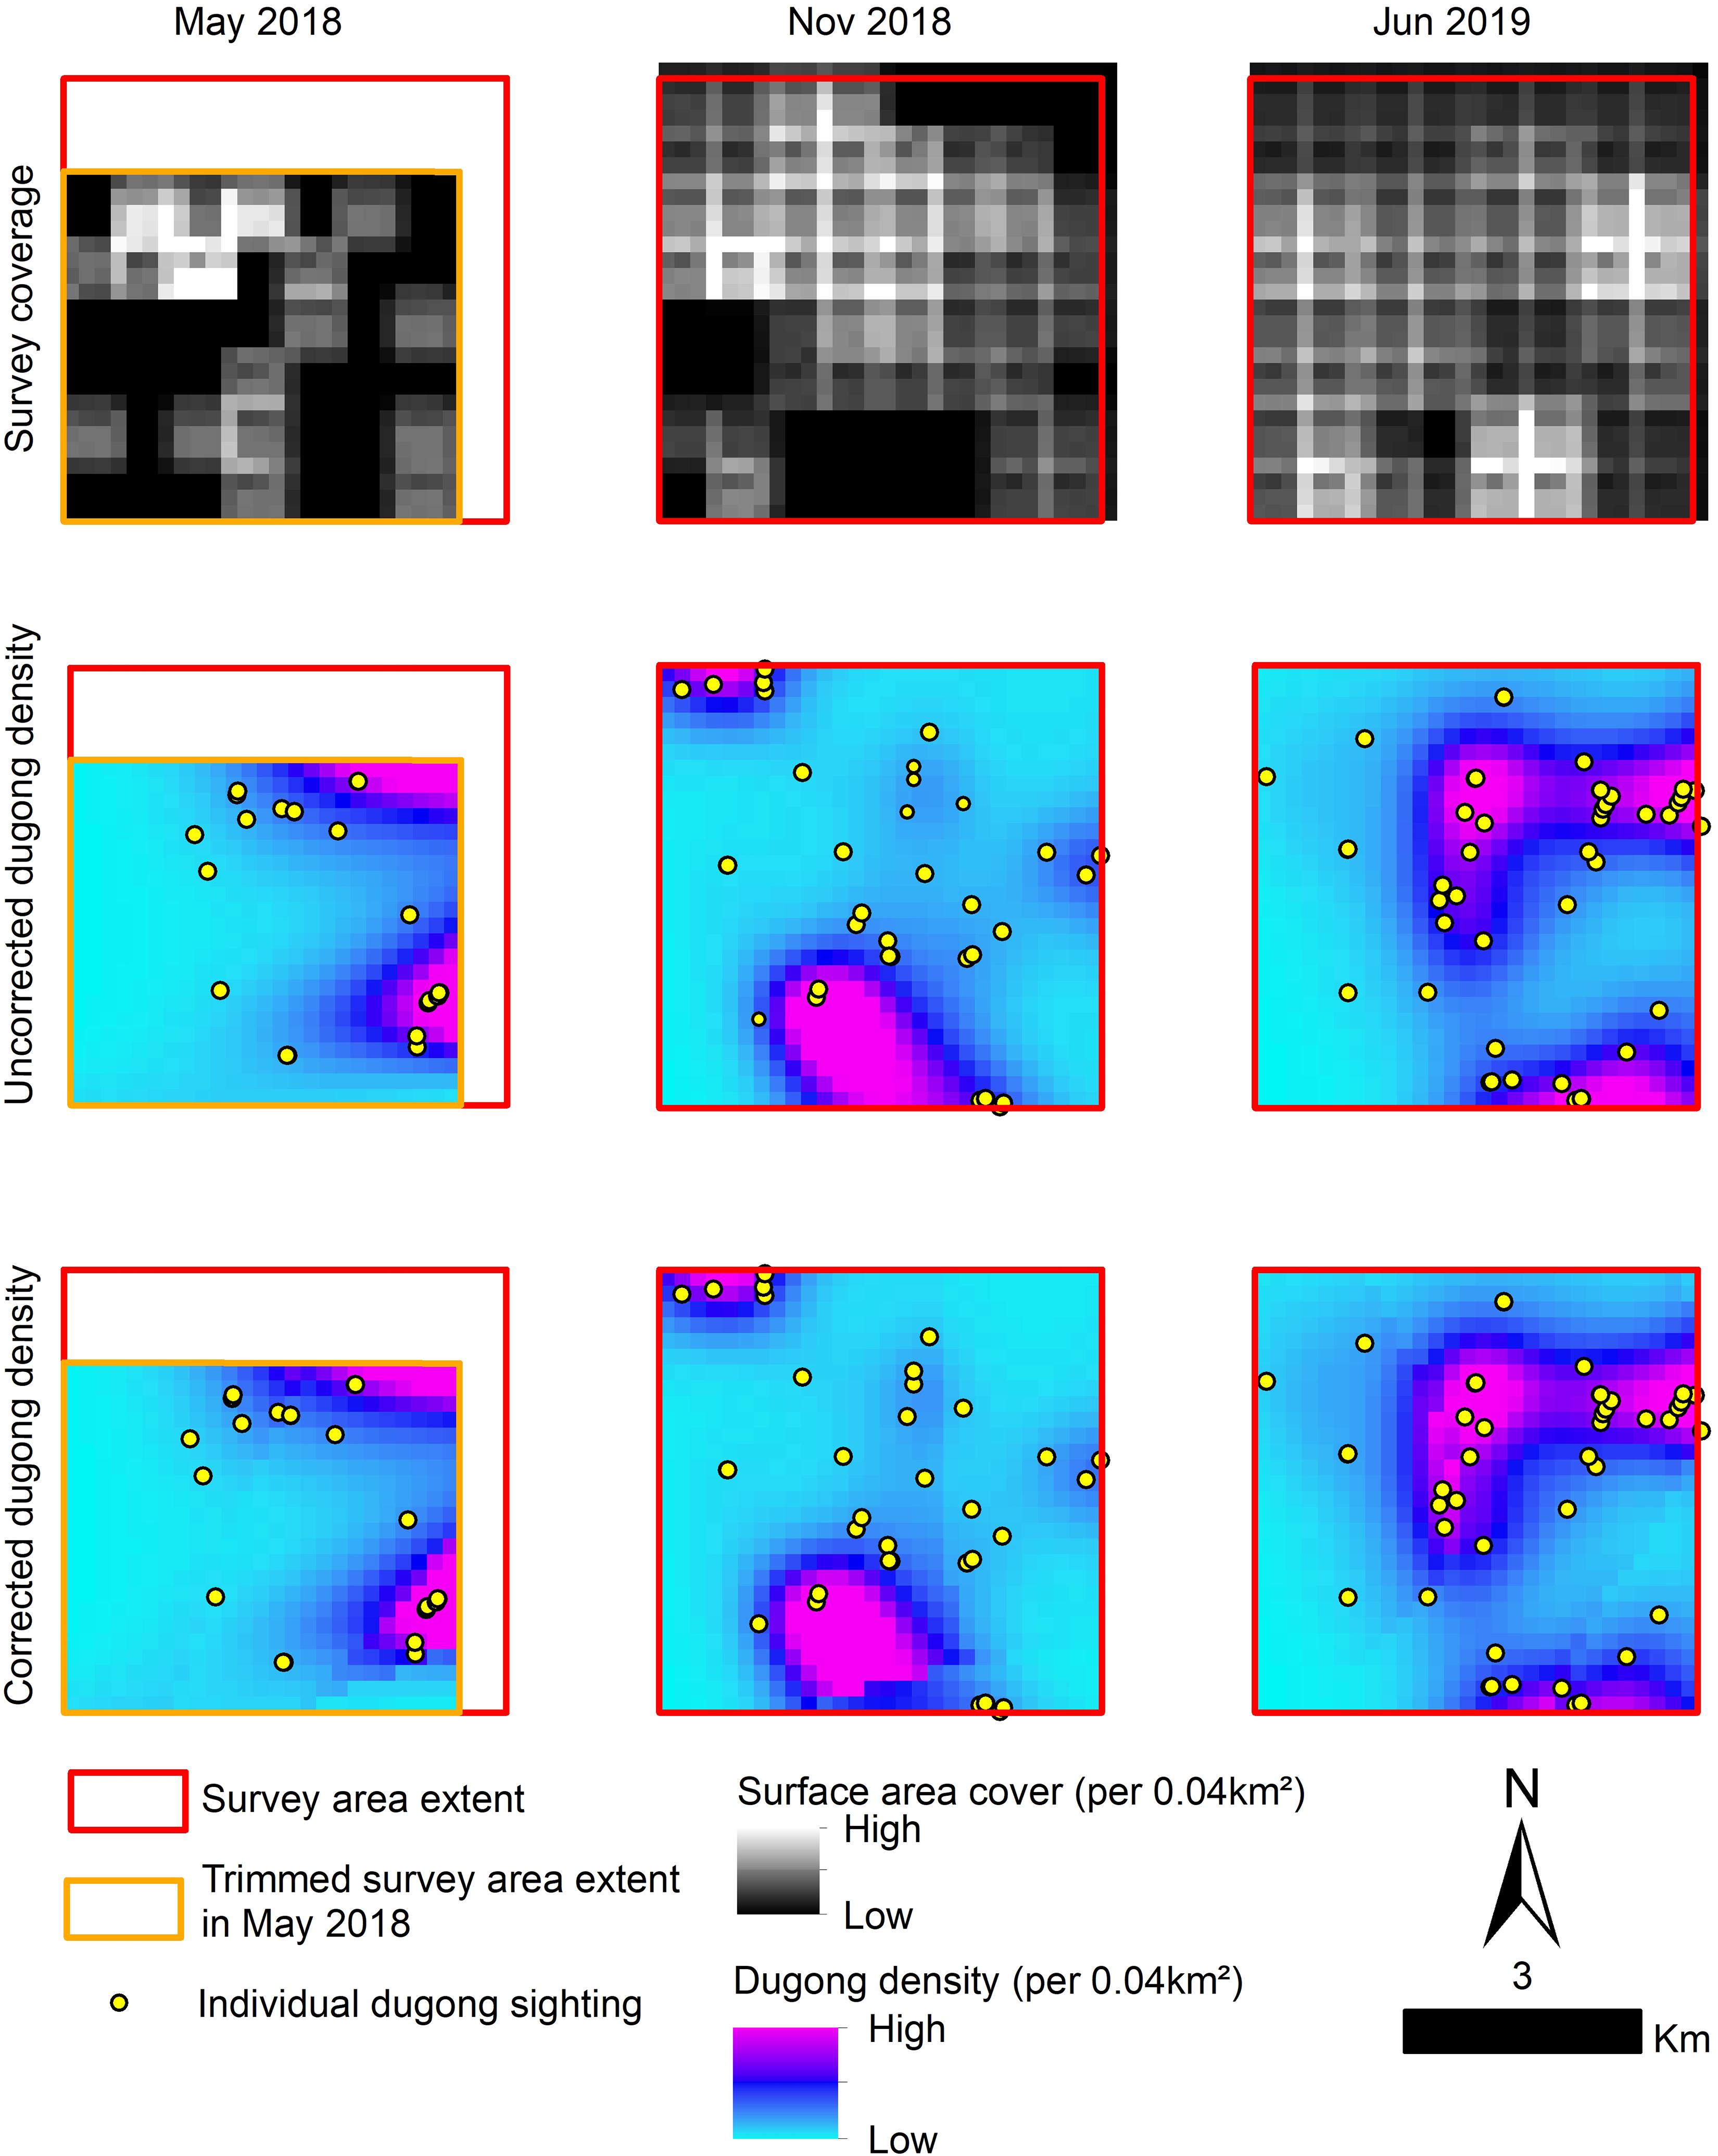
Figure 4. Raw dugong sightings overlaid with spatially explicit, uncorrected and availability corrected, dugong density surface models for each of the three field seasons.
Dugong Density Surface Modeling and Abundance Estimate
Density surface models were developed using the dsm package (Miller et al., 2013) in the R statistical software (version 4.0.2; R Core Team, 2020), which calls the mgcv package (Wood, 2017) to describe the distribution of densities of detections of dugong individuals as a function of projected space (Lambert Conformal Conic). Environmental covariates (such as bathymetry) were not used in the development of this density surface model as data to describe such covariates were defined at a spatial scale larger than the survey area. The generalized additive model (GAM) fitted a two-dimensional (isotropic) spline using projected spatial coordinates, with a Tweedie distribution (Wood, 2017). Uniform detection probability from the lens optical center out to the edge of the image was assumed, hence no distance detection function was used. The smoothness selection for GAM was undertaken using restricted maximum likelihood (REML; Wood, 2011). Dugong density estimates (not yet corrected for availability) across the survey area were produced using the density surface model with a 200 m × 200 m square prediction grid. Density surface models were fitted for each field season (i.e., May-2018, November-2018, and June-2019).
In order to correct the density estimates for availability bias (i.e., the proportion of time individuals are below the depth at which they can be seen by the observers), we used availability estimates, and associated error, provided by Pollock et al. (2006), which are specific to four different levels of water visibility (turbidity) and Beaufort sea state (reclassified to ‘optimal’ for sea states 0, 1, and 2, and ‘marginal’ for sea states 3+), as encountered during an aerial survey. Season-level estimates of visibility and reclassified Beaufort sea state estimates across the survey area were made via a multinomial GAM using the environmental covariates assessed for each image and the same spatial covariates as the density surface model; water visibility and reclassified sea state estimates were combined to derive dugong availability at each prediction point. Corrected dugong densities were estimated by dividing the uncorrected density estimates at each prediction point by the availability estimate at that point. Under the assumption that availability is independent of dugong density, the coefficient of variation (CV) from the availability estimates were combined with the CV of the density estimates via the delta method (Oehlert, 1992). An abundance estimate, and associated variance, for the survey area was obtained by summing the estimated densities across the survey area.
Results
UAV Flights
We conducted 240 flights across three survey seasons and collected a total of 50,482 images. The details of all flights and images collected are provided in Table 2. We note that one of the UAVs crashed following a system failure (cause unknown), resulting in the partial loss the system (i.e., the shell and camera gimbal had to be replaced).
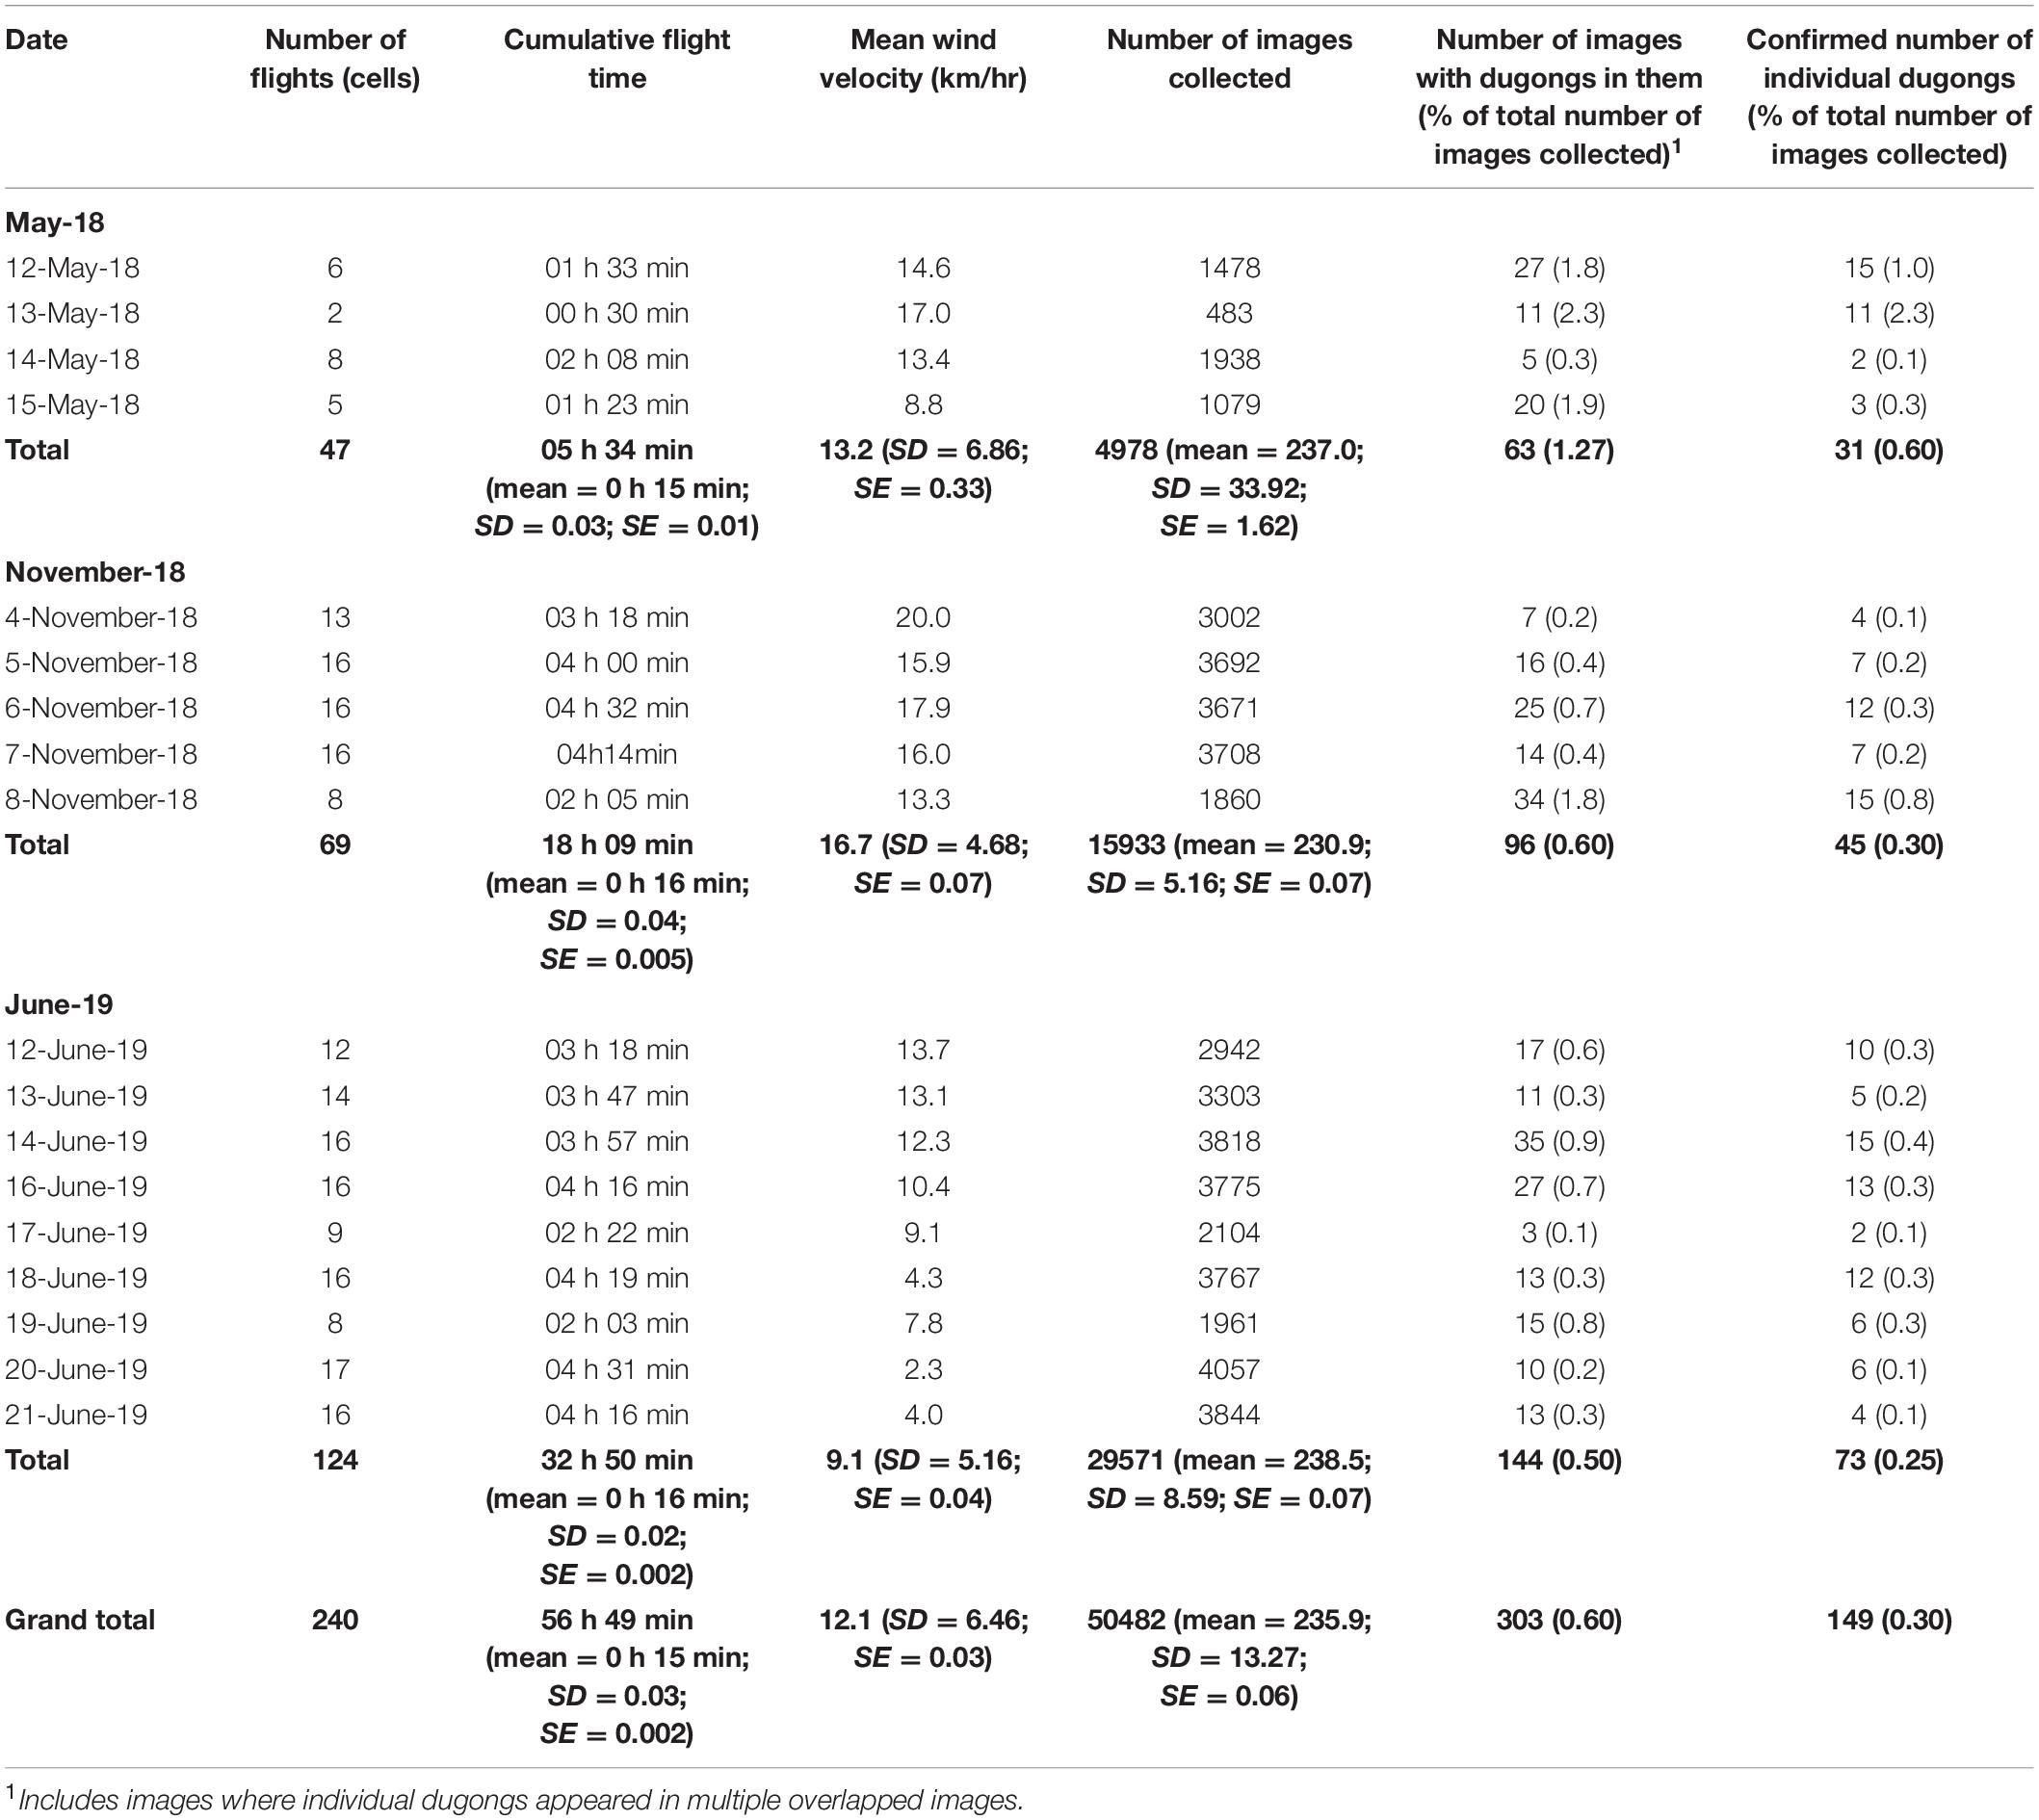
Table 2. UAV flight and image count details for all surveys conducted at the Exmouth Gulf site.
Overall (i.e., across the three survey seasons), all the cells of the survey area grid were surveyed at least once (mean = 3 times, max = 9 times, ±SE = 0.19; Figure 1C). In May 2018, one UAV was flown at a time and two to eight flights a day were conducted (mean = 5 flights, SD = 2 flights; Table 2), representing surface area coverage varying between 0.31 and 0.69 km2 per flight, and between 1.24 and 5.35 km2 per day. Operating two UAVs simultaneously in the two subsequent fieldtrips resulted in a significant increase in the number of flights conducted per day in November 2018 (mean = 14 flights, range = 8–16) and in June 2019 (mean = 14 flights, range = 8–17) and the doubling of the surface area coverage (range = 0.57–0.68 km2 per flight, and 5.35–10.59 km2 per day in November 2018; 0.59–0.69 km2 per flight, and 5.99–11.36 km2 per day in June 2019). Individual flights ranged from 5 to 23 min (mean = 15 min, SD = 1 min, ± SE = 5 s), including two flights that were aborted because the wind increased and exceeded the limits for safe operations (set at 30 km/hr). Aside from these two events wind conditions ranged from 0 to 28 km/hr (mean = 15.3 km/hr, SD = 7.4 km/hr, ±SE = 0.4 km/hr). Cloud cover varied from 0 to 8 octas, but clouds were always higher than the survey altitude (90 m above ground level) hence no image was directly obstructed by clouds. The maximum cloud cover was 6 octas and it occurred in eight consecutive flights out of 240 flights. Thus the effect of cloud cover on luminosity in the images was insignificant, it did not affect our ability to review images. UAV battery consumption ranged from 48 to 68% (mean = 52%, SD = 4.25%, ±SE = 0.29%). There was a positive correlation between battery consumption and wind strength [r(193) = 0.51, p < 0.05] but wind did not affect the number of flights conducted per day.
Animal Counts and Abundance Estimates
Across all season-level survey effort, the number of dugong sightings ranged from 31 (in May 2018) to 73 individuals (in June 2019). Dugong abundance estimates (based on corrected number of dugongs and presented in Table 3) decreased with time and ranged from a maximum of 102 dugongs (CV = 0.36) in May 2018 to a minimum of 46 dugongs (CV = 0.17) in June 2019.
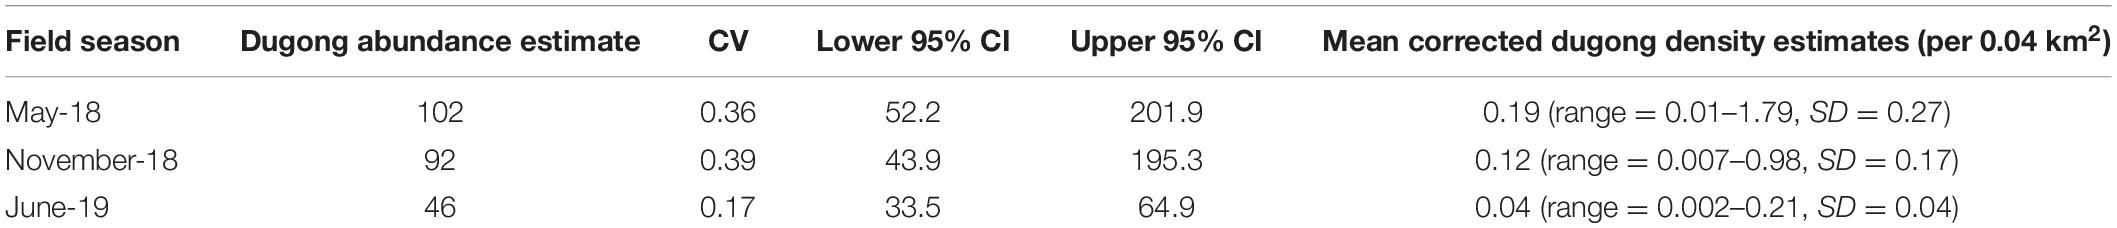
Table 3. Dugong abundance and density estimates based on corrected dugong counts (uncorrected dugong density estimates are provided in Supplementary Material 4).
Dugong Density Distribution
The density surface models suggest that dugongs occur in relatively high densities in two distinct locations across the survey seasons but that the spatial location of these density ‘hotspots’ vary temporally (Figure 4). During the cold months of the surveys (May 2018 and June 2019) dugongs appear to favor the eastern side of the surveyed area whereas during the warm season (November 2019) intensive use shifts to the west. No dugongs were detected in the south-western side of the surveyed area across all season-level surveys. Note that the extent of the survey area for the May 2018 sampling event was truncated to minimize edge effects in the models mostly due to lack of sampling in the north and north-eastern region (Figure 4). Details of the (1) coefficients of variation from the spatial part of the density models, (2) spatial GAM fits for each season-level survey effort, (3) model-fit diagnostics for each density surface models, (4) spatial autocorrelation tests, and (5) beaufort sea state and water turbidity predictions are given in Supplementary Material 4.
Discussion
We have developed a novel approach for using small, affordable UAVs to investigate the occurrence of a marine megafauna of interest, create spatially explicit models of distribution and estimate abundance and across tens of km2. By taking a grid sampling approach, coupled with the simultaneous use of two UAVs from a vessel we found an efficient way to conduct dugong aerial surveys in a remote marine environment despite visual line of sight restrictions and limitations in the flight performance of the UAV. This method proved convincing in a real-word application in terms of feasibility, ease of implementation and the achievable surface coverage. This method can be conducted intensively and repetitively at a low cost (as suggested by Koh and Wich, 2012; Vermeulen et al., 2013) and provide information on the fine scale distribution of detected animals at a spatial accuracy that cannot be obtained using other traditional occupied surveys, either aerial or vessel-based (e.g., Williams et al., 2007). The ability to conduct intensive surveys which can be repeated over time at a relatively minor cost has a wide range of applications, including species occupancy and habitat use assessments (Guillera-Arroita, 2011; Williams et al., 2017) and environmental impact assessments and monitoring.
Using customized image review and mapping programs, we were able to standardize and fast-track the animal detection and mapping process for high accuracy mapping of animal sightings and survey effort (as per Hodgson et al., 2017) whilst in the field. To our knowledge this is also the first time that animal density surface models (sensu Miller et al., 2013) have been developed based on animal sightings corrected for imperfect detection, and using aerial imagery data, thereby providing a major step forward in the spatial modeling of animal density distribution based on imagery data. These advances are an exciting development for wildlife managers who so often rely on spatially-explicit outputs to support effective management actions (Winiarski et al., 2014; Roberts et al., 2016; Herr et al., 2019).
Sampling Approach
Using a single small multirotor UAV in a grid sampling approach and operating under regulated restrictions on flight range (within visual line of sight operations and under 400 ft), we could conduct up to eight flights per day and achieve complete image surface coverage of up to 5.35 km2 per day (sampling intensity = 12.5% of the 31 km2 study area). Under the same restrictions and survey design, but with two UAVs flying simultaneously we could more than double the sampling effort (up to 11.36 km2 of surface cover per day) without increasing operational time. The novelty of this approach makes it hard to compare to other published research involving the use of small multirotor UAVs, which have mainly focused on trialing this technology to assess the detectability of specific wildlife of interest or to conduct synoptic surveys of animal groups (e.g., Ratcliffe et al., 2015; Díaz-Delgado et al., 2017). Vermeulen et al. (2013) locally surveyed wild elephants using a small fixed-wing UAV with higher flight endurance capabilities (maximum flight duration = 40 min) than the systems we used and with permission to fly beyond visual line of sight (transect length = 10 Km), thereby theoretically increasing surface area cover. Nonetheless, the authors found that they could fly over a maximum of six transects of 1.2 km2 per day, thereby achieving a total daily surface area cover of 7.2 km2 and generating image resolution slightly lower than ours (GSD = 3 cm per pixel). Our study shows that a similar, if not superior coverage/image resolution can be achieved with more constrained, small multirotor systems by using multiple aircrafts and a design adapted to these constraints.
The most appropriate grid-based sampling intensity and protocol will be determined by the research question as well as the context, i.e., the logistical constraints and prior ecological knowledge of the target species and area. In our case the grid was surveyed using random cell selection (as opposed to systematic) because of our limited knowledge on the dugongs’ distribution and density in the area of interest, as well as the initial lack of knowledge of the achievable sampling intensity. If resampling our survey area, we could adapt our approach using our current knowledge by, for example, taking a stratified systematic grid sampling approach (Caughley, 1974).
Our surveys covered a relatively small area (31.36 km2) because of vessel movement restrictions that were unrelated to our UAV operations. Without these constraints, our approach could be used to survey larger areas, albeit less intensively. In doing this, the trade-off between spatial coverage and survey intensity need to be considered in relation to the research question. In this study the intensive survey of a small area maximized (1) the precision in estimates of the abundance of dugongs present at the time of the surveys (Caughley, 1974; Ferreira and Van Aarde, 2009), and (2) the confidence in their distribution within the surveyed area (MacKenzie, 2006). Sampling a larger area than we did is feasible if ensuring high mobility of the UAV operator (in order to maximize the coverage: time ratio) and lowering sampling intensity (by reducing the number of cells surveyed, number of times cells are surveyed, or the coverage within the surveyed cell).
Spatial Accuracy, Modeling and Animal Availability Considerations
One notable feature of our UAV image processing methods is the ability to accurately map the horizontal position of surface-available animals detected in images. In traditional occupied surveys, either aerial or vessel-based, measurement error in distance sampling (i.e., measuring distances from the trackline) can be quite pronounced for a range of species (Williams et al., 2007; Strobel and Butler, 2014; Conn and Alisauskas, 2018) potentially impacting bias and precision in fitting detection functions and subsequent density and abundance estimation (Chen and Cowling, 2001; Marques, 2004; Borchers et al., 2010; Buckland et al., 2015). With a nadir camera setting and the high accuracy provided by the UAV telemetry our approach greatly reduces this distance estimation error.
Furthermore, when inferred animal positions are used to study clustering or spatial distribution (e.g., to study social- or resource-driven patterns), measurement error may introduce bias to such results because occupied vessel or aerial survey methods are unable to provide positions for individual animals. Instead they provide positions for groups (which are often very loosely and subjectively defined). Our individual-scale ‘observations’ and mapping of individuals allows for greater flexibility in subsequent analyses, such as the potential for characterizing animal distributions as spatial point processes (Skaug, 2006; Coburn et al., 2008; Yuan et al., 2017), in addition to more traditional line transect or plot-based analyses. Furthermore, it minimizes the error in group size estimation that results from observers have differing interpretations of what constitutes a group. Thus our aerial imagery data and standardized animal detection and localization processes provide the opportunity to assess clustering and define groups with greater confidence and accuracy than traditional methods. Estimating group size based on individual-scale observations made in aerial images is possible (e.g., Hodgson et al., 2017) and so is the identification of mother-calf pairs. However, we did not conduct these analyses because the focus of this paper was on developing an understanding of the use of the study area by individual dugongs regardless of their group formation and calf attendance.
Whilst we chose to use a widely used density surface modeling approach (Hedley and Buckland, 2004; Miller et al., 2013) in combination with existing estimates of availability (e.g., Pollock et al., 2006) to estimate dugong abundance within the survey area, other established and emerging analysis methods might also be useful, particularly to take advantage of the ability to accurately map locations of individuals which are at or near the surface of the water. For example, spatial point process methods, which use the explicit location of detections (usually in two-dimensional space in the context of wildlife studies) relative to other detections, have been used to explore spatial structure of marine mammal populations (Hagen and Schweder, 1995; Cowling, 1998; Yuan et al., 2017), and to make inferences about survey observation processes, and resultant abundance and precision (Skaug et al., 2004; Skaug, 2006; Waagepetersen and Schweder, 2006; noting these methods also incorporate a model of point ‘thinning’ via distance sampling, where points from a full set are removed via the observation process occurring at distance). Another related approach is ‘N-mixture’ modeling, where resampling of detections in the same spatial region over several sampling occasions may allow estimation of detection probability, occupancy and abundance from aerial imagery (Royle, 2004; Williams et al., 2017). Both approaches warrant further investigation as potential ways to improve information arising from aerial imagery surveys for marine mammals such as dugongs.
The process of collecting overlapping imagery along a transect may also allow estimation of availability, which could augment what is already known about visibility bias in dugong aerial surveys (e.g., Pollock et al., 2006; Hagihara et al., 2018), in addition to provide area- and conditions-specific estimates. Heide-Jørgensen et al. (2010)’s sequential images taken (approximately 2.6 s apart) along a transect with a nadir-facing camera were able to capture several surface/dive events for common minke whales (Balaenoptera acutorostrata). This allowed the authors to piece together estimates of surface and dive duration, which was then fed into an estimator of non-instantaneous availability given by Laake et al. (1997). The surface/dive times captured by Heide-Jørgensen et al. (2010) were both right and left-truncated due to the discrete nature of images; arguably, continuous aerial focal follow video may be better for estimating surface and dive durations, such as demonstrated by Hodgson et al. (2017), for example. However, Heide-Jørgensen et al. (2010) still demonstrated that basic availability estimates were possible under this method. In our study there was a designed 70% forward overlap in image area along transects flown. Across the three seasons, this overlap rate, combined with an image capture interval of 3 s, meant that any point on the surface of the water was available to be photographed for an average of approximately 9 s; Figure 2 provides an indication of a dugong surfacing event captured during this study. There would be benefit in future simulation work to explore the trade-off between percentage of image overlap, platform speed and surface/dive activity, and relative ability to estimate availability, all within the same survey process.
Image Processing
While UAVs prove to be an effective tool at conducting wildlife surveys, extensive efforts often required to post-process the data can negate any time saved by UAVs in the field compared to conventional survey methods. Here all images were reviewed manually, but trained observers reviewed the images almost immediately after the pilots had completed a survey. When the UAVs were not in operation, the entire research crew of up to eight people reviewed the images. The total estimated time to review all the images collected in this study was approximately 210 h (based on the estimated 15 s review of an image). Nonetheless, it is widely accepted that for UAVs to become truly efficient wildlife monitoring tools across the entire workflow of data collection through to analysis, improved capabilities to automate animal detection and counting in the imagery collected by UAVs are required (Gonzalez et al., 2016). Detections of animals in-water from aerial images using convolutional neural networks (a form of machine learning) is now also feasible (e.g., Nguyen et al., 2017; Guirado et al., 2019). Maire et al. (2015) developed a machine learning system to detect dugongs in UAV images using training images provided from the trial surveys. The recall of this system (i.e., the proportion of known dugongs detected in a set of test images) is 80%. The precision of the system (proportion of detections that were true dugongs as opposed to false detections) is 27%. Deep learning systems such as Maire et al. (2015)’s can only be improved with large labeled training data. Our study will provide valuable training data to advance the automated detection system.
Key Assumptions and Limitations
The dugong detections from the aerial images were corrected for availability bias to produce dugong abundance estimates. However, it is important to note that these estimates do not represent the total number of dugongs occurring in the southeast region of Exmouth Gulf, but are an estimate of the number of animals present in the study area at the time of the surveys. Furthermore, we have assumed that the movements of the dugongs in our study area were random in space and time, and that the movements between transects during a flight was minimal, thereby having no effect on animal counts from one transect to another within a flight. Without (1) empirical data on the movements of dugongs in the study region (and more specifically their movement within and in and out the study area), and (2) the ability to identify and detect the same animal at different times within or across survey flights and thereby provide data from which movement can be estimated, it is very difficult if not impossible to say how likely these assumptions are to be true. Dugongs traveling between locations in a constant direction display varied minimum travel speeds from approximately 0.5–4 km/hr (Campbell et al., 2010) but that speed will be less for animals swimming while foraging. Thus, ideally information on dugong movements in different behavioral states would be integrated into the survey design to reduce bias due to movement (Buckland et al., 2004; Fewster et al., 2008).
While there are many obvious advantages in using a vessel to conduct aerial surveys using small UAVs, researchers should also be aware of the potential constraints of vessel-based UAV operations. In our experience, the use of a live-aboard vessel enabled us to (1) survey a very remote area which our UAVs could not have reached from the land, (2) stay in the area overnight thereby reducing commute time and cost, (3) ensure very safe UAV operations thanks to the vessel’s stability and relatively large, open deck space for take-off and landing (4) access to on-board charging facilities to charge multiple UAV batteries and other equipment simultaneously, thereby ensuring that battery charge was never a limiting factor to our intensive operations. On the downside, using a large vessel with a large draught limited our access to some inshore sites at low tide and the commute between sites, even in good weather conditions, was relatively slow, meaning we achieved less flights per day than we could have with a smaller vessel (e.g., northeast section of the study area, Figure 1C). Since this study, we have conducted trials using our sampling approach from much smaller outboard vessels (e.g., ∼6 m semi-inflatable vessel; Cleguer et al., 2020a) and found that all aspects of our method could be replicated as safely and at least as efficiently as the method we describe in this paper.
We note that we had one system failure during our operations which resulted in the UAV crashing back onto the deck of our research vessel. All personnel were maintaining appropriate distances from the launch and retrieval site to ensure safety. Upon review of the flight data, the cause could not be detected, but we suspect a bug in our flight planning app. Our experience highlights the importance of risk management when operating all UAVs, appropriate pilot training, and the need for having a back-up system to allow field work to continue in the event of a system failure or loss.
Conclusion
The methodology we describe shows that small, affordable UAVs with seemingly limited capabilities can be successfully applied to wildlife surveys. We also provide for the first time a thorough description of an application of aerial imagery strip transect sampling, in combination with model-based density and abundance estimation corrected for imperfect detection—demonstrating analyses of aerial imagery can be very much aligned with traditional aerial survey approaches.
Using a novel grid-sampling approach, small UAVs can cover reasonable sized survey areas considering we were able cover 11 km2 per day even with our mobility constraints. With continued advancement of image processing tools, it is realistic to suggest that our method paves the way for affordable rapid assessment wildlife surveys that offer more detail and accuracy than occupied survey techniques. As the UAV market continues to grow, new affordable systems may become available and show sufficient field testing to be used in intensive wildlife survey applications. For example, vertical take-off and landing fixed-wing UAVs are an emerging solution for surveying wildlife in challenging terrains while increasing flight time and thus coverage (Raoult et al., 2020). We have provided detailed information within our supplementary information to maximize the potential for researchers to use these survey methods within minimal training and experience. However, we reiterate that optimal survey design (grid sampling intensity and selection protocol) relies on a clear understanding of the research or monitoring questions and objectives, of the target species’ ecology, and of the local logistical constraints.
Data Availability Statement
The datasets generated for this study are not readily available upon request. The Department of Biodiversity Conservation and Attractions (Western Australia; co-funder of this study) must agree to the sharing of the data. Requests to access the datasets should be directed to CC, AH, and NK.
Ethics Statement
The animal study was reviewed and approved by Murdoch University Animal Ethics Committee (R2950/17).
Author Contributions
Study design was developed by CC, NK, DP, and AH. Data collection was conducted by CC and JT. Image processing program was developed by JT with help from CC and AH. Mapping program was developed by MW with help from CC and AH. Data analysis were performed by CC (flight, image, and sighting statistics) and NK (spatial modeling and abundance estimates). The first draft of the manuscript was written by CC and all authors have subsequently contributed to the writing and editing. All authors have read and approved the final manuscript.
Funding
This project was funded by the Chevron-operated Wheatstone LNG Project’s State Environmental Offsets Program and administered by the Department of Biodiversity, Conservation and Attractions. The Wheatstone Project is a joint venture between Australian subsidiaries of Chevron, Kuwait Foreign Petroleum Exploration Company (KUFPEC), Apache Corporation and Kyushu Electric Power Company, together with PE Wheatstone Pty. Ltd. (part-owned by TEPCO). This project was also supported by Woodside through the Pluto LNG Environmental Offsets Program. Additional funding was provided by Murdoch University.
Conflict of Interest
The authors declare that the research was conducted in the absence of any commercial or financial relationships that could be construed as a potential conflict of interest.
Acknowledgments
This study was undertaken under a larger research project entitled “Conserving critical seagrass habitats for dugongs: an integrated assessment across the Pilbara.” Thanks to the Global Unmanned Systems crew for their support in operating the UAVs and conducting image reviews. Thanks to the Keshi Mer II crew for welcoming our teams on their vessel and making the fieldwork so enjoyable and comfortable. Thanks to all our image reviewers including the Edith Cowan and Murdoch University research volunteers. This work could not have been successful without the support from the Edith Cowan University CMER research staff, especially Nicole Said and Connor Gorham who have put a lot of effort in helping with the image review process. Finally, we wholeheartedly appreciate the support of staff from the Department of Biodiversity, Conservation and Attractions particularly Kelly Waples and Holly Raudino.
Supplementary Material
The Supplementary Material for this article can be found online at: https://www.frontiersin.org/articles/10.3389/fmars.2021.640338/full#supplementary-material
Footnotes
- ^ https://www.dugongconservation.org
- ^ http://www.dji.com
- ^ https://www.casa.gov.au/drones/rules/drone-safety-rules
References
Atwood, T. B., Connolly, R. M., Ritchie, E. G., Lovelock, C. E., Heithaus, M. R., Hays, G. C., et al. (2015). Predators help protect carbon stocks in blue carbon ecosystems. Nat. Clim. Change 5, 1038–1045. doi: 10.1038/nclimate2763
Augé, A. A., Dias, M. P., Lascelles, B., Baylis, A. M., Black, A., Boersma, P. D., et al. (2018). Framework for mapping key areas for marine megafauna to inform marine spatial planning: the Falkland Islands case study. Mar. Policy 92, 61–72. doi: 10.1016/j.marpol.2018.02.017
Barnas, A. F., Chabot, D., Hodgson, A. J., Johnston, D. W., Bird, D. M., and Ellis-Felege, S. N. (2020). A standardized protocol for reporting methods when using drones for wildlife research. J. Unmann. Vehicle Syst. 8, 89–98. doi: 10.1139/juvs-2019-0011
Baxter, P. W., and Hamilton, G. (2018). Learning to fly: integrating spatial ecology with unmanned aerial vehicle surveys. Ecosphere 9:e02194.
Bayliss, P., Raudino, H., and Hutton, M. (2018). Dugong (Dugong dugon) Population and Habitat Survey of Shark Bay Marine Park and Ningaloo. Reef Marine Park and Exmouth Gulf Report 1 by CSIRO and Department of Biodiversity, Conservation and Attractions prepared for National Environmental Science Program. Canberra, NSW: CSIRO, 51.
Borchers, D., Marques, T., Gunnlaugsson, T., and Jupp, P. (2010). Estimating distance sampling detection functions when distances are measured with errors. J. Agric. Biol. Environ. Stat. 15, 346–361. doi: 10.1007/s13253-010-0021-y
Bröker, K. C., Hansen, R. G., Leonard, K. E., Koski, W. R., and Heide-Jørgensen, M. P. (2019). A comparison of image and observer based aerial surveys of narwhal. Mar. Mammal Sci. 35, 1253–1279. doi: 10.1111/mms.12586
Buckland, S. T., Anderson, D. R., Burnham, K. P., Laake, J. L., Borchers, D. L., and Thomas, L. (2004). Advanced Distance Sampling. Oxford: Oxford University Press.
Buckland, S. T., Rexstad, E. A., Marques, T. A., and Oedekoven, C. S. (2015). Distance Sampling: Methods and Applications. Cham: Springer International Publishing.
Campbell, R., Holley, D., and Group, B.-J. R. (2010). Movement Behaviours and Habitat Usage of West Kimberley Dugongs: A community Based Approach. Unpublished Final Report to the Australian Marine Mammal Centre. Hobart, Australia. Available online at: https://data.marinemammals.gov.au/common/documents/grants/0809/Holley_14.pdf (accessed September 5, 2020).
Chabot, D. (2009). Systematic Evaluation of a Stock Unmanned Aerial Vehicle (UAV) System for Small-Scale Wildlife Survey Applications. MSc. thesis. Montreal, QC: Mcgill University.
Chabot, D., and Bird, D. M. (2015). Wildlife research and management methods in the 21st century: where do unmanned aircraft fit in? J. Unmann. Vehicle Syst. 3, 137–155. doi: 10.1139/juvs-2015-0021
Chen, X. S., and Cowling, A. (2001). Measurement errors in line transect surveys where detectability varies with distance and size. Biometrics 57, 732–742. doi: 10.1111/j.0006-341X.2001.00732.x
Cleguer, C. (2015). Informing Dugong Conservation at Several Spatial and Temporal Scales in New Caledonia. Ph.D. thesis. Townsville, QLD: James Cook University.
Cleguer, C., Derville, S., Lambourne, R., Kelly, N., and Garrigue, C. (2020a). Programme SIREN: Suivi à Fine Échelle de la Fréquentation et du Déplacement des Dugongs dans la zone Voh-Koné-Pouembout, Pour une Gestion Améliorée de L’espèce. Final report produced for Koniambo Nickel SAS. Voh: Koniambo Nickel SAS.
Cleguer, C., Garrigue, C., and Marsh, H. (2020b). Dugong (Dugong dugon) movements and habitat use in a coral reef lagoonal ecosystem. Endang. Species Res. 43, 167–181. doi: 10.3354/esr01061
Coburn, T. C., McKenna, S. A., and Saito, H. (2008). “Strip transect sampling to estimate object abundance in homogeneous and non-homogeneous poisson fields: a simulation study of the effects of changing transect width and number,” in Progress in Geomathematics, eds G. Bonham-Carter and Q. Cheng (Berlin: Springer), 333–351. doi: 10.1007/978-3-540-69496-0_16
Colefax, A. P., Butcher, P. A., and Kelaher, B. P. (2018). The potential for unmanned aerial vehicles (UAVs) to conduct marine fauna surveys in place of manned aircraft. ICES J. Mar. Sci. 75, 1–8. doi: 10.1093/icesjms/fsx100
Conn, P. B., and Alisauskas, R. T. (2018). Simultaneous modelling of movement, measurement error, and observer dependence in mark-recapture distance sampling: an application to arctic bird surveys. Ann. Appl. Stat. 12, 96–122.
Cowling, A. (1998). Spatial methods for line transect surveys. Biometrics 54, 828–839. doi: 10.2307/2533837
Díaz-Delgado, R., Mañez, M., Martínez, A., Canal, D., Ferrer, M., and Aragonés, D. (2017). “Using UAVs to map aquatic bird colonies,” in The Roles of Remote Sensing in Nature Conservation, eds R. Díaz-Delgado, R. Lucas, and C. Hurford (Cham: Springer), 277–291. doi: 10.1007/978-3-319-64332-8_14
Doukari, M., Batsaris, M., Papakonstantinou, A., and Topouzelis, K. (2019). A protocol for aerial survey in coastal areas using UAS. Remote Sens. 11:1913. doi: 10.3390/rs11161913
Ferreira, S. M., and Van Aarde, R. J. (2009). Aerial survey intensity as a determinant of estimates of African elephant population sizes and trends. Afr. J. Wildlife Res. 39, 181–191. doi: 10.3957/056.039.0205
Fewster, R. M., Southwell, C., Borchers, D. L., Buckland, S. T., and Pople, A. R. (2008). The influence of animal mobility on the assumption of uniform distances in aerial line-transect surveys. Wildlife Res. 35, 275–288. doi: 10.1071/WR07077
Fleming, P. J. S., and Tracey, J. P. (2008). Aerial surveys of wildlife: theory and applications – Preface. Wildlife Res. 35, III–IV.
Garcia-Garin, O., Aguilar, A., Borrell, A., Gozalbes, P., Lobo, A., Penadés-Suay, J., et al. (2020). Who’s better at spotting? A comparison between aerial photography and observer-based methods to monitor floating marine litter and marine mega-fauna. Environ. Pollut. 258:113680. doi: 10.1016/j.envpol.2019.113680
Gonzalez, L. F., Montes, G. A., Puig, E., Johnson, S., Mengersen, K., and Gaston, K. J. (2016). Unmanned aerial vehicles (UAVs) and artificial intelligence revolutionizing wildlife monitoring and conservation. Sensors 16:97. doi: 10.3390/s16010097
Guillera-Arroita, G. (2011). Impact of sampling with replacement in occupancy studies with spatial replication. Methods Ecol. Evol. 2, 401–406. doi: 10.1111/j.2041-210X.2011.00089.x
Guirado, E., Tabik, S., Rivas, M. L., Alcaraz-Segura, D., and Herrera, F. (2019). Whale counting in satellite and aerial images with deep learning. Sci. Rep. 9:14259.
Hagen, G., and Schweder, T. (1995). “Point clustering of minke whales in the northeastern Atlantic,” in Developments in Marine Biology, eds A. S. Blix, L. Walløe, and Ø Ulltang (Amsterdam: Elsevier), 27–33. doi: 10.1016/s0163-6995(06)80006-5
Hagihara, R., Jones, R. E., Sobtzick, S., Cleguer, C., Garrigue, C., and Marsh, H. (2018). Compensating for geographic variation in detection probability with water depth improves abundance estimates of coastal marine megafauna. PLoS One 13:e0191476. doi: 10.1371/journal.pone.0191476
Hammond, P., Lacey, C., Gilles, A., Viquerat, S., Boerjesson, P., Herr, H., et al. (2017). Estimates of Cetacean Abundance in European Atlantic Waters in Summer 2016 from the SCANS-III aerial and shipboard surveys. Available online at: https://synergy.st-andrews.ac.uk/scans3/files/2017/05/SCANS-III-design-based-estimates-2017-05-12-final-revised.pdf (accessed September 5, 2020).
Hays, G. C., Alcoverro, T., Christianen, M. J., Duarte, C. M., Hamann, M., Macreadie, P. I., et al. (2018). New tools to identify the location of seagrass meadows: marine grazers as habitat indicators. Front. Mar. Sci. 5:9. doi: 10.3389/fmars.2018.00009
Hedley, S. L., and Buckland, S. T. (2004). Spatial models for line transect sampling. J. Agric. Biol. Environ. Stat. 9:181. doi: 10.1198/1085711043578
Heide-Jørgensen, M., Witting, L., Laidre, K., Hansen, R., and Rasmussen, M. (2010). Fully corrected estimates of common minke whale abundance in West Greenland in 2007. J. Cetac. Res. Manag. 11, 75–82.
Hensel, E., Wenclawski, S., and Layman, C. A. (2018). Using a small, consumer-grade drone to identify and count marine megafauna in shallow habitats. Latin Am. J. Aquat. Res. 46, 1025–1033. doi: 10.3856/vol46-issue5-fulltext-15
Herr, H., Kelly, N., Dorschel, B., Huntemann, M., Kock, K. H., Lehnert, L. S., et al. (2019). Aerial surveys for Antarctic minke whales (Balaenoptera bonaerensis) reveal sea ice dependent distribution patterns. Ecol. Evol. 9, 5664–5682. doi: 10.1002/ece3.5149
Hines, E. M., Reynold, J., Mignucci-Giannoni, A., Aragones, L., and Marmontel, M. (2012). Sirenian Conservation: Issues and Strategies in Developing Countries. Gainesville, FL: University Press of Florida.
Hodgson, A. (2007). The Distribution, Abundance and Conservation of Dugongs and Other Marine Megafauna in Shark Bay Marine Park, Ningaloo Reef Marine Park and Exmouth Gulf. Report to the Western Australia Department of Environment and Conservation September. Kensington, WA: Department of Environment and Conservation.
Hodgson, A., Kelly, N., and Peel, D. (2013). Unmanned aerial vehicles (UAVs) for surveying marine fauna: a dugong case study. PLos One 8:e79556. doi: 10.1371/journal.pone.0079556
Hodgson, A., Peel, D., and Kelly, N. (2017). Unmanned aerial vehicles for surveying marine fauna: assessing detection probability. Ecol. Appl. 27, 1253–1267. doi: 10.1002/eap.1519
Hooker, S. K., and Gerber, L. R. (2004). Marine reserves as a tool for ecosystem-based management: the potential importance of Megafauna. Bioscience 54, 27–39. doi: 10.1641/0006-3568(2004)054[0027:mraatf]2.0.co;2
IUCN Marine Mammal Protected Areas Task Force (2020). Important Marine Mammal Area Regional Workshop for Australia-New Zealand and South East Indian Ocean. Unpublished Preliminary Report of the 6th IMMA Workshop. Perth, WA. Available online at: https://www.marinemammalhabitat.org/download/preliminary-imma-australia-nz/ (accessed February 10-14, 2020).
Jones, G. P., Pearlstine, L. G., and Percival, H. F. (2006). An assessment of small unmanned aerial vehicles for wildlife research. Wildlife Soc. Bull. 34, 750–758. doi: 10.2193/0091-7648(2006)34[750:aaosua]2.0.co;2
Kiszka, J. J., and Heithaus, M. R. (2018). “Using aerial surveys to investigate the distribution, abundance, and behavior of sharks and rays,” in Shark Research: Emerging Technologies and Applications for the Field and Laboratory, eds J. C. Carrier, M. R. Heithaus, and C. A. Simpfendorfer (Boca Raton, FL: CRC Press).
Kiszka, J. J., Mourier, J., Gastrich, K., and Heithaus, M. R. (2016). Using unmanned aerial vehicles (UAVs) to investigate shark and ray densities in a shallow coral lagoon. Mar. Ecol. Prog. Ser. 560, 237–242. doi: 10.3354/meps11945
Koh, L. P., and Wich, S. A. (2012). Dawn of drone ecology: low-cost autonomous aerial vehicles for conservation. Trop. Conserv. Sci. 5, 121–132. doi: 10.1177/194008291200500202
Koski, W. R., Allen, T., Ireland, D., Buck, G., Smith, P. R., Macrander, A. M., et al. (2009). Evaluation of an unmanned airborne system for monitoring marine mammals. Aquat. Mamm. 35:347. doi: 10.1578/am.35.3.2009.347
Laake, J. L., Calambokidis, J., Osmek, S. D., and Rugh, D. J. (1997). Probability of detecting harbor porpoise from aerial surveys: estimating g (0). J. Wildlife Manag. 97, 63–75.
Linchant, J., Lisein, J., Semeki, J., Lejeune, P., and Vermeulen, C. (2015). Are unmanned aircraft systems (UASs) the future of wildlife monitoring? A review of accomplishments and challenges. Mamm. Rev. 45, 239–252. doi: 10.1111/mam.12046
MacKenzie, D. I. (2006). Modeling the probability of resource use: the effect of, and dealing with, detecting a species imperfectly. J. Wildlife Manag. 70, 367–374. doi: 10.2193/0022-541x(2006)70[367:mtporu]2.0.co;2
Maire, F., Mejias, L., and Hodgson, A. (2015). “Automating marine mammal detection in aerial images captured during wildlife surveys: a deep learning approach,” in AI 2015: Advances in Artificial Intelligence, eds B. Pfahringer and J. Renz (Cham: Springer International Publishing), 379–385. doi: 10.1007/978-3-319-26350-2_33
Marques, T. A. (2004). Predicting and correcting bias caused by measurement error in line transect sampling using multiplicative error models. Biometrics 60, 757–763. doi: 10.1111/j.0006-341x.2004.00226.x
Marsh, H., Grech, A., and McMahon, K. (2018). “Dugongs: seagrass community specialists,” in Seagrasses of Australia, eds A. W. Larkum, G. A. Kendrick, and P. J. Ralph (Cham: Springer), 629–661. doi: 10.1007/978-3-319-71354-0_19
Marsh, H., Lawler, I. R., Kwan, D., Delean, S., Pollock, K., and Alldredge, M. (2004). Aerial surveys and the potential biological removal technique indicate that the Torres Strait dugong fishery is unsustainable. Anim. Conserv. 7, 435–443. doi: 10.1017/s1367943004001635
Marsh, H., O’Shea, T. J., and Reynolds, J. E. III (2011). Ecology and Conservation of the Sirenia: Dugongs and Manatees. Cambridge: Cambridge University Press.
Marsh, H., and Sobtzick, S. (2019). Dugong Dugon (Amended Version of 2015 Assessment). The IUCN Red List of Threatened Species 2019: e.T6909A160756767. Available online at: https://www.iucnredlist.org/about/citationinfo
Martin, J., Edwards, H. H., Fonnesbeck, C. J., Koslovsky, S. M., Harmak, C. W., and Dane, T. M. (2015). Combining information for monitoring at large spatial scales: first statewide abundance estimate of the Florida manatee. Biol. Conserv. 186, 44–51. doi: 10.1016/j.biocon.2015.02.029
Miller, D. L., Burt, M. L., Rexstad, E. A., and Thomas, L. (2013). Spatial models for distance sampling data: recent developments and future directions. Methods Ecol. Evol. 4, 1001–1010. doi: 10.1111/2041-210x.12105
Mulero-Pázmány, M., Jenni-Eiermann, S., Strebel, N., Sattler, T., Negro, J. J., and Tablado, Z. (2017). Unmanned aircraft systems as a new source of disturbance for wildlife: a systematic review. PLoS One 12:e0178448. doi: 10.1371/journal.pone.0178448
Nguyen, H., Maclagan, S. J., Nguyen, T. D., Nguyen, T., Flemons, P., Andrews, K., et al. (2017). “Animal recognition and identification with deep convolutional neural networks for automated wildlife monitoring,” in Proceedings of the 2017 IEEE International Conference on Data Science and Advanced Analytics (DSAA), (Tokyo: IEEE), 40–49.
Pollock, K., Marsh, H., Lawler, I. R., and Alldredge, M. (2006). Estimating animal abundance in heterogeneous environments: an application to aerial surveys for Dugongs. J. Wildlife Manag. 70, 255–262. doi: 10.2193/0022-541x(2006)70[255:eaaihe]2.0.co;2
Preen, A., Marsh, H., Lawler, I., Prince, R., and Shepherd, R. (1997). Distribution and abundance of dugongs, turtles, dolphins and other megafauna in Shark Bay, Ningaloo Reef and Exmouth Gulf, Western Australia. Wildlife Res. 24, 185–208. doi: 10.1071/wr95078
Prince, R. (2001). Aerial Survey of the Distribution and Abundance of Dugongs and Associated Macrovertebrate Fauna–Pilbara Coastal and Offshore Region, WA. Unpublished Report to Environment Australia. Perth, WA: Department of Conservation and Land Management.
R Core Team (2020). R: A Language and Environment for Statistical Computing. Vienna: R Foundation for Statistical Computing. Available online at: http://www.r-project.org/
Ratcliffe, N., Guihen, D., Robst, J., Crofts, S., Stanworth, A., and Enderlein, P. (2015). A protocol for the aerial survey of penguin colonies using UAVs. J. Unmann. Vehicle Syst. 3, 95–101. doi: 10.1139/juvs-2015-0006
Raoult, V., Colefax, A. P., Allan, B. M., Cagnazzi, D., Castelblanco-Martínez, N., Ierodiaconou, D., et al. (2020). Operational protocols for the use of drones in marine animal research. Drones 4:64. doi: 10.3390/drones4040064
Rexstad, E. A., Mellor, M., Williams, A. E., and Woodward, R. (2012). Aerial surveys of seabirds: the advent of digital methods. J. Appl. Ecol. 49, 960–967. doi: 10.1111/j.1365-2664.2012.02150.x
Roberts, J. J., Best, B. D., Mannocci, L., Fujioka, E., Halpin, P. N., Palka, D. L., et al. (2016). Habitat-based cetacean density models for the US Atlantic and Gulf of Mexico. Sci. Rep. 6:22615.
Rogers, S. R., Manning, I., and Livingstone, W. (2020). Comparing the spatial accuracy of digital surface models from four unoccupied aerial systems: photogrammetry versus LiDAR. Remote Sens. 12:2806. doi: 10.3390/rs12172806
Royle, J. A. (2004). N-mixture models for estimating population size from spatially replicated counts. Biometrics 60, 108–115. doi: 10.1111/j.0006-341x.2004.00142.x
Sheppard, J. K., Preen, A. R., Marsh, H., Lawler, I. R., Whiting, S. D., and Jones, R. E. (2006). Movement heterogeneity of dugongs, Dugong dugong (Müller), over large spatial scales. J. Exp. Biol. Ecol. 334, 64–83. doi: 10.1016/j.jembe.2006.01.011
Skaug, H. J. (2006). Markov modulated Poisson processes for clustered line transect data. Environ. Ecol. Stat. 13, 199–211. doi: 10.1007/s10651-005-0006-0
Skaug, H. J., Øien, N., Schweder, T., and Bøthun, G. (2004). Abundance of minke whales (Balaenoptera acutorostrata) in the Northeast Atlantic: variability in time and space. Can. J. Fish. Aquat. Sci. 61, 870–886. doi: 10.1139/f04-020
Sobtzick, S., Cleguer, C., Hagihara, R., and Marsh, H. (2017). Distribution and Abundance Of Dugong and Large Marine Turtles in Moreton Bay, Hervey Bay and the Southern Great Barrier Reef. TropWater Report 17/21. Townsville, Qld: James Cook University.
Strobel, B. N., and Butler, M. J. (2014). Monitoring whooping crane abundance using aerial surveys: influences on detectability. Wildlife Soc. Bull. 38, 188–195. doi: 10.1002/wsb.374
Sweeney, K. L., Helker, V. T., Perryman, W. L., LeRoi, D. J., Fritz, L. W., Gelatt, T. S., et al. (2015). Flying beneath the clouds at the edge of the world: using a hexacopter to supplement abundance surveys of Steller sea lions (Eumetopias jubatus) in Alaska. J. Unmann. Vehicle Syst. 4, 70–81. doi: 10.1139/juvs-2015-0010
Sykora-Bodie, S. T., Bezy, V., Johnston, D. W., Newton, E., and Lohmann, K. J. (2017). Quantifying nearshore sea turtle densities: applications of unmanned aerial systems for population assessments. Sci. Rep. 7:17690.
Vermeulen, C., Lejeune, P., Lisein, J., Sawadogo, P., and Bouché, P. (2013). Unmanned aerial survey of elephants. PLoS One 8:e54700. doi: 10.1371/journal.pone.0054700
Waagepetersen, R., and Schweder, T. (2006). Likelihood-based inference for clustered line transect data. J. Agric. Biol. Environ. Stat. 11:264. doi: 10.1198/108571106x130557
Watts, A. C., Perry, J. H., Smith, S. E., Burgess, M. A., Wilkinson, B. E., Szantoi, Z., et al. (2010). Small unmanned aircraft systems for low-altitude aerial surveys. J. Wildlife Manag. 74, 1614–1619. doi: 10.2193/2009-425
Wiegmann, D. A., and Taneja, N. (2003). Analysis of injuries among pilots involved in fatal general aviation airplane accidents. Accid. Anal. Prev. 35, 571–577. doi: 10.1016/s0001-4575(02)00037-4
Williams, P. J., Hooten, M. B., Womble, J. N., and Bower, M. R. (2017). Estimating occupancy and abundance using aerial images with imperfect detection. Methods Ecol. Evol. 8, 1679–1689. doi: 10.1111/2041-210x.12815
Williams, R., Leaper, R., Zerbini, A. N., and Hammond, P. S. (2007). Methods for investigating measurement error in cetacean line-transect surveys. J. Mar. Biol. Assoc. U. K. 87, 313–320. doi: 10.1017/S0025315407055154
Winiarski, K. J., Miller, D. L., Paton, P. W., and McWilliams, S. R. (2014). A spatial conservation prioritization approach for protecting marine birds given proposed offshore wind energy development. Biol. Conserv. 169, 79–88. doi: 10.1016/j.biocon.2013.11.004
Wood, S. N. (2011). Fast stable restricted maximum likelihood and marginal likelihood estimation of semiparametric generalized linear models. J. R. Stat. Soc. Ser. B (Stat. Methodol.) 73, 3–36. doi: 10.1111/j.1467-9868.2010.00749.x
Keywords: drone, UAV (unoccupied aerial vehicle), wildlife survey methodology, abundance, spatial modeling, dugong
Citation: Cleguer C, Kelly N, Tyne J, Wieser M, Peel D and Hodgson A (2021) A Novel Method for Using Small Unoccupied Aerial Vehicles to Survey Wildlife Species and Model Their Density Distribution. Front. Mar. Sci. 8:640338. doi: 10.3389/fmars.2021.640338
Received: 11 December 2020; Accepted: 07 April 2021;
Published: 05 May 2021.
Edited by:
Vincent Raoult, The University of Newcastle, AustraliaReviewed by:
Louise Tosetto, Macquarie University, AustraliaDavid W. Johnston, Duke University, United States
Copyright © 2021 Cleguer, Kelly, Tyne, Wieser, Peel and Hodgson. This is an open-access article distributed under the terms of the Creative Commons Attribution License (CC BY). The use, distribution or reproduction in other forums is permitted, provided the original author(s) and the copyright owner(s) are credited and that the original publication in this journal is cited, in accordance with accepted academic practice. No use, distribution or reproduction is permitted which does not comply with these terms.
*Correspondence: Christophe Cleguer, Christophe.cleguer@murdoch.edu.au