Fine-Scale Heterogeneity of a Cold-Water Coral Reef and Its Influence on the Distribution of Associated Taxa
 David M. Price1,2*
  Aaron Lim3,4,5
  Alexander Callaway6,7
  Markus P. Eichhorn3,4
  Andrew J. Wheeler3,4,8,9
  Claudio Lo Iacono2,10
  Veerle A. I. Huvenne2
- 1School of Ocean and Earth Science, University of Southampton, Southampton, United Kingdom
- 2Ocean BioGeosciences, National Oceanography Centre, Southampton, United Kingdom
- 3Environmental Research Institute, University College Cork, Cork, Ireland
- 4School of Biological, Earth & Environmental Sciences, University College Cork, Cork, Ireland
- 5Green Rebel Marine Ltd., Crosshaven, Ireland
- 6Centre for Environment, Fisheries and Aquaculture Science, Lowestoft, United Kingdom
- 7Agri-Food and Biosciences Institute, Belfast, United Kingdom
- 8Irish Centre of Research in Applied Geosciences, University College Cork, Cork, Ireland
- 9Marine and Renewable Energy Centre, University College Cork, Cork, Ireland
- 10Marine Sciences Institute, Spanish National Research Council, Barcelona, Spain
Benthic fauna form spatial patterns which are the result of both biotic and abiotic processes, which can be quantified with a range of landscape ecology descriptors. Fine- to medium-scale spatial patterns (<1–10 m) have seldom been quantified in deep-sea habitats, but can provide fundamental ecological insights into species’ niches and interactions. Cold-water coral reefs formed by Desmophyllum pertusum (syn. Lophelia pertusa) and Madrepora oculata are traditionally mapped and surveyed with multibeam echosounders and video transects, which limit the ability to achieve the resolution and/or coverage to undertake fine-scale, centimetric quantification of spatial patterns. However, photomosaics constructed from imagery collected with remotely operated vehicles (ROVs) are becoming a prevalent research tool and can reveal novel information at the scale of individual coral colonies. A survey using a downward facing camera mounted on a ROV traversed the Piddington Mound (Belgica Mound Province, NE Atlantic) in a lawnmower pattern in order to create 3D reconstructions of the reef with Structure-from-Motion techniques. Three high resolution orthorectified photomosaics and digital elevation models (DEM) >200 m2 were created and all organisms were geotagged in order to illustrate their point pattern. The pair correlation function was used to establish whether organisms demonstrated a clustered pattern (CP) at various scales. We further applied a point pattern modelling approach to identify four potential point patterns: complete spatial randomness (CSR), an inhomogeneous pattern influenced by environmental drivers, random clustered point pattern indicating biologically driven clustering and an inhomogeneous clustered point pattern driven by a combination of environmental drivers and biological effects. Reef framework presence and structural complexity determined inhabitant distribution with most organisms showing a departure from CSR. These CPs are likely caused by an affinity to local environmental drivers, growth patterns and restricted dispersion reproductive strategies within the habitat across a range of fine to medium scales. These data provide novel and detailed insights into fine-scale habitat heterogeneity, showing that non-random distributions are apparent and detectable at these fine scales in deep-sea habitats.
Introduction
Aggregations of animals and single celled organisms have been recognised and studied for some time (Allee, 1927), in both mobile (e.g., Parrish and Edelstein-Keshet, 1999) and sessile species (e.g., Condit et al., 2000). Aggregations may be driven by environmental heterogeneity (geological, physical, and chemical) and biological factors (behaviour, dispersion method, and reproduction), with different drivers affecting spatial patterns at different temporal and spatial scales (Levin, 1992). Through careful observation and quantification of faunal spatial patterns, insights can be obtained into the underlying ecological processes that influence the fine-scale dispersion of species. A range of first and second order statistical tests have been developed to assess spatial patterns as being clustered, randomly or over-dispersed distributions (Baddeley et al., 2015). These types of analyses using discrete point data have typically been applied to terrestrial systems, for example, to understand tree distributions in forests (Condit et al., 2000; Woodall and Graham, 2004; Law et al., 2009), plant distribution in deserts (Eccles et al., 1999), deer distribution (Plante et al., 2004), and bird nest distributions (Melles et al., 2009; McDowall and Lynch, 2017). However, in the marine environment, quantifying spatial faunal patterns remains more challenging due to the technical difficulties of collecting precise positional data of biological observations.
Recently, point pattern analyses (PPAs) have gained traction in the study of intertidal and subtidal marine habitats, in tandem with advancing technologies and survey capabilities. For example, the use of image mosaicing and 3D photogrammetry [Structure from Motion (SfM)] in subtidal and intertidal waters has become more widespread, based on a range of camera platforms deployed by SCUBA diving (Burns et al., 2015), snorkelling (Leon et al., 2015; Pizarro et al., 2017), remotely operated vehicles (ROVs) (Robert et al., 2017; Price et al., 2019; Lim et al., 2020), autonomous underwater vehicles (AUVs) (Friedman et al., 2012; Ling et al., 2016), unmanned aerial vehicles (UAVs) (Casella et al., 2017; Murfitt et al., 2017), and unmanned surface vehicles (USVs) (Raber and Schill, 2019). The use of image mosaicing and SfM has improved our ability to accurately register each organism’s relative position. Using these imaging techniques, we can assess the habitat distribution with full coverage and carry out a census of all organisms present, which is required to undertake PPA. PPA, for example, has been used to quantify and characterise species-host relationships and clustering of host sponges and associated Goby species in shallow-water coral reefs (Lesneski et al., 2019). On an even finer scale, single images were used to identify clustering patterns of the acorn barnacle, Semibalanus balanoides, which was driven by life history and competition (Hooper and Eichhorn, 2016). Edwards et al. (2017) used image mosaics to identify various spatial patterns of scleractinian coral on a shallow-water coral reef, citing inter-specific reproduction methods that contributed to the observed clustered patterns (CPs). In deep-sea environments, whilst aggregations of mobile benthic organisms (e.g., Morgan and Baco, 2019), and sessile organisms (e.g., Xavier et al., 2015) have been observed, quantified fine-scale knowledge derived from PPA is lacking, owing to the challenge and expense of collecting image mosaic datasets of high enough quality and resolution. However, more recent research projects using AUVs and ROVs have applied image mosaicing techniques to assess species spatial patterns over hectares of hydrothermal vent, sponge reef and polymetallic nodule field habitats (Thornton et al., 2016; Meyer et al., 2019; Simon-Lledo et al., 2019). Each of those studies revealed species density changes and broad aggregation within the study sites which were attributed to local environmental factors such as mechanical disturbances, physical gradients, and geological processes. Recently, the application of SfM has enabled the quantification of spatial patterns in deep-sea sponges, ophiuroids, and gorgonians, utilising PPA (Prado et al., 2019, 2020; Mitchell and Harris, 2020).
Comparable studies of cold-water coral reef habitats focusing on aggregations and fine-scale spatial patterns are so far rare (e.g., Conti et al., 2019). Cold-water corals are ecosystem engineers and can form ecologically important biogenic reefs influencing local biodiversity (Jensen and Frederiksen, 1992; Mortensen et al., 1995; Costello et al., 2005; Purser et al., 2013; Henry and Roberts, 2017) by providing hard substrate and 3D structural complexity (Buhl-Mortensen et al., 2010; Price et al., 2019). Understanding ecological processes of cold-water coral reef habitats is important as they are classified as “vulnerable marine ecosystems (VME)” (United Nations General Assembly Resolution 61/105; FAO, 2009), and are sensitive to anthropogenic impacts such as fishing (Wheeler et al., 2005a; Davies et al., 2007; Jackson et al., 2014; Huvenne et al., 2016) and ocean acidification (Turley et al., 2007; Hennige et al., 2015). Whilst broad-scale spatial ecological niche analyses have been used in species distribution modelling to interpolate and extrapolate observations over scales of metres to 100 of kilometres (Davies et al., 2008; Dolan et al., 2008; Davies and Guinotte, 2011; Ross and Howell, 2013; De Clippele et al., 2017; Bargain et al., 2018; Lo Iacono et al., 2018; Barbosa et al., 2019; Pearman et al., 2020) linking the coral presence to their environment, finer scale full-coverage studies have seldom been undertaken on cold-water coral reef habitats. The scarcity of such fine-scale data is partly due to the high flow velocities, turbidity and complex terrain associated with cold-water coral reefs, which make it difficult for survey platforms such as ROVs and AUVs to navigate and collect suitable full-coverage imagery.
Nevertheless, photomosaics and 3D reconstructions have been used to visualise and characterise scleractinian cold-water coral habitats (Wheeler et al., 2005b,c; Lessard-Pilon et al., 2010; Vertino et al., 2010), derive their geomorphic properties (Robert et al., 2017, 2019; Price et al., 2019), detect colony size (Fabri et al., 2019) and create substrate/coral cover maps (Lim et al., 2017, 2020; Conti et al., 2019). However, so far these datasets have not been analysed with PPA, and thus relatively little is known about fine scale spatial organisation of reef building coral and reef inhabitants. PPA and 1-D second order clustering statistics of azooxanthelate corals have been undertaken, detecting CPs of soft corals and the scleractinian reef builder Madrepora oculata (Orejas et al., 2009; Gori et al., 2011; Prado et al., 2019) over of tens of metres. However, these studies lacked quantitative sub-metric information of their local spatial environment and thus the reasons for the observed clustering, such as substrate availability, hydrodynamics and food availability could only be inferred. Furthermore, it is unknown how the two main cold-water coral reef building species [Desmophyllum pertusum, synonym: Lophelia pertusa (Addamo et al., 2016) and M. oculata] in the NE Atlantic are organised on a fine scale. Whilst their broad scale distributions differ slightly, their ecological niches overlap in the NE Atlantic region and they are often found developing reefs together and occasionally demonstrating the ability to form “false chimaeras” and “twin colonies” (Arnaud-Haond et al., 2017; Corbera et al., 2019). However, it is unknown how the two species are distributed within a reef biogenic structure. Overall, little is known about how and if organisms found in association with reefs cluster within, toward or away from reef structures.
We addressed these knowledge gaps by applying SfM methods to create high-resolution 3D reconstructions and orthomosaics of a cold-water coral reef, in order to apply landscape ecological descriptors and statistics, based on PPA. We aimed to identify whether organisms within cold-water coral framework habitat demonstrate a random distribution, or if local scale habitat variation and biological clustering drives aggregation patterns. The Piddington Mound (NE Atlantic) was chosen for this study and the mound is dynamic having shown signs of change in terms of coral cover over 4 years (Lim et al., 2018a; Boolukos et al., 2019). This reinforces the urgency to fully understand these habitats so that we can better discern and quantify human-related degradation, due to the habitats’ vulnerability to anthropogenic impacts, distinctly from natural variation. We tested four complementary hypotheses (1) higher densities of associated species are found within the reef substrate area compared to the surrounding habitat; (2) D. pertusum and M. oculata occupy different parts of the reef; (3) organisms biologically cluster within habitats, in addition to environmentally driven clustering; (4) organisms occupying the coral framework specifically cluster in the more structurally complex areas of the reef.
Materials and Methods
Location
The Piddington Mound is a small cold-water coral mound (60 × 40 m laterally, 12 m in height) found in the Belgica Mound Province (BMP) in the Porcupine Seabight, NE Atlantic (Figure 1). The region contains many mound structures and reefs formed by D. pertusum and M. oculata (De Mol et al., 2002; Wheeler et al., 2007), including numerous mini-mounds, known as the Moira Mounds (Wheeler et al., 2005b; Foubert et al., 2011; Wheeler et al., 2011). The mini-mounds range in height from 3 to 15 m and local currents are estimated to reach between 34 and 40 cm s–1 (Dorschel et al., 2007; Lim et al., 2018b), with a south to north prevailing current. The Piddington Mound was chosen for this study as it (and the local area) has been extensively studied, mapped and monitored at scales from metres to centimetres (Lim et al., 2017, 2018a,b; Conti et al., 2019). This work was undertaken as part of the VENTuRE survey in Wheeler and Shipboard Party (2011), and the mound was photomosaiced using a scale invariant feature transformation algorithm (SIFT), to create a high-resolution habitat map classified into the categories “hemipelagic sediment”, “hemipelagic sediment with dropstones”, “live coral framework”, “dead coral framework” and “coral rubble” (Lim et al., 2017).
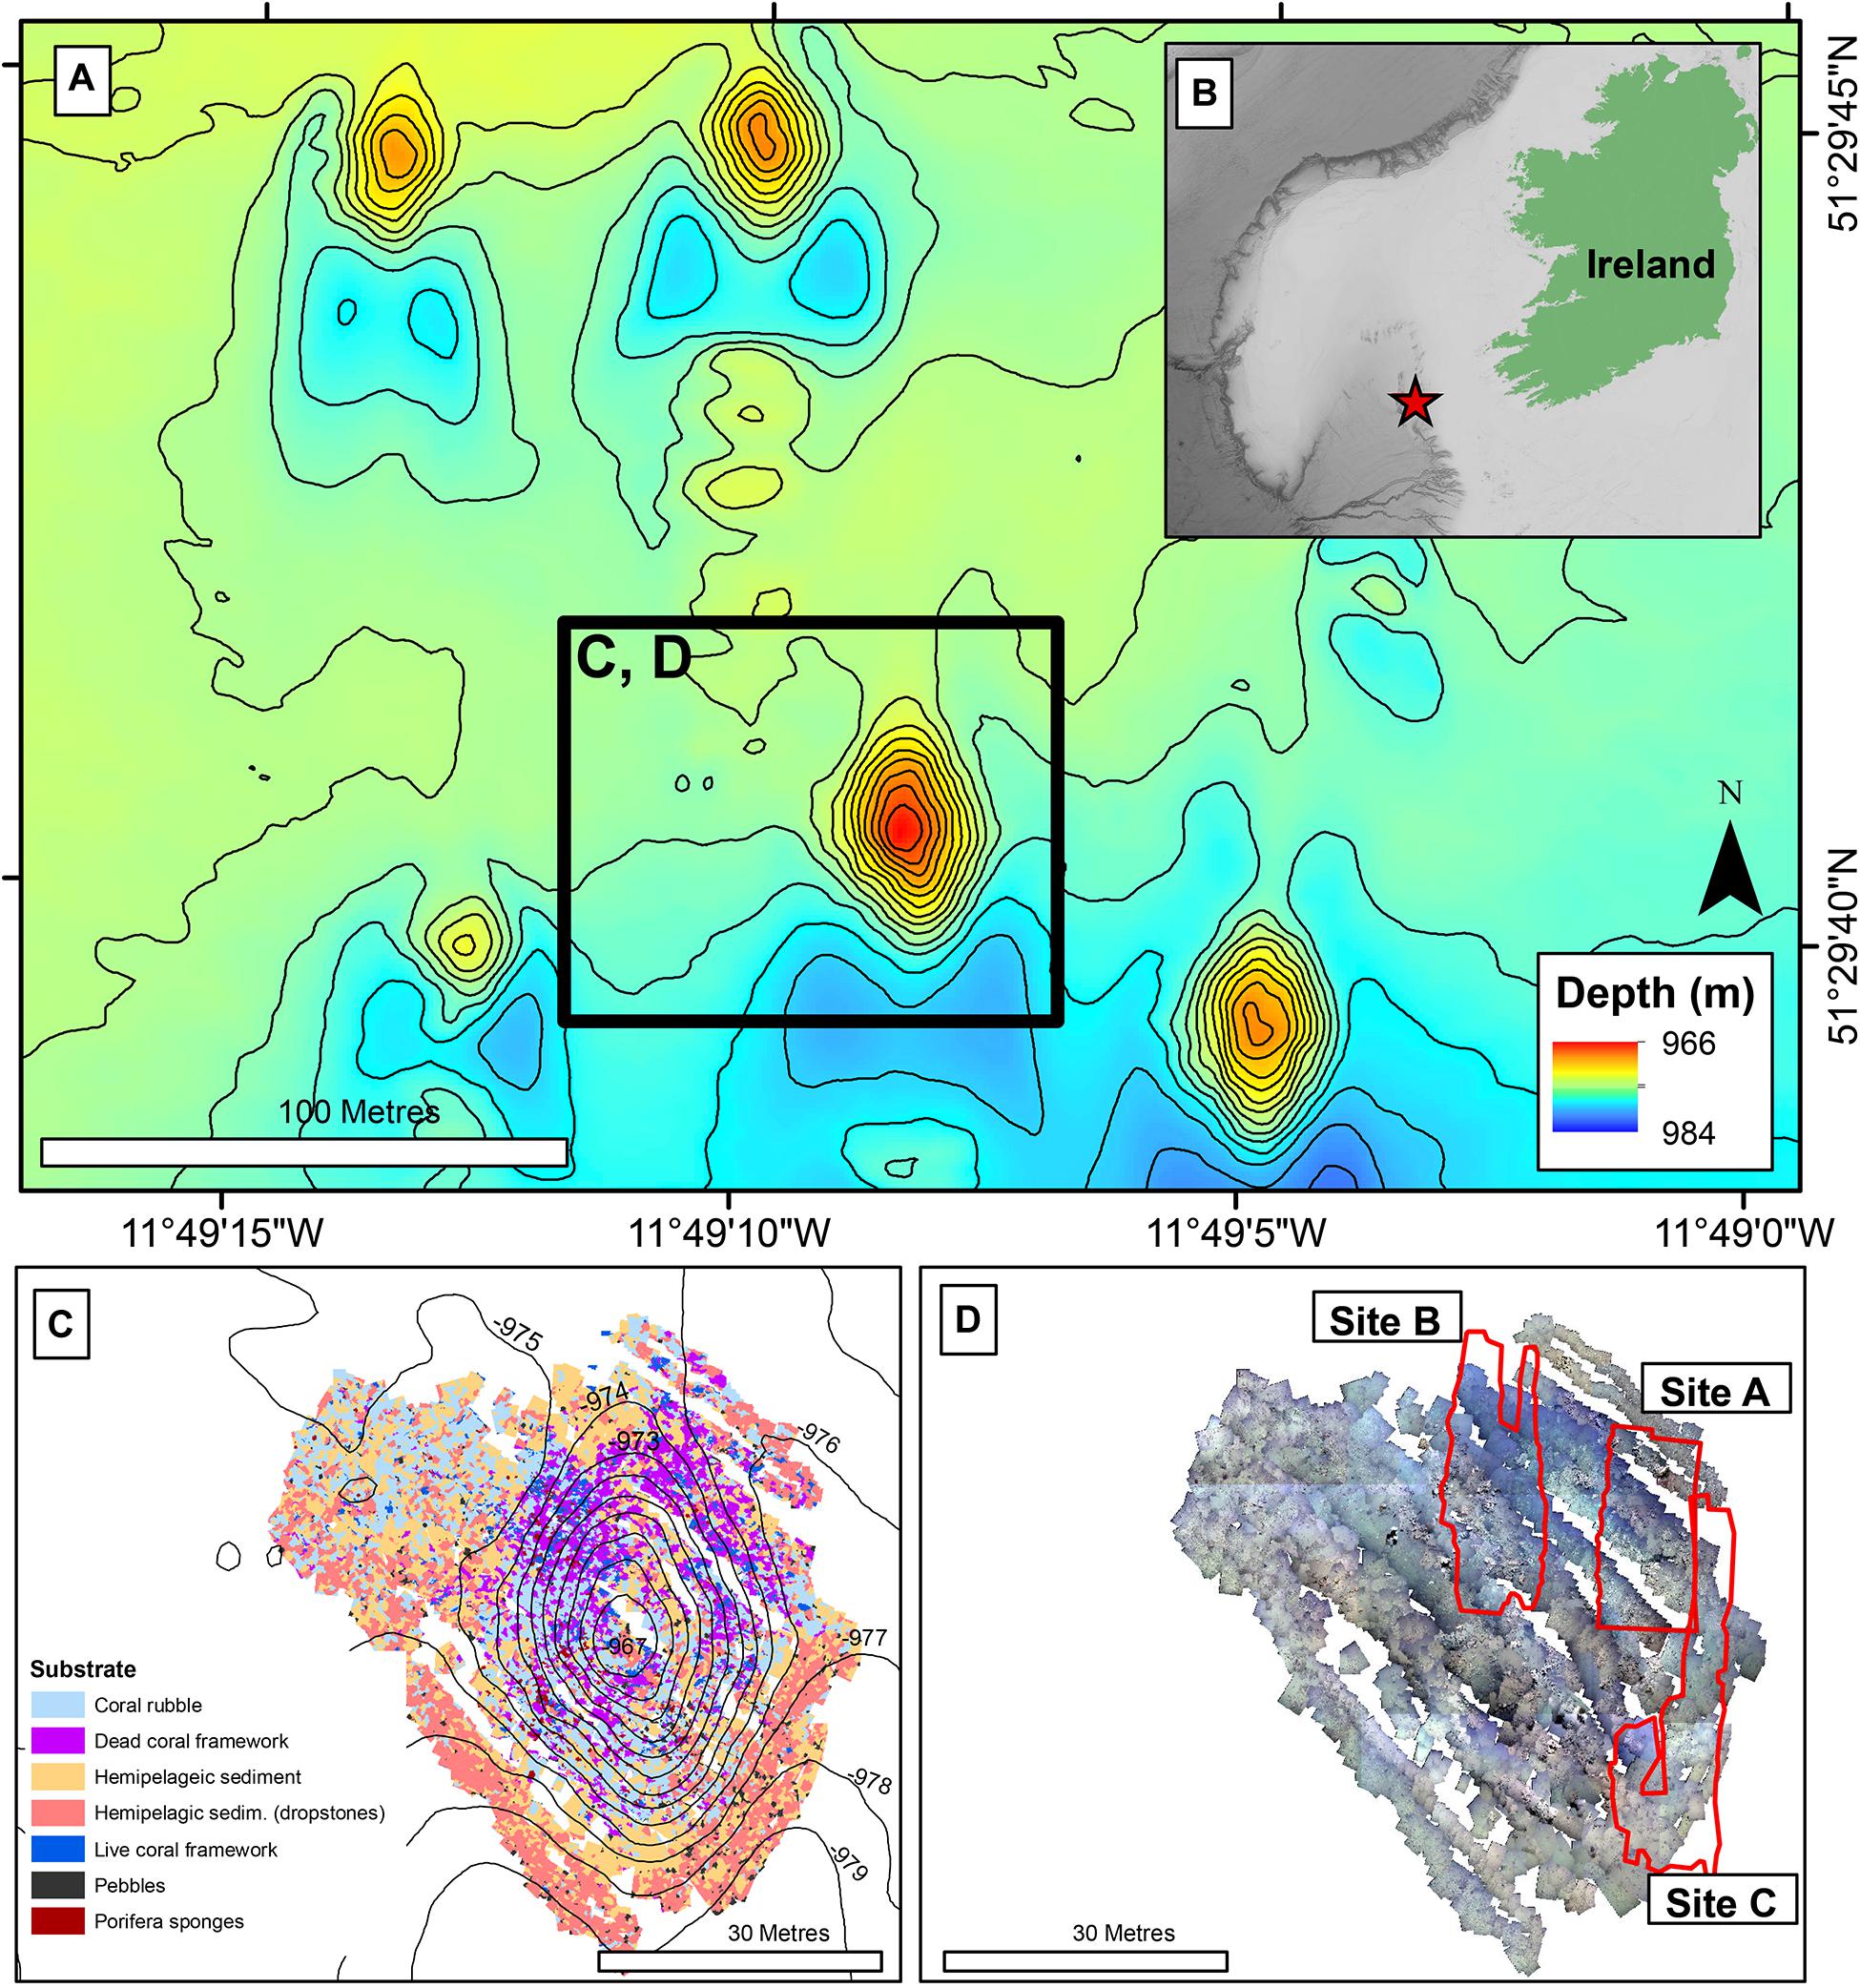
Figure 1. Location map: (A) Bathymetry (contour interval 1 m) of Moira Mound region showing Piddington Mound (within black square). Black square represents panel (C,D); (B) Regional map. Red star indicates the Location of Moira Mound region. (C) Substrate map, contour interval: 1 m (data from Conti et al., 2019); (D) Photomosaic of Piddington Mound (data from Lim et al., 2017), with Site A, B, and C showing the areas of interests for the current study.
Video Survey
The data were acquired during the QuERCi cruise (Wheeler and Shipboard Party, 2015), undertaken in 2015 on RV Celtic Explorer with the Holland 1 ROV. A 36-h ROV dive was undertaken in order to collect HD video over the same area presented in Lim et al. (2017) in a lawn-mower pattern. The ROV was equipped with a vertical-downward facing HD camera (Kongsberg Maritime OE14-502a HDTV inspection camera recording at 1080 p) mounted to the front of the ROV frame. The ROV was also fitted with 8× variable intensity 250 watt halogens, 2 × 400 watt DSPL CARC2 HMI and 2 × 25,000 Lumen APHOS LED lights (Cathx Ocean) to illuminate the seafloor and 2 red lasers spaced 10 cm apart to provide scale marks in the imagery. The ROV was manoeuvred at a low altitude using a Tritech altimeter to maintain the ROV approximately 2 m above the seafloor and ensure organisms were observed from a constant distance to make sure that species observed were of a consistent minimum resolvable size throughout the survey. The survey lines were oriented north to south where the ROV camera position would be spaced ~40 cm apart to collect >60% image overlap required for SfM processing. Currents and turbidity reduced our ability to image the entire mound and instead three areas were mapped. Site A was located on the NE part of the mound and spanned coral reef and sandy habitats (Figure 1D). Site B was located on the north of the mound and spanned the flank from the base to the top (Figure 1D). Site C was SE of the mound and consisted predominantly of sand with some coral rubble found at the base of the mound (Figure 1D).
Structure From Motion
One image per second was extracted from the video using the 3D computer graphics software Blender (V2.78) to create a ∼2 megapixel image sequence. Images were enhanced in Photoshop CS6, by de-interlacing and raising the shadow values to increase exposure in the shaded areas on the periphery of the lighting and camera field of view, improving the 2D mosaic visuals. Agisoft Metashape (version 1.5.2; previously known as Photoscan) was chosen to create 3D models of the reef as it has been used in several marine habitat studies (Burns et al., 2015; Leon et al., 2015; Bennecke et al., 2016; Robert et al., 2017; Young et al., 2017; Bayley et al., 2019; Price et al., 2019; Lim et al., 2020), proving to be reliable and accurate software (Burns and Delparte, 2017). High image alignment accuracy was chosen to utilise the full resolution image. Where alignment produced artefacts between the different survey lines, alignment was reset and added sequentially, i.e., line by line. Once aligned, dense point clouds were created, using low quality settings, as well as digital elevation models (DEM) and orthomosaics. The low quality setting was deemed sufficient as a DEM of 6–7 mm per pixel was produced. A minimum of 25 scaling points were distributed across each of the models based upon the laser scales (10 cm). Additionally, several georeferencing points were added by feature matching with the mosaic created by Lim et al. (2017) and a high resolution multibeam echosounder dataset (Lim et al., 2018b). This method was chosen as the navigation for this dive proved unreliable and accumulation of positioning errors tended to occur along each line as observed by Price et al. (2019). The models were then optimised, and the dense clouds recreated. Finally, the orthomosaics and DEMs were exported as geotiffs (Table 1). An outer boundary was used to create a window for each site within which all further analysis would be undertaken by excluding dark edges of the mosaics and areas where transect lines did not link well enough. The DEMs and orthomosaics were generated at the highest resolution (pixel size: 6–9 mm; Table 1).
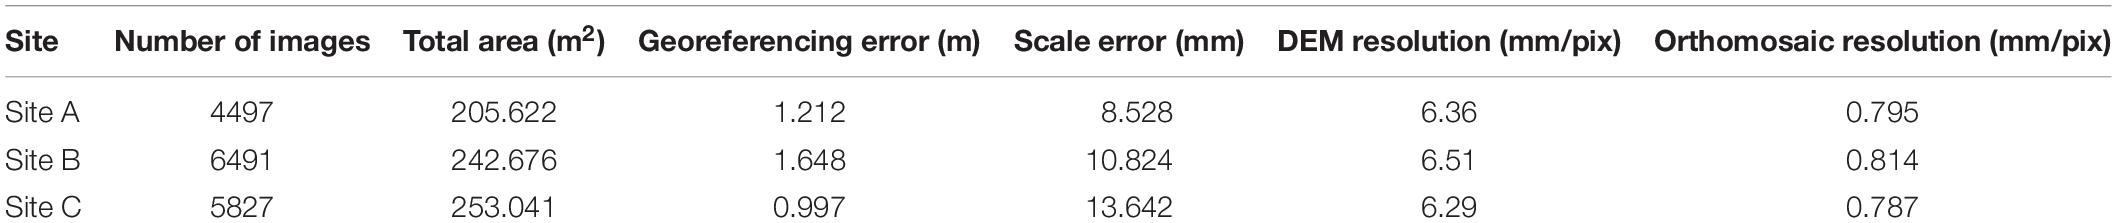
Table 1. Meta-data of the 3D reconstructions.
Substrate Map
The orthomosaics and DEMs were projected to UTM 29N, Datum WGS84, and derived terrain variables [vector ruggedness measure (VRM), slope and aspect] were generated in ArcMap 10.4.1. Using the estimation scale parameter (ESP) tool in the eCognition software (Dragut et al., 2010), a scale parameter of 300 was identified as the optimum scale value for segmentation. The data were segmented using a multi-resolution segmentation algorithm which merges pixels into “objects.” These objects are created through merging of neighbouring pixels with similar spectral properties in each of the input data layers until a homogeneity threshold, or the value of the scale parameter, is reached.
To classify the objects within the segmented map, two classifiers were chosen: reef (substantial skeleton cover) and non-reef, rather than the detailed facies classified by Lim et al. (2017) and Conti et al. (2019). The reef class was not split into further classes such as reef rubble and 3D framework (as per Lim et al., 2017) due to the subjectivity of this classification. Instead these gradations were later visualised by the continuous rugosity measure of the VRM with a neighbourhood of ~10 cm, of the coral framework. Also, no differentiation between live or dead coral was made for the classification as live coral was manually delineated for subsequent PPA. The segmentation layer was inspected and 150 training samples, visually identified, were chosen for each class in each site, spread equally across the segmented area, similar to Conti et al. (2019). Shape (border index, area, and roundness) and pixel (mean, maximum difference, and standard deviation of pixel values within the objects) values for each of the layers (Red, Green, Blue, DEM, VRM, slope, and aspect) within individual objects were calculated. The eCognition Nearest Neighbour classification tool was applied, which classified all objects based on their closeness to the training samples from the values defined in the Nearest Neighbour feature space. The classified objects were exported as a single substrate shapefile. Using the outputs from the substrate map in polygon format, reef and non-reef areas were isolated and frequency histograms were generated to demonstrate the different rugosity values in the form of VRM.
Annotation
Organisms (Table 2) were geotagged in Agisoft Metashape using the orthomosaic unless obscured (stitch distortion, blur or high ROV altitude), in which case the original images were used to identify the specific location of the organism. The selection of organisms analysed in this study were chosen based on their abundance to ensure a statistical robustness and on the annotators’ capability to consistently identify them (Table 2). Some species were either too small and/or featureless (Hexadella sp.), too mobile (fishes) or rare to consider for spatial pattern analysis (e.g., Porania cf. pulvillus, Ceramaster sp., and Phelliactis sp.). The minimum resolvable organism size was 20 mm. The point of substrate attachment was chosen to geotag elongate organisms such as Stichopathes sp., Callogorgia sp., Alcyonacea spp., and Aphrocallistes sp. with an elongate morphology. Live D. pertusum and M. oculata were identified by observing extruded polyps or if the tissue was orange or white; a polygon was drawn around the colony and the centre of the colony tagged to utilise as point data (Edwards et al., 2017). Creating a point pattern from these polygons was valid as all living coral patches were small and collectively cover less than 5% of Piddington Mound (Boolukos et al., 2019; Conti et al., 2019). Finally, Acanthogorgia sp. and Plexauridae sp. were concatenated to Alcyonacea spp., as the image quality and angle was not conducive to a consistent identification between the two species.
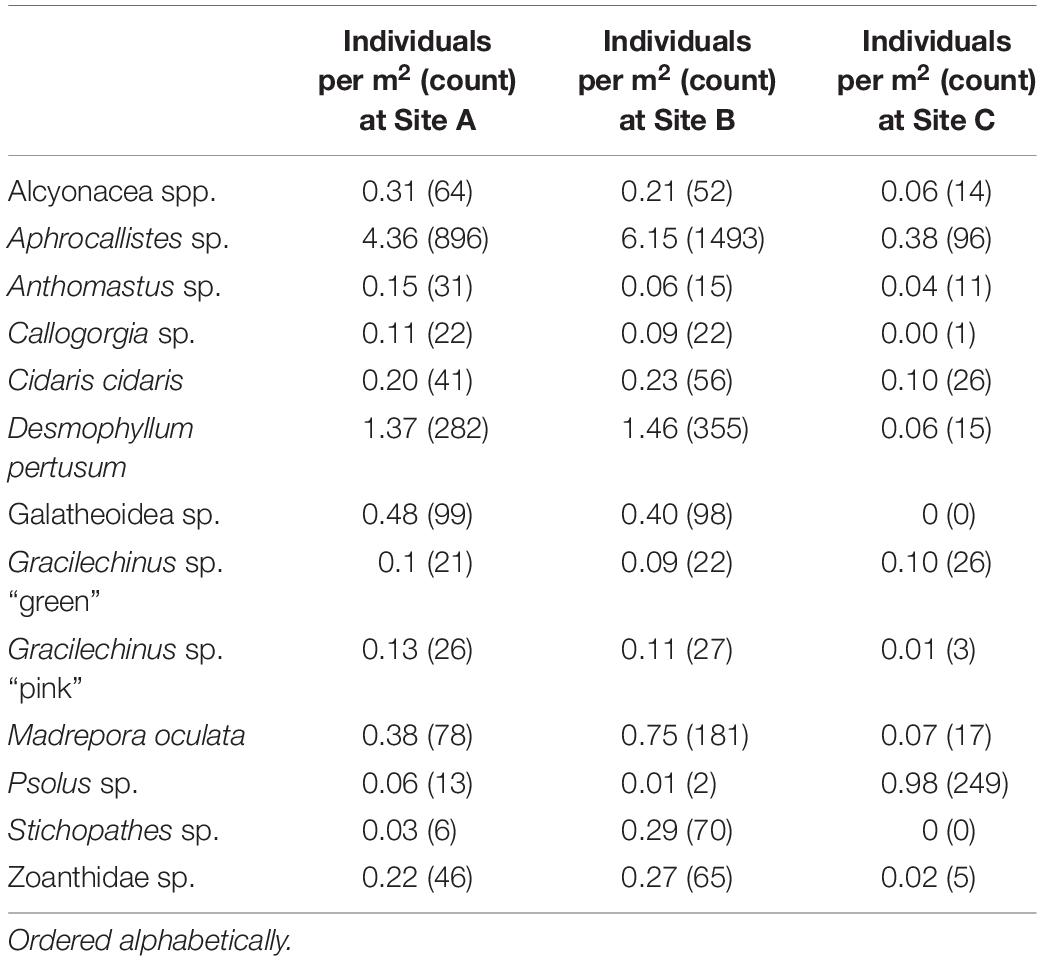
Table 2. Organism densities from Site A, B, and C.
Statistics
Three methods were used to describe and quantify the spatial point patterns of each species, using the spatstat package (Baddeley et al., 2015) in R-3.3.2. First, we created density plots of the organisms using a fixed-bandwidth kernel estimate of the intensity function. A sigma value of 1 m was used to create the kernel density plots. The density plots were visually assessed for affinity to regions with plentiful coral cover. Secondly, an inhomogeneous pair correlation function (PCF) (Illian et al., 2008; Law et al., 2009) was utilised as a multiscale descriptor of the point pattern. The PCF (g(r)) is from the first derivative of Ripley’s K function (Ripley, 1977), a descriptor used to quantify the number of points expected within distance r divided by intensity λ (Eq. 1). PCF (g(r)) reduces cumulative effects of an expanding radius, by utilising a 2-D torus shape to define a point registration field. This analysis describes the density of the species at increasing distance (r) from a representative focal point, thus providing visualisation of any clustering of the animals.
where K(r) describes the point pattern characteristics across the scales. λ is “intensity” (number of events per unit area). E is the number of individuals within the distance r, of a randomly chosen event. g(r) is calculated using Eq. 2.
where K′(r) is the derivative of k(r) in relation to r. The PCFs were compared to null models representing inhomogeneous point processes. An inhomogeneous PCF approach was undertaken as Pearson’s X2 goodness-of-fit and visualisation of the intensity revealed broad-scale gradients of organism distribution, likely derived from the heterogeneity of a cold-water coral reef habitat. An inhomogeneous PCF utilises the kernel bandwidth intensity to offset organism clusters that may be influenced by broader environmental drivers. A sigma value of 1 was used which was assessed visually as we have no prior knowledge of suitable values; subsequent analyses confirmed that this scale was sufficient for capturing pattern features. The point patterns were compared with 999 Monte Carlo simulations of an inhomogeneous pattern (IP), with envelopes constructed to illustrated the 25th largest and smallest rank, thereby encompassing 95% of null model simulations (α = 0.05). Any deviations above the envelopes would demonstrate clustering/aggregation of the species. Deviations below the critical band would infer that the species are over-dispersed, indicating their distribution is more dispersed than expected. As the point pattern process is generated within a defined region of interest, an edge correction is required to avoid biases in the PCF outputs. The command “best” implemented by spatstat was used to test each method (such as Ripley’s isotropic edge correction and translation) to identify the most statistically robust correction (Baddeley et al., 2015). The PCF was undertaken for species of which more than 70 individuals were counted within a study site.
Point pattern modelling (PPM), was deployed to quantify clustering derived from underlying environmental parameters and biological mechanisms, following the outline provided by Edwards et al. (2017). We compared four species distribution patterns: (1) complete spatial randomness (CSR), (2) organism distribution and clustering driven by habitat availability and suitability creating an IP, (3) biologically driven clustering influenced by biotic processes that limit or steer dispersion, e.g., fragmentation, leading to a homogeneous CP, and (4) a combination of clustering driven by biological and environmental factors leading to an inhomogeneous clustered pattern (ICP). The four species patterns considered (CSR, IP, CP, and ICP) directly test our hypotheses 3 and 4 by associating species point pattern with biotic and abiotic distribution drivers. PPMs are analogous to generalised linear models (GLM), and input variables (environmental drivers and clustering) can be used to improve the model where suitable. Environmental drivers were derived from the entire DEM and classification outputs. VRM, a known influencer of cold-water coral reef communities (Price et al., 2019), was calculated at two scales (1) 7 mm pixel with a 15 pixel neighbourhood size and (2) 50 cm pixel with a 3 pixel neighbourhood size, in order to account for any differences related to the scale of rugosity (Richardson et al., 2017). Substrate classification was used as another layer to identify if organisms clustered toward reef substrate. Depth was used to identify if the vertical position on the mound had an influence on point patterns. Northness and eastness was calculated at 50 cm pixel as a measure of aspect because exposure to a particular current direction can influence organism distribution, especially for groups such as suspension feeders that may rely on currents to provide food and refresh intermediate water layers. The variables used depended on the number of organisms available to model. When less than 50 individuals were available, a simpler PPM including VRM (7 mm and 50 cm), depth and substrate was used to avoid inundating the model with too many variables. When more than 50 individuals were counted for a specific species at a specific study site, all variables were utilised in the model. For D. pertusum and M. oculata point patterns, the VRM at 7 mm pixel with 15 pixel neighbourhood which was used to represent fine-scale rugosity, was not considered, as the rugosity was formed by the living coral themselves. The VRM calculated at 50 cm pixel was retained to account for the possibility that wider-scale underlying rugosity is likely to influence habitat suitability for live patches of reef-building coral, by baffling current velocity (Mienis et al., 2019), a known influencer of feeding efficiency and polyp behaviour (Orejas et al., 2016). The model input variables considered are summarised in Table 3. The models were then treated with a stepwise, drop one procedure to identify the model with the lowest Akaike information criterion (AIC) value, which was used to represent an IP driven by environmental variables.
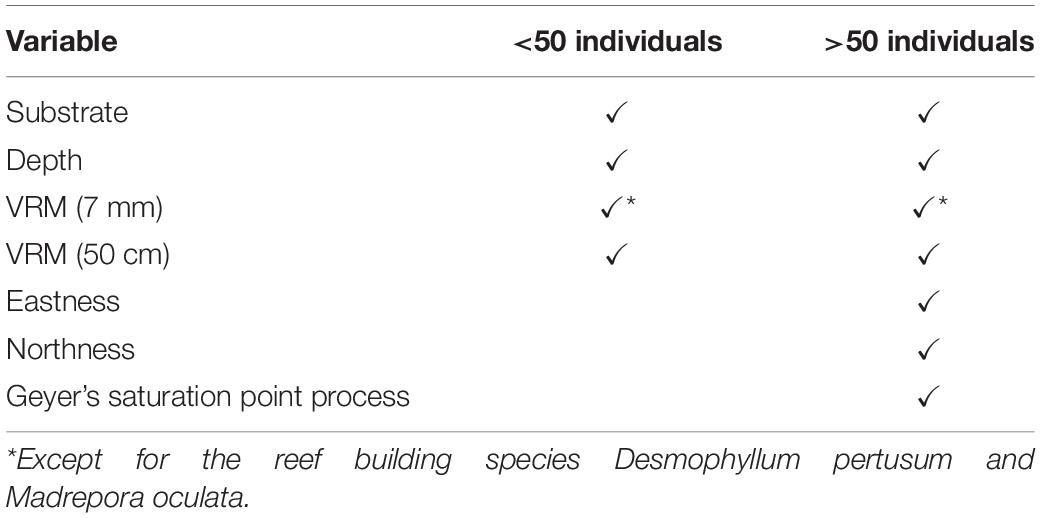
Table 3. The variables considered in the PPM procedures.
Benthic organism patterns can be driven by biological factors such as reproductive methods (Edwards et al., 2017) and competition (Hooper and Eichhorn, 2016). To infer biologically induced clustering, interaction terms between points (i.e., the location of an individual organism) were specified in the form of Geyer’s saturation process (Geyer, 1999), a modification of the Strauss process. The inclusion of a Geyer’s saturation process in the PPM was undertaken on species that were represented by more than 50 individuals, as fewer data inputs led to unclear results. This technique uses the relevant point pattern to create a density field around a given point, to a maximum defined distance. Parameters distance (r) and saturation needs to be specified before use in the PPM. To detect the most appropriate suitable parameters, a maximum pseudolikelihood estimator approach in an incremental, standardised procedure was undertaken. An r of 0.1–1 m with increments of 0.1 m, and saturation of 0.001 (equivalent of CSR) and 1 to 10 in increments of 1 were tested in all combinations. The most suitable parameters were used, based on the lowest AIC value and implemented in the PPMs that specify biological clustering (CP) and biological and environmentally driven clustering (ICP). The ICP model included the Geyers clustering and all environmental variables outlined, with a stepwise drop one procedure used to find the most parsimonious model.
Finally, the best of the four models (CSR, IP, CP, and ICP) determined by AIC value, was endorsed by a likelihood ratio test for the null hypothesis (CSR) against the chosen model, unless the CSR model was considered the best. The outputs provide evidence for if organism distribution is influenced by the presence of reef substrate (Hypothesis 1), if variation within the reef habitat drives some clustering and whether there is evidence of biological clustering (Hypothesises 3 and 4).
To further inspect how variation in the structural complexity of the reef influenced organismal distribution within this coral substrate, a non-parametric curve was fitted (“rhohat”). The non-parametric estimator computes a non-parametric smoother estimate of function (ρ) which identifies how the intensity of points depends on a covariate (Eq. 3).
Where λ(u) is the intensity at location u and Z(u) the spatial covariate at location u. Aphrocallistes sp. was chosen as a model species due to its frequent occurrence on framework and its association with variation in structural complexity was tested at a VRM scale across 10.5 cm (7 mm pixel with 15 pixel neighbourhood; similar to Price et al., 2019). The dependence of ρ on VRM was statistically tested using the Berman’s Z1 test.
Results
The reconstructions of the seafloor were made and exported at their finest resolution (Table 1). Site A contained >60% coral reef substrate cover (Figures 2A,B) with non-reef substrate (sand and occasional dropstones) covering the eastern-most part of the mosaic. Coral reef cover was extensive toward the shallower part of the mound with patches more isolated at the outer boundary of the mound (Figure 2C). At Site B, coral reef covered more than 65% of the mapped area, mostly toward the top of the mound at the south with some non-reef sandy patches toward the north (Figure 3). Site C was located on the south-eastern flank of the mound and had only 14% coral reef cover with the rest consisting of non-reef substrate made up of sand and dropstones (Figure 4). Most VRM values of coral reef substrate typically spanned from 0 to 0.6 at Sites A and B, 0–0.4 at Site C. Overall, coral reef substrate had a greater mean VRM value at Site A and B compared to site C (Figure 5). The highest observed VRM values were 0.8, 0.87, and 0.76 for A, B, and C, respectively, for the coral reef substrate. Non-reef substrate VRM represented over 80%, over 70%, and over 80% of the pixels with VRM values between 0 and 0.05 VRM, the lowest bin, at sites A, B, and C, respectively (Figure 5). The majority of VRM values for non-reef substrate were below 0.1.
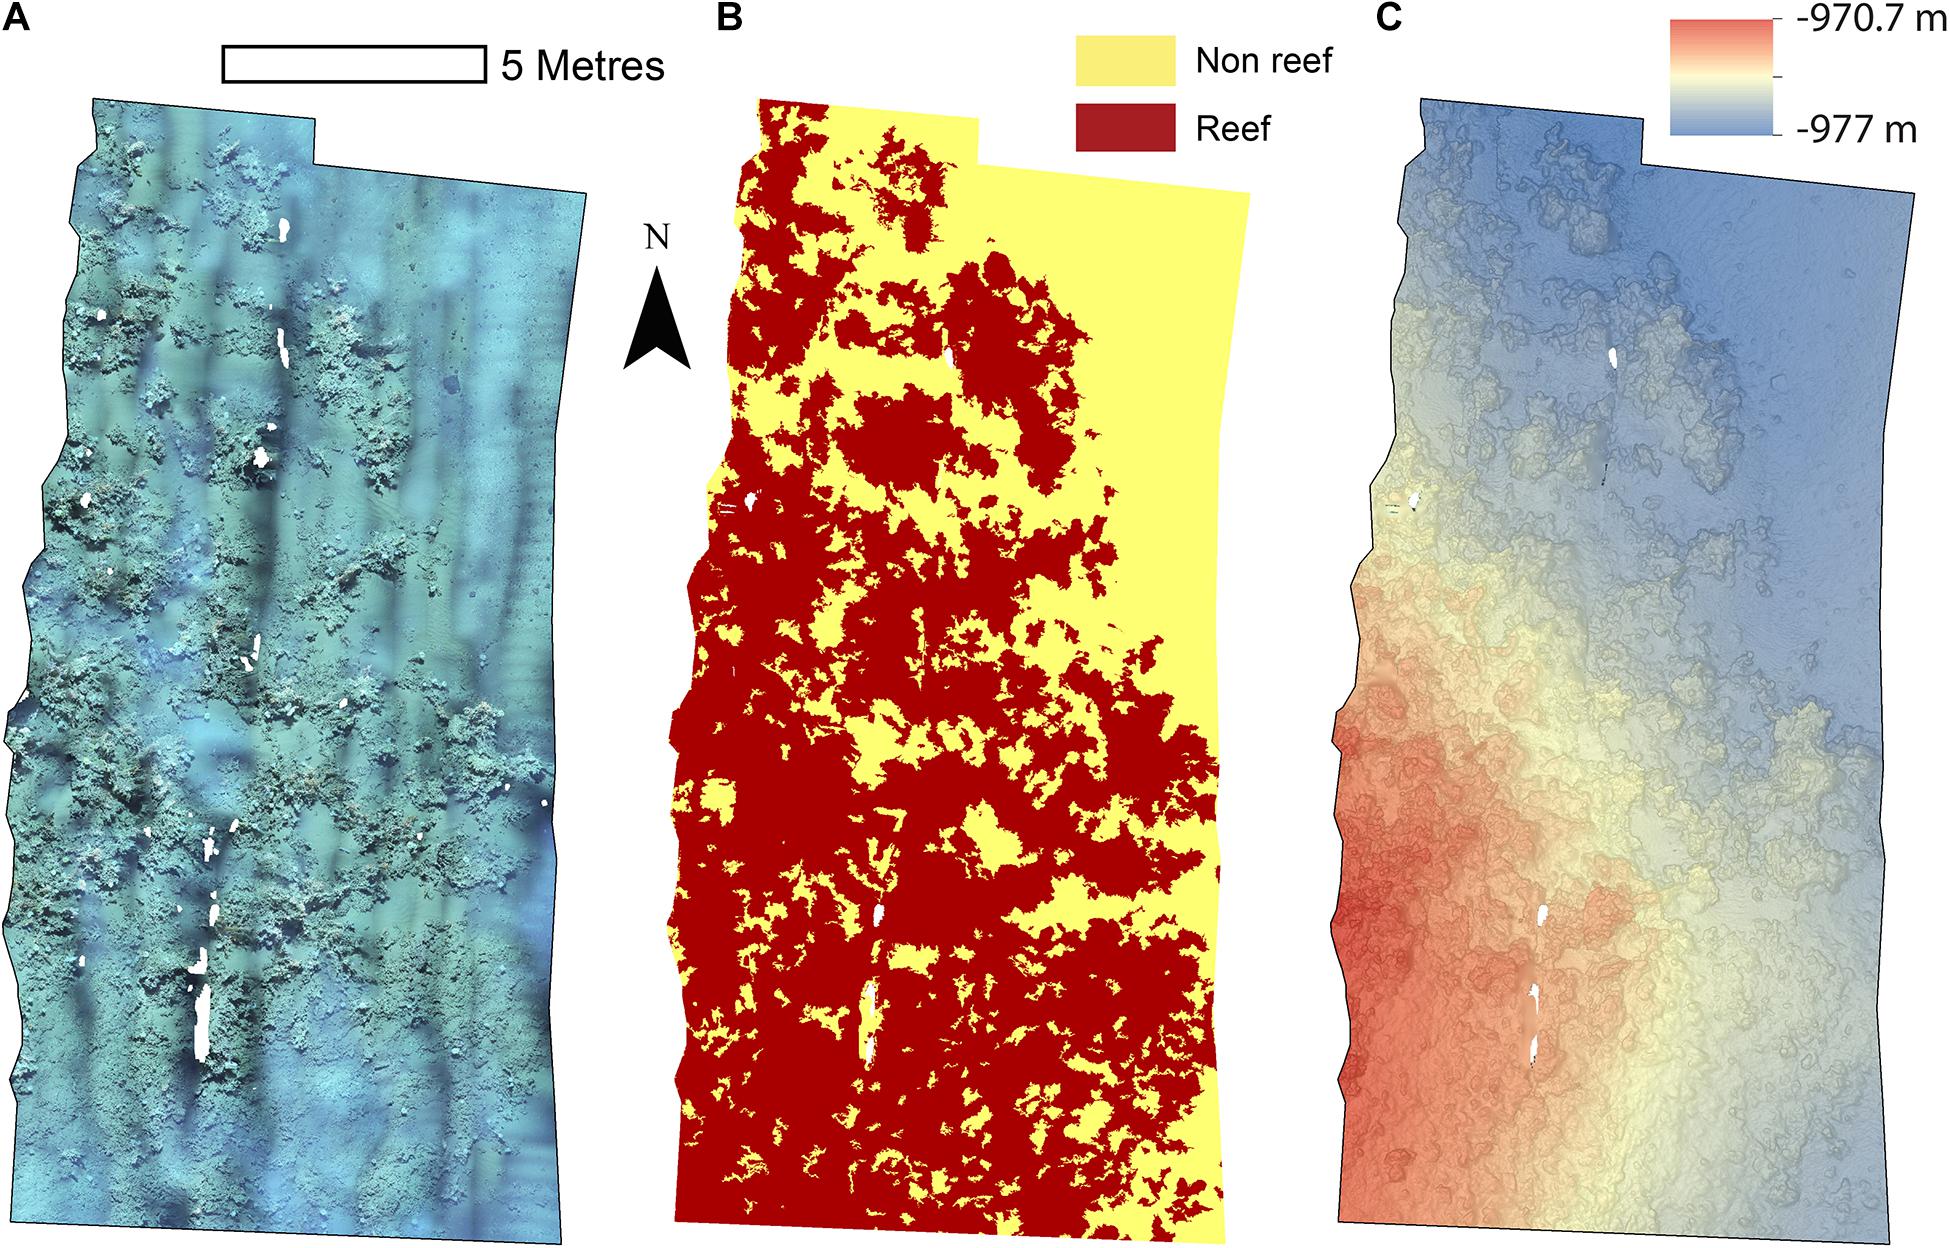
Figure 2. Mosaics of Site A. (A) Orthorectified photomosaic; (B) Classified substrate map; (C) Digital elevation model.
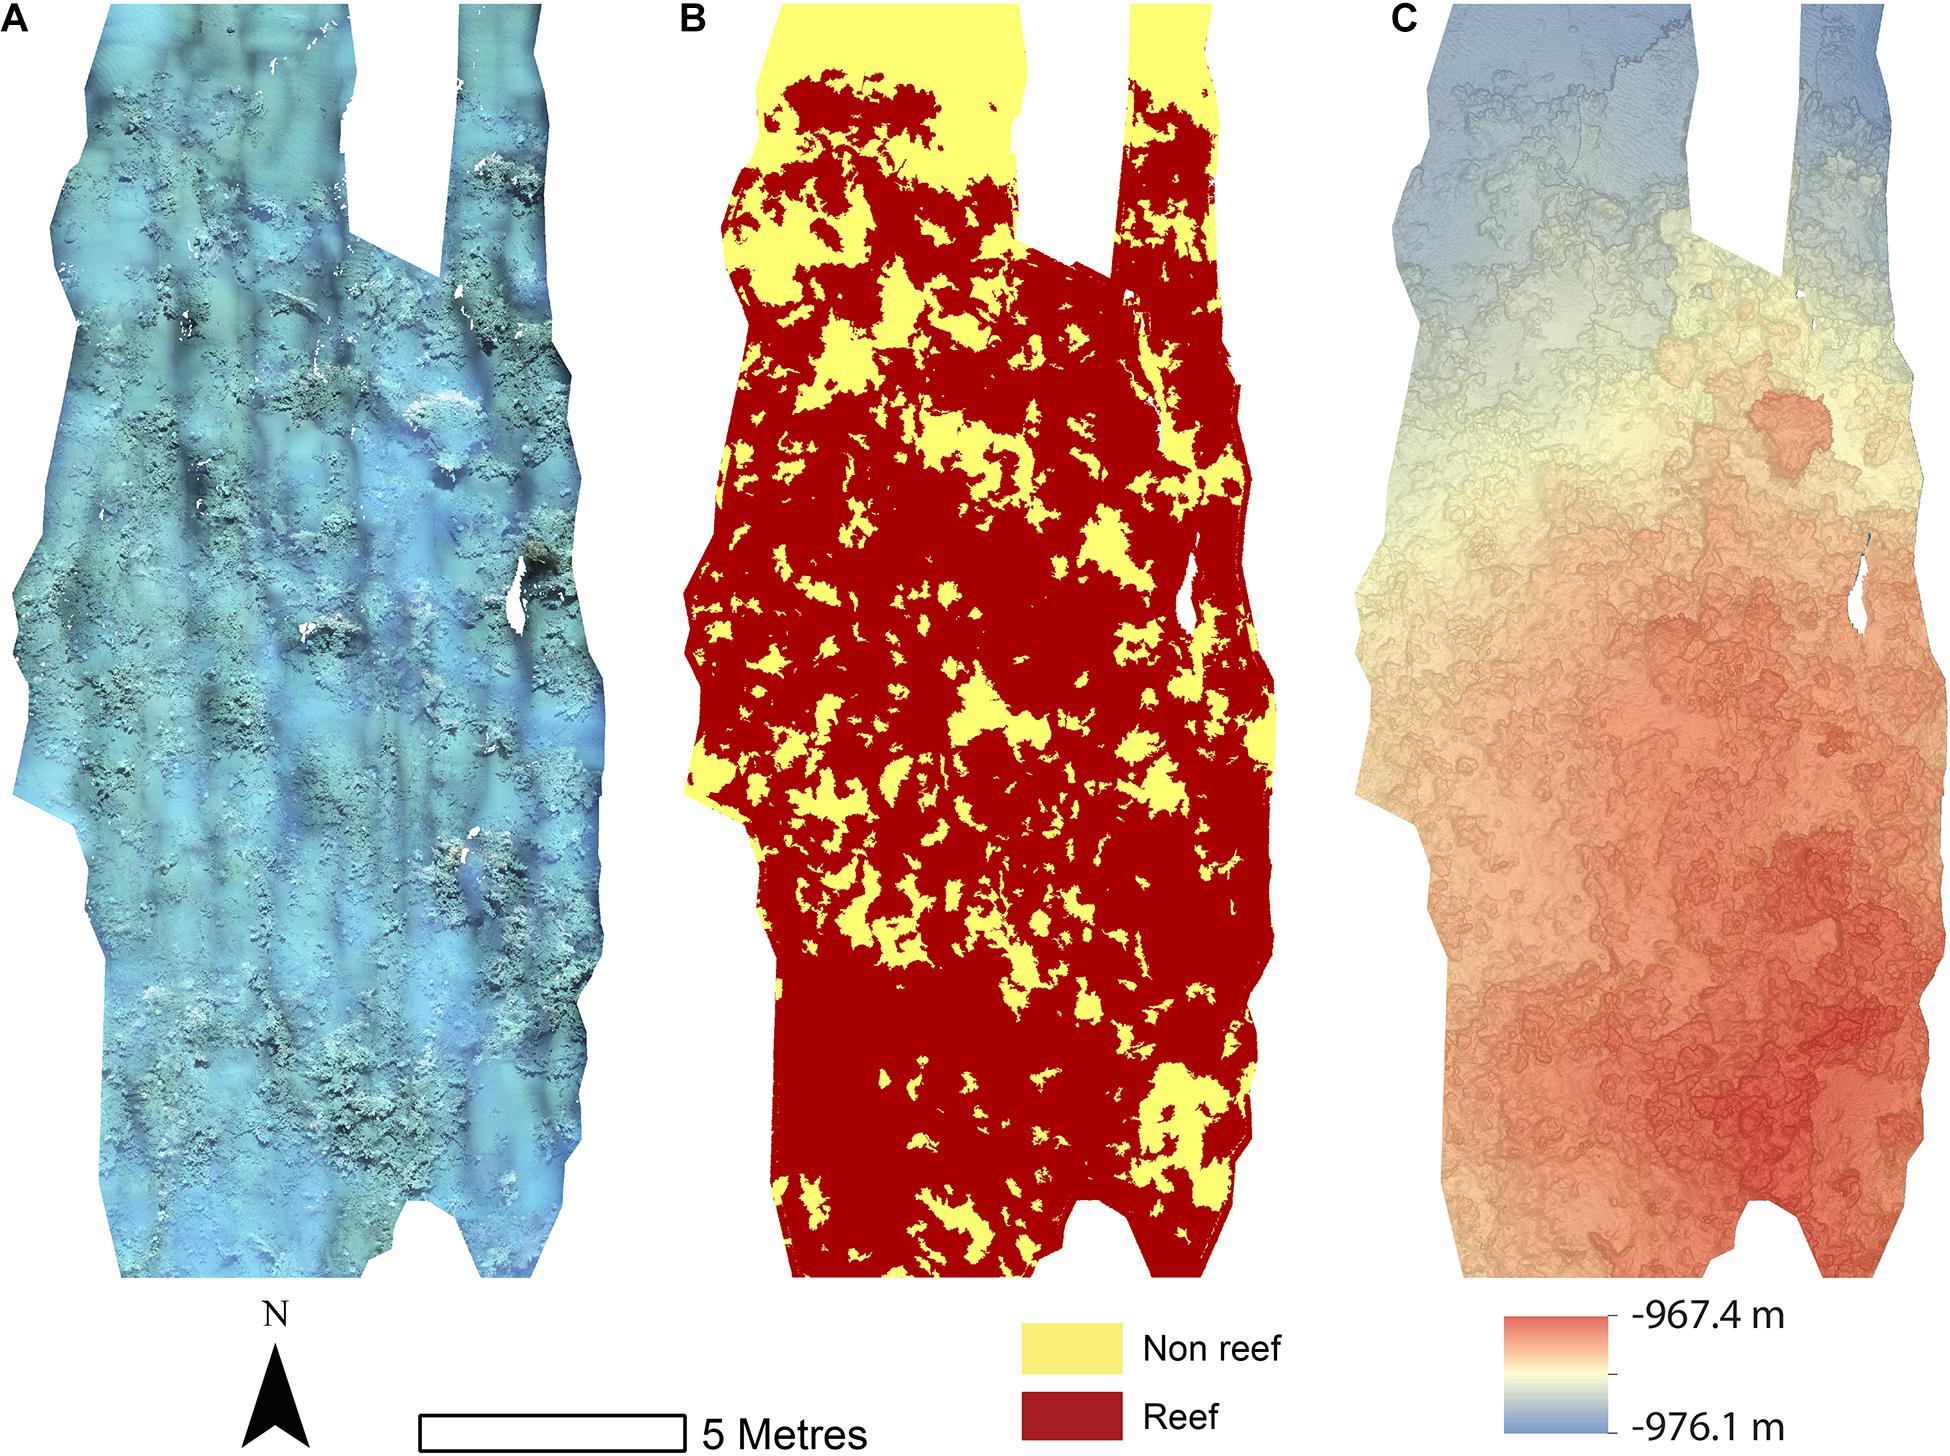
Figure 3. Mosaics of Site B. (A) Orthorectified photomoscaic; (B) Classified substrate map; (C) Digital elevation model.
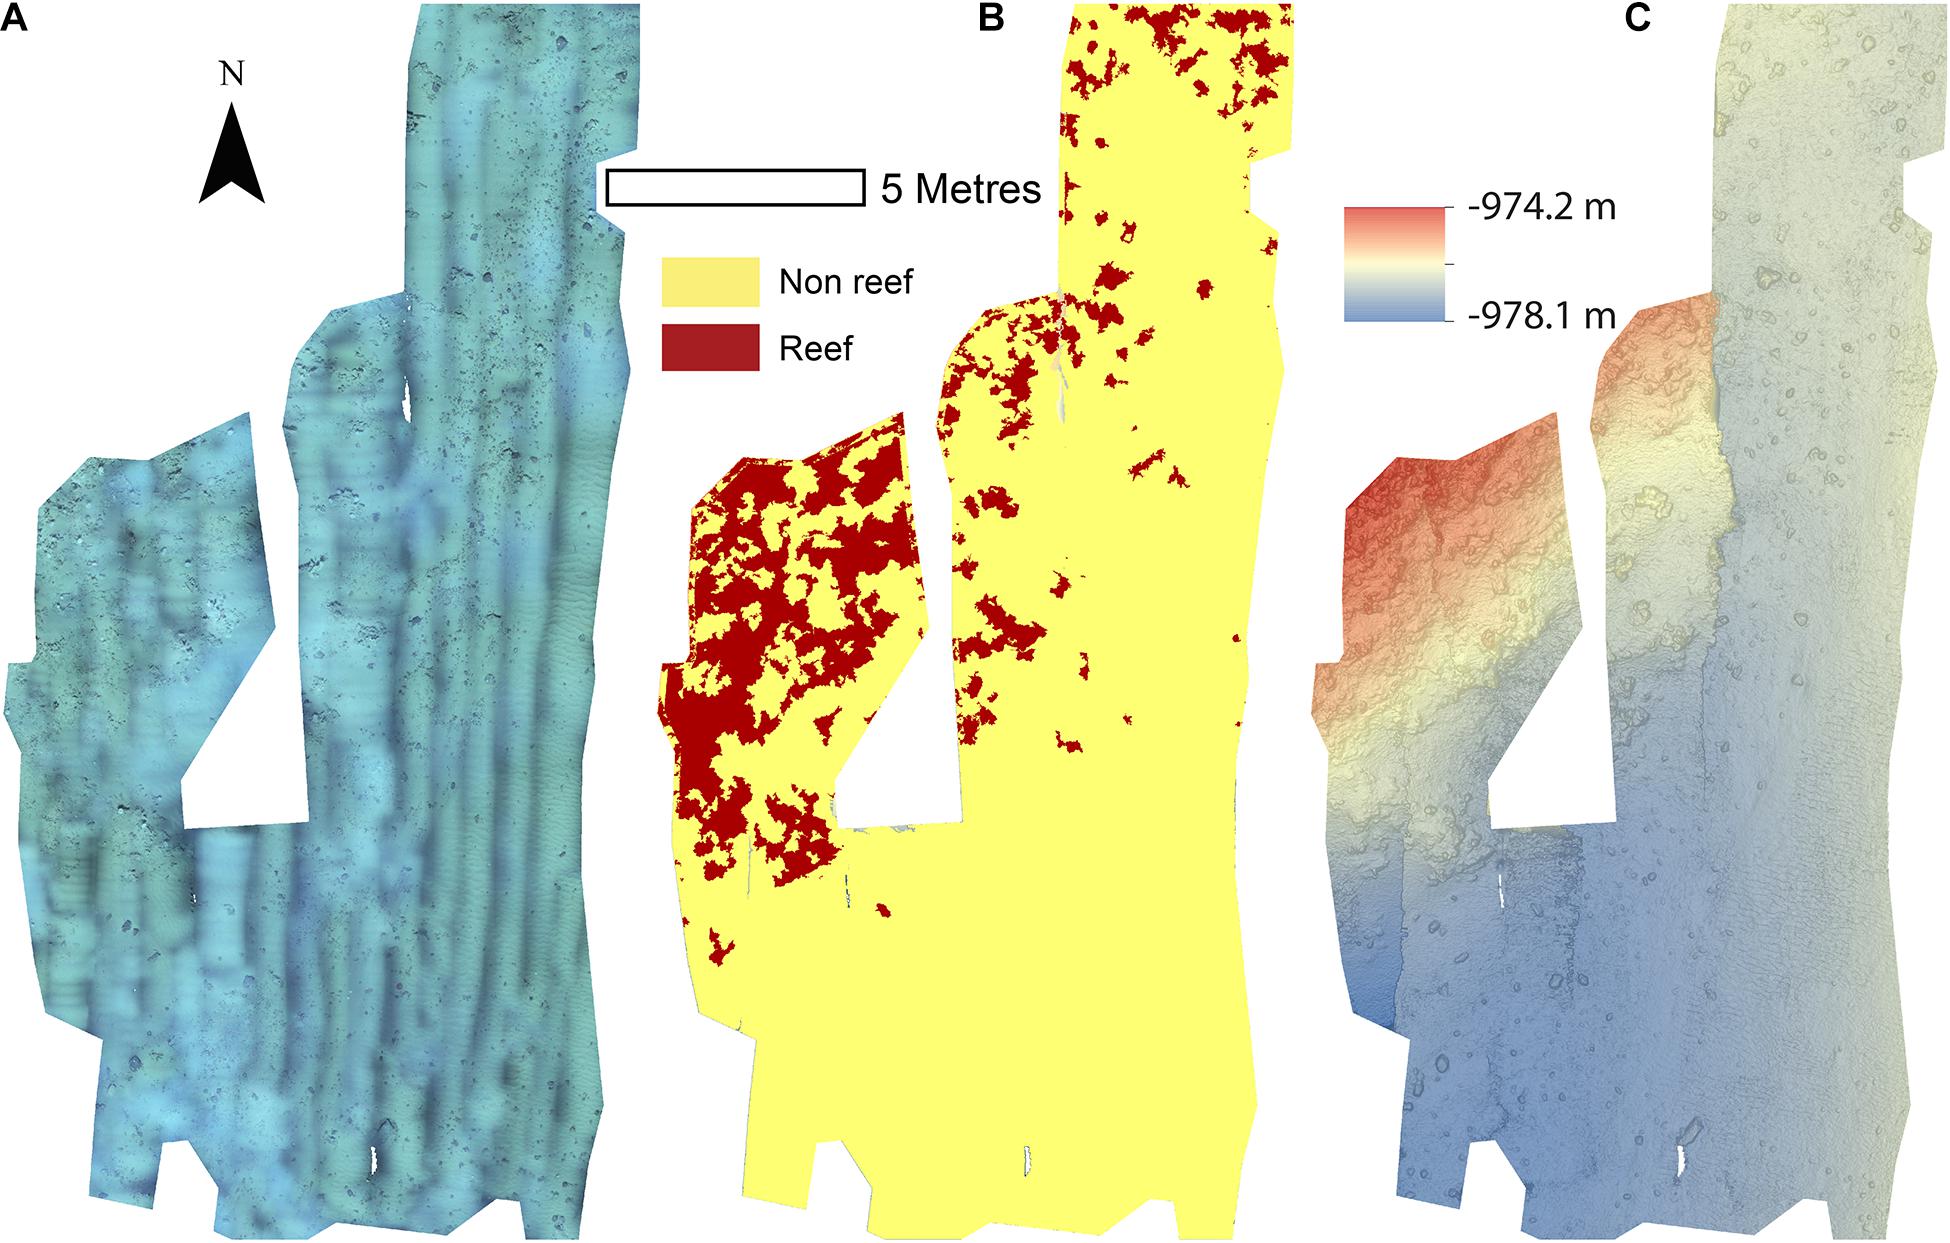
Figure 4. Mosaics of Site C. (A) Orthorectified photomosaic; (B) Classified substrate map; (C) Digital elevation model.
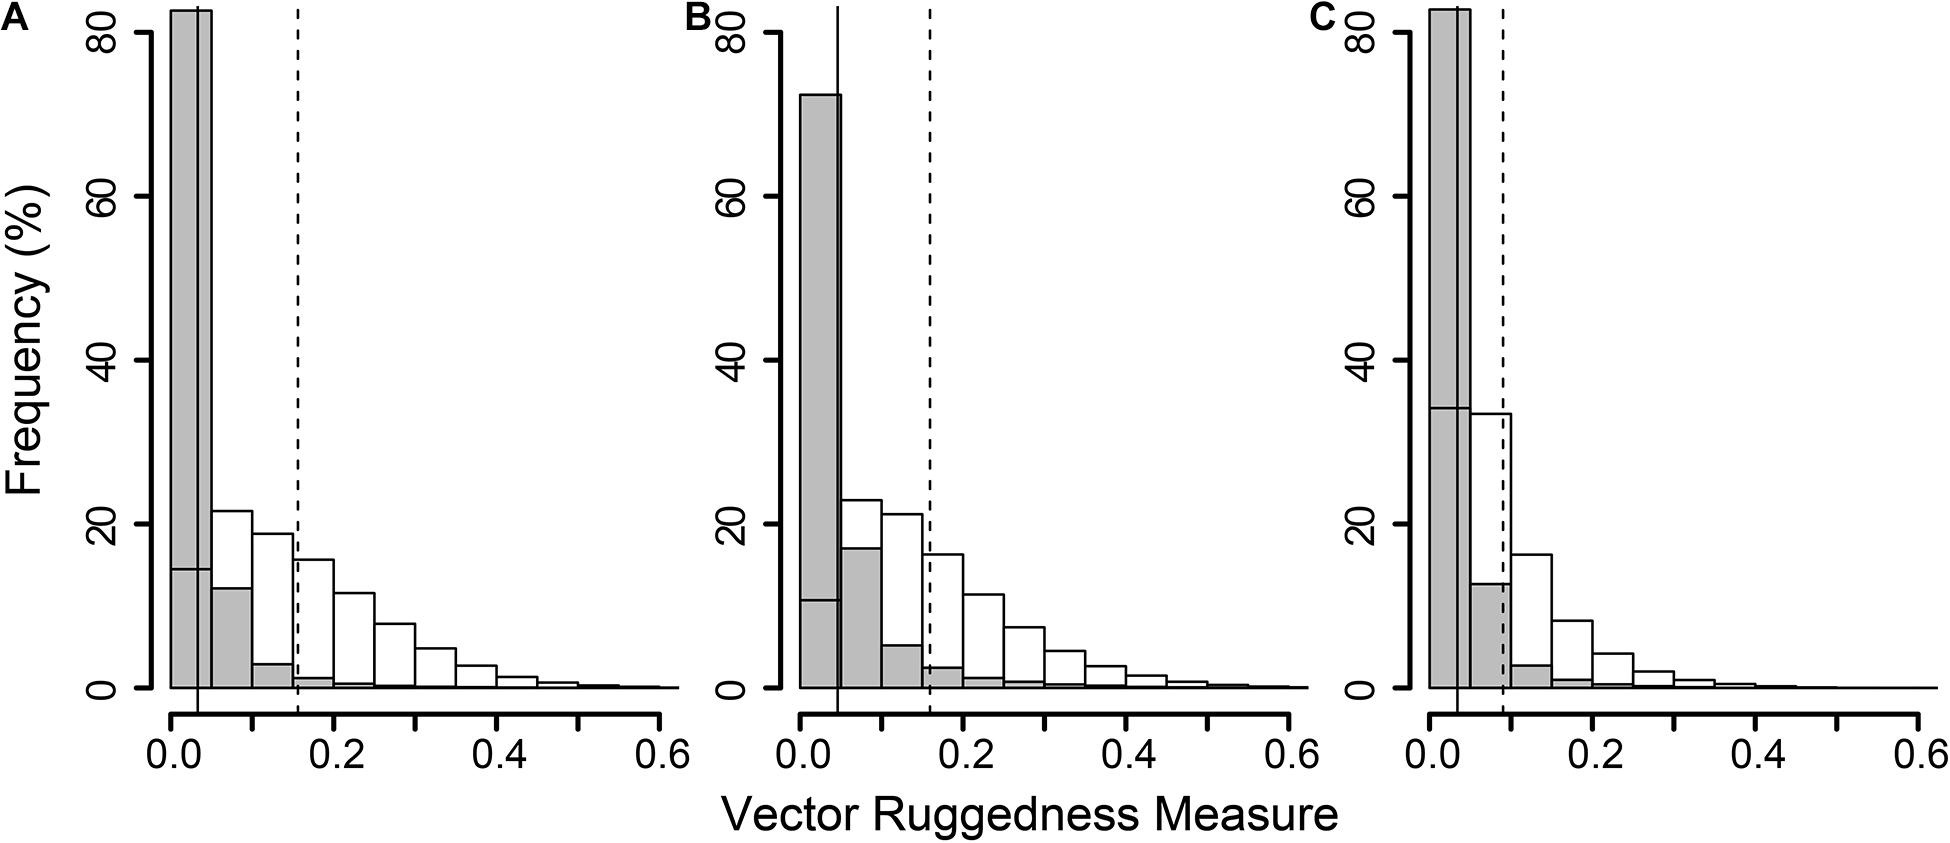
Figure 5. Histogram of all Vector Ruggedness Measure (VRM) values of all pixels in the non-reef class (grey) and coral reef class (clear) at sites A (A), B (B), and C (C). Vertical lines indicate mean VRM values for non-reef (solid) and reef substrate (dashed).
A total of 4,546 individuals from 13 taxa were counted and geotagged over the three mosaiced sites (Table 2 and Figure 6). Different densities of organisms were observed between the mosaics (Table 2). Site C typically contained the lowest density of species, except for Psolus sp. Site B contained nearly twice the density of M. oculata, and 9.7 times the density of Stichopathes sp. compared to Site A (Table 2).
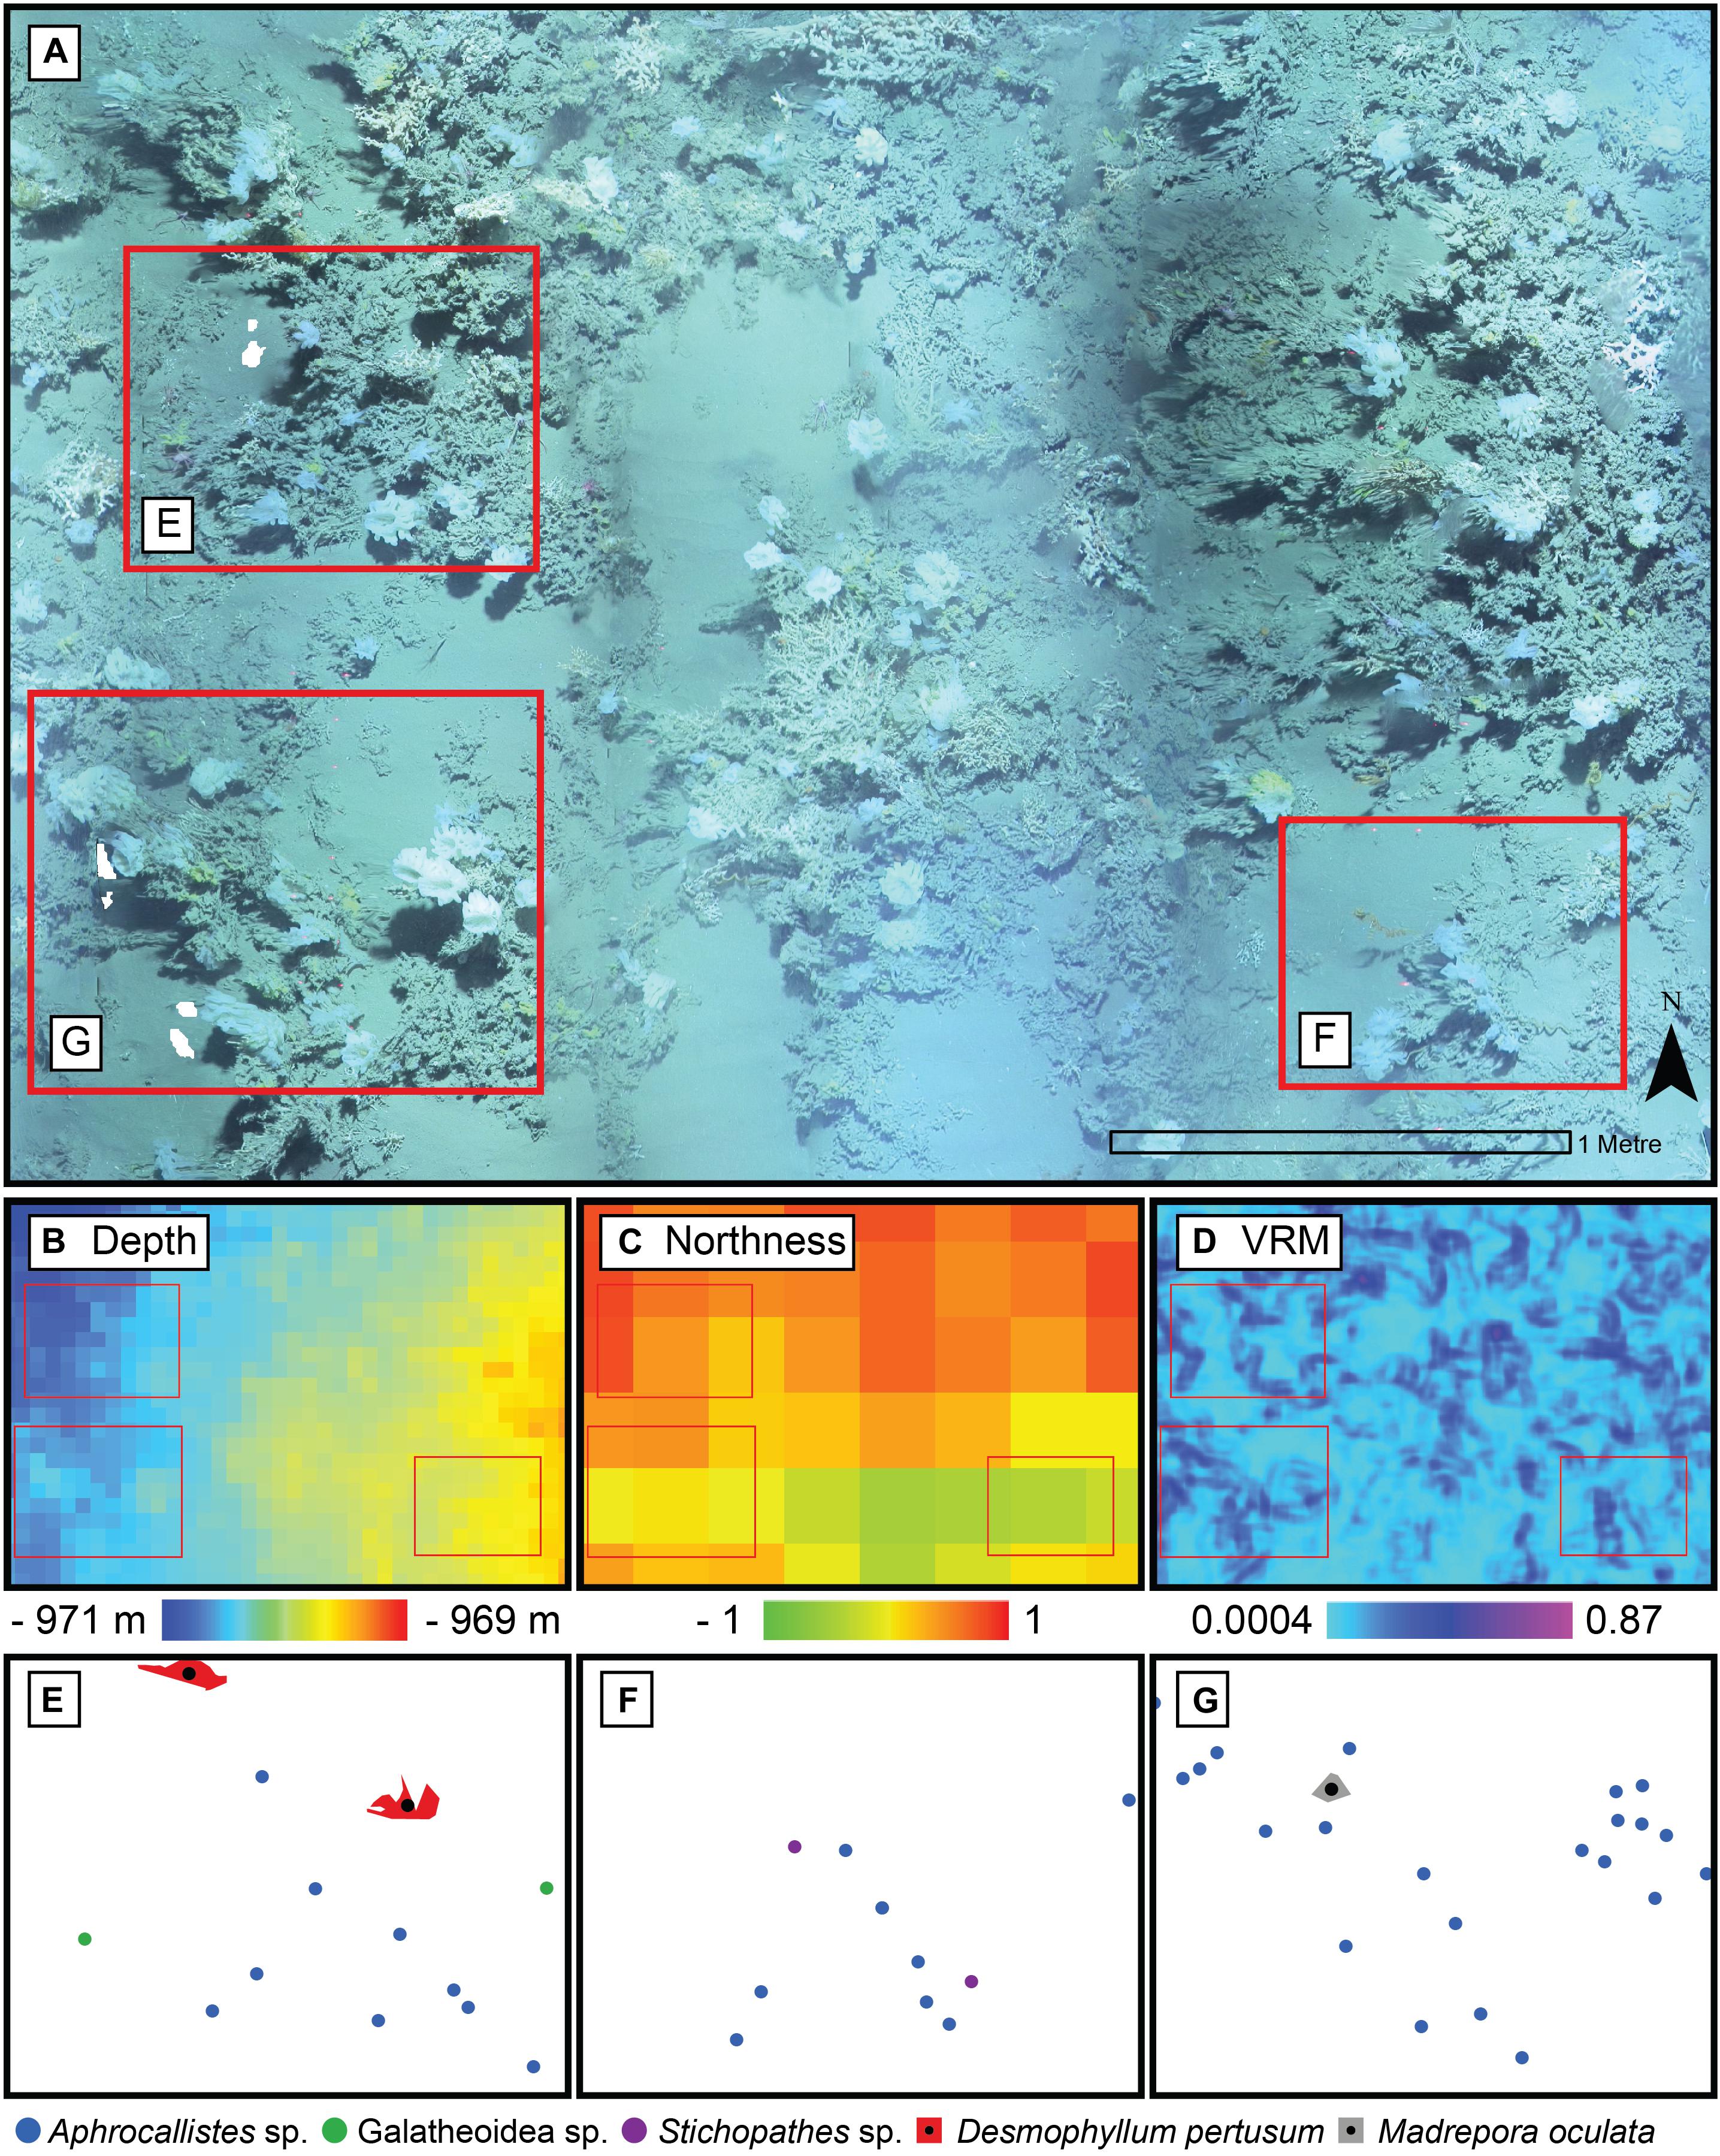
Figure 6. Close up of the photomosaic at Site B. Environmental drivers derived from the Digital Elevation Model of the same area: (B) depth, (C) northness, and (D) Vector Ruggedness Measure (VRM) at 7 mm pixel with 15 pixel neighbourhood. Corresponding point patterns of species generated by geotagging each relevant individual is depicted in panels (E–G) with their respective inset marked in red in panel (A).
A visual inspection of the density plots indicated that most organisms showed an affinity towards the reef part of the mosaiced areas, except for Psolus sp., which were generally low in density at site A and B (see Supplementary Material). The highest densities of living patches of D. pertusum and M. oculata were located on toward the west side of the reef substrate at Site A, toward the summit of the mound. Aphrocallistes sp. and Alcyonacea spp. at Site A were higher in areas of coral cover toward the west side of the site where coral reef substrate was observed (Figure 7). Notably, typical reef associated species such as Aphrocallistes sp. were indeed more common at the centre of the reef, which was where the more structurally complex reef substrate (indicated by high VRM) was located. The south part of the reef which had low VRM, indicative of coral rubble due to the lack of structural complexity, harboured a low density of most species (Figure 7). M. oculata and D. pertusum appeared to have a slightly different distribution to each other with live M. oculata more densely aggregated toward the outskirts of the reef showing only minor overlap with D. pertusum (Figures 7B,C). Hotspots of Alcyonacea spp. and Stichopathes sp. were evident at Site B (Figures 8E,F). Aphrocallistes sp. appear more spread out at site B, though a distinct dense patch is evident at the south part of the site (Figure 8). Like Site A, M. oculata and D. pertusum density hotspots were generally located in different places. It appears that D. pertusum tends to cluster toward the top of the mound whereas M. oculata clusters toward the base. Psolus sp. and Aphrocallistes sp. showed distinct density hotspots at Site C with Aphrocallistes sp. showing an affinity for coral covered areas toward the base of the mound (Figure 9).
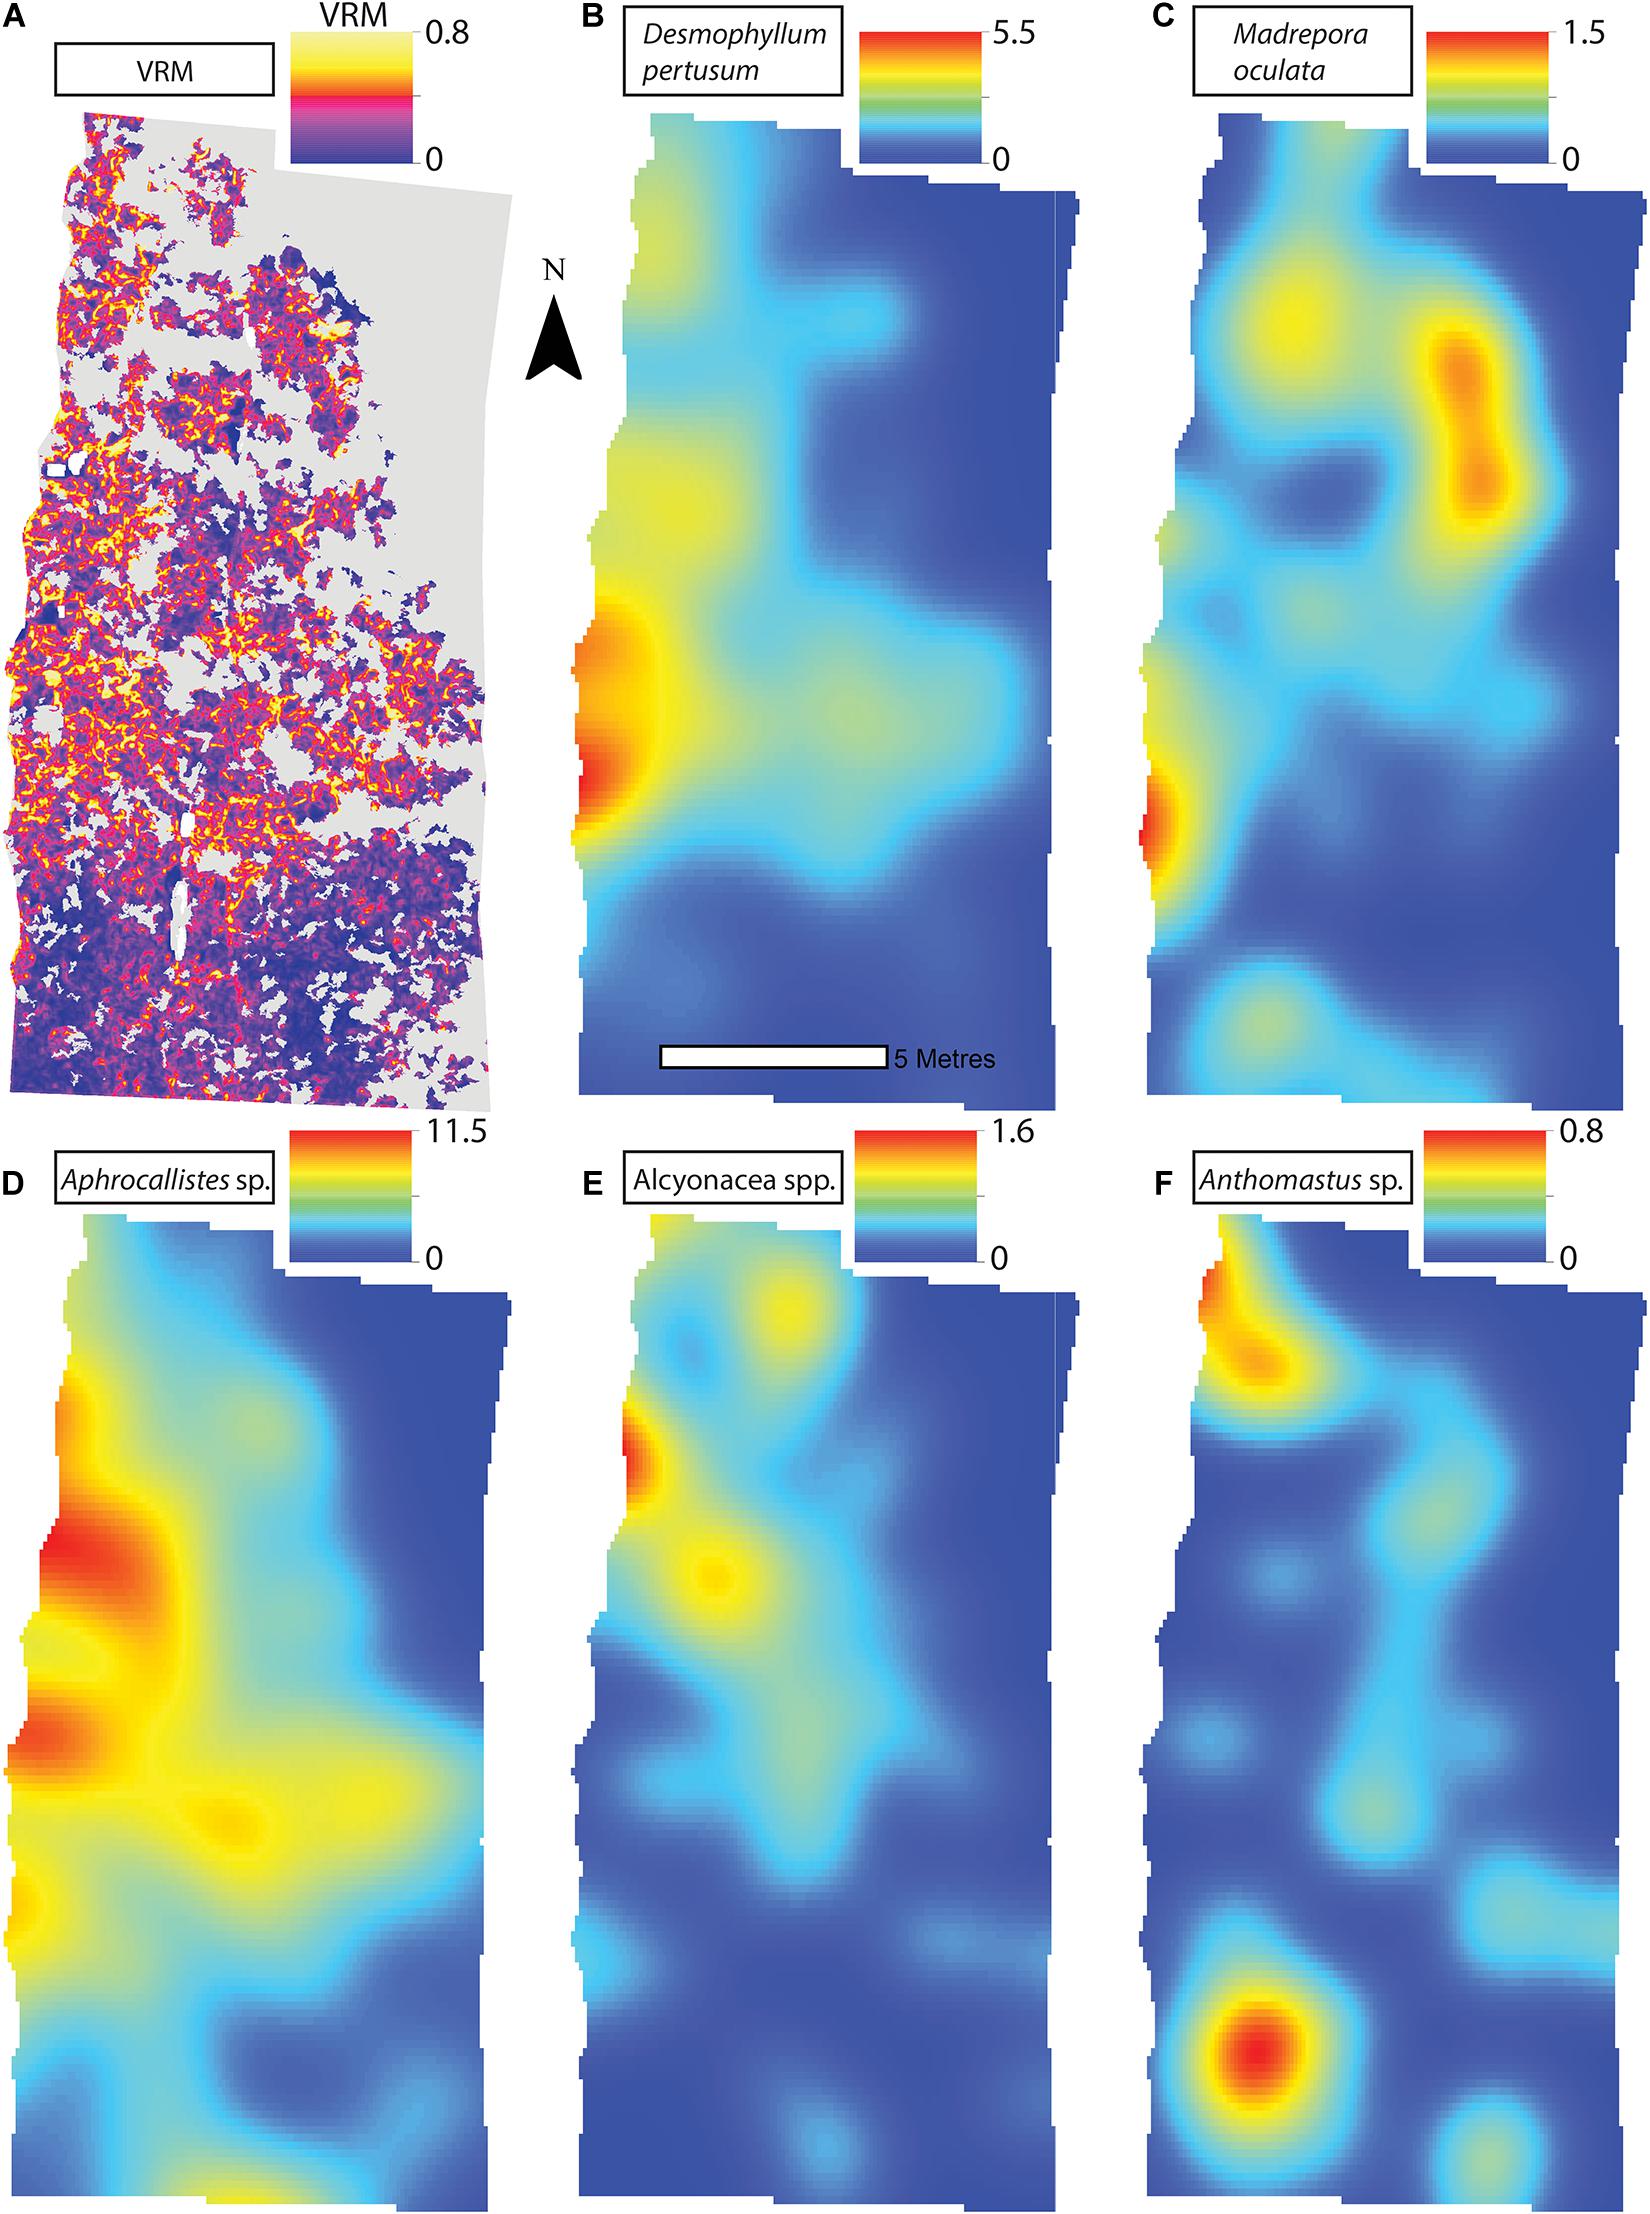
Figure 7. (A) Vector Ruggedness Measure values for reef facies at Site A. Kernel estimate of intensity plots (number of individuals per m2 and sigma = 1) (B) Desmophyllum pertusum, (C) Madrepora oculata, (D) Aphrocallistes sp., (E) Alcyonacea spp., and (F) Anthomastus sp. for Site A. Note varying colour scale between the different plots.
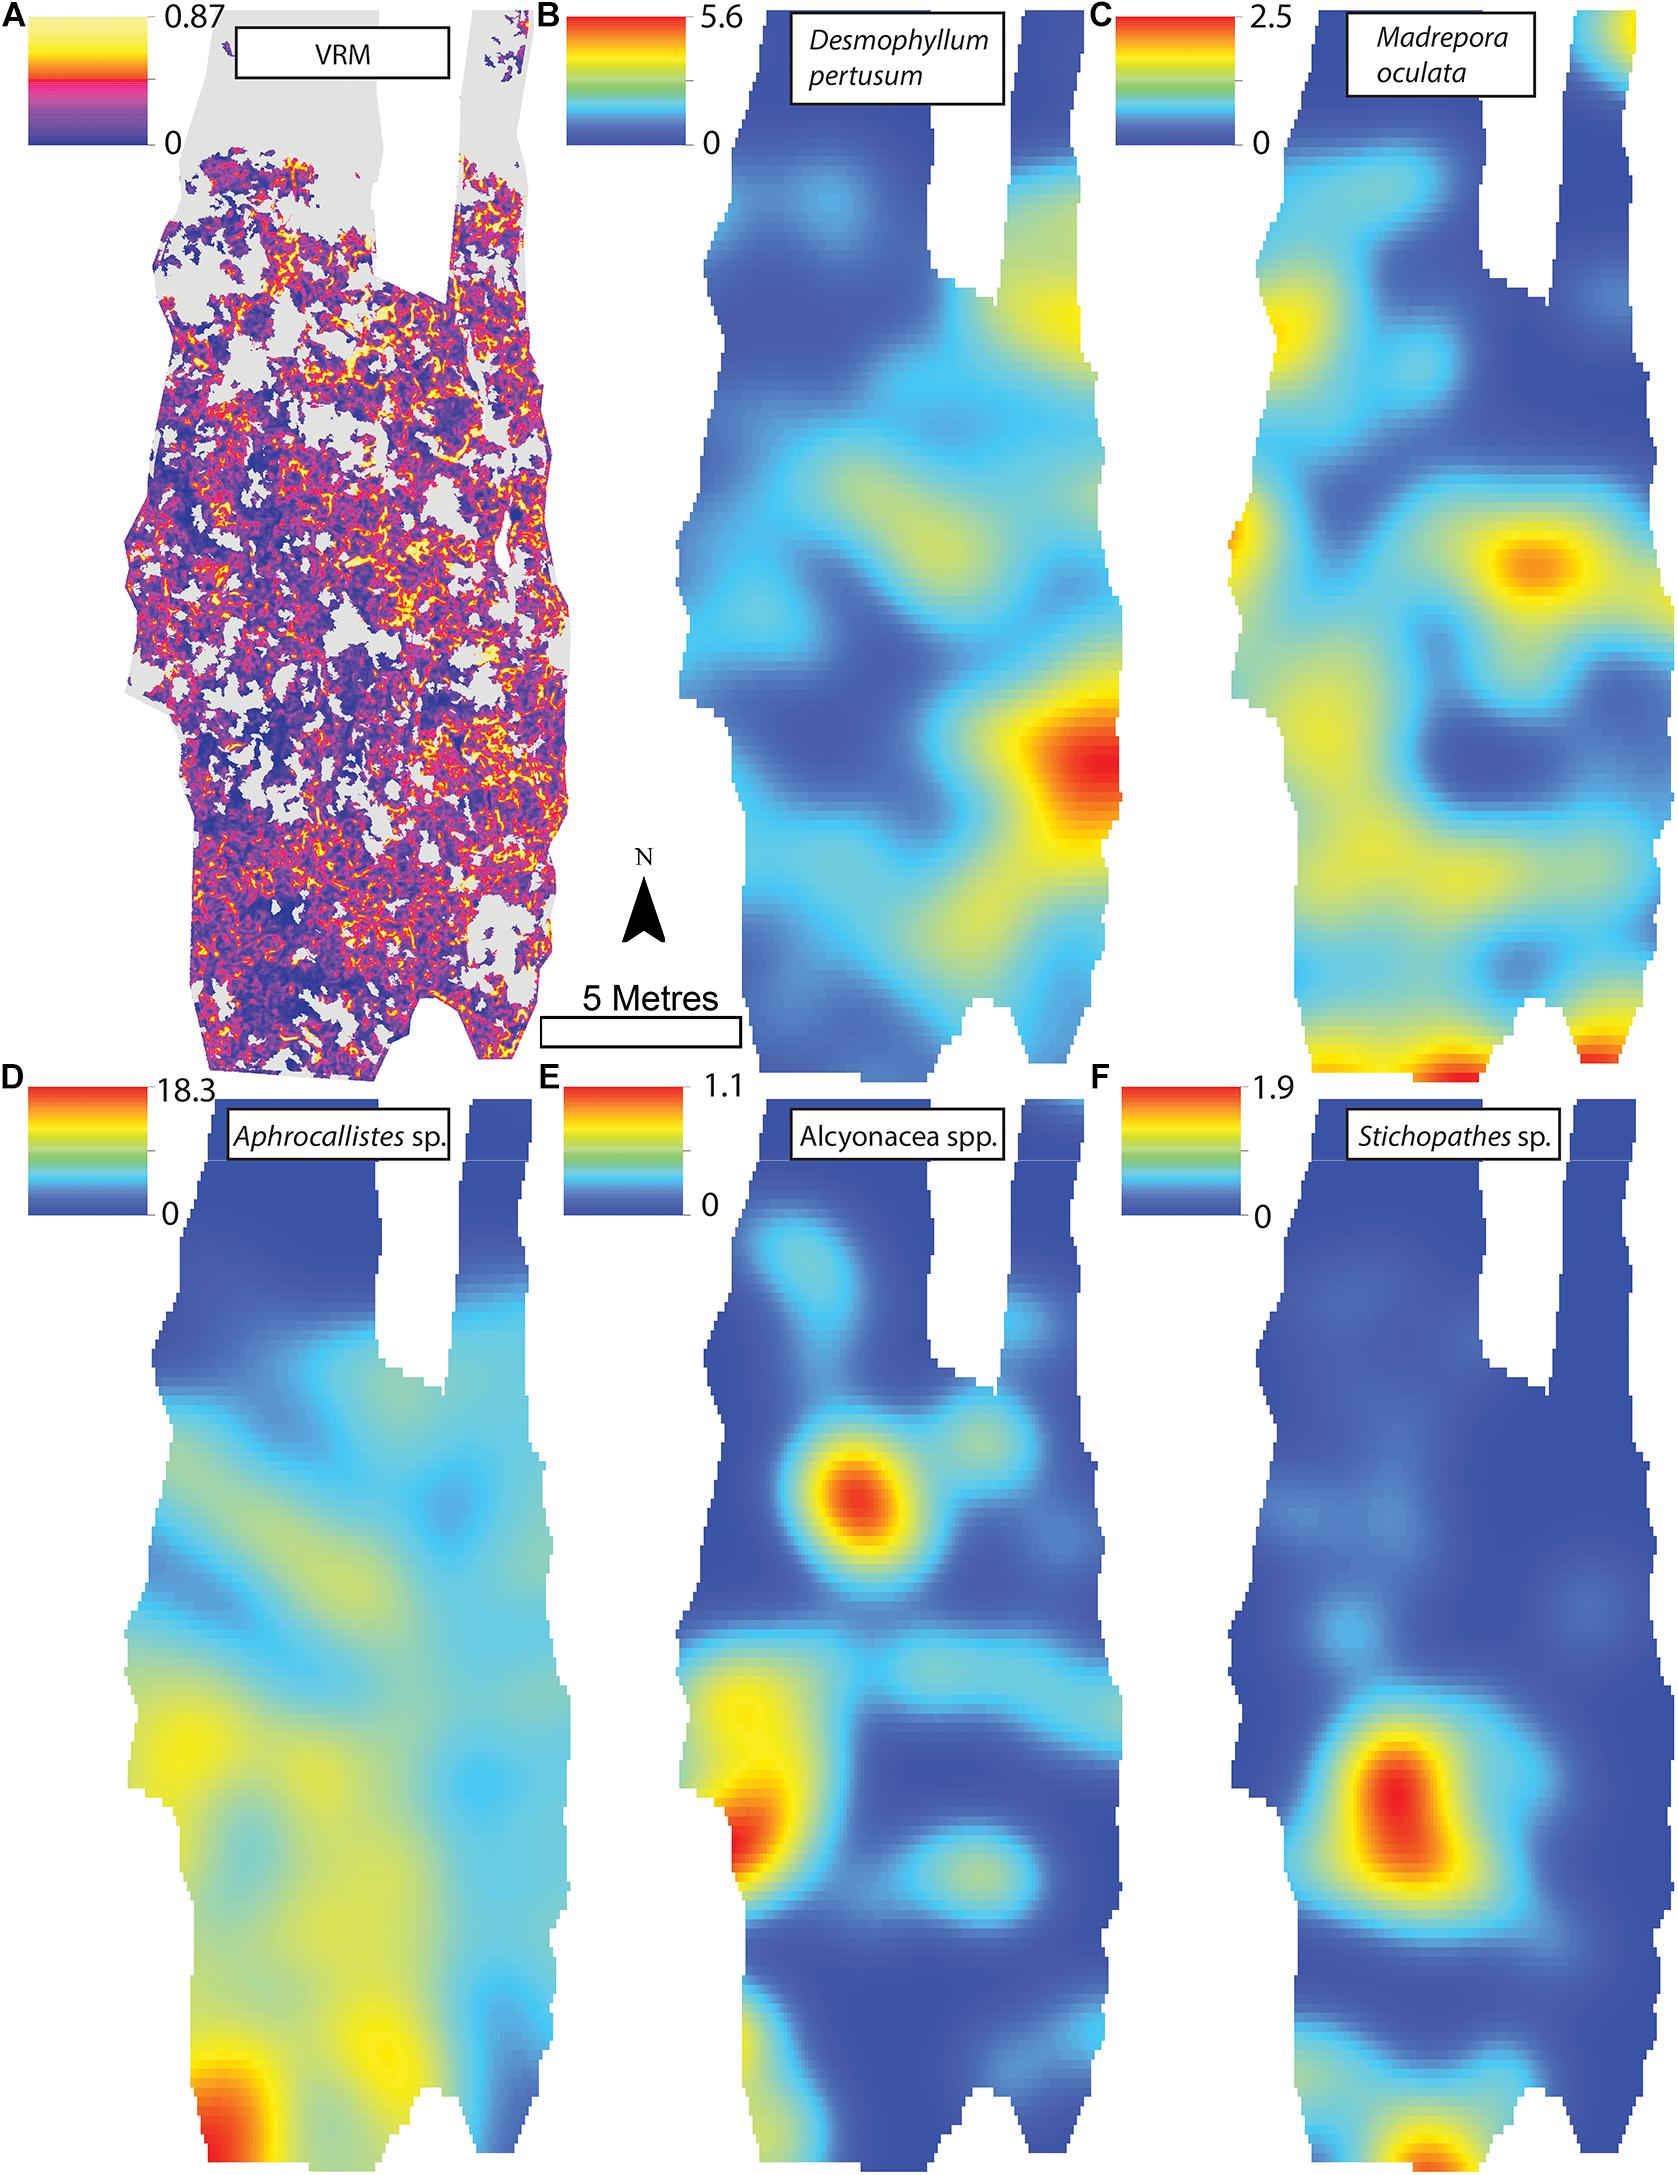
Figure 8. (A) Vector Ruggedness Measure values for reef facies. Kernel estimate of intensity plots (number of individuals per m2 and sigma = 1) (B) Desmophyllum pertusum, (C) Madrepora oculata, (D) Aphrocallistes sp., (E) Alcyonacea spp., and (F) Stichopathes sp. for Site B. The non-reef substrate is in grey. Note varying colour scale between the different plots.
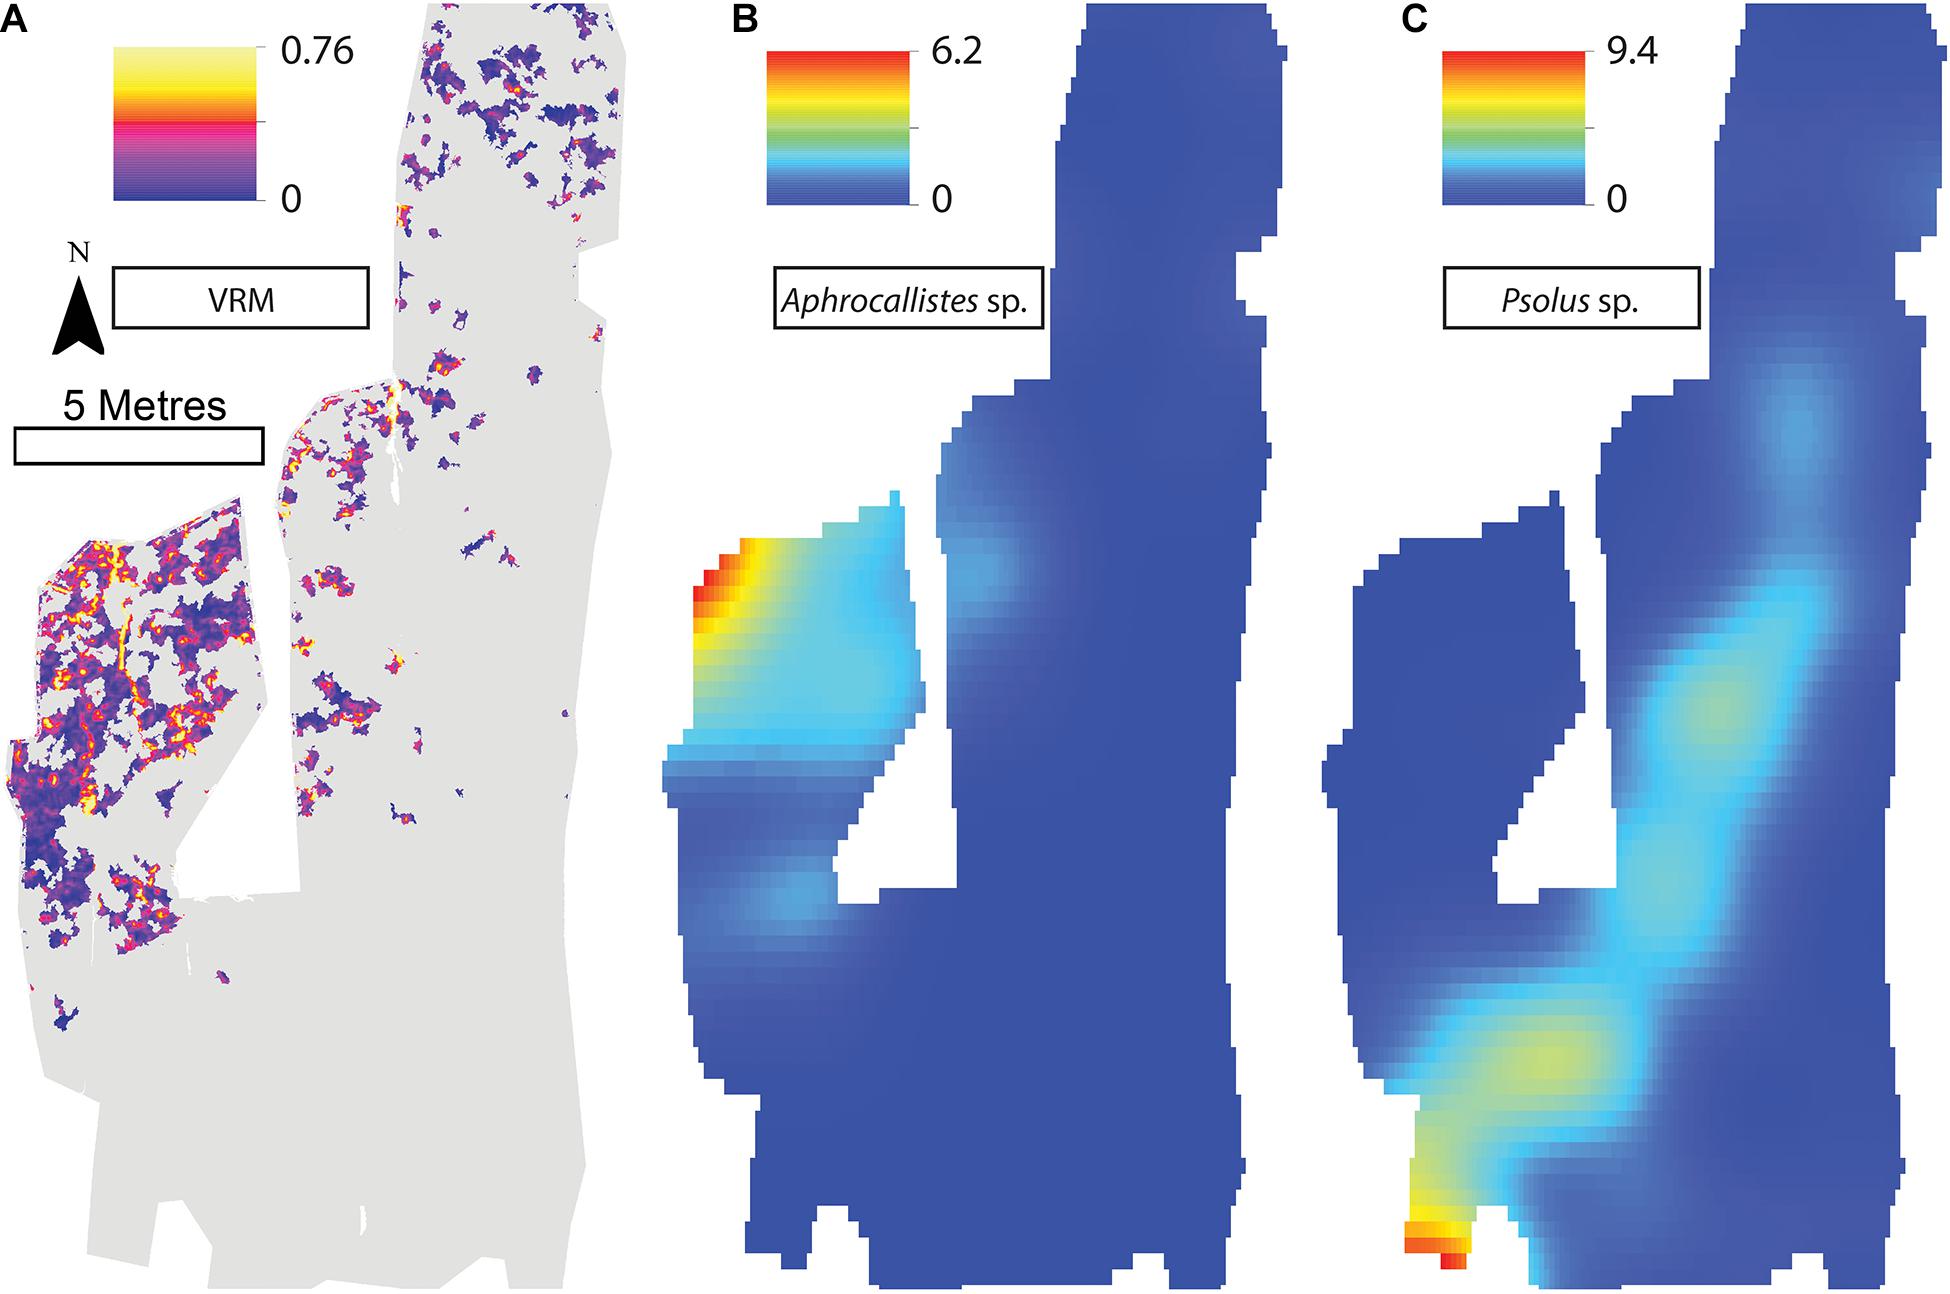
Figure 9. (A) Vector Ruggedness Measure values for reef facies. Kernel estimate of intensity plots (number of individuals per m2 and sigma = 1) (B) Aphrocallistes sp., (C) Psolus sp. for Site C. Note varying colour scale between the different plots.
The inhomogeneous PCF plots revealed D. pertusum clustered between 0.1 and 0.6 m at both sites A and B (Figures 10A,B). M. oculata displayed clustered patterns up to ∼0.5 and 0.6 m at Sites A and B, respectively (Figures 10C,D), Aphrocallistes sp. consistently clustered at sites A and B up to approximately 0.7 m whilst clustering was restrained to approximately 0.4 m at Site C (Figures 10E–G). There was evidence that Stichopathes sp. clustered at site B at 0.1 to 0.4 m (Figure 10H) where it had a greater density compared to site A (9.7 times, Table 2). Psolus sp. strongly clustered up to ∼0.25 m with a second clustering r of 0.4–0.7 m at site C (Figure 10I) where it was the most abundant (Table 2).
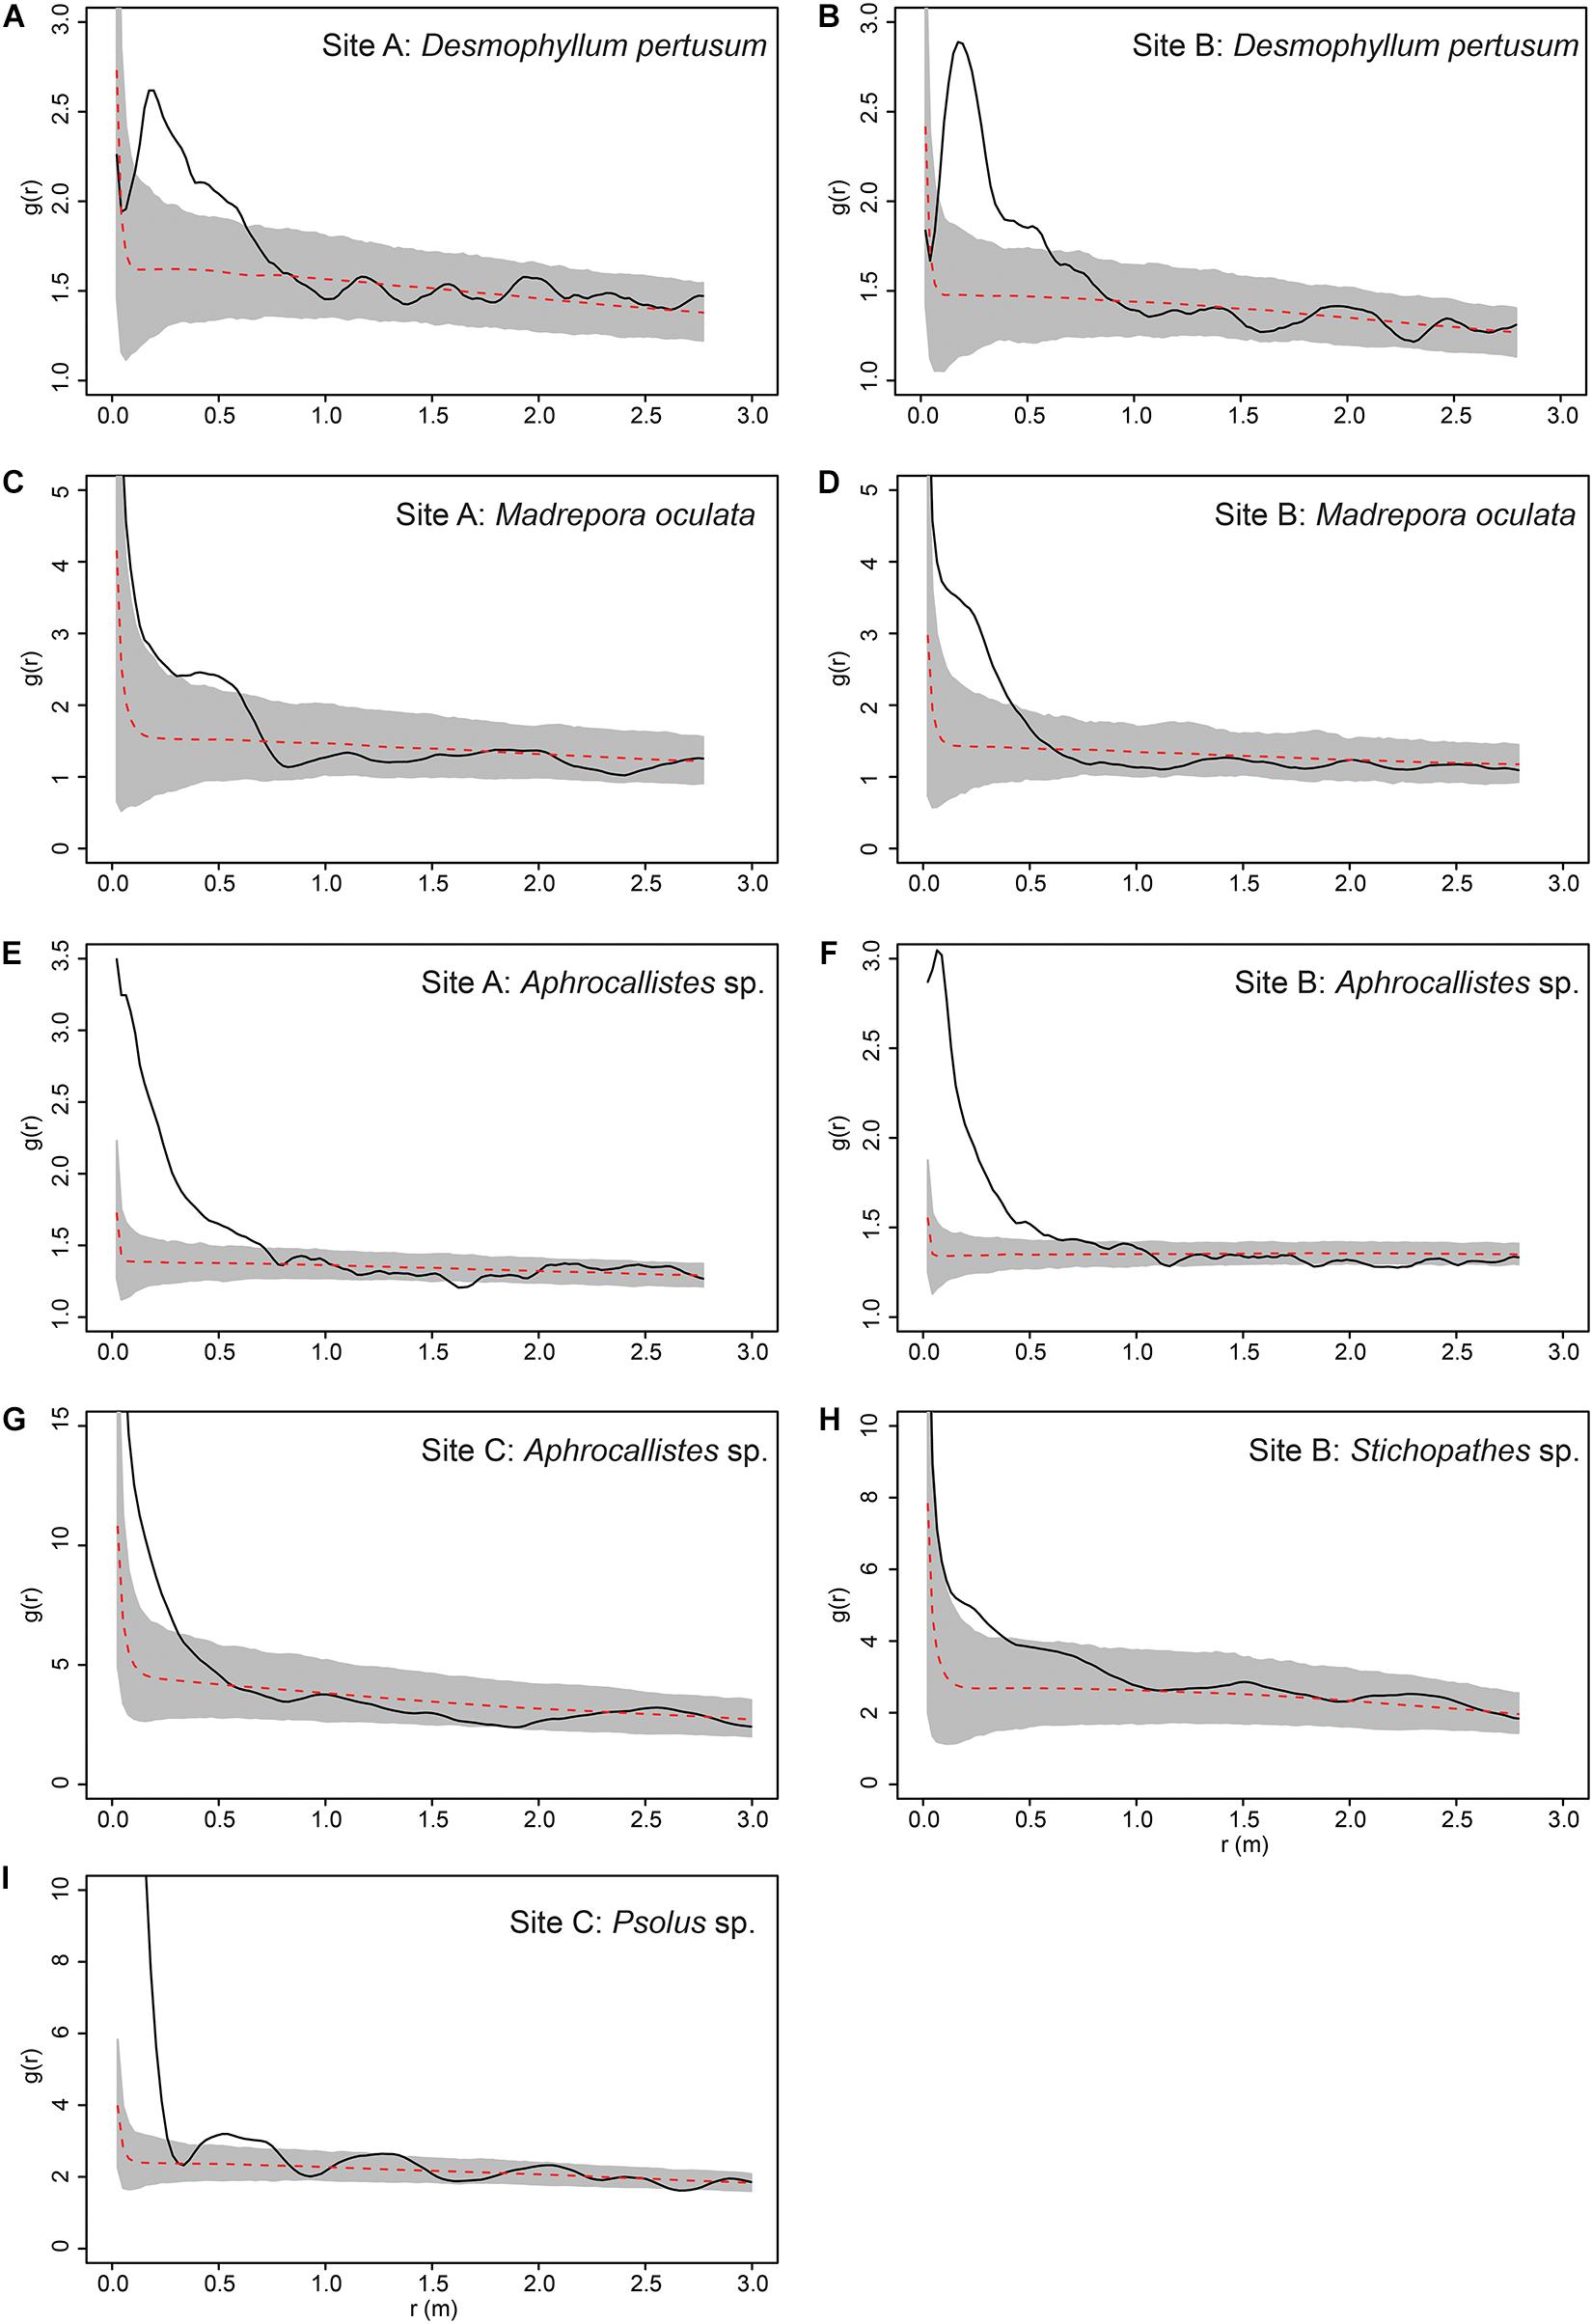
Figure 10. Pair Correlation Function results for specific species at specific study sites. Grey area represents the simulation envelope and the dashed red line indicates the mean of the inhomogeneous null model. (A) Desmophyllum pertusum at Site A. (B) D. pertusum at Site B. (C) Madrepora oculata at Site A. (D) M. oculata at Site B. (E) Aphrocallistes sp. at Site A. (F) Aphrocallistes sp. at Site B. (G) Aphrocallistes sp. at Site C. (H) Stichopathes sp. at Site B. (I) Psolus sp. at Site C.
Minor reconstruction errors on the Z axis observed at Site C (Figure 4) where images did not stitch correctly, were amplified when calculating environmental drivers from the DEM. Thus for site C, only substrate and VRM at 7 mm pixel were considered. VRM was included as the vertical errors remained very localised and had little effect on the outputs. A total of 94 PPMs were created to represent the distribution patterns (CSR, IP, CP, and ICP) of each species when possible (for <50 individuals, only CSR and ICP were considered; Table 3), with the lowest AIC scoring model displayed in Figure 11. An example of a single theoretical simulation of Aphrocallistes sp. point pattern is depicted in Figure 11. Generally, most species distributions were driven by environmental factors independently (IP) with indication of additional biological clustering for some organisms (ICP) (Figure 11). Anthomastus sp. was the only organism to consistently show a CSR distribution with no models indicating an influence of environmental factors driving their distribution. No groups showed any evidence of only biological clustering (CP) influencing the organism’s distribution and aggregation patterns (Figure 11). Substrate (reef or non-reef) was consistently included as a variable in the most parsimonious environmental models (Figure 11), providing statistical support for the visual observations from the density plots that many species were attracted to reef substrate. Secondly, VRM was considered a significant predictor variable in the most parsimonious distribution models for most organisms. The other environmental factors depth, northness, and eastness were also considered significant predictors, however their influence was inconsistent. The inclusion of Geyer’s interactions supported the influence of biological clustering in the ICP models for M. oculata, D. pertusum, Aphrocallistes sp., Alcyonacea spp., Stichopathes sp., Zoanthidae sp., Galatheoidea sp., and Cidaris cidaris. Geyer’s interaction parameters specified by the maximum pseudolikelihood indicated most clustering observed was within 1 m. The strongest clustering was observed in Aphrocallistes sp., whereby the saturation of clustering was specified at 7 and 6 for sites A and B. Further clustering parameters utilised in the Geyers cluster process are outlined in Figure 11.
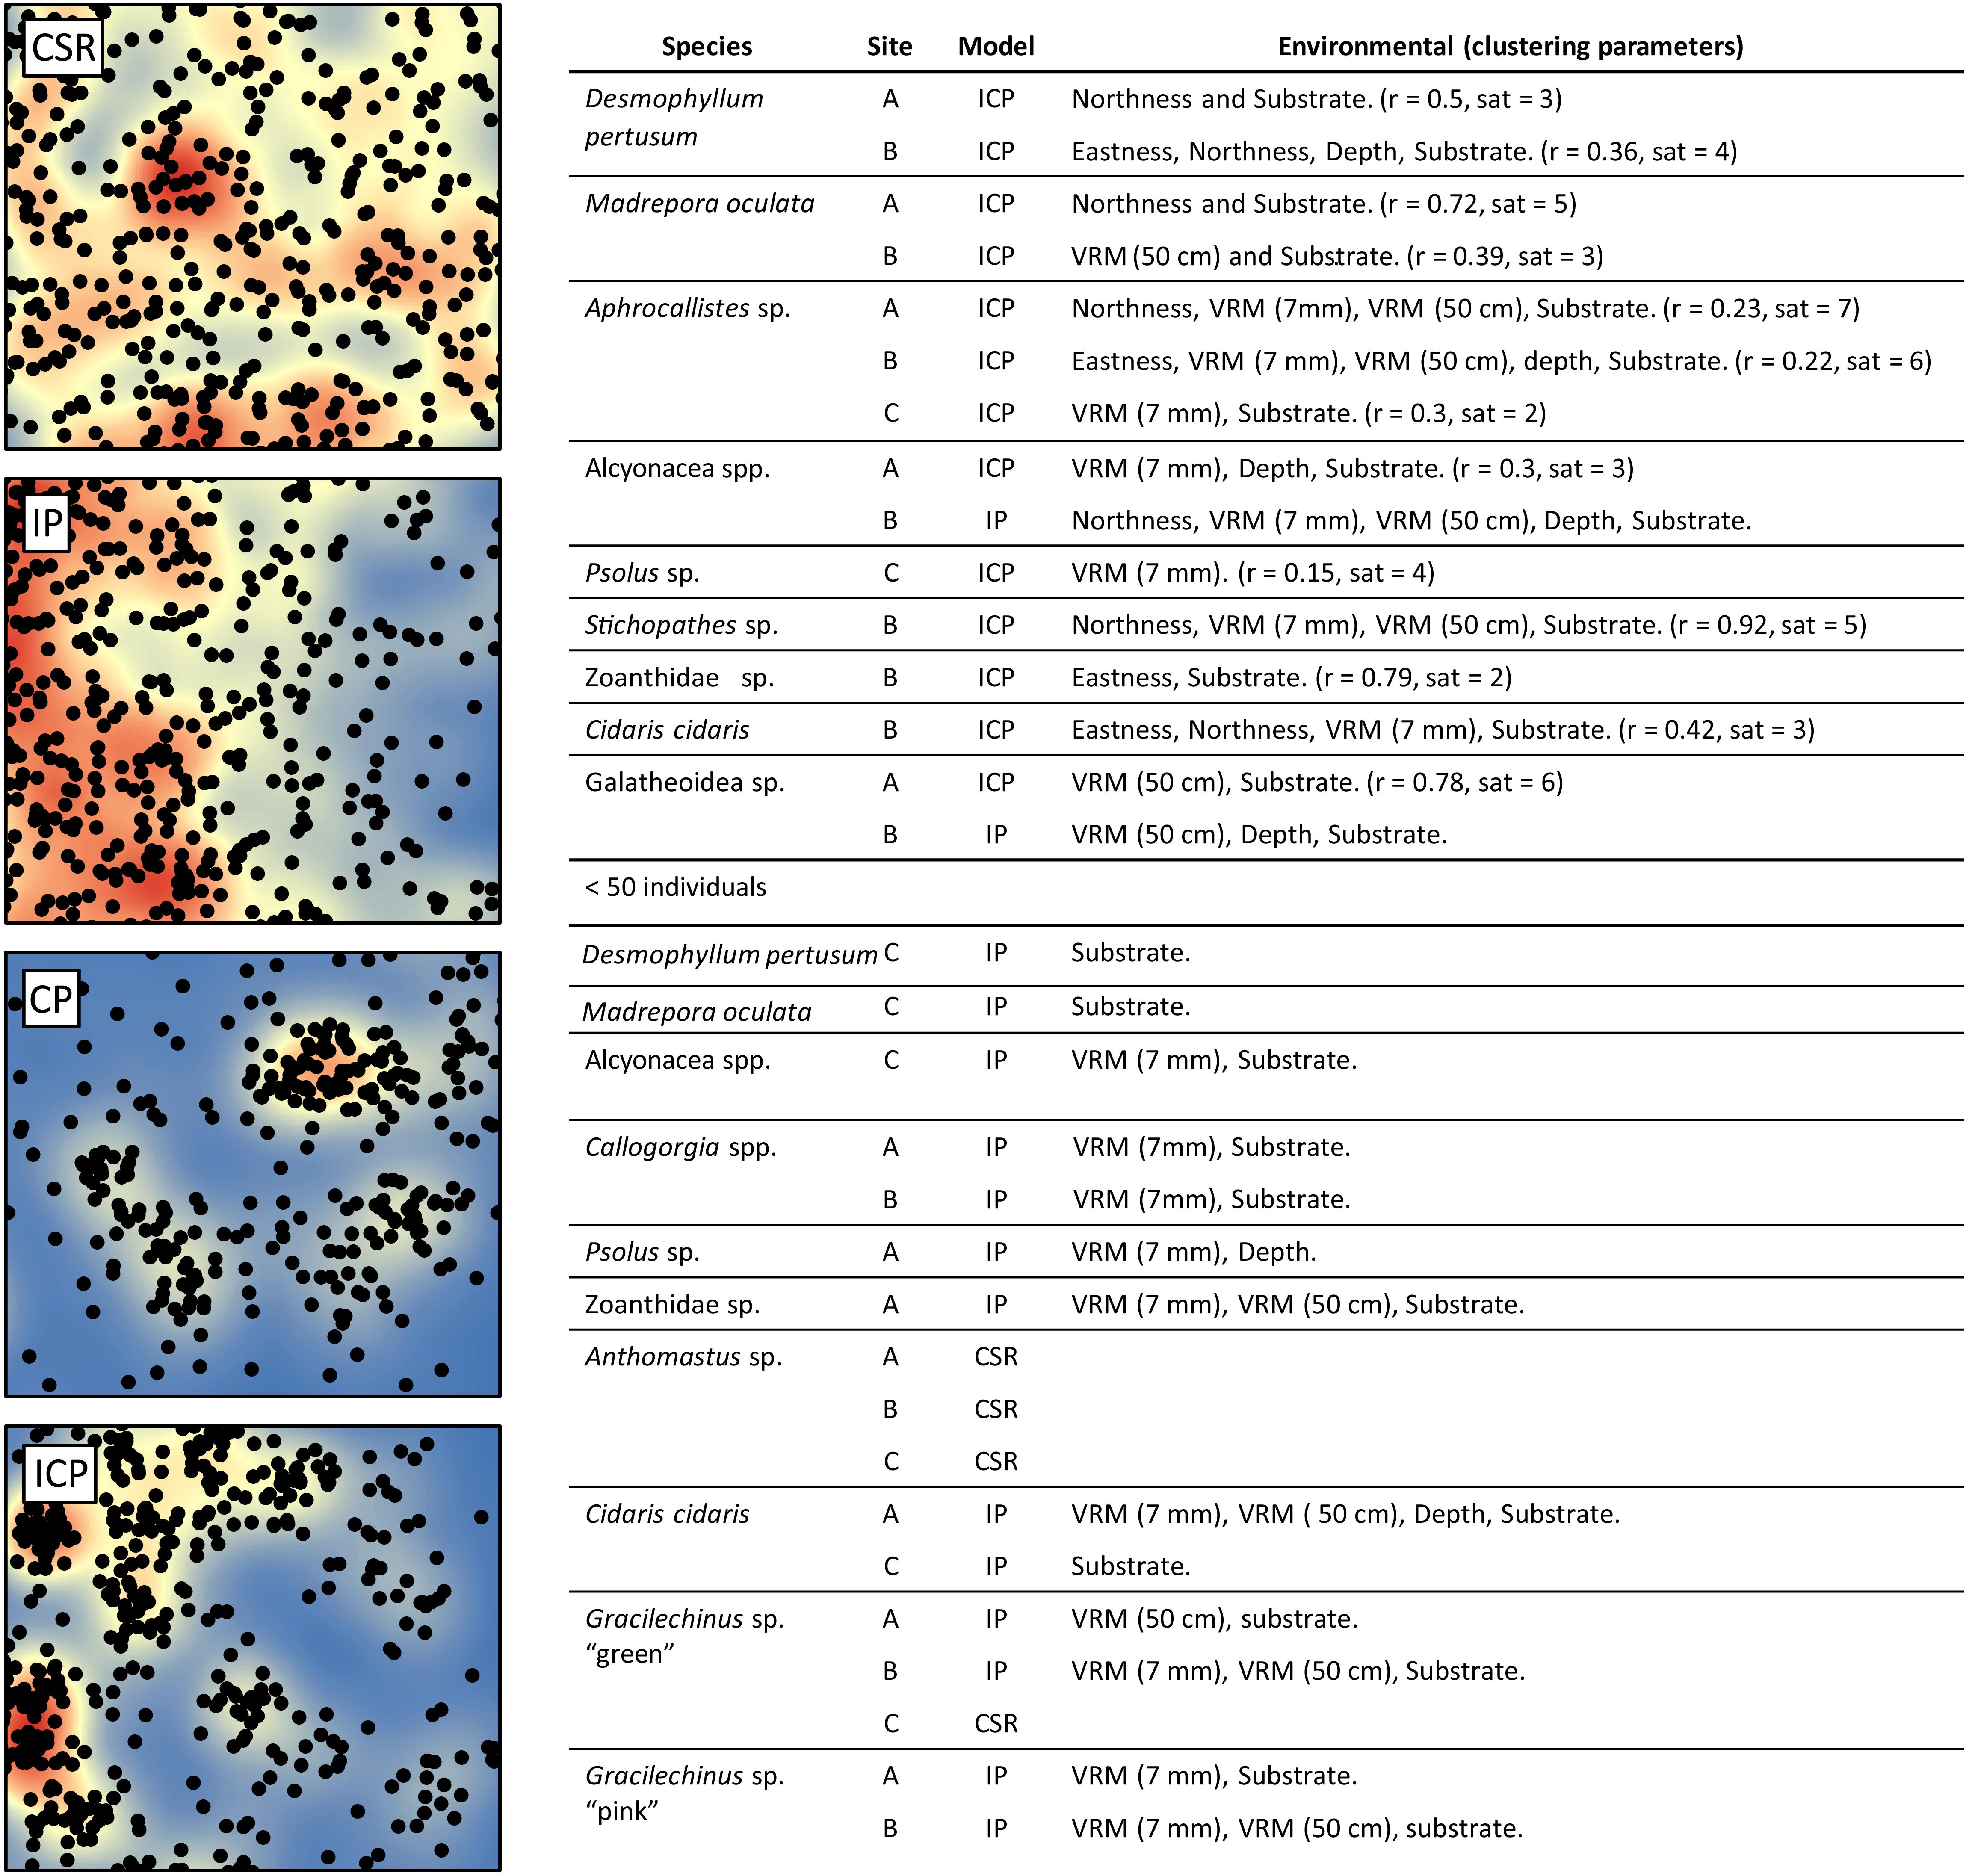
Figure 11. Single theoretical simulation of Aphrocallistes sp. distribution from Site A assuming Complete spatial randomness (CSR), Inhomogeneous point pattern (IP), Clustering point pattern (CP), and Inhomogeneous clustering point pattern (ICP). Kernel density is plotted in the background. The models chosen for the 13 species based on the lowest AIC score are listed in the accompanying table with environmental and Geyer’s point interaction (r = distance (m), sat = saturation threshold) parameters specified where relevant.
The coral reef substrate with low VRM values appeared unsuitable for Aphrocallistes sp., a species frequently found within the coral reef substrate. Aphrocallistes sp. was positively influenced by VRM, peaking at 0.3 and beyond, which is in the upper regions of VRM values for coral substrate (Figure 12), which was statistically supported by a Berman’s Z1 test (Z1 = 10.3; p-value < 0.001). At site B, a similar pattern was observed with the highest density of Aphrocallistes sp. occurring between approximately 0.2 and 0.4 VRM which is near the upper end of reef substrate complexity (Figure 12; Bermans Z1 test; Z1 = 6.5, p-value < 0.001).
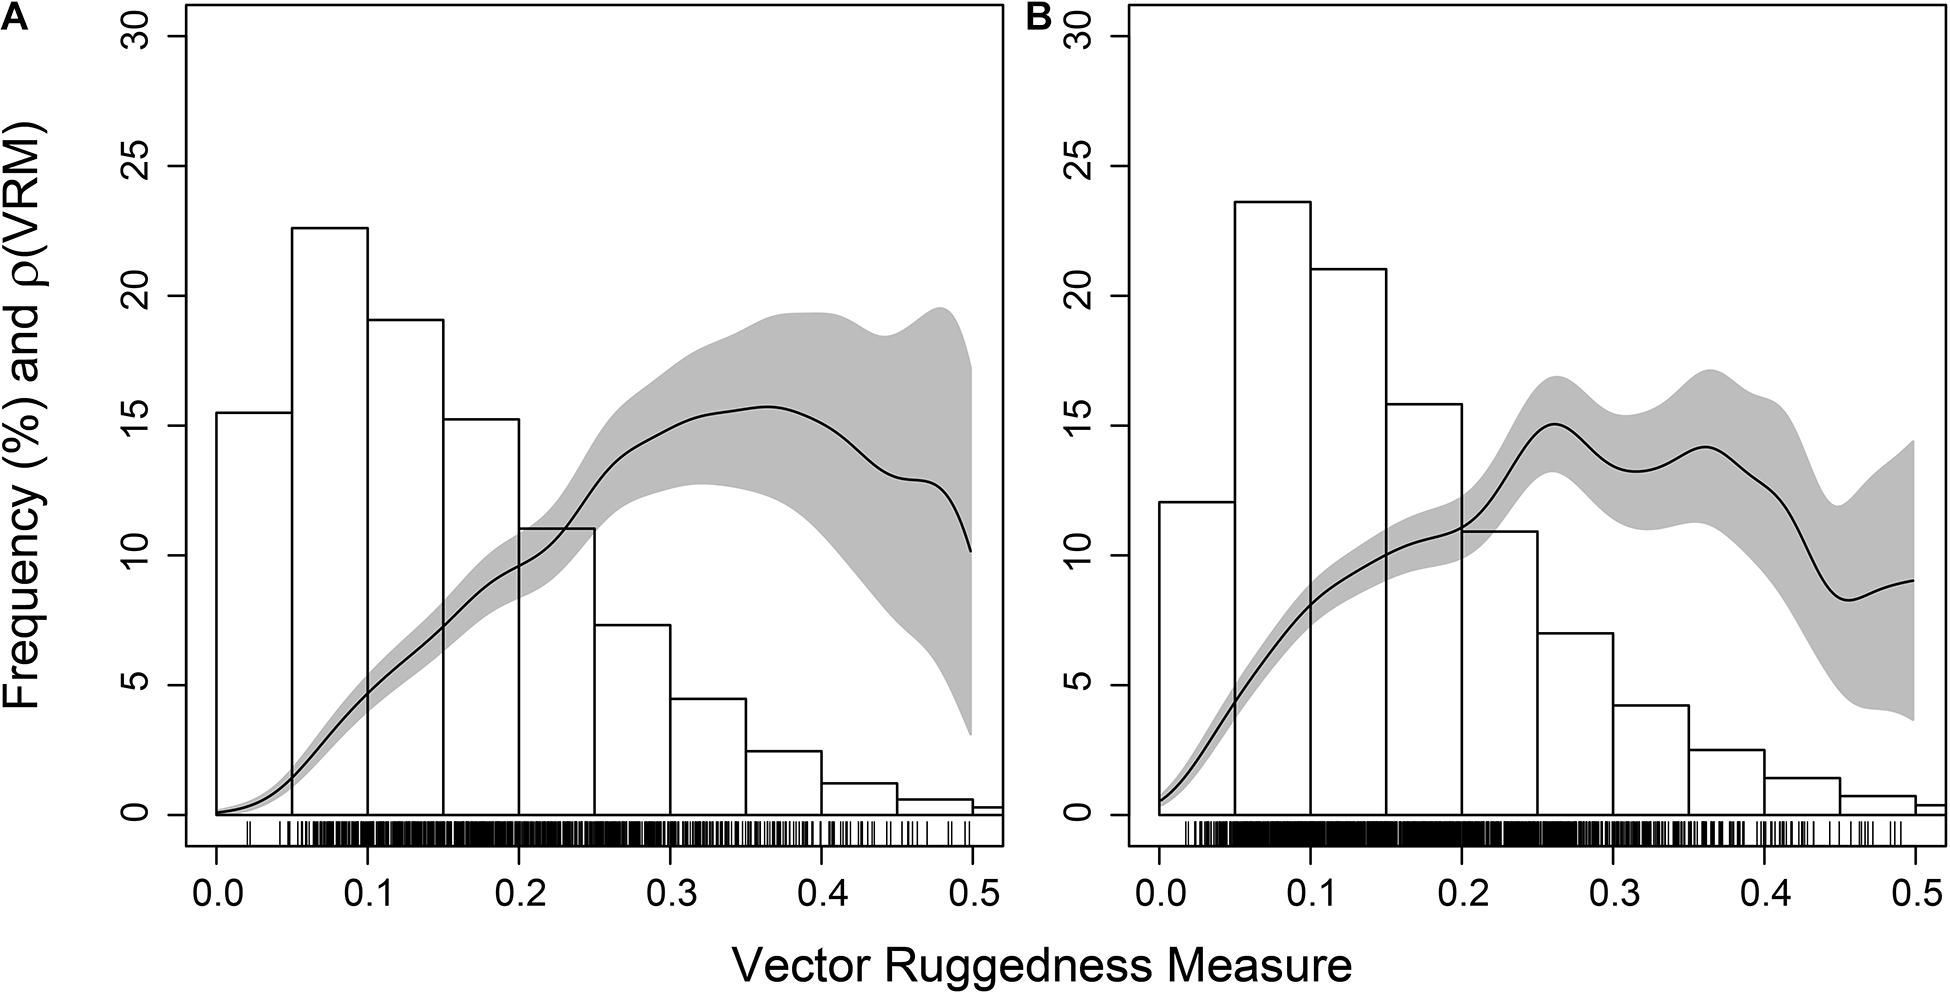
Figure 12. Estimated function ρ(VRM) giving the estimated Aphrocallistes sp. intensity as a function of Vector Ruggedness Measure at Site A (A) and B (B). Grey represents 95% confidence bands. Bars refers to frequency as a percentage of coral substrate VRM.
Discussion
The majority of benthic organisms are aggregated on reef structures with further clustering at scales below 1 m. Clustering was partly influenced by the local features such as coral skeleton presence, reef rugosity at multiple scales and other geomorphic variables, and for some taxa partly by biological processes. This study demonstrates a novel use of PPA in deep-sea ecology through the utilisation of high resolution photomosaics and DEMs created from ROV video, to map and analyse reef heterogeneity and the spatial organisation of reef-building coral and associated taxa. The statistics used have so far been typically applied to terrestrial and shallow-water habitats and while applied here in a cold-water coral environment, it is clear that a similar approach can also be applied across a range of marine environments.
The benefit of undertaking PPA is the ability to identify how organisms are responding to variability in their habitats. The terrain metrics derived from SfM allowed quantification of coral framework rugosity, provided mainly by framework-building corals D. pertusum and M. oculata. These metrics showed a wide variety of VRM values that captured the structural complexity of the seafloor, including from the coral rubble to the 3D framework. Whilst the rugosity value at which coral is considered rubble or framework remains ambiguous, the variety of VRM values showed that coral-related geomorphic metrics span a wide range of values. This habitat heterogeneity was first reported by Lim et al. (2017), who observed heterogeneity of substrate facies across the entire mound, a variable known to drive organism distribution (Corbera et al., 2019). Here, variability in organism distribution was determined in the form of general density trends and clustering, that may have been driven by both environmental and biological processes. Furthermore, the lack of consistency between the sites in terms of live M. oculata and Stichopathes sp. densities (Table 2), also infers different conditions between the northern side of the mound and the north-eastern flank of the mound, despite being located metres away from each other, showcasing the heterogeneity of mound habitats.
Most organisms showed an affinity for the reef substrate, supporting our prediction (Hypothesis 1) that a higher density of certain species are found within the reef substrate compared to the surrounding non-reef substrate. The density plots reveal an abrupt decrease in some species densities between these coral- and sand-dominated habitats. The abrupt change is in contrast to mounds the northern Ionian Sea where the changes between macrohabitats were described as gradual (Vertino et al., 2010), showing the natural variability of habitat provision by biogenic reefs between regions and areas. The association with coral was particularly evident for sessile organisms, with the exception of Psolus sp. which was typically found on dropstones at Site C and of Anthomastus sp. which displayed an apparently random distribution. The association of species and reef substrate is unsurprising considering many sessile organisms use the dead coral skeleton framework as the point of attachment for stability (Henry and Roberts, 2017). These organisms may also benefit from the localised alteration of hydrodynamics influenced by cold-water coral reef framework (Buhl-Mortensen et al., 2010; Mienis et al., 2019). Mobile species such as C. cidaris and Gracilechinus spp. (see Supplementary Material) however displayed a slightly more cosmopolitan distribution within the mosaics, with less robust evidence of clustering, though were still associated with reef substrate and some environmental variables. This less defined clustering pattern seen in the density plots could indicate that they may move from the coral structure. However, the three urchin (C. cidaris, Gracilechinus sp. “pink,” Gracilechinus sp. “green”) species showed associations with rugged parts of the reef substrate at some sites (Figure 11), possibly utilising the 3D structure (Stevenson et al., 2015).
Further clustering was evident for the reef-building corals, supporting our predictions that D. pertusum and M. oculata would occupy different parts of the reef (Hypothesis 2), and that organisms biologically cluster within habitats, specifically cold-water coral reef framework, in addition to the terrain variable driven distribution (Hypothesis 3). Live M. oculata and D. pertusum clusters were formed distinctly from each other (Figures 7, 8), rather than being evenly or randomly distributed amongst each other. This pattern is likely caused by a combination of environmental drivers, initial settling position, growth patterns and restrictive reproductive dispersal such as fragmentation. Similar PPM fitting methods revealed clustering patterns indicating spatially constrained dispersal or fragmentation of coral in shallow-water scleractinians (Edwards et al., 2017). However, it is also known that localised abiotic drivers may influence shallow-water and cold-water scleractinian distribution (Dana, 1976; Orejas et al., 2009), as also shown by our study (e.g., currents; as indicated by the importance of aspect variables in the PPM models). The facilitative mechanisms behind the clustered patterns observed in this study are ambiguous, owing to a lack of knowledge on the dominant reproductive strategy of deep-sea coral in situ at Piddington Mound. The growth patterns of dendritic scleractinians such as D. pertusum and M. oculata is conducive to senescence through abandonment of the old skeleton which can lead to separate genetically identical colonies partitioned by dead skeleton. This process can result in so-called Wilson rings (Wilson, 1979), and is likely a prominent driver of the patterns in the distribution of the framework-building corals observed in our study, as both species tended to form clusters at distances less than approximately 0.6 m. This growth pattern could be considered a biologically driven pattern, but sustaining living parts of the colony ultimately relies on underlying suitable conditions not measured in this study, such as oxygen supply, water movement, sedimentation and food supply on a sub-metric scale. Although D. pertusum and M. oculata are successful broadcast spawners, spatially restrictive asexual reproductive strategies in cold-water coral have been identified, such as cloning and fragmentation (Rogers, 1999). Dahl et al. (2012) and Le Goff-Vitry et al. (2004) demonstrated that the predominant reproductive strategy can vary from reef to reef and can result in a relatively high proportion of clones within the reef. Further, it could be argued that the low coverage of live scleractinian coral on the Piddington Mound (<5% for the entire mound; Boolukos et al., 2019; Conti et al., 2019) is indicative of a lack of larval supply, suitable settling sites or survival conditions. Similar patterns of clustering were observed in the other cold-water corals, Alyconacea spp. (“gorgonian” octocorals) and Stichopathes sp. (antipatharian coral), at our study site, with evidence for biological clustering at site A and B, respectively. Comparable patterns have been noted in shallow water gorgonians, attributed to localised environmental factors (Yoshioka and Yoshioka, 1989). However, it is well established that asexual reproduction is one form of reproduction (Wagner et al., 2011) that is likely to lead to clustering, as well as philopatric larval dispersion that has been noted in antipatharians and gorgonians (Miller, 1998; Gori et al., 2011). Whilst localised, favourable abiotic conditions are a prerequisite for colony longevity and influencing fine-scale cold-water coral distribution, it is likely growth patterns and reproductive methods are also an underlying driver contributing to the clustering patterns of all cold-water coral observed.
The clustering of Aphrocallistes sp., consistently observed at all three sites, reflects previously quantified sponge hotspots on the north, west and the peak of Piddington Mound (Conti et al., 2019), as well as revealing finer-scale, centimetric clustering. Similar, albeit unquantified clustering reported in previous studies of Aphrocallistes sp. has been attributed to both asexual reproduction and environmental drivers. Chu and Leys (2010) suggested that asexual budding of glass sponges and local larvae retention may contribute to the patchy structure of sponge reefs, although Brown et al. (2017) observed distinct, non-related sponge colonies clustering, citing local environmental conditions such as flow velocity and substrate availability as the drivers of clustering, rather than cloning. We observe evidence for both strategies whereby Aphrocallistes sp. aggregated in the more rugged part of the coral substrate (supporting Hypothesis 4), taking advantage of the structurally complex substrate, but the modelling approach provided strong evidence for biologically driven clustering as well. Several mechanisms such as enhanced larval entrainment and settling cues in the rugged part of the reef as well as cloning reproductive strategies may contribute to the highly clustered patterns we observed. Aphrocallistes sp. and colonies of scleractinians appeared to coincide with the more structurally complex portion of the reef substrate which may suggest a positive feedback mechanism for reef growth, as it is likely large Aphrocallistes sp. colonies contribute to the reef structure. Aphrocallistes sp. were found at higher densities when the VRM was above 0.1, indicating a preference against reef substrate with low VRM values, that likely represented reef rubble and low-profile coral framework with minimal structural complexity. Large colonies of Aphrocallistes sp. likely contribute to the rugosity values observed which could not be accounted for in the analysis, though we observed that the majority of individuals were small in size or were not detectable in the DEM, and likely had a limited influence. To support this observation, we analysed lower resolution data (which smoothed the presence of larger Aphrocallistes sp. individuals) in the same way which yielded a similar pattern (see Supplementary Material).
Future Research
The combination of unmanned robotics and application of terrestrial ecological analysis approaches in deep-sea environments is progressing our understanding of fine-scale deep-sea organism distribution. However, it must be noted that, whilst great care was taken to avoid annotator bias, processing of images from unmanned vehicles tends to underestimate megafauna due to low image resolution and high camera altitude, undermining and compromising the quality of deep-sea datasets (Meyer et al., 2019). Further, it must be considered that the mobile species may move between survey lines and may have been double counted or not at all depending on the organisms’ movement direction and speed. In fact, the ROV light may also disperse some species and attract others directly or indirectly to feed on light attracted prey. Future studies should focus on collecting data for the wider area which can be achieved by using autonomous vehicles in order to liberate the research vessel for other valuable operations (Wynn et al., 2014), whilst collecting hectares of photomosaics (Meyer et al., 2019; Simon-Lledo et al., 2019) or achieving greater replication. Such large datasets however, present challenges for the annotation of such vast quantities of data. It is expected that machine learning may improve our ability to rapidly generate datasets through the annotation of images (e.g., Piechaud et al., 2019) and the automated classification of benthic habitat, which is becoming a more common mapping technique (Lim et al., 2021). In addition, the mosaics presented provide an opportune dataset for temporal studies which can inform on the natural temporal variability of mound surface composition and coral growth patterns. Time-scale studies are lacking in cold-water coral habitats on a scale of years, but recent studies have shown a decline of live coral at the Piddington Mound (Boolukos et al., 2019) and lack of recovery following disturbance at the Darwin Mounds (Huvenne et al., 2016).
Data Availability Statement
The raw data supporting the conclusions of this article will be made available by the authors, without undue reservation. Some datasets presented in this article are not readily available because parts of the study are ongoing, and cannot be made public until they have been fully analysed. Requests to access the datasets should be directed to DP, d.m.price@soton.ac.uk and AW, a.wheeler@ucc.ie.
Author Contributions
DP and AL conceptualised the study. AL and AW collected the data. DP processed the data and undertook statistical analysis with support from AL, VH, and ME. DP wrote the manuscript and all co-authors contributed to the text and approved the submitted version.
Funding
These data were collected during the Querci expedition, funded by the Marine Institute under the Ship Time Programme of the National Development Plan. DP was funded by the Natural Environmental Research Council (grant number NE/N012070/1) and University of Southampton GSNOCS European Exchange Programme. VH was funded by the NERC CLASS project (grant number NE/R015953/1). AL and VH were supported by the iAtlantic project of the EU H2020 Research and Innovation Programme (grant number 818123). CLI was supported by the H2020 MSC Action HABISS (GA 890815).
Conflict of Interest
AL is employed by Green Rebel Marine Ltd.
The remaining authors declare that the research was conducted in the absence of any commercial or financial relationships that could be construed as a potential conflict of interest.
Acknowledgments
We thank the officers, crew, ROV technical team, and scientific party of cruise of the RV Celtic Explorer and Holland I ROV, of whom this would could not have been undertaken. Finally, we thank the two reviewers for their detailed comments which improved the quality of the paper.
Supplementary Material
The Supplementary Material for this article can be found online at: https://www.frontiersin.org/articles/10.3389/fmars.2021.556313/full#supplementary-material
Supplementary Figure 1 | Images of all species. (A) Aphrocallistes sp., (B) Desmophyllum pertusum, (C) Madrepora oculata, (D) Stichopathes sp., (E) Psolus sp., (F) Galatheoidea sp., (G) Gracilechinus sp. “green”, (H) Anthomastus sp., (I) Callogorgia sp., (J) Gracilechinus sp. “pink”, (K) Alcyonacea spp., (L) Cidariscidaris, (M) Zonathidae sp.
Supplementary Figure 2 | Kernel density plots for all species at Site A.
Supplementary Figure 3 | Kernel density plots for all species at Site B.
Supplementary Figure 4 | Kernel density plots for all species at Site C.
Supplementary Figure 5 | Pair correlation function of Aphrocallistes sp. at Site A compared to the models representing CSR, IP (Northness, Vector Ruggedness Measure, depth and substrate), CP (Geyer’s point interaction) and ICP (Northness, Vector Ruggedness Measure, Substrate and Geyer’s point interaction).
Supplementary Figure 6 | Pair correlation function of Desmophyllum pertusum at Site A compared to the null models representing CSR, IP, CP, and ICP.
Supplementary Figure 7 | Estimated function ρ(VRM) giving the estimated Aphrocallistes sp. density intensity as a function of Vector Ruggedness Measure (VRM) at Site A. VRM was calculated at multiple resolutions and neighbourhood scales (indicated in brackets following pixel size). Vertical solid line represents the mean VRM value of the reef substrate.
Supplementary Table 1 | Results from chi squared goodness of fit test.
References
Addamo, A. M., Vertino, A., Stolarski, J., García-Jiménez, R., Taviani, M., and Machordom, A. (2016). Merging scleractinian genera: the overwhelming genetic similarity between solitary Desmophyllum and colonial Lophelia. BMC Evol. Biol. 16:108. doi: 10.1186/s12862-016-0654-8
Arnaud-Haond, S., van den Beld, I. M. J., Becheler, R., Orejas, C., Menot, L., Frank, N., et al. (2017). Two “pillars” of cold-water coral reefs along Atlantic European margins: prevalent association of Madrepora oculata with Lophelia pertusa, from reef to colony scale. Deep Sea Res. II Top. Stud. Oceanogr. 145, 110–119. doi: 10.1016/j.dsr2.2015.07.013
Baddeley, A., Rubak, E., and Turner, R. (2015). Spatial Point Patterns: Methodology and Applications with R. Boca Raton, FL: CRC press.
Barbosa, R., Davies, A., and Sumida, P. (2019). Habitat suitability and environmental niche comparison of cold-water coral species along the Brazilian continental margin. Deep Sea Res. I Oceanogr. Res. Pap. 155:103147.
Bargain, A., Foglini, F., Pairaud, I., Bonaldo, D., Carniel, S., Angeletti, L., et al. (2018). Predictive habitat modeling in two Mediterranean canyons including hydrodynamic variables. Prog. Oceanogr. 169, 151–168. doi: 10.1016/j.pocean.2018.02.015
Bayley, D. T. I., Mogg, A. O. M., Koldewey, H., and Purvis, A. (2019). Capturing complexity: field-testing the use of ‘structure from motion’ derived virtual models to replicate standard measures of reef physical structure. Peerj 7:e6540. doi: 10.7717/peerj.6540
Bennecke, S., Kwasnitschka, T., Metaxas, A., and Dullo, W. C. (2016). In situ growth rates of deep-water octocorals determined from 3D photogrammetric reconstructions. Coral Reefs 35, 1227–1239. doi: 10.1007/s00338-016-1471-7
Boolukos, C. M., Lim, A., O’Riordan, R. M., and Wheeler, A. J. (2019). Cold-water corals in decline – a temporal (4 year) species abundance and biodiversity appraisal of complete photomosaiced cold-water coral reef on the Irish Margin. Deep Sea Res. I Oceanogr. Res. Pap. 146, 44–54. doi: 10.1016/j.dsr.2019.03.004
Brown, R. R., Davis, C. S., and Leys, S. P. (2017). Clones or clans: the genetic structure of a deep-sea sponge, Aphrocallistes vastus, in unique sponge reefs of British Columbia, Canada. Mol. Ecol. 26, 1045–1059. doi: 10.1111/mec.13982
Buhl-Mortensen, L., Vanreusel, A., Gooday, A. J., Levin, L. A., Priede, I. G., Buhl-Mortensen, P., et al. (2010). Biological structures as a source of habitat heterogeneity and biodiversity on the deep ocean margins. Mar. Ecol. 31, 21–50. doi: 10.1111/j.1439-0485.2010.00359.x
Burns, J. H. R., and Delparte, D. (2017). Comparison of commercial structure-from-motion photogrammety software used for underwater three-dimensional modeling of coral reef environments. Int. Arch. Photogram. Rem. Sens. Spat. Inform. Sci. 42:127. doi: 10.5194/isprs-archives-XLII-2-W3-127-2017
Burns, J. H. R., Delparte, D., Gates, R. D., and Takabayashi, M. (2015). Integrating structure-from-motion photogrammetry with geospatial software as a novel technique for quantifying 3D ecological characteristics of coral reefs. PeerJ 3:e1077. doi: 10.7717/peerj.1077
Casella, E., Collin, A., Harris, D., Ferse, S., Bejarano, S., Parravicini, V., et al. (2017). Mapping coral reefs using consumer-grade drones and structure from motion photogrammetry techniques. Coral Reefs 36, 269–275. doi: 10.1007/s00338-016-1522-0
Chu, J. W., and Leys, S. P. (2010). High resolution mapping of community structure in three glass sponge reefs (Porifera, Hexactinellida). Mar. Ecol. Prog. Ser. 417, 97–113.
Condit, R., Ashton, P. S., Baker, P., Bunyavejchewin, S., Gunatilleke, S., Gunatilleke, N., et al. (2000). Spatial patterns in the distribution of tropical tree species. Science 288, 1414–1418. doi: 10.1126/science.288.5470.1414
Conti, L. A., Lim, A., and Wheeler, A. J. (2019). High resolution mapping of a cold water coral mound. Sci. Rep. 9:1016. doi: 10.1038/s41598-018-37725-x
Corbera, G., Lo Iacono, C., Gracia, E., Grinyo, J., Pierdomenico, M., Huvenne, V. A. I., et al. (2019). Ecological characterisation of a Mediterranean cold-water coral reef: cabliers Coral Mound Province (Alboran Sea, western Mediterranean). Prog. Oceanogr. 175, 245–262. doi: 10.1016/j.pocean.2019.04.010
Costello, M. J., McCrea, M., Freiwald, A., Lundalv, T., Jonsson, L., Bett, B. J., et al. (2005). “Role of cold-water Lophelia pertusa coral reefs as fish habitat in the NE Atlantic,” in Cold-Water Corals and Ecosystems, eds A. Freiwald and J. M. Roberts (Berlin: Springer), 771–805. doi: 10.1007/3-540-27673-4_41
Dahl, M. P., Pereyra, R. T., Lundalv, T., and Andre, C. (2012). Fine-scale spatial genetic structure and clonal distribution of the cold-water coral Lophelia pertusa. Coral Reefs 31, 1135–1148. doi: 10.1007/s00338-012-0937-5
Dana, T. F. (1976). Reef-coral dispersion patterns and environmental variables on a caribbean coral-reef. Bull. Mar. Sci. 26, 1–13.
Davies, A. J., and Guinotte, J. M. (2011). Global habitat suitability for framework-forming cold-water corals. PLoS One 6:e18483. doi: 10.1371/journal.pone.0018483
Davies, A. J., Roberts, J. M., and Hall-Spencer, J. (2007). Preserving deep-sea natural heritage: Emerging issues in offshore conservation and management. Biol. Conserv. 138, 299–312. doi: 10.1016/j.biocon.2007.05.011
Davies, A. J., Wisshak, M., Orr, J. C., and Roberts, J. M. (2008). Predicting suitable habitat for the cold-water coral Lophelia pertusa (Scleractinia). Deep Sea Res. I Oceanogr. Res. Pap. 55, 1048–1062. doi: 10.1016/j.dsr.2008.04.010
De Clippele, L. H., Gafeira, J., Robert, K., Hennige, S., Lavaleye, M. S., Duineveld, G. C. A., et al. (2017). Using novel acoustic and visual mapping tools to predict the small-scale spatial distribution of live biogenic reef framework in cold-water coral habitats. Coral Reefs 36, 255–268. doi: 10.1007/s00338-016-1519-8
De Mol, B., Van Rensbergen, P., Pillen, S., Van Herreweghe, K., Van Rooij, D., McDonnell, A., et al. (2002). Large deep-water coral banks in the Porcupine Basin, southwest of Ireland. Mar. Geol. 188, 193–231.
Dolan, M. F. J., Grehan, A. J., Guinan, J. C., and Brown, C. (2008). Modelling the local distribution of cold-water corals in relation to bathymetric variables: adding spatial context to deep-sea video data. Deep Sea Res. I Oceanogr. Res. Pap. 55, 1564–1579. doi: 10.1016/j.dsr.2008.06.010
Dorschel, B., Hebbeln, D., Foubert, A., White, M., and Wheeler, A. J. (2007). Hydrodynamics and cold-water coral facies distribution related to recent sedimentary processes at Galway Mound west of Ireland. Mar. Geol. 244, 184–195. doi: 10.1016/j.margeo.2007.06.010
Dragut, L., Tiede, D., and Levick, S. R. (2010). ESP: a tool to estimate scale parameter for multiresolution image segmentation of remotely sensed data. Int. J. Geogr. Inform. Sci. 24, 859–871. doi: 10.1080/13658810903174803
Eccles, N. S., Esler, K. J., and Cowling, R. M. (1999). Spatial pattern analysis in Namaqualand desert plant communities: evidence for general positive interactions. Plant Ecol. 142, 71–85. doi: 10.1023/A:1009857824912
Edwards, C. B., Eynaud, Y., Williams, G. J., Pedersen, N. E., Zgliczynski, B. J., and Gleason, A. C. R. (2017). Large-area imaging reveals biologically driven non-random spatial patterns of corals at a remote reef. Coral Reefs 36, 1291–1305. doi: 10.1007/s00338-017-1624-3
Fabri, M. C., Vinha, B., Allais, A. G., Bouhier, M. E., Dugornay, O., Gaillot, A., et al. (2019). Evaluating the ecological status of cold-water coral habitats using non-invasive methods: an example from Cassidaigne canyon, northwestern Mediterranean Sea. Prog. Oceanogr. 178:102172. doi: 10.1016/j.pocean.2019.102172
FAO (2009). International Guidelines for the Management of Deep-Sea Fisheries in the High Seas. Report of the Technical Consultation on International Guidelines for the Management of Deep-sea Fisheries in the High Seas. Rome: FAO Fisheries and Aquaculture Report.
Foubert, A., Huvenne, V. A. I., Wheeler, A., Kozachenko, M., Opderbecke, J., and Henriet, J. P. (2011). The Moira Mounds, small cold-water coral mounds in the Porcupine Seabight, NE Atlantic: Part B evaluating the impact of sediment dynamics through high-resolution ROV-borne bathymetric mapping. Mar. Geol. 282, 65–78. doi: 10.1016/j.margeo.2011.02.008
Friedman, A., Pizarro, O., Williams, S. B., and Johnson-Roberson, M. (2012). Multi-scale measures of rugosity, slope and aspect from benthic stereo image reconstructions. PLoS One 7:e50440. doi: 10.1371/journal.pone.0050440
Geyer, C. J. (1999). “Likelihood inference for spatial point processes,” in Stochastic Geometry: Likelihood and Computation, eds O. E. Barndorff-Nielsen, W. S. Kendall, and M. N. M. Van Lieshout (London: Chapman and Hall), 79–140.
Gori, A., Rossi, S., Linares, C., Berganzo, E., Orejas, C., Dale, M. R., et al. (2011). Size and spatial structure in deep versus shallow populations of the Mediterranean gorgonian Eunicella singularis (Cap de Creus, northwestern Mediterranean Sea). Mar. Biol. 158, 1721–1732. doi: 10.1007/s00227-011-1686-7
Hennige, S., Wicks, L., Kamenos, N., Perna, G., Findlay, H., and Roberts, J. (2015). Hidden impacts of ocean acidification to live and dead coral framework. Proc. R. Soc. B 282:20150990.
Henry, L. A., and Roberts, J. M. (2017). “Global biodiversity in cold-water coral reef ecosystems,” in Marine Animal Forests, eds S. Rossi, L. Bramanti, A. Gori, and C. Orejas (Cham: Springer). doi: 10.1007/978-3-319-21012-4_6
Hooper, R. C., and Eichhorn, M. P. (2016). Too close for comfort: spatial patterns in acorn barnacle populations. Popul. Ecol. 58, 231–239. doi: 10.1007/s10144-016-0542-5
Huvenne, V. A. I., Bett, B. J., Masson, D. G., Le Bas, T. P., and Wheeler, A. J. (2016). Effectiveness of a deep-sea cold-water coral Marine Protected Area, following eight years of fisheries closure. Biol. Conserv. 200, 60–69. doi: 10.1016/j.biocon.2016.05.030
Illian, J., Penttinen, A., Stoyan, H., and Stoyan, D. (2008). Statistical Analysis and Modelling of Spatial Point Patterns. Hoboken, NJ: Wiley, doi: 10.1002/9780470725160
Jackson, E. L., Davies, A. J., Howell, K. L., Kershaw, P. J., and Hall-Spencer, J. M. (2014). Future-proofing marine protected area networks for cold water coral reefs. ICES J. Mar. Sci. 71, 2621–2629. doi: 10.1093/icesjms/fsu099
Jensen, A., and Frederiksen, R. (1992). The fauna associated with the bank-forming deep-water coral Lophelia-pertusa (Scleractinaria) on the Faroe Shelf. Sarsia 77, 53–69. doi: 10.1080/00364827.1992.10413492
Law, R., Illian, J., Burslem, D. F. R. P., Gratzer, G., Gunatilleke, C. V. S., and Gunatilleke, I. A. U. N. (2009). Ecological information from spatial patterns of plants: insights from point process theory. J. Ecol. 97, 616–628. doi: 10.1111/j.1365-2745.2009.01510.x
Le Goff-Vitry, M. C., Pybus, O. G., and Rogers, A. D. (2004). Genetic structure of the deep-sea coral Lophelia pertusa in the northeast Atlantic revealed by microsatellites and internal transcribed spacer sequences. Mol. Ecol. 13, 537–549. doi: 10.1046/j.1365-294X.2004.2079.x
Leon, J. X., Roelfsema, C. M., Saunders, M. I., and Phinn, S. R. (2015). Measuring coral reef terrain roughness using ‘Structure-from-Motion’ close-range photogrammetry. Geomorphology 242, 21–28. doi: 10.1016/j.geomorph.2015.01.030
Lesneski, K. C., D’Aloia, C. C., Fortin, M. J., and Buston, P. M. (2019). Disentangling the spatial distributions of a sponge-dwelling fish and its host sponge. Mar. Biol. 166:66. doi: 10.1007/s00227-019-3517-1
Lessard-Pilon, S. A., Podowski, E. L., Cordes, E. E., and Fisher, C. R. (2010). Megafauna community composition associated with Lophelia pertusa colonies in the Gulf of Mexico. Deep Sea Res. II Top. Stud. Oceanogr. 57, 1882–1890. doi: 10.1016/j.dsr2.2010.05.013
Levin, S. A. (1992). The problem of pattern and scale in ecology. Ecology 73, 1943–1967. doi: 10.2307/1941447
Lim, A., Huvenne, V. A. I., Vertino, A., Spezzaferri, S., and Wheeler, A. J. (2018b). New insights on coral mound development from groundtruthed high-resolution ROV-mounted multibeam imaging. Mar. Geol. 403, 225–237. doi: 10.1016/j.margeo.2018.06.006
Lim, A., Kane, A., Arnaubec, A., and Wheeler, A. J. (2018a). Seabed image acquisition and survey design for cold water coral mound characterisation. Mar. Geol. 395, 22–32. doi: 10.1016/j.margeo.2017.09.008
Lim, A., Wheeler, A. J., and Arnaubec, A. (2017). High-resolution facies zonation within a cold-water coral mound: the case of the Piddington Mound, Porcupine Seabight, NE Atlantic. Mar. Geol. 390, 120–130. doi: 10.1016/j.margeo.2017.06.009
Lim, A., Wheeler, A. J., and Conti, L. (2021). Cold-water coral habitat mapping: trends and developments in acquisition and processing methods. Geosciences 11:9. doi: 10.3390/geosciences11010009
Lim, A., Wheeler, A. J., Price, D. M., O’Reilly, L., Harris, K., and Conti, L. (2020). Influence of benthic currents on cold-water coral habitats: a combined benthic monitoring and 3D photogrammetric investigation. Sci. Rep. 10, 1–15. doi: 10.1038/s41598-020-76446-y
Ling, S. D., Mahon, I., Marzloff, M. P., Pizarro, O., Johnson, C. R., and Williams, S. B. (2016). Stereo-imaging AUV detects trends in sea urchin abundance on deep overgrazed reefs. Limnol. Oceanogr. Methods 14, 293–304. doi: 10.1002/lom3.10089
Lo Iacono, C., Robert, K., Gonzalez-Villanueva, R., Gori, A., Gili, J. M., and Orejas, C. (2018). Predicting cold-water coral distribution in the Cap de Creus Canyon (NW Mediterranean): implications for marine conservation planning. Prog. Oceanogr. 169, 169–180. doi: 10.1016/j.pocean.2018.02.012
McDowall, P., and Lynch, H. J. (2017). Ultra-fine scale spatially-integrated mapping of habitat and occupancy using structure-from-motion. PLoS One 12:e166773. doi: 10.1371/journal.pone.0166773
Melles, S. J., Badzinski, D., Fortin, M. J., Csillag, F., and Lindsay, K. (2009). Disentangling habitat and social drivers of nesting patterns in songbirds. Landsc. Ecol. 24, 519–531. doi: 10.1007/s10980-009-9329-9
Meyer, H. K., Roberts, E. M., Rapp, H. T., and Davies, A. J. (2019). Spatial patterns of arctic sponge ground fauna and demersal fish are detectable in autonomous underwater vehicle (AUV) imagery. Deep Sea Res. I Oceanogr. Res. Pap. 153, 103137. doi: 10.1016/j.dsr.2019.103137
Mienis, F., Bouma, T. J., Witbaard, R., van Oevelen, D., and Duineveld, G. C. A. (2019). Experimental assessment of the effects of cold-water coral patches on water flow. Mar. Ecol. Prog. Ser. 609, 101–117. doi: 10.3354/meps12815
Miller, K. J. (1998). Short-distance dispersal of black coral larvae: inference from spatial analysis of colony genotypes. Mar. Ecol. Prog. Ser. 163, 225–233. doi: 10.3354/meps163225
Mitchell, E. G., and Harris, S. (2020). Mortality, population and community dynamics of the glass sponge dominated community “The Forest of the Weird” from the ridge seamount, Johnston Atoll, Pacific Ocean. Front. Mar. Sci. 7:872. doi: 10.3389/fmars.2020.565171
Morgan, N. B., and Baco, A. R. (2019). Observation of a high abundance aggregation of the deep-sea urchin Chaetodiadema pallidum A. Agassiz and HL Clark, 1907 on the Northwestern Hawaiian Island Mokumanamana. Deep Sea Res. I Oceanogr. Res. Pap. 150:103067. doi: 10.1016/j.dsr.2019.06.013
Mortensen, P. B., Hovland, M., Brattegard, T., and Farestveit, R. (1995). Deep water bioherms of the scleractinian coral Lophelia pertusa (L.) at 64 N on the Norwegian shelf: structure and associated megafauna. Sarsia 80, 145–158.
Murfitt, S. L., Allan, B. M., Bellgrove, A., Rattray, A., Young, M. A., and Ierodiaconou, D. (2017). Applications of unmanned aerial vehicles in intertidal reef monitoring. Sci. Rep. 7:10259. doi: 10.1038/s41598-017-10818-9
Orejas, C., Gori, A., Lo Iacono, C., Puig, P., Gili, J. M., and Dale, M. R. T. (2009). Cold-water corals in the Cap de Creus canyon, northwestern Mediterranean: spatial distribution, density and anthropogenic impact. Mar. Ecol. Prog. Ser. 397, 37–51. doi: 10.3354/mep08314
Orejas, C., Gori, A., Rad-Menendez, C., Last, K. S., Davies, A. J., Beveridge, C. M., et al. (2016). The effect of flow speed and food size on the capture efficiency and feeding behaviour of the cold-water coral Lophelia pertusa. J. Exp. Mar. Biol. Ecol. 481, 34–40. doi: 10.1016/j.jembe.2016.04.002
Parrish, J. K., and Edelstein-Keshet, L. (1999). Complexity, pattern, and evolutionary trade-offs in animal aggregation. Science 284, 99–101. doi: 10.1126/science.284.5411.99
Pearman, T. R. R., Robert, K., Callaway, A., Hall, R., Lo Iacono, C., and Huvenne, V. A. I. (2020). Improving the predictive capability of benthic species distribution models by incorporating oceanographic data – towards holistic ecological modelling of a submarine canyon. Prog. Oceanogr. 184:102338. doi: 10.1016/j.pocean.2020.102338
Piechaud, N., Hunt, C., Culverhouse, P. F., Foster, N. L., and Howell, K. L. (2019). Automated identification of benthic epifauna with computer vision. Mar. Ecol. Prog. Ser. 615, 15–30. doi: 10.3354/meps12925
Pizarro, O., Friedman, A., Bryson, M., Williams, S. B., and Madin, J. (2017). A simple, fast, and repeatable survey method for underwater visual 3D benthic mapping and monitoring. Ecol. Evol. 7, 1770–1782. doi: 10.1002/ece3.2701
Plante, M., Lowell, K., Potvin, F., Boots, B., and Fortin, M. J. (2004). Studying deer habitat on Anticosti Island, Quebec: relating animal occurrences and forest map information. Ecol. Model. 174, 387–399. doi: 10.1016/j.ecolmodel.2003.09.035
Prado, E., Rodríguez-Basalo, A., Cobo, A., Ríos, P., and Sánchez, F. (2020). 3D fine-scale terrain variables from underwater photogrammetry: a new approach to benthic microhabitat modeling in a Circalittoral Rocky Shelf. Rem. Sens. 12:2466. doi: 10.3390/rs1215246624
Prado, E., Sánchez, F., Rodríguez-Basalo, A., Altuna, Á, and Cobo, A. (2019). Analysis of the population structure of a gorgonian forest (Placogorgia sp.) using a photogrammetric 3D modeling approach at Le Danois Bank, Cantabrian Sea. Deep Sea Res. I Oceanogr. Res. Pap. 153:1031.
Price, D. M., Robert, K., Callaway, A., Lo Iacono, C., Hall, R. A., and Huvenne, V. A. (2019). Using 3D photogrammetry from ROV video to quantify cold-water coral reef structural complexity and investigate its influence on biodiversity and community assemblage. Coral Reefs 38, 1007–1021. doi: 10.1007/s00338-019-01827-3
Purser, A., Orejas, C., Gori, A., Tong, R. J., Unnithan, V., and Thomsen, L. (2013). Local variation in the distribution of benthic megafauna species associated with cold-water coral reefs on the Norwegian margin. Continent. Shelf Res. 54, 37–51. doi: 10.1016/j.csr.2012.12.013
Raber, G. T., and Schill, S. R. (2019). Reef Rover: a low-cost small autonomous unmanned surface vehicle (USV) for mapping and monitoring coral reefs. Drones 3:38. doi: 10.3390/drones3020038
Richardson, L. E., Graham, N. A., and Hoey, A. S. (2017). Cross-scale habitat structure driven by coral species composition on tropical reefs. Sci. Rep. 7, 1–11. doi: 10.1038/s41598-017-08109-4
Robert, K., Huvenne, V. A. I., Georgiopoulou, A., Jones, D. O. B., Marsh, L., Carter, G. D. O., et al. (2017). New approaches to high-resolution mapping of marine vertical structures. Sci. Rep. 7:9005. doi: 10.1038/s41598-017-09382-z
Robert, K., Jones, D. O., Georgiopoulou, A., and Huvenne, V. A. I. (2019). Cold-water coral assemblages on vertical walls from the Northeast Atlantic. Divers. Distrib. 26, 284–298. doi: 10.1111/ddi.13011
Rogers, A. D. (1999). The biology of Lophelia pertusa (LINNAEUS 1758) and other deep-water reef-forming corals and impacts from human activities. Int. Rev. Hydrobiol. 84, 315–406.
Ross, R. E., and Howell, K. L. (2013). Use of predictive habitat modelling to assess the distribution and extent of the current protection of ‘listed’ deep-sea habitats. Diver. Distribut. 19, 433–445. doi: 10.1111/ddi.12010
Simon-Lledo, E., Bett, B. J., Huvenne, V. A. I., Koser, K., Schoening, T., Greinert, J., et al. (2019). Biological effects 26 years after simulated deep-sea mining. Sci. Rep. 9:8040. doi: 10.1038/s41598-019-44492-w
Stevenson, A., Mitchell, F. J. G., and Davies, J. S. (2015). Predation has no competition: factors influencing space and resource use by echinoids in deep-sea coral habitats, as evidenced by continuous video transects. Mar. Ecol. Evol. Perspect. 36, 1454–1467. doi: 10.1111/maec.12245
Thornton, B., Bodenmann, A., Pizarro, O., Williams, S. B., Friedman, A., Nakajima, R., et al. (2016). Biometric assessment of deep-sea vent megabenthic communities using multi-resolution 3D image reconstructions. Deep Sea Res. I Oceanogr. Res. Pap. 116, 200–219. doi: 10.1016/j.dsr.2016.08.009
Turley, C. M., Roberts, J. M., and Guinotte, J. M. (2007). Corals in deep-water: will the unseen hand of ocean acidification destroy cold-water ecosystems? Coral Reefs 26, 445–448. doi: 10.1007/s00338-007-0247-5
Vertino, A., Savini, A., Rosso, A., Di Geronimo, I., Mastrototaro, F., Sanfilippo, R., et al. (2010). Benthic habitat characterization and distribution from two representative sites of the deep-water SML Coral Province (Mediterranean). Deep Sea Res. II Top. Stud. Oceanogr. 57, 380–396. doi: 10.1016/j.dsr2.2009.08.023
Wagner, D., Waller, R. G., and Toonen, R. J. (2011). Sexual reproduction of Hawaiian black corals, with a review of the reproduction of antipatharians (Cnidaria: Anthozoa: Hexacorallia). Invertebr. Biol. 130, 211–225. doi: 10.1111/j.1744-7410.2011.00233.x
Wheeler, A. J., Beck, T., Thiede, J., Klages, M., Grehan, A., Monteys, F. X., et al. (2005c). “Deep-water coral mounds on the Porcupine Bank, Irish Margin: preliminary results from the Polarstern ARK-XIX/3a ROV cruise,” in Cold-Water Corals and Ecosystems, eds A. Freiwald and J. M. Roberts (Berlin: Springer), 393–402. doi: 10.1007/3-540-27673-4_19
Wheeler, A. J., Bett, B. J., Billett, D. S. M., Masson, D. G., and Mayor, D. (2005a). “’The impact of demersal trawling on NE Atlantic deep-water coral habitats: the case of the Darwin Mounds, UK,” in Benthic Habitats and the Effects of Fishing, eds J. Thomas and P. Barnes (Bethesda, MD: American Fisheries Society), 807–818.
Wheeler, A. J., Beyer, A., Freiwald, A., de Haas, H., Huvenne, V. A. I., Kozachenko, M., et al. (2007). Morphology and environment of cold-water coral carbonate mounds on the NW European margin. Int. J. Earth Sci. 96, 37–56. doi: 10.1007/s00531-006-0130-6
Wheeler, A. J., Kozachenko, M., Beyer, A., Foubert, A., Huvenne, V. A. I., Klages, M., et al. (2005b). “Sedimentary processes and carbonate mounds in the Belgica Mound province, Porcupine Seabight, NE Atlantic,” in Cold-Water Corals and Ecosystems, eds A. Freiwald and J. M. Roberts (Berlin: Springer), 571–603. doi: 10.1007/3-540-27673-4_28
Wheeler, A. J., Kozachenko, M., Henry, L. A., Foubert, A., de Haas, H., Huvenne, V. A. I., et al. (2011). The Moira Mounds, small cold-water coral banks in the Porcupine Seabight, NE Atlantic: Part A an early stage growth phase for future coral carbonate mounds? Mar. Geol. 282, 53–64. doi: 10.1016/j.margeo.2010.08.006
Wheeler, A. J., and Shipboard Party (2011). Vents & Reefs Deep-Sea Ecosystem Study of the 45° North MAR Hydrothermal Vent Field and The Cold-Water Coral Moira Mounds, Porcupine Seabight. In: Cruise Report 160. Cork: University College Cork.
Wheeler, A. J., and Shipboard Party (2015). Quantifying Environmental Controls on Cold-Water Coral Reef Growth. In: Cruise Report 160. Cork: University College Cork.
Wilson, J. B. (1979). The distribution of the coral Lophelia pertusa (L.)[L. prolifera (Pallas)] in the north-east Atlantic. J. Mar. Biol. Assoc. UK 59, 149–164. doi: 10.1017/S0025315400046245
Woodall, C. W., and Graham, J. M. (2004). A technique for conducting point pattern analysis of cluster plot stem-maps. Forest Ecol. Manag. 198, 31–37. doi: 10.1016/j.foreco.2004.03.037
Wynn, R. B., Huvenne, V. A. I., Le Bas, T. P., Murton, B. J., Connelly, D. P., Bett, B. J., et al. (2014). Autonomous Underwater Vehicles (AUVs): their past, present and future contributions to the advancement of marine geoscience. Mar. Geol. 352, 451–468. doi: 10.1016/j.margeo.2014.03.012
Xavier, J. R., Tojeira, I., and Van Soest, R. W. M. (2015). On a hexactinellid sponge aggregation at the Great Meteor seamount (North-east Atlantic). J. Mar. Biol. Assoc. UK 95, 1389–1394. doi: 10.1017/S0025315415000685
Yoshioka, P. M., and Yoshioka, B. B. (1989). A multispecies, multiscale analysis of spatial pattern and its application to a shallow-water gorgonian community. Mar. Ecol. Prog. Ser. 54, 257–264. doi: 10.3354/meps054257
Keywords: cold-water coral, point pattern analysis, structure from motion, spatial patterns, photomosaic, landscape ecology, NE Atlantic
Citation: Price DM, Lim A, Callaway A, Eichhorn MP, Wheeler AJ, Lo Iacono C and Huvenne VAI (2021) Fine-Scale Heterogeneity of a Cold-Water Coral Reef and Its Influence on the Distribution of Associated Taxa. Front. Mar. Sci. 8:556313. doi: 10.3389/fmars.2021.556313
Received: 27 April 2020; Accepted: 18 February 2021;
Published: 23 March 2021.
Edited by:
Juan Armando Sanchez, University of Los Andes, ColombiaReviewed by:
Lorenzo Angeletti, Institute of Marine Science (CNR), ItalyAshley Alun Rowden, National Institute of Water and Atmospheric Research (NIWA), New Zealand
Copyright © 2021 Price, Lim, Callaway, Eichhorn, Wheeler, Lo Iacono and Huvenne. This is an open-access article distributed under the terms of the Creative Commons Attribution License (CC BY). The use, distribution or reproduction in other forums is permitted, provided the original author(s) and the copyright owner(s) are credited and that the original publication in this journal is cited, in accordance with accepted academic practice. No use, distribution or reproduction is permitted which does not comply with these terms.
*Correspondence: David M. Price, d.m.price@soton.ac.uk