High-Resolution Carbonate System Dynamics of Netarts Bay, OR From 2014 to 2019
 William Fairchild
 Burke Hales
- College of Earth, Ocean, and Atmospheric Sciences, Oregon State University, Corvallis, OR, United States
Netarts Bay is a shallow, temperate, tidal lagoon located on the northern coast of Oregon and the site of the Whiskey Creek Shellfish Hatchery (WCSH). Data collected with an autonomous continuous flow-through system installed at WCSH capable of high-resolution (1 Hz) partial pressure of aqueous CO2 (pCO2) and hourly total dissolved inorganic carbon (TCO2) measurements, with combined measurement uncertainties of < 2.0% and 0.5%, respectively, is analyzed over the 2014–2019 interval. Summer upwelling, wintertime downwelling, and in situ bay biogeochemistry represent significant modes of the observed variability in carbonate system dynamics. Summer upwelling is associated with large amplitude diel pCO2 variability, elevated TCO2 and alkalinity, but weak variability in salinity. Wintertime downwelling is associated with bay freshening by both local and remote sources, a strong tidal signature in salinity, TCO2, and alkalinity, with diel pCO2 variability much less amplified when compared to summer. Further, analysis of alkalinity-salinity relationships suggests multiple water masses inhabiting the bay during 1 year: mixing of end-members associated with direct precipitation, coastal rivers, southward displacement of the Columbia River plume, California Current surface and deep upwelled waters. The importance of in-bay processes such as net community metabolism during intervals of high productivity are apparent. These direct measurements of pCO2 and TCO2 have been useful to local hatchery owners who have monitored intake waters following historic seed-production failures related to high-CO2 conditions exacerbated by ocean acidification.
Introduction
Shallow coastal ecosystems, coral reefs, and temperate estuaries are among the most vulnerable oceanographic regimes currently threatened by exposure to elevated atmospheric CO2 and related anthropogenic forcings (Peirson et al., 2015). Enhanced nutrient loading from anthropogenically modified runoff, habitat loss, introduction of invasive species, altered freshwater flow, dredging, expanding ‘dead zones’ characterized by prolonged hypoxic episodes, and trace metal contamination represent some of the many stressors facing modern estuarine systems (Kennish, 2002; Diaz and Rosenberg, 2008). Additionally, rising sea levels, ocean acidification, and loss of global marine biomass further complicate these vital ecosystems’ health and stability and the goods and services they provide (Rabalais et al., 2009).
Near-shore monitoring studies of oceanic CO2 in the Pacific Northwest have primarily been limited to shipboard measurements in tandem with buoy observations during upwelling intervals (van Geen et al., 2000; Ianson et al., 2003; Hales et al., 2005; Feely et al., 2008; Nemcek et al., 2008; Evans et al., 2011) while more recent work in the Columbia River, Puget Sound, and Salish Sea have introduced CO2 data at higher spatiotemporal resolution (Evans et al., 2013, 2019; Fassbender et al., 2018). The lack of extensive spatiotemporal sampling represents a hurdle in understanding how the dynamic coastal ocean and estuarine environments are interacting with and responding to the cascading and complex problems associated with ongoing climate change. Biophysical processes within shallow coastal shelves and estuarine bodies occur across variable time and space scales (Waldbusser and Salisbury, 2014), from hours to interannual, and forecasting how these environments will respond to climate change continues to be challenging, requiring more expansive and higher resolution coastal monitoring networks.
Despite poor data coverage, our understanding of ocean acidification’s impact on organismal life cycles, specifically for larval and juvenile bivalves, shows these organisms experiencing physiological stress across varying levels of pCO2, pH, and/or saturation state at levels currently observed during various periods of the year (Waldbusser et al., 2011, 2015a; Barton et al., 2012; White et al., 2013). Ocean acidification-related symptoms include, but are not limited to, compromised shell integrity, increased mortality, and reduced recruitment success. Crassostrea gigas, for example, shows enhanced sensitivity to water conditions during the first 48 h of calcification (Barton et al., 2012). An under sampling of the coastal ocean in both time and space in assessment of coastal water chemistry may result in these bivalve-poor water conditions to be overlooked entirely.
However, high-resolution carbonate sampling is not mission-critical to understand in real-time how ocean acidification is threatening habitat stability, organismal life cycles, and even fisheries economies. During the summer of 2009, Whiskey Creek Shellfish Hatchery in Netarts Bay, OR, sustained significant and prolonged larval oyster mortality in response to intake water which was corrosive and fatal to their broodstock (Barton et al., 2012). A liquid flow-through pCO2/TCO2 instrument was installed in 2011 to monitor in-take water conditions in real time (Vance, 2012). Coincident with water chemistry monitoring, hatchery operators moved the growing season to earlier in the year and began conditioning incoming seawater with sodium carbonate to elevate saturation states to optimal shellfish growing levels. In an industry worth $270 million regionally and one which employs 3000 + people (Barton et al., 2015), implementation of this strategy to mitigate the severe effects of ocean acidification on bivalve mortality continues to be beneficia for hatchery operators at Whiskey Creek. Recreational shellfishing, on the other hand, will be more directly impacted by changing ocean carbonate chemistry since the intertidal zone and shallow estuarine shellfish habitats are directly exposed to dynamic carbonate conditions.
Netarts Bay is a temperate, well-mixed, tidal lagoon located 90 km south of the Columbia River mouth on the Oregon Pacific coast (Figure 1). Draining only a 4100 Ha watershed, the bay is marine-dominated, receiving freshwater input only from about a dozen very small streams, primarily during the winter storm seasons (McCallum, 1977). A 6 km-long sandspit stretching north-to-south forms the seaward boundary of the estuary and the primary exchange of water occurs at the ∼100 m wide tidal channel located at the northern end of the spit. The net effect of bay hydrology and tidal dynamics results in rapid flushing and water residence times < 12 h (Glanzman, 1971); a single ebb-flood cycle can replace approximately 2/3 of the bay’s water during intervals of spring tides.
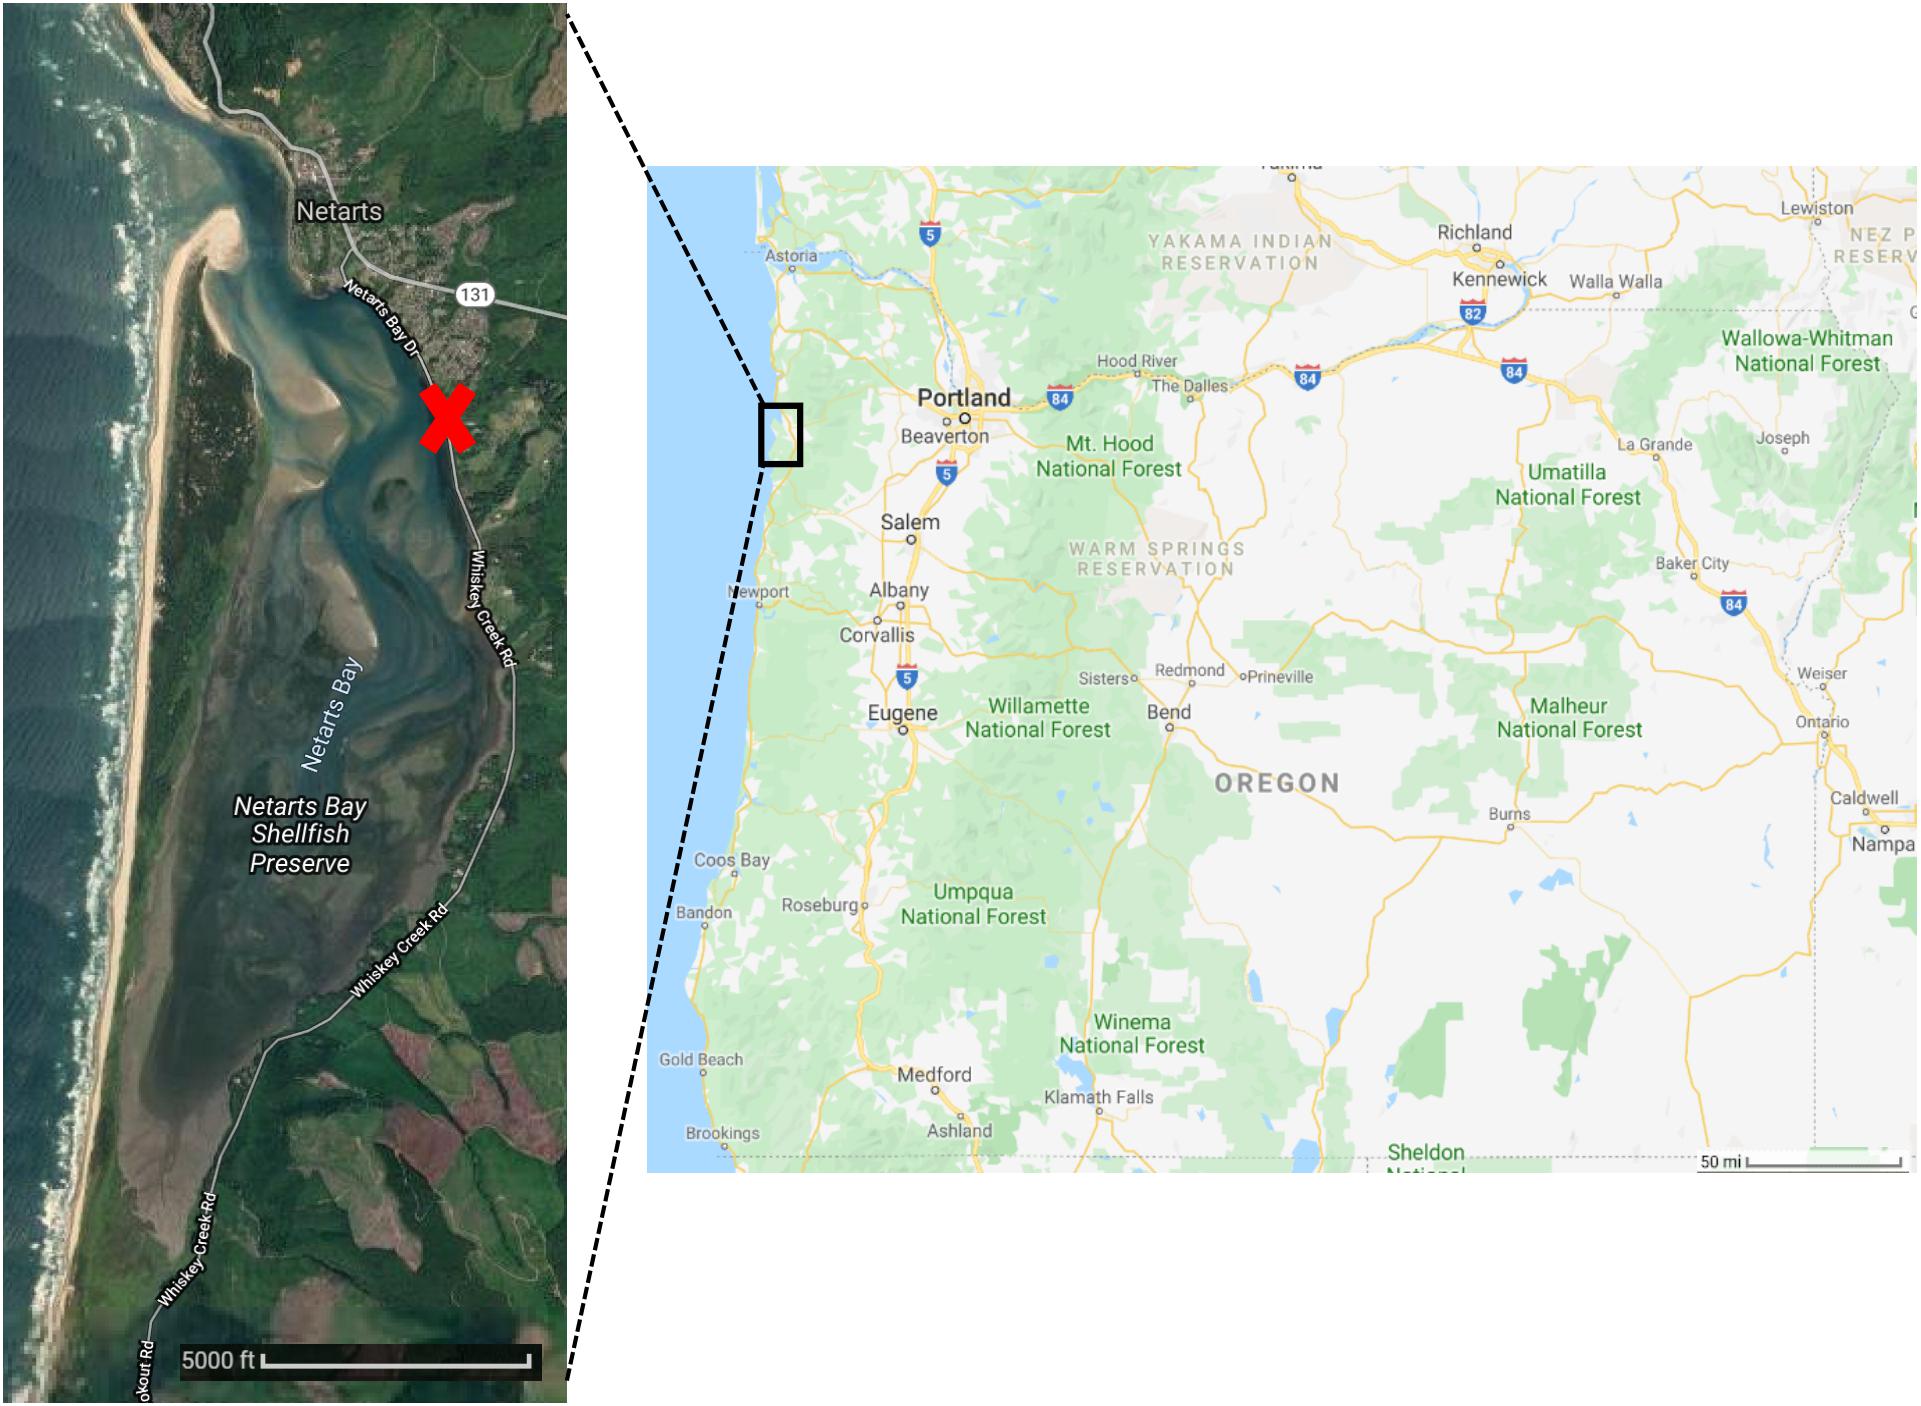
Figure 1. Oregon state map (Right) and satellite imagery of Netarts Bay (Left). Red X marks site of Whiskey Creek Shellfish Hatchery (WCSH). Images courtesy of Google Earth.
For this study, we analyzed 6-year time series of high-resolution carbonate chemistry measurements taken from Netarts Bay, OR, with the goal to analyze hydrographic and carbonate trends, establish modern baselines, and examine scales of variability that are not often resolved from discrete sampling methods.
Materials and Methods
Whiskey Creek Shellfish Hatchery (WCSH; 45.403°N, 123.944°W) is located on the eastern bank of Netarts Bay, approximately 2 km south of the bay’s mouth. During the 2007–2008 growing season, hatcheries up and down the Pacific Northwest coast, including WCSH, experienced intermittent but significant mass larval mortality, which was later directly linked to high-CO2 content in intake waters (Barton et al., 2012, 2015). Beginning in 2011, Vance (2012) installed an automated system that combined pCO2 and TCO2 measurements, following the TCO2 system as described by Bandstra et al. (2006) combined with the pCO2 system described by Hales et al. (2004) modified to use a showerhead-style equilibrator. This precursor system was redesigned prior to 2014 and has been in operation more or less continuously in its current configuration since then.
Briefly, hatchery seawater is branched into an adjacent side-laboratory, passing through a SeaBird Electronics 45 MicroTSG (SBE45) which continuously measures in situ temperature and conductivity, allowing determination of salinity. The intake pipe remains submerged 0.5 m above the seafloor at an average depth 2 m. Downstream of the TSG is an enclosed-headspace shower-head equilibrator in which the seawater flows over a porous bubbler tube where the recirculated headspace gas is introduced to the equilibration chamber. High water flow rates and vigorous bubbling ensures complete equilibration of the headspace gas CO2 with the dissolved CO2 in the sample stream. The headspace gas is recirculated in a closed loop, passing through a detector unit (LI-840A1), where the CO2 content of the gas is measured via infrared spectrometry.
Once an hour, the instrument performs a TCO2 sequence closely following the method of Bandstra et al. (2006). Water is drawn from the main seawater flow through a custom 40-micron tangential-flow filter at a pump-controlled 20 mL/min and acidified with a 0.1 mL/min flow of a solution of 30% concentrated HCl in distilled water. The acidified liquid sample stream flows through the lumen-side of a hydrophobic microporous membrane contactor (Liquicell G543), while a CO2-free gas stream controlled at 900 ml/min by a molecular mass-flow controller (Alicat Scientific) flows counter to the liquid stream on the shell-side of the contactor. A steady-state mass balance governs the CO2 composition of the outlet gas stream. With precisely controlled gas and liquid flows, the xCO2 of the effluent gas stream, measured by the LI-840A, is proportional to the TCO2 of the sample water.
The instrument is controlled by a computer and a custom acquisition and control program developed in LabView. Data (LI-840A, mass flow, and SBE45 output, and several operational analog sensors) are sampled and stored at 1-Hz frequency. At user-specified intervals (30 s here), the program calculates medians of the continuous data (pCO2, salinity, and temperature), applies calibrations and corrections, and performs carbonate-system calculations to give real-time estimates of water alkalinity, pHt (presented here on the total hydrogen ion scale), and CaCO3 mineral saturation states.
Calibrations and Standards
Both gas and liquid-phase standards are run automatically at user-specified intervals (6 h for this work) to verify detector accuracy and the relationship between TCO2 outlet strip gas and inlet-water TCO2 concentration. Gas standards are a set of three cylinders of gravimetrically prepared mixtures of CO2 in ultrapure air, typically spanning the range of 200–2000 ppm, but there were variations over the course of this study. The LI-840A is factory-linearized over a range of 0–20000 ppm, and we have verified this linearity up to 7000 ppm in the laboratory. In the instances where the natural dynamic range exceeds the calibration range, we are confident that our linear regression (R2 typically > 0.999, n ≥ 3) can be extended to any CO2 level observed here. Liquid standards are three solutions of NaHCO3 and Na2CO3 in deionized water, in proportions selected to maintain near-ambient solution pCO2 at TCO2 concentrations of 1200, 1800, and 2400 μmol/kg. The liquid calibration is likewise highly linear (R2 typically > 0.999, n ≥ 3). Calibration sequences are processed, and regressions performed in real time. At each calibration interval, measurements of outside air xCO2 and barometric pressure are made.
Raw LI-840A xCO2 measurements are corrected using linear regressions performed from bracketing gas standard sequences using gases of known CO2 mixing ratio. A drift correction is applied to the converted data using a linear interpolation in time between adjacent standard sequences. Calibrated xCO2 during pCO2 operations are converted to pCO2 using the total headspace pressure, which is undetectably different from ambient atmospheric pressure. Calibrated xCO2 data during TCO2 operations are converted to TCO2 in μM using the set of liquid standard sequences which bookend any given TCO2 measurement, and subsequently converted to μmol/kg using sample density calculated from the SBE45 temperature and salinity. A density and CRM correction are applied post-conversion to arrive at units of μmol/kg. Synchronizing hourly TCO2 measurements with temperature, salinity, and time-weighted interpolated pCO2 value allows for calculation of hourly alkalinity (Eq. 1), pHt, and mineral saturation with use of a program such as CO2Sys or CO2Calc, though we use our own calculation program here (CarbCalc; developed by B. Hales). For the custom CarbCalc function, we use the dissociation constants of water provided by Millero (2010), calcite and aragonite solubility constants from Mucci (1983), and constants for equilibrium of carbonic acid from Millero (2010) and boric acid by Dickson (1990).
To cross-check the accuracy of the instrument’s TCO2 response, certified reference materials (CRM) provided by Scripps Institute of Oceanography (Dickson laboratory) were run roughly every other month throughout the study. These CRMs contain highly accurate and precisely known concentrations of TCO2 and alkalinity. On-site TCO2 measurements of these CRM’s consistently produce correction factors 0.985 ± 0.005 (n = 14), so we applied a single correction of 0.985 to our TCO2 data over the duration of the study. This implies an uncertainty of ± 0.5% (∼10 μmol/kg) in TCO2, which exceeds that achievable in a more controlled operation (Bandstra et al., 2006), but is quite small in the context of this dynamic setting where TCO2 ranges from 1200 to 2300 μmol/kg during the year.
On a weekly basis, discrete check samples were collected in 350 ml amber glass bottles downstream of the equilibration chamber, poisoned with mercuric chloride, and capped with metal bottle caps. These samples were analyzed in the Hales’ laboratory at Oregon State University using combined pCO2/TCO2 measurements as described above but modified for discrete samples. Check samples (n = 237) reveal that pCO2 measurements at WCSH are within ± 5% of the discrete-sampler system, while TCO2 measurements are within ± 1%. Discrepancies between the two measurements can arise from human error such as inconsistent sampling procedure, failure to adequately poison the discrete sample bottle, and occasional transcription errors. We believe these disagreements represent extreme bounds on the uncertainty of the system, particularly for pCO2 which is more robust in the continuous equilibration than in discrete bottle samples. For example, the equilibration of a discrete liquid sample containing headspace gas, albeit relatively small in volume, inherently and unpreventably alters the exact chemistry of the sample. The asymptote of an infinitesimal headspace and an infinite water sample is more closely approached by a fixed, recirculated gaseous headspace equilibrated with a continuous flow of seawater than by the discrete liquid sample in a bottle.
Full data processing, including a suite of statistical analyses, was performed using compiled language and programs written in RStudio (version 1.2.5033). Complete annual data coverage proved challenging due to several internal and external circumstances. Such instances included times of seawater flow stoppage, either in the main hatchery supply—specifically during late September when hatchery operations slow down and pipes are cleaned or replaced—or in the branch to the laboratory, clogs in the headspace recirculation airflow, LI-840A detector failures, HCl depletion, etc. These failures were recognizable from anomalous system variables, such as flow or pressure readings, atypical temperature and salinity readings (i.e., negative salinities), among others. QA/QC was applied manually to remove instances of system malfunction. Despite various setbacks, we were able to process and analyze ∼75% of measurements taken from 2014 to 2019.
Results
The time series data presented below represent a highly dynamic system, with multiple timescales of variability. Our examination of the data revealed four key timescales of variability: diel, which persists throughout the year; seasonal, reflecting the transition between predominantly upwelling summer and predominantly downwelling winter conditions; summer-event variability associated with upwelling/relaxation cycles; and winter-event variability associated with storms and precipitation events. There are other scales of variability present, such as sub-hourly, but our discussion will focus on elucidating those listed above, using the data from 2017 as exemplary in terms of data coverage before presenting the 2014–2019 composite.
Summer and Winter 7-Day Direct Observations
Plots of the measurements of temperature, salinity, and pCO2 at 30-s resolution, and TCO2 at hourly resolution for two 7-day periods in February and June of 2017 are shown in Figure 2. Modeled tide height, relative to Crescent City, CA (NOAA reference station ID: 9419750) is shown as a spline-fit of daily high-and-low tides (data courtesy of https://tidesandcurrents.noaa.gov/), and shading represents local day- and night-time, yellow and blue, respectively.
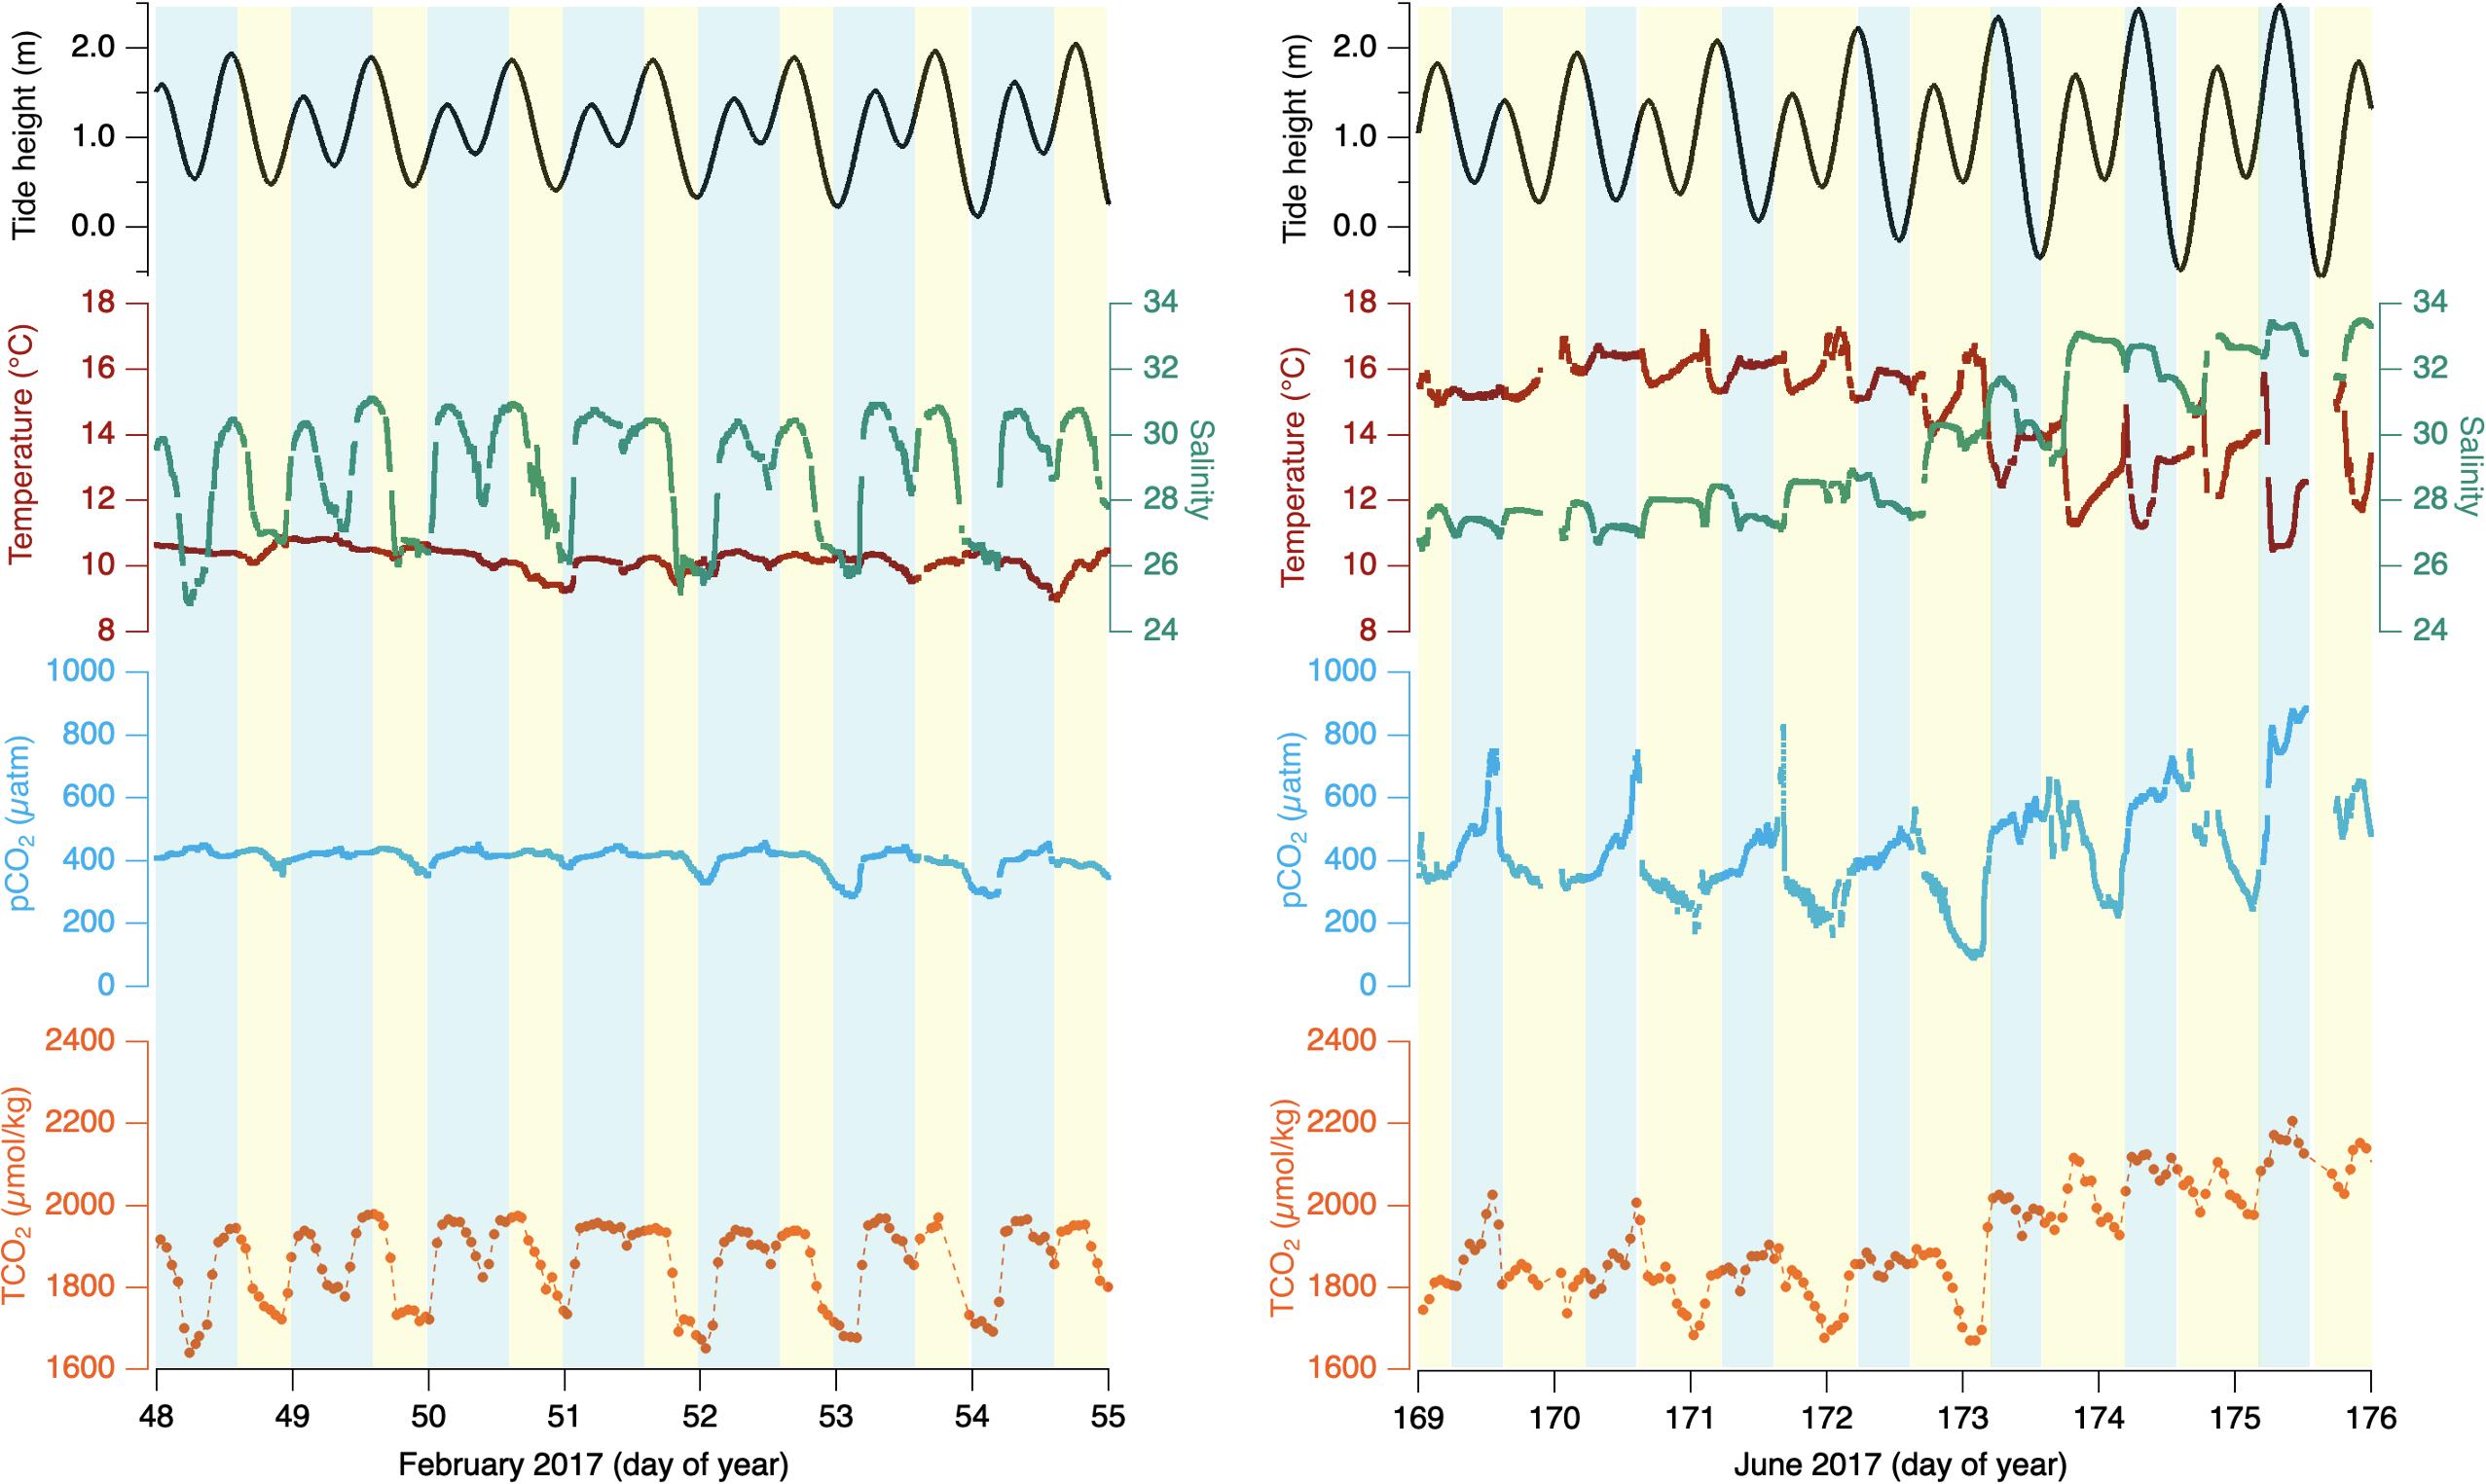
Figure 2. 7-day period winter (Left) and summer (Right) 2017 for Netarts Bay, OR, time in day of year UTC. Temperature (red line), salinity (teal line), pCO2 (cyan line), TCO2 (orange dots connected by dashed line), and estimated tide height (black line). Blue shading indicates local nighttime and yellow shading indicates local daytime.
Plots of a 7-day interval in February of 2017 (day-of-year 48–55) are shown in Figure 2 (left). Temperature varies weakly between 9.4 and 11.2°C without obvious diel or tidal character. Salinity varies strongly between 26 and 31, with a clear tidal covariance. pCO2 ranges between 325 and 420 μatm with evident diel amplitude, but with a dramatically smaller dynamic range than seen in the summer. The overall trend of decreasing pCO2 throughout the afternoon and build-up throughout nighttime persists in winter. TCO2 ranges from 1620 to 2000 μmol/kg, which is large compared to the summer observations. That variability is largely positively correlated to salinity for this period (r2 = 0.91, n = 153), with diel variability and pCO2 co-variance less evident than seen in summer.
A weekly snapshot of summertime in June of 2017 is detailed in Figure 2 (right). In-bay temperature ranges between 14 and 17.5°C with little systematic variability from day-of-year 169–173 until decreasing in temperature but growing in tidal variability from day 173 to 176. Salinity experiences variability more closely synchronized with the local tide stage, initially varying between 26.2 and 28 until day 173, when salinity increases to 33.5 and remains high through day 176. pCO2 shows strong diel variability from < 200 to > 800 μatm in this interval. pCO2 tends to increase during the night hours, peaking either immediately before or shortly after sunrise, and then rapidly falls throughout the day, reaching daily minima in late afternoon or early evening. Early in the observation period, TCO2 shows clear pCO2-synchronous diel variability with dawn maxima around 1900 μmol/kg and late afternoon minima around 1700 μmol/kg, until late in day 173, when TCO2 shows a large increase (∼150 μmol/kg) coinciding with the step up in salinity. Following day 173, TCO2 continues to show pCO2-synchronous diel variability with morning maxima slightly over 2100 μmol/kg and evening minima slightly under 2000 μmol/kg.
Summer and Winter 7-Day Derived Observations
As discussed in the methods section, hourly TCO2 measurements are combined with a synchronized, time-interpolated pCO2 value to calculate hourly alkalinity, pHt, saturation state, and a series of other carbonate variables including individual inorganic carbon species as determined through thermodynamic relationships. Figure 3 plots alkalinity, pHt, and the saturation state of aragonite (Ωa) for the same two 7-day intervals of Figure 2. Figure 3 (left) shows the corresponding wintertime-interval alkalinity, pHt, and Ωa. Alkalinity varies by a large range compared to the summer interval, from 1700 to 2100 μeq/kg; however, the variability is more strongly coupled to salinity variability than to any diel pattern. Ωa varies between ∼1 and 1.5, with an apparent mixture of covariance between salinity and pCO2. pHt varies between ∼7.9 and 8.1, and, while late-day maxima correspond to late-day pCO2 minima, there are additional variations that hint at a relation to salinity.
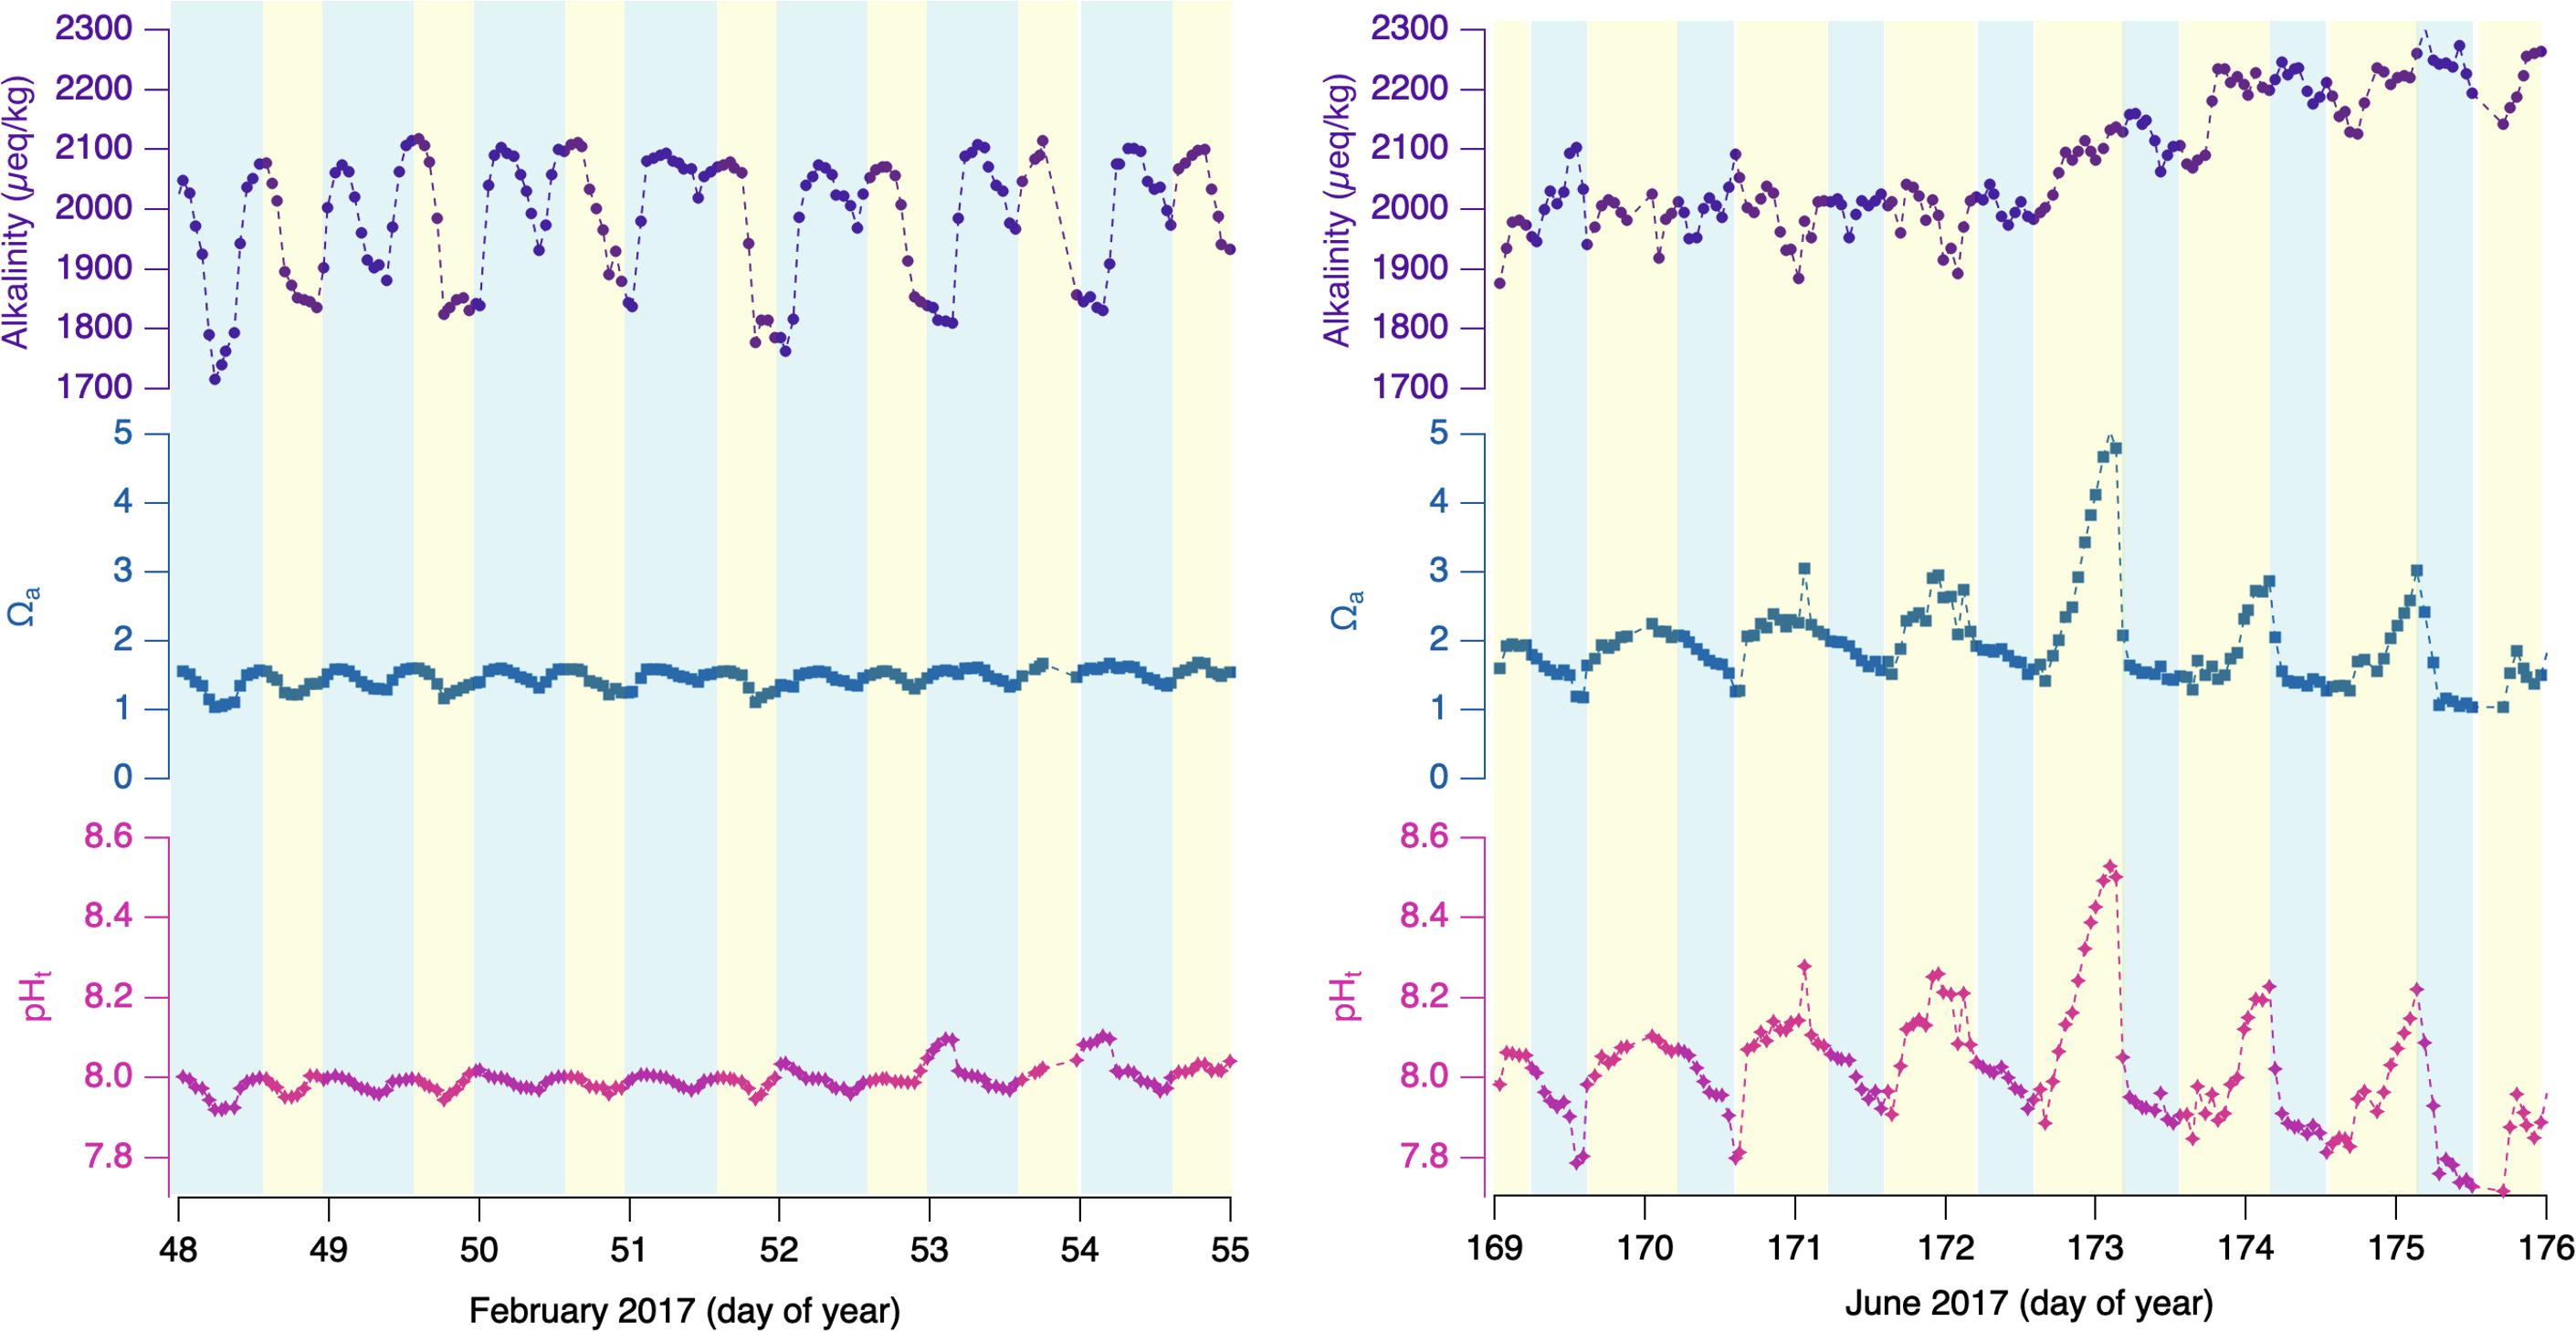
Figure 3. 7-day period winter (Left) and summer (Right) 2017 for Netarts Bay, OR. Calculated alkalinity (purple dots connected by dashed line), saturation state of aragonite (Ωa, blue squares connected by dashed line), and pH (pink stars diamonds connected by dashed line). Blue shading indicates local nighttime and yellow shading indicates daytime.
For the summer interval (right), alkalinity is largely covariant with the TCO2 data in the first 4 days of the interval, varying from 1900 to 2100 μmol/kg. In the final 3 days, alkalinity increases with the step up in salinity, and then experiences minimal variability between 2100 and 2150 μmol/kg for the remainder of the record. The saturation state ranges from 1.0 to over 4.6 in similar diel cycling as the pHt values, and thus anti-correlated with in situ pCO2, with lowest saturation states in late-evening or early morning, and highest values in late afternoon. pHt behavior is primarily anti-correlated with the pCO2 observations (r2 = −0.93, n = 31), showing the diel pattern of lowest values ∼7.8 in the early morning, and highest values, ∼8.1 or higher, in late afternoon or early evening.
Single Year Direct Observations
Annual patterns for the direct measurements taken during the representative year 2017 are shown in Figures 4A–F. The leading inferred drivers at the seasonal timescale are the upwelling/downwelling forcing and the related precipitation. In winter, winds are predominantly poleward and lead to onshore convergence and downwelling. Frequently accompanying poleward wind forcing are storm events that bring instances of high precipitation to the bay. In summer, the winds reverse to become primarily equatorward, causing coastal divergence and upwelling. Little precipitation occurs throughout these summer months. Not shown for the location is the annual photoperiod variation from ∼8.5 to 15.5 h between winter and summer solstices. Separating the winter and summer seasons are spring and fall transition periods, where the character of the dominant season fades and that of the forthcoming season grows.
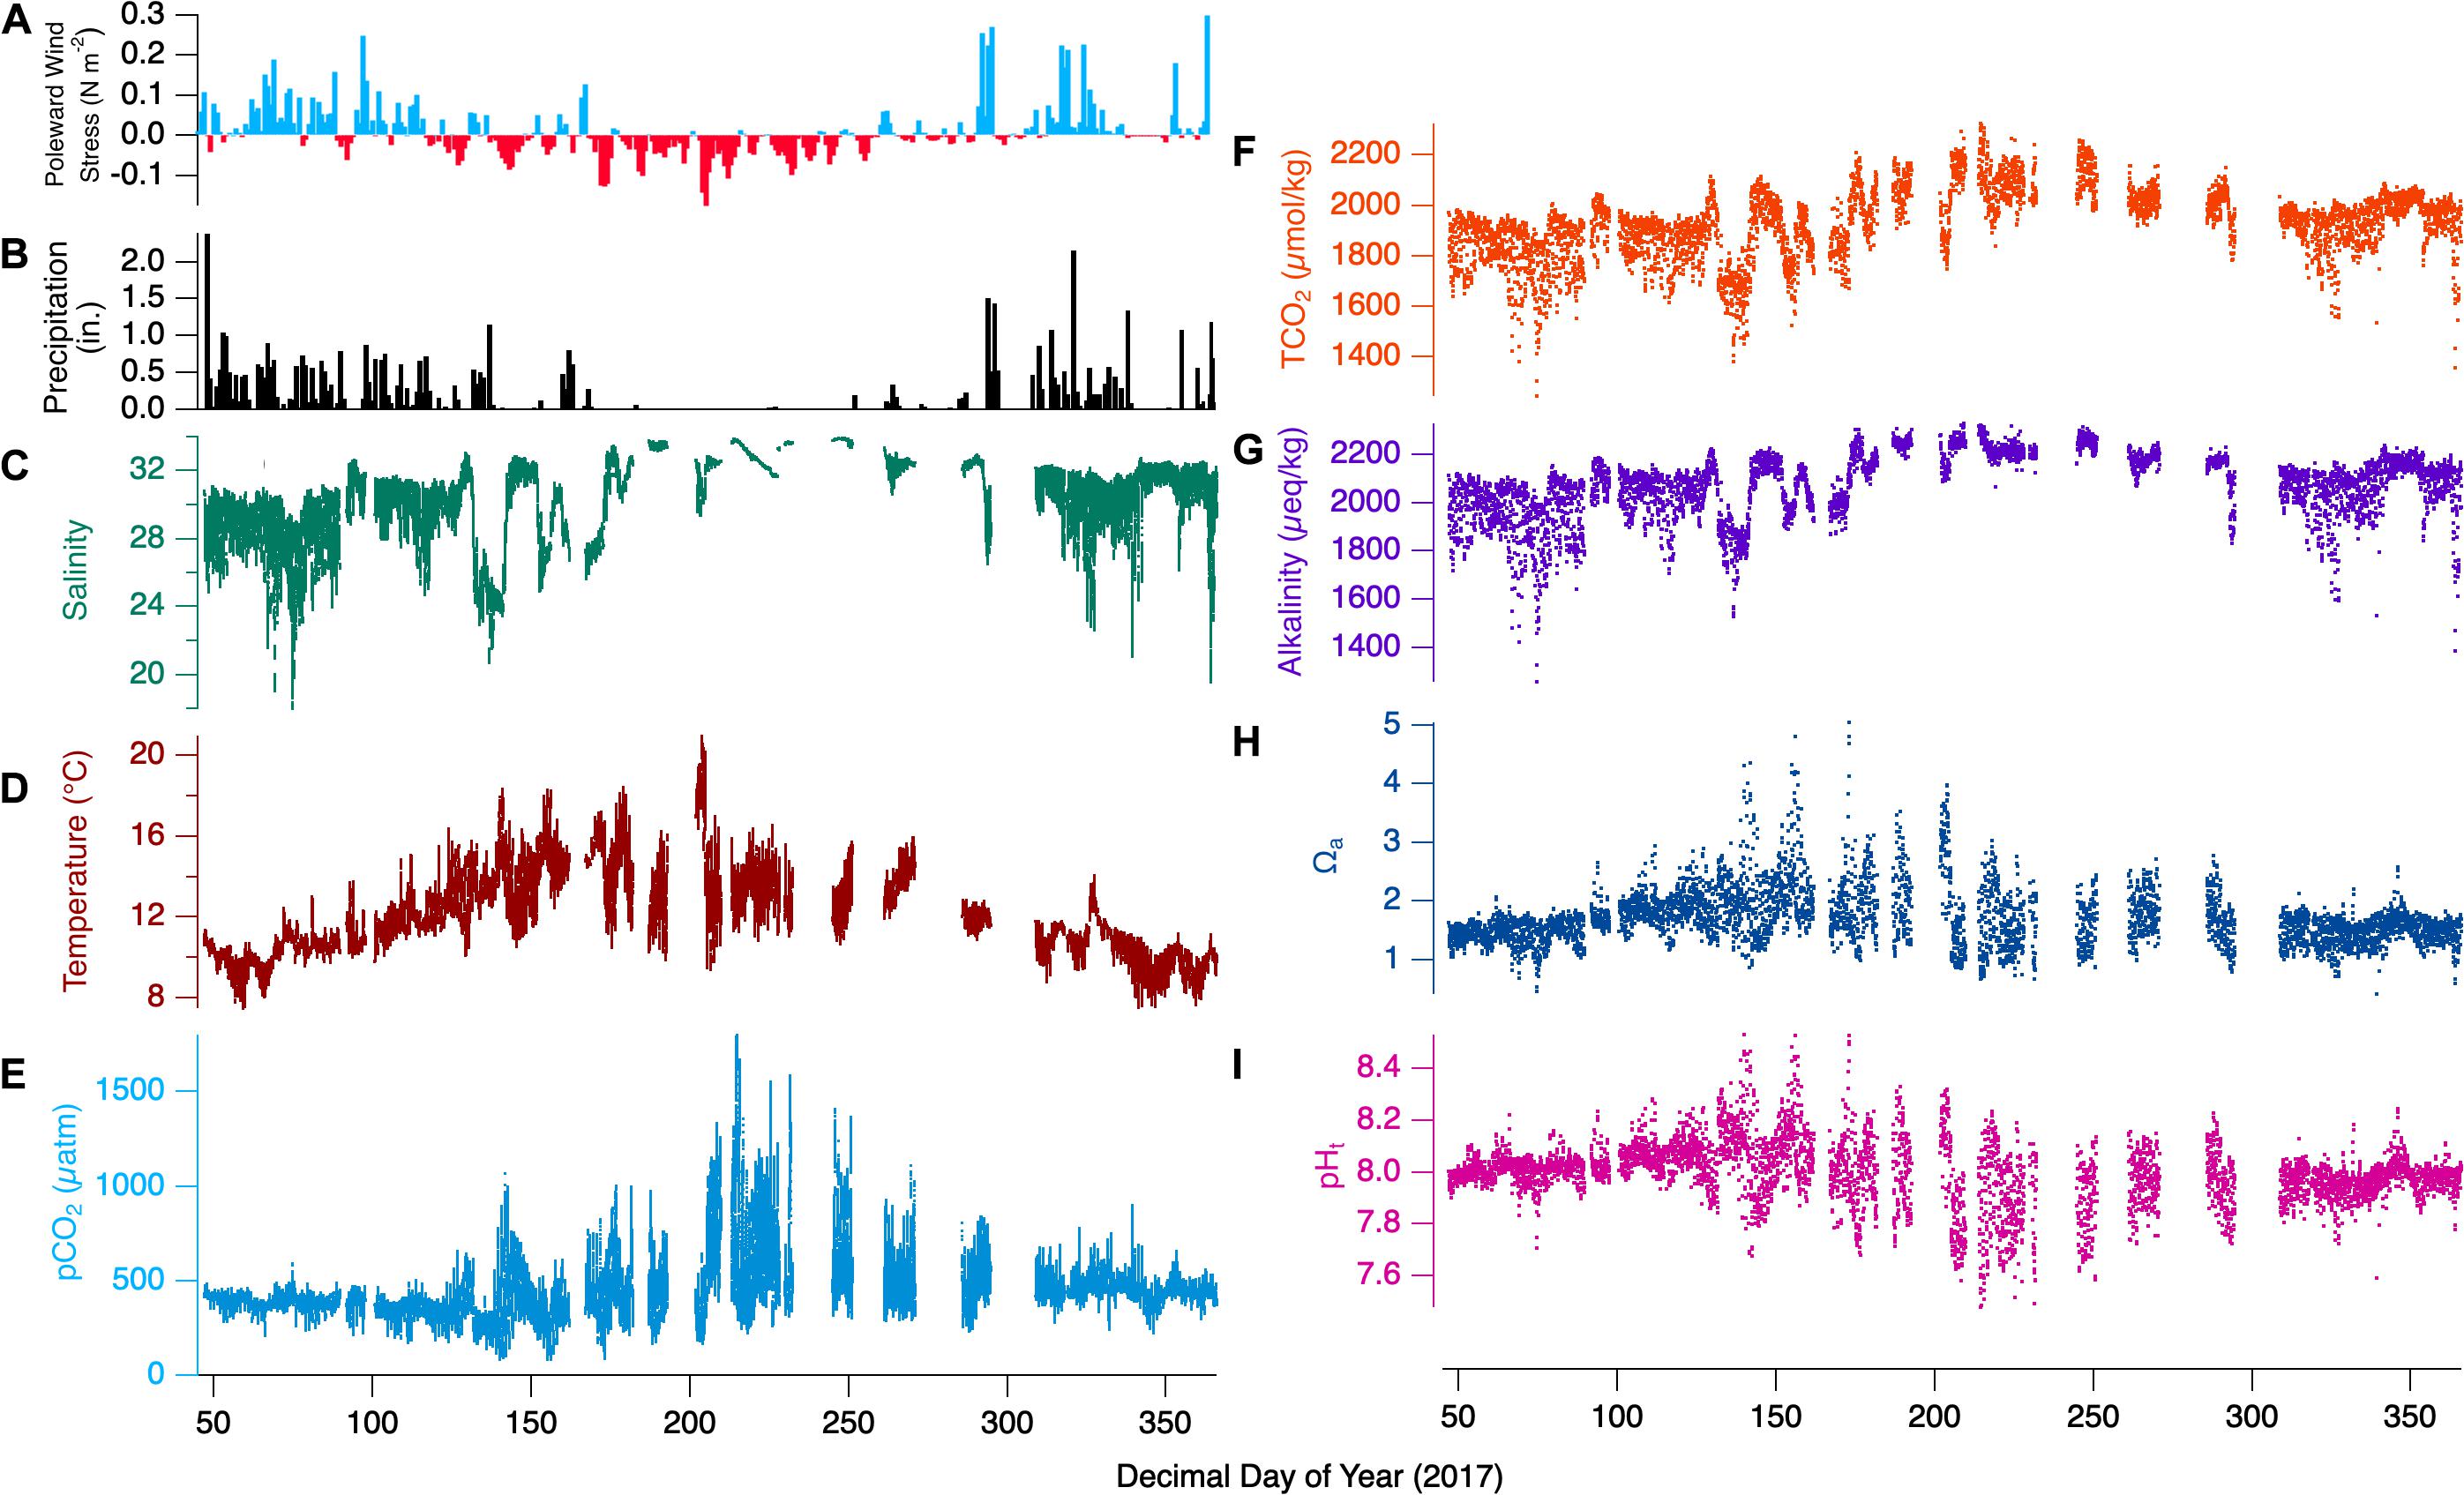
Figure 4. Full 2017-year observations for Netarts Bay, OR. (A) Poleward wind stress, (B) daily precipitation in inches, (C) salinity (teal line), (D) temperature (red line), (E) pCO2 (cyan line), (F) TCO2 (orange dots), (G) calculated alkalinity (purple dots), (H) aragonite saturation state (Ωa, blue dots), and (I) pH (pink dots), for the full 2017 timeseries. Wind stress data courtesy of http://damp.coas.oregonstate.edu/windstress/; Precipitation data courtesy of https://www.ncdc.noaa.gov/cdo-web/.
The influence of these seasonal forcings are evident in the temperature and salinity time series. While the coldest temperatures are seen in winter, summertime minimum temperatures are nearly as low (∼8°C), corresponding to the highest bay salinities and reflecting the influence of deep upwelling-source water. However, winter-time temperatures show relatively little variability (8–12°C), with maxima rarely > 12°C, while summer maximum temperatures are routinely > 15°C. Salinity shows nearly opposite character. The highest values approach 34 in summer, when there is relatively little variability. In contrast, winter salinity is rarely above 32, and minimum values corresponding to high-precipitation events fall as low as 16. The seasonality is perhaps most evident in the dramatic change in the pCO2 variability. In winter, pCO2 values rarely exceed 500 μatm, and rarely fall below 300 μatm. In contrast, summer pCO2 ranges between minima ∼190 μatm and maxima ∼1600 μatm.
TCO2 variability show distinctly different behavior from pCO2 when examined in the composite year as compared to the weekly snapshots. In winter, when pCO2 variability is minimal, TCO2 dynamic range is greatest. Winter TCO2 maxima are only ∼2050 μmol/kg, and the lowest annual values, ∼1400 μmol/kg are seen then. These low TCO2 events correspond with freshening events that dilute ocean-source water TCO2, while having little effect on pCO2. During summer, the TCO2 values are overall higher (∼2000 – 2250 μmol/kg). and show less dynamic range than winter.
Single Year Derived Observations
The full 2017-year observations the derived terms alkalinity, Ωa, and pHt, are shown in Figures 4G–I. Alkalinity shows similar wintertime variability to TCO2, with lower maximum concentrations (compared to summer) and strong salinity- and TCO2-covariance leading to a dynamic range of ∼1400 – 2200 μmol/kg. During summer, alkalinity reaches its highest values near 2300 μmol/kg, while variability is low with minimum values rarely falling below 2200 μmol/kg. Wintertime Ωa generally falls in the range of 1–2, except for some values ∼0.5 corresponding to the lowest observed salinities. Summertime dynamics show extreme ranges from ∼0.7 to 5, coinciding with the similarly maximal dynamic range in pCO2 and pHt. Winter pHt shows little variability, mostly captured with the range 7.9–8.1. Springtime pHt values are amplified relative to winter, ranging from 7.6 to 8.5, meanwhile summer pHt shows strong variability between 7.5 and 8.4. The spring transition out of the dominant wintertime regime shows elevated values of pHt and Ωa, with maxima of 8.5 and 5.0, respectively. Similarly, alkalinity and TCO2 values become elevated in tandem with intermittent equatorward wind and spring-transition upwelling related events. The reverse occurs during the fall transition as poleward winds become dominant and downwelling prevails.
Composite Year Direct Observations
Compositing all years’ wind stress, precipitation, salinity, temperature, TCO2, and pCO2 data provides the full range of variability in the basic carbonate measurements taken at Netarts Bay from 2014 to 2019 (Figures 5A–F). Over all 6 years, temperature ranges from ∼5–20°C, salinity from ∼15 to 34, pCO2 from ∼100 to 2500 μatm, and TCO2 from ∼1400 to 2250 μmol/kg. The 2017-year discussed previously falls within the 6-year composite, and the general patterns hold: winter is dominated by poleward winds and high precipitation, while summer is dominated by equatorward winds and nearly absent precipitation. Wintertime pCO2 and temperature exhibit lower variability while summer values show dynamic ranges that nearly encompass the full data-set dynamic range. Wintertime salinity and TCO2 show lower maxima than seen in summer, and the lowest minima seen all year, while values are higher and less variant in summer.
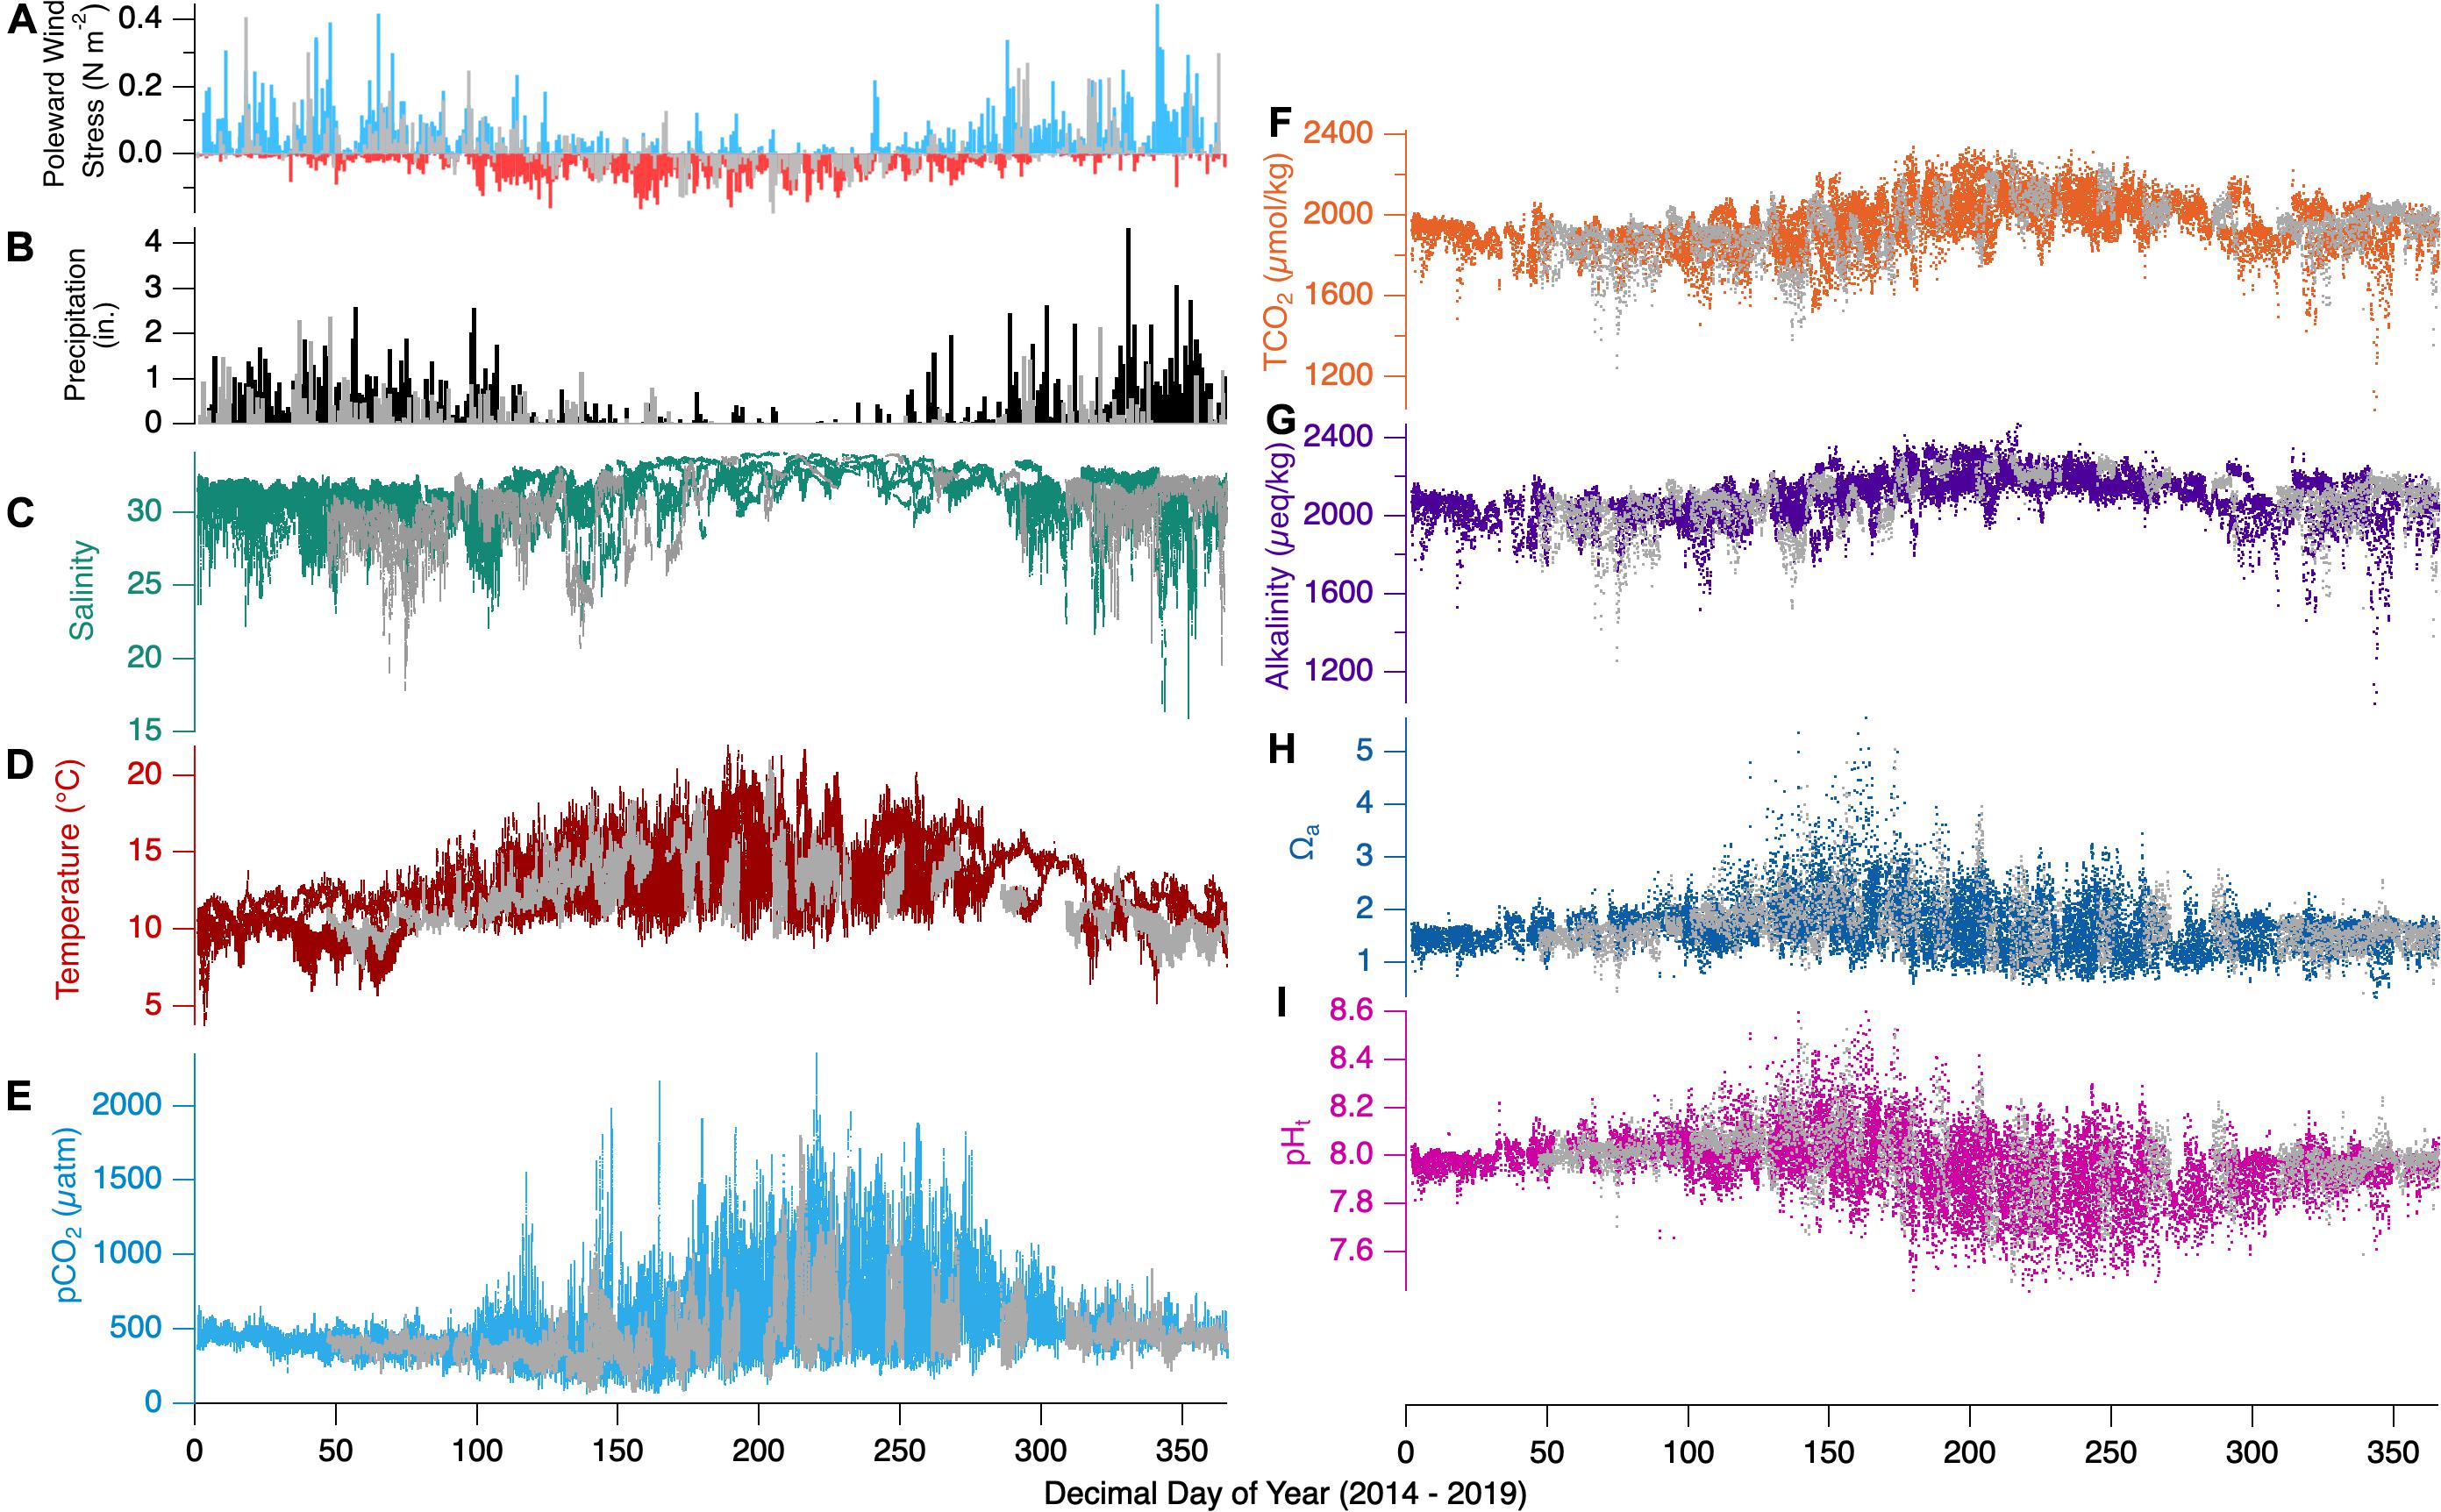
Figure 5. Composite observations for Netarts Bay 2014–2019. (A) Poleward wind stress, (B) daily precipitation in inches, (C) salinity (teal line), (D) temperature (red line), (E) pCO2 (cyan line), (F) TCO2 (orange dots), (G) calculated alkalinity (purple dots), (H) aragonite saturation state (Ωa,blue dots), and (I) pH (pink dots). Dark gray shading of each parameter represents the 2017 data set. Wind stress data available at: http://damp.coas.oregonstate.edu/windstress/Precipitation data courtesy of https://www.ncdc.noaa.gov/cdo-web/.
Composite-Year Derived Observations
Figures 5G–I adds all years’ calculated alkalinity, pHt, and Ωa observations to the previously discussed pCO2 and TCO2. Alkalinity ranges from ∼1150 to 2400 μeq/kg, Ωa from ∼0.3 to 5.0, and pHt from ∼7.5 to 8.6. As above, the general patterns seen for the 2017-year persist: alkalinity is overall lower in winter but experiences the largest variability with extreme minima that correspond to the lowest salinity events, while summer alkalinity experiences its highest values and lower variability. Ωa shows low variability mostly captured in the range 1–2 in winter, with instances of very low Ωa associated with the lowest-salinity events, while summer conditions show large variability, ranging from 0.7 to 5.0. pHt variability is low in winter months and exceeds 1 pH unit in summer, coincident with the large observed range in pCO2.
Discussion
Timescales and Drivers of Variability
Netarts Bay experiences dynamic variability across multiple hydrographic and carbonate parameters at timescales from diel to tidal to several days to seasonal. This variability occurs in response to a variety of factors, namely in-bay metabolic processes, advection of various water masses into the bay, adjacent coastal wind forcing, and daytime insolation. In this section we examine and hypothesize certain factors driving the observed variability at multiple timescales.
Diel Synchrony and Tide Phasing
The previously described diel variability of in-bay pCO2 is characterized by a gradual decline throughout the afternoon until a diel minimum is reached in late afternoon or early evening, followed by a gradual build up overnight until an early morning maximum is reached. This pattern is evident in both summer and winter, though with lower amplitude in winter (Figure 2). Coincident with the diel variability, however, is a strong tidal forcing that cannot be clearly separated from the diel forcing in the 1-week snapshots presented earlier. With relatively short water residence times (∼12 h), tidal forcing is evident in salinity, and to some degree TCO2 and alkalinity variability, particularly in winter. The semi-diurnal tides are not perfectly in phase with the diel variability, however, but shift forward nearly 40 min each day. Therefore, if tidal forcing were the dominant control, we would see the pCO2 variability reverse phase with respect to the day on ∼fortnightly intervals. Figures 6A,B shows pCO2 and TCO2 variability across two 5-day periods in summer 2017 with tide phasing shifted roughly 90 degrees between the top and bottom graph. In each representation, pCO2 trends down during daylight hours to reach a late-day minimum and increases overnight to an early morning maximum. Similarly, wintertime conditions show diel pCO2 behavior which trend down in response to daytime insolation and rise slightly overnight (Figures 6C,D) even when comparing periods of orthogonal tide heights.
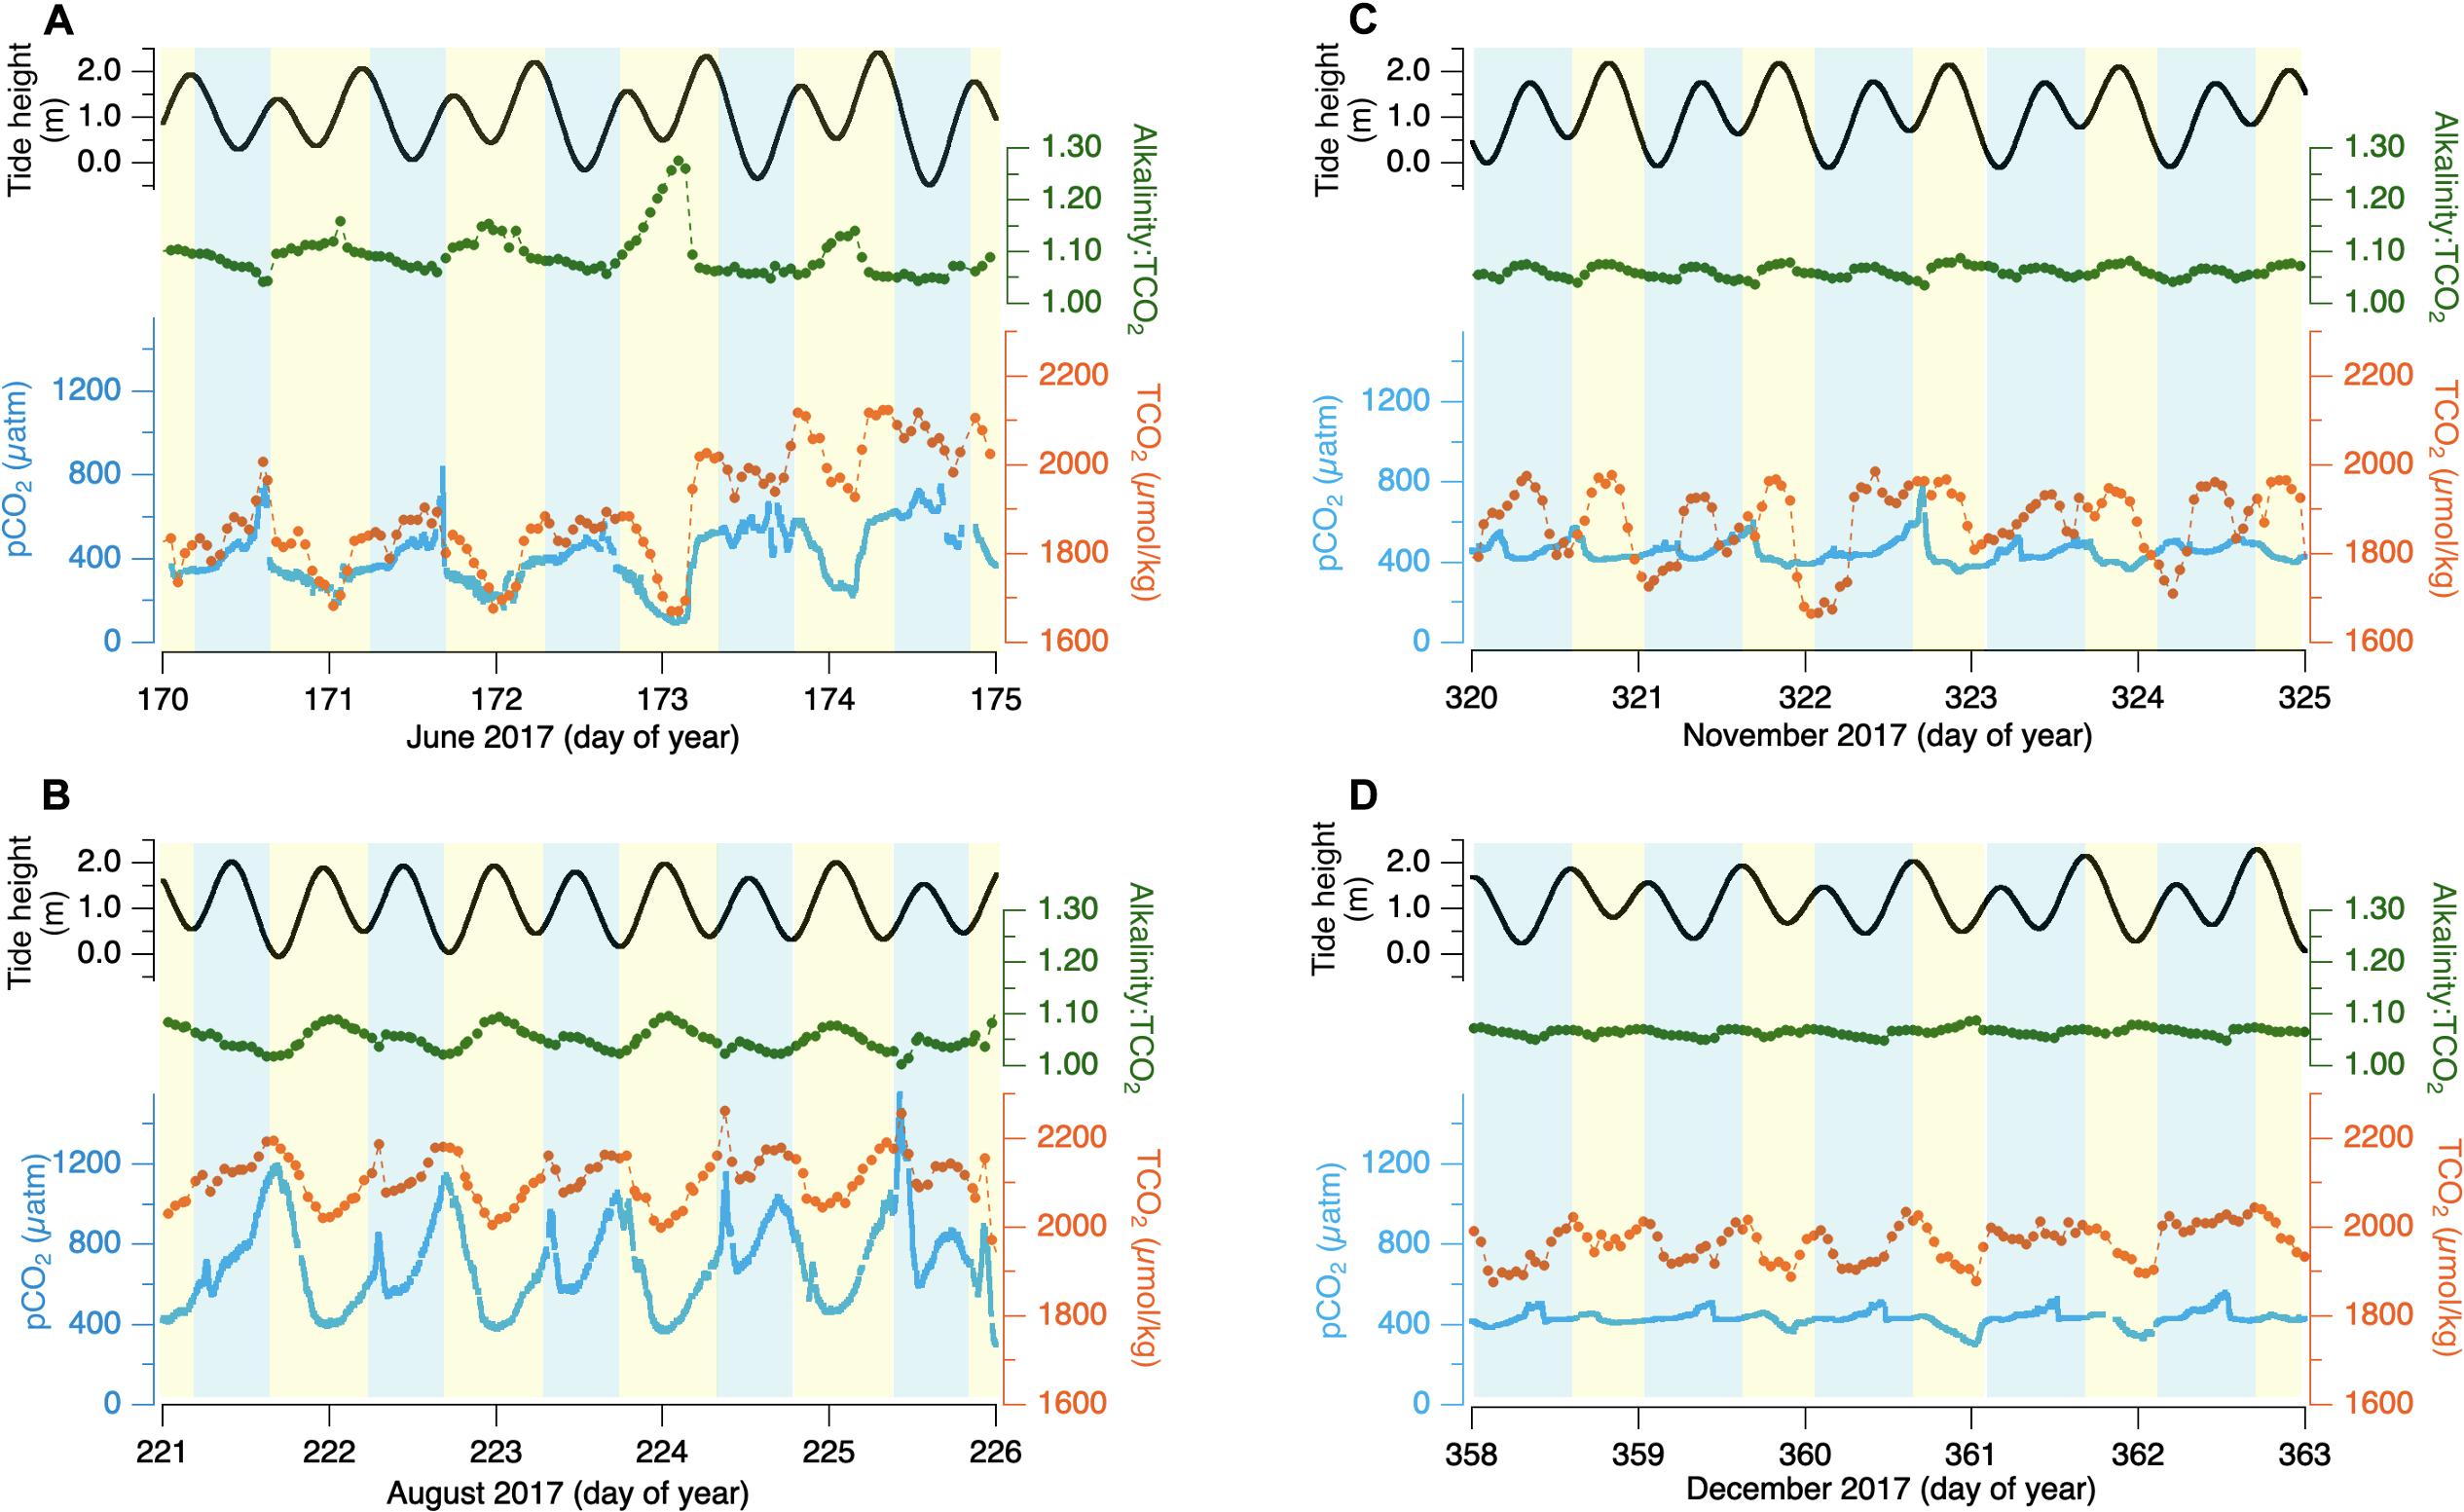
Figure 6. pCO2 (blue line), TCO2 (orange dots connected by a line), Alk:TCO2 ratio (red starts connected by a line), and estimated tide height (black line) for two 7-day periods during summer (A,B) and winter (C,D) of 2017 with tide-phasing ∼90° between top and bottom. Blue shading indicates local nighttime and yellow shading indicates daytime.
The apparent driver of this diel variability is the net metabolism driven by a composite of processes in the bay. The balance between primary production, which consumes CO2 in the presence of sunlight and nutrients to create organic matter, and respiration, which releases CO2 during the degradation of organic matter, drives diel pCO2 variability. During summer, when the photoperiod is extended due to higher incident solar angle and prolonged daylight, insolation is at its maxima; coincidentally, upwelling supplies the bay and coastal ocean with elevated nutrients (Oregon coast upwelled-water NO3– > 35 μM; Hales et al., 2005). The abundant epibenthic primary producers and the high surface-area:volume ratio of the bay-floor relative to the water column leads to extensive modification of the overlying water, despite rapid tidal flushing. Broadly, the reverse occurs once the lights turn off and heterotrophic metabolism tips the scales, producing an abundance of TCO2. This addition of dissolved carbon dioxide shifts the carbonate chemistry such that pCO2 at times passes 2000 μatm as seen in the early morning spring months of 2019 (data not shown) in response to strong and sustained equatorward winds and subsequent offshore upwelling.
This mechanism is supported further by the close coherence of pCO2 and TCO2 during the productive summer season, while alkalinity variability remains small. Aerobic net community metabolism impacts primarily TCO2, with much smaller impact on alkalinity, and thus carries an implied pCO2 and TCO2 covariance. For T ∼ 12°C, S ∼ 33, the relative change in pCO2 is 12 times the relative change of TCO2 [Revelle Factor of 12 (Revelle and Suess, 1957; Broecker et al., 1979; Sundquist et al., 1979)], for all other variables constant. Relative variability in pCO2 daily minimum and maximum for the intervals depicted ranges 10–20 times that for TCO2, adding support to the idea that net metabolism, modulated by diel insolation cycles, is the primary driver of summertime bay carbonate-system variability.
Nested within the day-night variability is an apparent tidal signature, most evident in the “dual-peaks” signature in the pCO2 behavior in Figure 6B. This tidal signal is complicated, however, by the variable synchronicity between ocean upwelling and relaxation, the tide state, and insolation. For example, during strong upwelling, high-pCO2 freshly upwelled water will be present adjacent to the bay-mouth. If this water flows into the bay in the evening following a sunny day when in-bay productivity has reduced the pCO2 of bay waters, the rising tide will coincide with rising bay pCO2. Conversely, if relaxation has allowed productive ocean waters with depleted pCO2 to be pushed against the shore and these waters enter the bay early in the morning after in-bay respiration has increased bay-water pCO2, the rising tide will correspond with falling bay pCO2. The persistent diel insolation-coupled periodicity in summertime, despite the range of ocean conditions and tide/insolation phasing emphasizes the dominance of in-bay metabolism.
The wintertime conditions are somewhat more challenging to explain, as the diel variability in pCO2 is muted but persists in the face of clearly tidally modulated alkalinity and TCO2. Even within broad ranges of TCO2 and alkalinity, pCO2 is largely driven by changes in the ratio of TCO2:alkalinity (Figures 6C,D). Although there are important variations in the salinity-alkalinity relationships, discussed below, the leading factor is freshwater dilution of ocean water, which largely preserves the oceanic TCO2:alkalinity ratio. The large tidally driven salinity-covariant TCO2 variability is thus compensated by covarying alkalinity. The responding factors like pCO2 and pHt show distinct patterns of variability, with the diel character persisting. The metabolic signature is expected to be suppressed relative to summer. Lower insolation angle, shorter photoperiod, and increased cloudiness limit the potential maximum photosynthetic rate, and wintertime coastal waters carry significantly lower nutrient concentrations than upwelled source waters (Wetz et al., 2006). This reduced metabolic signature is consistent with observed reductions in in-bay biomass during winter, when the extensive seagrass beds seen in summer have vanished.
Event-Scale Variability
Imposed onto the observed carbonate dynamics are event-scale processes which act on timescales of days to weeks. The predominantly summertime equatorward winds which drive offshore Ekman transport and upwelling occur in cycles of strong wind-forcing/relaxation periods. The duration, timing of onset, and intensity of these cycles are governed by synoptic-scale high-pressure systems and occur on variable time and space scales along the West Coast (Pringle and Dever, 2009; Aristizábal et al., 2017). One such transition from wind relaxation to upwelling is captured in the 2017 summer interval (Figures 2, 3), which show a clear hydrographic and carbonate-variable influence of high-salinity, -TCO2 and -alkalinity deep-upwelled-source water entering the bay coincident with a strengthening of equatorward wind. The wind-relaxation event which occurred prior, days 169–173, was concurrent with salinity, TCO2 and alkalinity below 32, 2000 μmol/kg, and 2100 μeq/kg, respectively. The wind-stress time-series for the full year 2017 (Figure 4) shows days to weeks of prevailing equatorward winds followed by instances of brief relaxation periods and/or light poleward winds. These relaxation cycles coincide with warmer water temperatures, lower and more tidally synchronized salinity and alkalinity, and a slight dampening of diel pCO2 dynamics in response to reduced input of dissolved nutrients as the bay’s primary water source shifts from deep upwelled water to open Pacific Ocean surface water.
Event-scale variability occurs throughout the downwelling-wintertime regime as well as when the influence of predominantly California current water (S ∼ 32.5) is interrupted by brief but intense storm-dominated conditions. During the winter of 2017, multiple low-pressure fronts moved over the Oregon coast (Figure 4), depositing several inches of rain over brief (∼48-h, days 361–363) windows. The combination of direct dilution and mixing of local coastal freshwater endmembers represented by discharge from small mountainous rivers resulted in large negative salinity, alkalinity, and TCO2 departures from the overall background downwelling conditions. Rapid tidal flushing and a return to precipitation-free downwelling in the days following storm conditions quickly returned the bay to normal wintertime variability.
Seasonal Upwelling and Downwelling
At seasonal timescales, we observe large differences in character and variability of nearly all hydrographic and carbonate parameters between the summer and winter. The clear driver of these stark summer-winter differences is the regional transition from upwelling-dominated high-insolation summer conditions with equatorward winds and low precipitation, to downwelling-dominated low-insolation winter conditions with frequent intense precipitation events. These background seasonal differences set the stage for the distinct behavior and variability timescales seen in the different seasons.
Interceding these two states are transition seasons where the character of the dominant season fades and the impending season emerges. In the fall transition, upwelling favorable winds wane in the September-October timeframe, while the winter storms build in October-November. In the spring transition, intervals between winter storm events have building upwelling character. The bay’s seasons are thus driven largely by the initiation and termination of coastal upwelling and downwelling. There have been detailed studies regarding the variability of the onset of upwelling in this region (Pierce et al., 2006); similarly wintertime precipitation events are highly variable interannually.
Behavior of Alkalinity
For much of the open surface ocean, alkalinity is affected primarily by local removal (by evaporation and/or ice formation) and addition (by precipitation and/or ice-melt) of near zero-alkalinity fresh water (Brewer et al., 1986; Lee et al., 2006). Mixing of water masses results in single, conservative (linear) alkalinity-salinity relationships that can be applied within large oceanic sub-regions (Takahashi et al., 2014). We have compared regionally published alkalinity-salinity relationships for North Pacific subregion (Takahashi et al., 2014, Eq. 2; Cullison Gray et al., 2011, Eq. 3, adapted from the published form for consistency) to that acquired from the comprehensive 2014 –2019 WCSH measurements (Figure 7; Eq. 4):
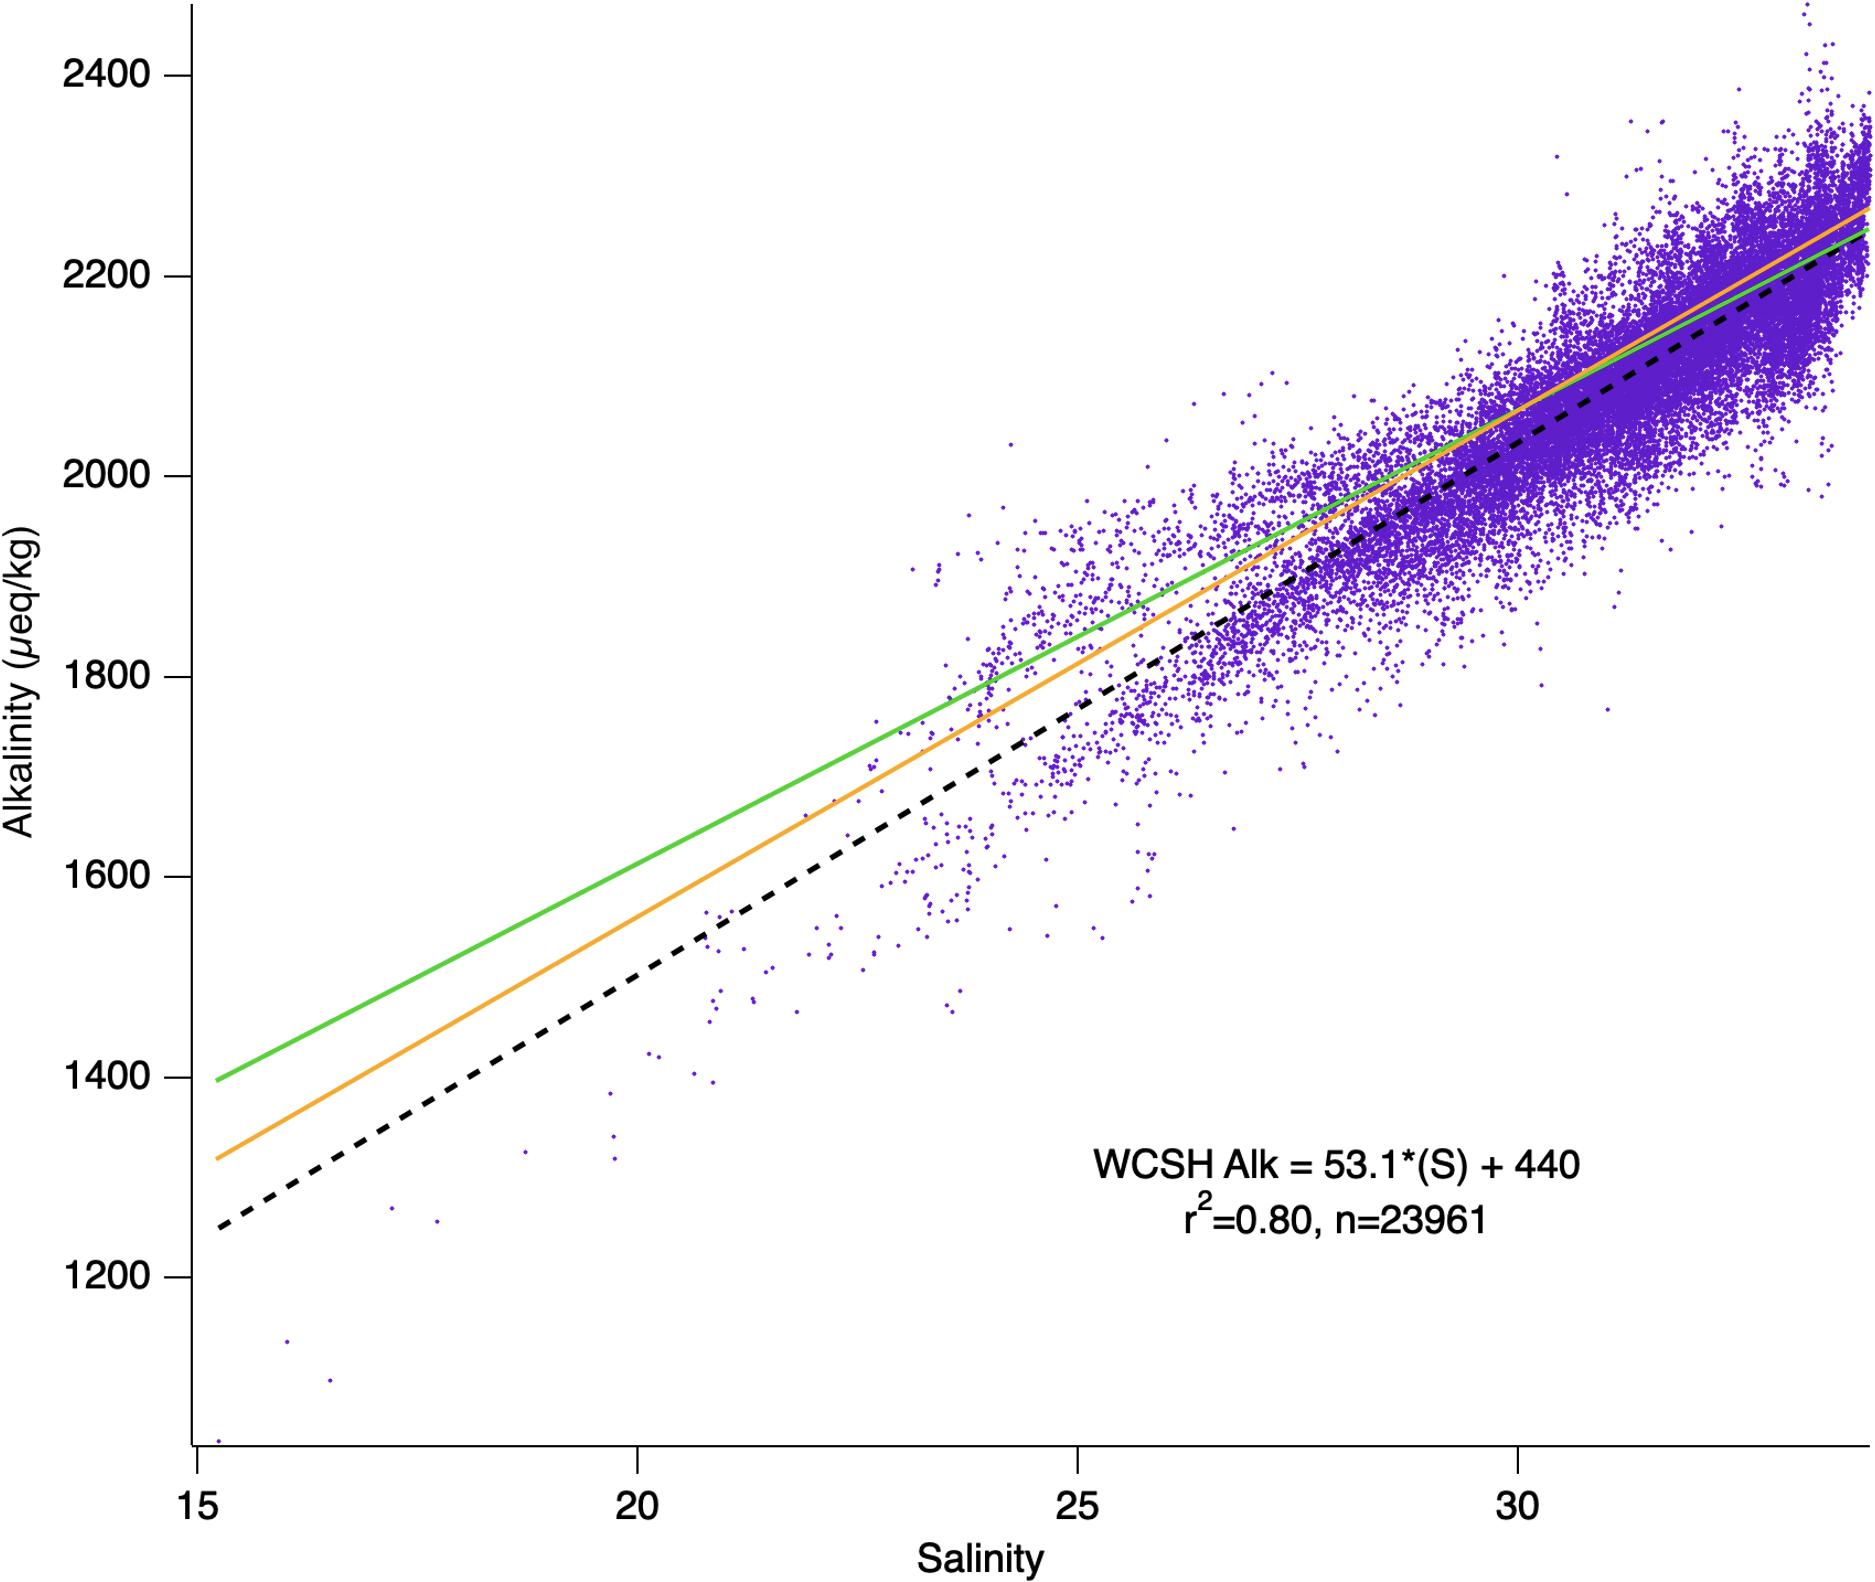
Figure 7. Composite alkalinity-salinity regression for all years 2014–2019 and associated correlation statistics. Purple dots represent hourly calculated alkalinity data and black dashed line represents a simple linear-fit. Published regional alkalinity-salinity relationships from from Cullison Gray et al. (2011; orange), and Takahashi et al. (2014; green) are overlain.
While the WCSH results are broadly consistent with the other regional regressions, particularly at salinities approaching open Pacific Ocean surface waters (S > 32, average salinity-based alkalinity predictions deviated ± 15 upmueq/kg when compared to observed), there are multiple and discrete trends which depart from both the regional relationships and the comprehensive WCSH alkalinity/salinity relationship. These differences appear to be real and mechanistic. Although the Takahashi et al. (2014) relationship is based on a nitrate-corrected ‘potential alkalinity’ and the Cullison Gray et al. (2011) results are not, the difference between their mostly open-ocean products is likely to be only a few μeq/kg. Our results are also uncorrected for nitrate, and while the corrections for our data are likely to be higher, they are still expected to be less than ∼35 μeq/kg (given the NO3– levels in upwelled source water; Hales et al., 2005) and without clear salinity dependence. While all three relationships are broadly consistent with each other at the highest salinities, there is a clear tendency toward higher salinity dependence (slope) and lower apparent freshwater endmember (intercept) in the WCSH data, as well as deviation of the direct alkalinity determinations from the regression of the full WCSH dataset that exceed the analytical uncertainty.
The existence of regional predictive relationships for alkalinity from the relatively more-easily measured salinity, as well as the large-scale coherence between salinity and alkalinity seen in our data, offers potential for assessing ocean acidification-relevant parameters using measurement of a single parameter, such as pCO2, and a salinity-based estimate of alkalinity. Our direct determinations of alkalinity, however, show several systematic departures from all three ‘regional’ predictions that exceed our analytical uncertainty. These cause significant error in calculation of un-measured parameters, and can be broadly divided into two categories: conservative mixing with multiple end-members; and non-conservative behavior driven by in-bay metabolic-processes.
Identifying Multiple End-Members
From late fall to early spring, metabolic activity in the bay is suppressed and salinity variability is comparatively high relative to summer conditions. During these intervals, there is strong linear covariance between alkalinity and salinity over a variety of timescales with R2 values frequently exceeding 0.9. During these months, WCSH alkalinity is well-predicted by the full-dataset, Cullison Gray et al. (2011), and Takahashi et al. (2014) relationships when the salinity is relatively high and the variability is moderate (Figure 8A, days 72–74; Figure 8B, days 128–131). This likely reflects mixing of California Current surface waters with mixed winter-time Oregon shelf waters (Wetz et al., 2006; Whitney and Garvine, 2006; Banas et al., 2009; Pfeiffer-Herbert et al., 2016). More extreme freshening, however, causes systematic deviation from the regional predictions, in both the positive and negative sense. Figure 8A, day 74 shows a strong alkalinity decrease coinciding with freshening driven by a 24-h period of intense local rainfall and watershed runoff. In this case, the directly determined alkalinity is 200–280 μeq/kg lower than the regional predictions, reflecting the very-low alkalinity of precipitation and event-driven runoff from Netarts Bay’s small watershed. Regression of alkalinity vs. salinity in these events (inset) suggests a freshwater endmember of 115 μeq/kg, low even in comparison to coast range river water (∼300 μeq/kg; Pfeiffer-Herbert et al., 2016; Hales, unpublished) and indicative of the importance of direct precipitation on the bay. For this precipitation event, the WCSH-regression alkalinity (Eq. 4) combined with the directly measured pCO2 resulted in overestimates of the actual TCO2 by 164 ± 28 μmol/kg, pHt by 0.06 ± 0.01, and Ωa by 0.10 ± 0.02. In comparison, the Cullison Gray et al. (2011) alkalinity model would overestimate TCO2 by 192 ± 33 μmol/kg, pHt by 0.07 ± 0.01 and Ωa by 0.10 ± 0.02. Likewise, the Takahashi et al. (2014) alkalinity model would overestimate TCO2, pHt, and Ωa as much as 257 ± 48 μmol/kg, 0.09 ± 0.02, and 0.14 ± 0.03, respectively.
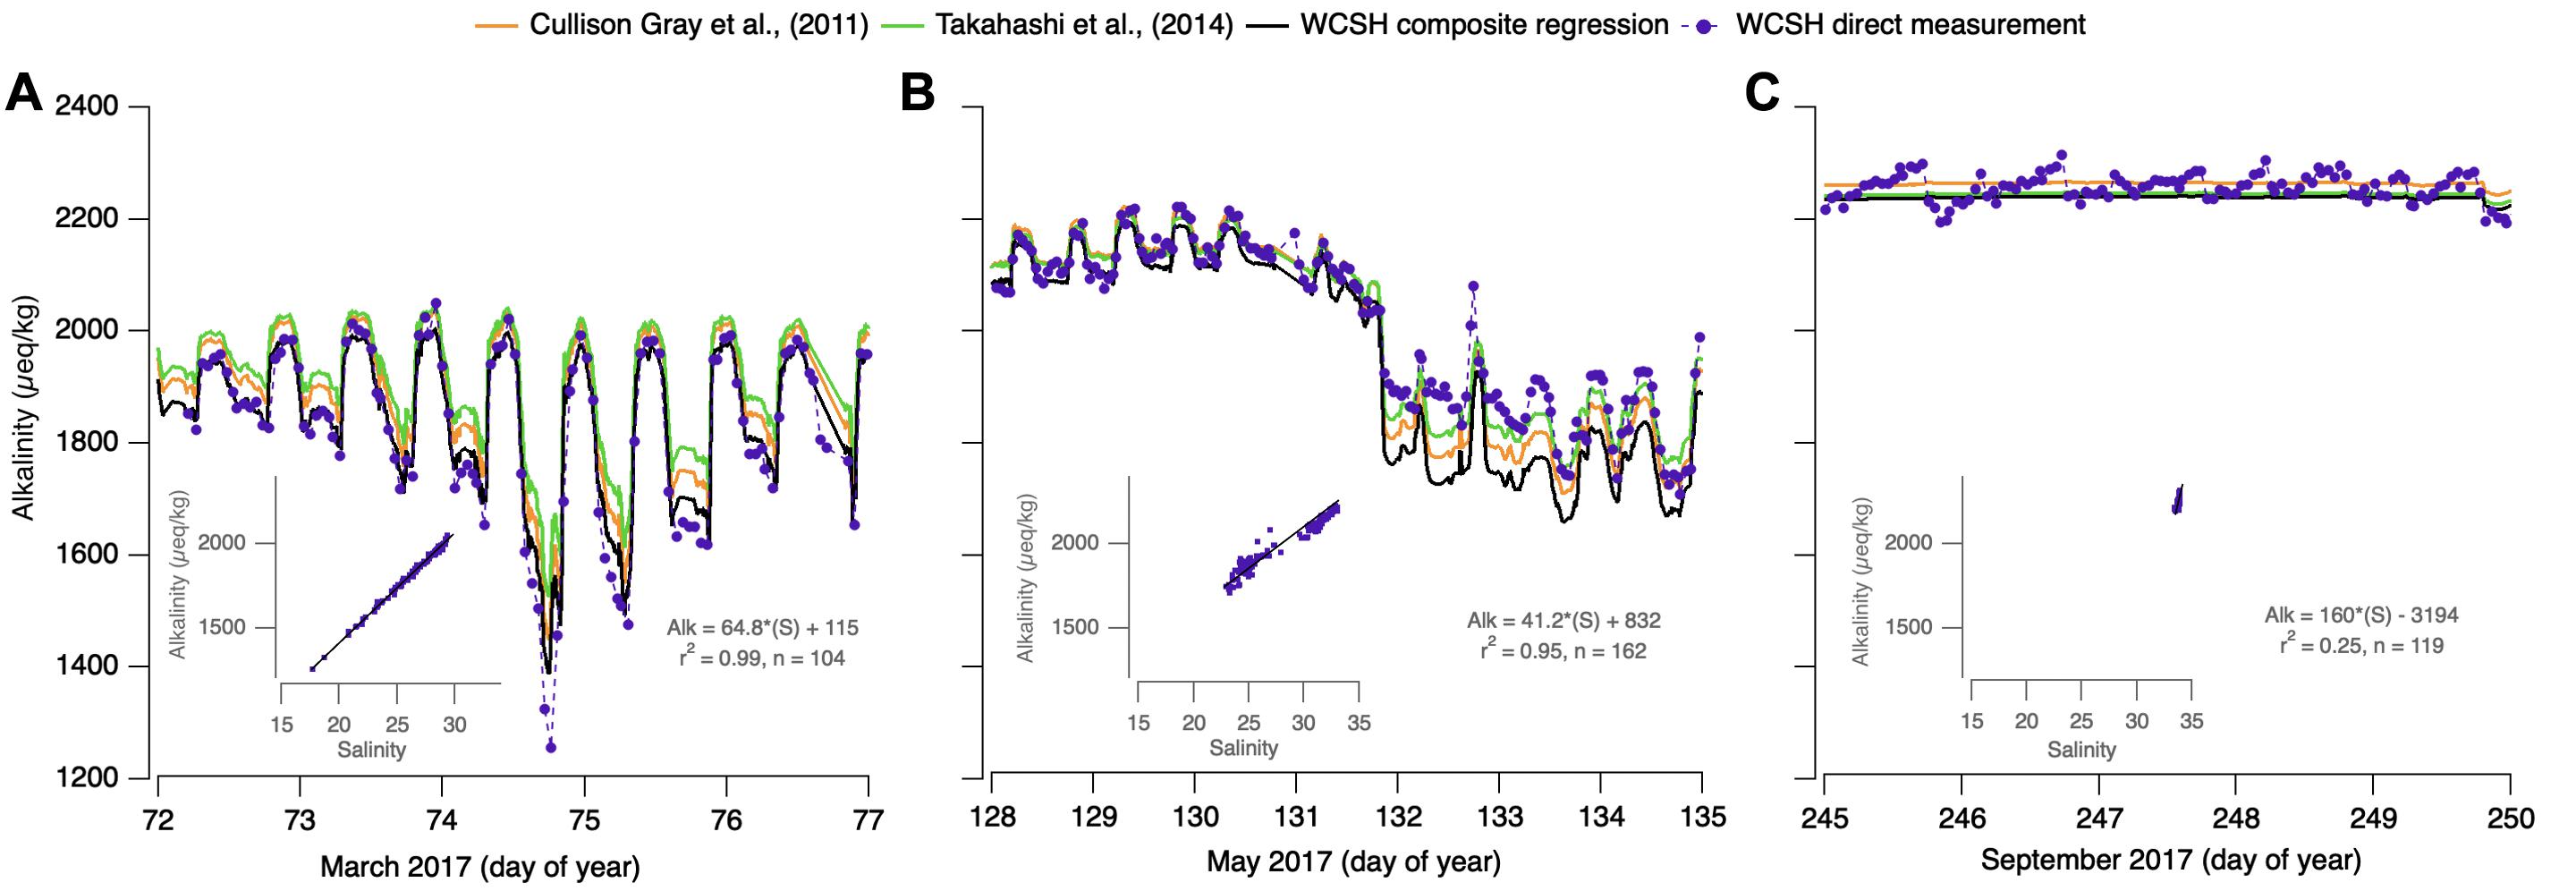
Figure 8. Reconstruction and comparison of directly determined WCSH alkalinity (purple dots connected by a dashed line) and WCSH-composite regression determined alkalinity (black line) against two published regional alkalinity-salinity relationships from Cullison Gray et al. (2011) (orange), and Takahashi et al. (2014) (green). Three intervals are depicted: downwelling interceded by a precipitation event on day 74 (A), apparent Columbia River plume intrusion days 132–135 (B), and persistently high salinity during an upwelling interval (C). Associated alkalinity-salinity regression insets for (A–C) are displayed in gray.
Other low-salinity deviations show the opposite effect. Figure 8B, days 132–135 shows low-alkalinity conditions, also driven by strong freshening of bay-water. Rather than falling below the regionally predicted alkalinity, observations exceed the regional salinity-based predictions, by 64–134 μeq/kg. In this case, oscillating upwelling/downwelling forcing as the spring transition is approached is thought to introduce Columbia River plume waters into the bay. Under downwelling forcing, coastal flow is poleward and onshore, typically trapping the plume along the Washington coastline. Under the opposite flow of upwelling forcing, the plume is pushed equatorward, 100 km or more south of the river mouth, but typically sits offshore near the shelf break (Banas et al., 2009). Periods of upwelling, followed by reversals to downwelling are thought to push the southward-displaced plume onshore (Mazzini et al., 2015), thus bringing Columbia-induced freshening to the bay mouth. In this case, regressions (Figure 8B, inset) indicate a freshwater endmember of 832 μeq/kg, higher than any of the regional relationships and consistent with the composition of Columbia River water (USGS National Stream Quality Accounting Network2; Evans et al., 2013). These deviations are significant not just in alkalinity, but in the parameters that might be calculated from a predicted alkalinity and WCSH-measured pCO2. For Cullison Gray et al. (2011) TCO2 estimates would be underpredicted by as much as 188 ±37 μmol/kg; pH by 0.04 ± 0.01 and Ωa by 0.52 ± 0.08. Similarly, Takahashi et al. (2014) at times would underpredict TCO2 by 182 ± 34 μmol/kg; pH by 0.05 ± 0.01 and Ωa by 0.44 ± 0.08. WCSH-regression alkalinity resulted in the largest observed underestimations in TCO2, pHt, and Ωa of 224 ± 41 μmol/kg, 0.06 ± 0.01, and 0.56 ± 0.12, respectively.
Metabolic-Process Dominance
The strong alkalinity-salinity coupling observed during downwelling-favorable conditions tends to break down during persistent upwelling intervals. During these summertime conditions, precipitation and local-river discharge is effectively absent, the Columbia River plume is far offshore, and the in-bay salinity variability is minimal. In spite of this, alkalinity variability is high and significantly in excess of our analytical uncertainty. Even when regressions were statistically significant with high linearity, the coefficients were geochemically unrealistic: slopes with magnitudes many times any reported values and with both positive and negative sign. Similarly, observed alkalinity was as much as 58 μeq/kg different from the regional relationships (Figure 8C), in both positive and negative senses. These results suggested that any alkalinity-salinity covariance was fortuitous, and that the alkalinity variability was driven by processes other than mixing or dilution/concentration. Regression of these data (Figure 8C, inset) generates low predictive power (R2 = 0.25) and geochemically unrealistic slope and intercept values. Parameters calculated from WCSH-regression alkalinity and those provided by Cullison Gray et al. (2011) and Takahashi et al. (2014) were all similarly in error: TCO2 overestimated at times by 108 ± 21μmol/kg, pHt by 0.02 ± 0.01, Ωa by 0.14 ± 0.02.
Non-physical processes that can change bay alkalinity include the consumption/release of protons in proportion to nitrate uptake/regeneration during oxic photosynthesis/respiration; CaCO3 formation and dissolution; and suboxic respiration such as sulfate reduction and pyrite formation (Brewer and Goldman, 1976; Hu and Cai, 2011; Cai et al., 2017). While any of these processes are probably occurring, net calcification seems most likely to have the greatest effect. Aerobic nitrate cycling should result in anti-correlated alkalinity:TCO2 with a ∼1:7 ratio (Dickson, 1981; Wolf-Gladrow et al., 2007), and this is not evident. Further, net autotrophy within the bay, as suggested by the seasonal buildup of seagrass beds, would seemingly result in a growing alkalinity over the course of the summer season, which is also not observed. In contrast, summer alkalinity frequently departs negatively from expected salinity dependences. The only process that can drive these negative departures in the face of strong biological pCO2 depletion is net precipitation of CaCO3. It is hard to quantify the net CaCO3 precipitation independently, but the bay is a location of abundant and resilient shellfish communities.
Implications for Ocean Acidification
Whiskey Creek Shellfish Hatchery experienced the immediate impacts of ocean acidification during the 2008 growing season when intake water containing naturally elevated CO2 –further enhanced by anthropogenic CO2—killed off millions of larval shellfish, placing the hatchery in danger of permanent shutdown (Barton et al., 2012, 2015). Along the adjacent coastal shelf, water influenced by anthropogenic carbon has been documented upwelling onto the shelf (Feely et al., 2008), creating potentially corrosive conditions for marine calcifiers and threatening to fundamentally alter the marine food-web. Instances of ocean acidification-related shellfish mortality and various other implications of changing carbonate chemistry are expected to continue worsening through the end of century (IPCC, 2014), and the work of coastal monitoring and public communication and engagement will be essential toward developing potential mitigation strategies.
In the coastal environment with dramatically variable carbonate chemistry within relatively small spatial scales, monitoring ocean acidification requires a broad network of buoys, field scientists, and volunteers (Hofmann et al., 2011; Takeshita et al., 2015). These operations are often times many millions of dollars (Strong et al., 2014) and the commercial fisheries and shellfish industries rely on accurate, reliable assessment of coastal water quality as it relates to specific organisms. Frequently, pH probes are used to measure pH because they are relatively easy tools to use. However, pH measurements come with inherent measurement uncertainties and often are unreliable predictors of more relevant ocean acidification parameters for marine calcifiers such as Ωa (Gimenez et al., 2019), specifically in salinity-variable settings such as estuaries. Similarly, coastal mooring sites reveal that low pH and low Ωa do not necessarily overlap (Sutton et al., 2016). A 3-year study of Willapa Bay carbonate chemistry revealed that for a nominal pHt value of 7.7, Ωa ranged from < 0.5 to 1.5 (Hales et al., 2017) suggesting that reliance on pH probes alone, without consideration of other carbonate variables, may over- or underestimate optimal seawater growing conditions for hatchery owners. For a nominal pH of 7.7 across all years at WCSH, Ωa ranged from 0.9 to 1.8.
Understanding and predicting organismal response to ocean acidification represents a primary challenge in determining the fate of marine calcifiers in the face of an increasingly corrosive marine environment. For example, laboratory studies suggest that Crassostrea gigas (Pacific oyster) larvae begin to experience acute physiological stress in seawater with Ωa < 1.7; below 1.4 significant developmental stunting and potential larval shellfish mortality can occur (Barton et al., 2012; Waldbusser et al., 2015b); while Ωa < 1.0 and the system thermodynamically favors dissolution of mineral calcium carbonate back into solution. In the context of WCSH, which primarily raise C. gigas larvae, monitoring and adjusting intake water Ωa (Waldbusser et al., 2015a) have led to increased hatchery success (Barton et al., 2015), and far fewer instances of mass larval mortality.
Utilizing hourly calculated Ωa at WCSH for all years of this study, Ωa measured less than 1.7 during 58% of instances, < 1.4 for 31% of instances, and < 1.0 6% of the time, with the most frequent events < 1.4 occur during the late-summer months (Figure 5H). While the ecological thresholds for optimal and suboptimal shellfish spawning are well known for C. gigas, the exact timing of natural larval shellfish spawning remains an ongoing research question. For WCSH, few native oyster populations are found within the bay owing in part to lack of suitable substrate, while mussels are found inhabiting the rocky tidal shores near the mouth of the bay. Clams represent the dominant native shellfish population of Netarts Bay. The success of any native shellfish population which may inhabit the bay is critically dependent on overlapping spawning times with optimal carbonate conditions—particularly within the first 48-h when shellfish are at the highest risk of mortality in corrosive conditions (Waldbusser et al., 2015a).
The Impact of Anthropogenic CO2
The Pacific ocean inventory of CO2 is increasing at a rate of approximately 0.41 ± 0.13 mol C/m2/yr (0.82 ± 0.26 Pg C/yr) (Quay et al., 2017) primarily by means of ocean surface gas exchange with the atmosphere. Estimates place the total increase in concentration of TCO2 in upper surface ocean layers along the west coast of North America on the order of 37–63 μmol/kg, although these values vary spatially (Khatiwala et al., 2013; Feely et al., 2016). Using a conservative nominal value of 37 μmol/kg (ΔTCO2,anth) added to this region of the ocean since 1850, we estimated what conditions would have been like for WCSH without any added anthropogenic carbon by subtracting 37 μmol/kg from the TCO2 observations and recalculating pHt and Ωa.
On average, the addition of 37 μmol/kg TCO2 to the oceans has resulted in average WCSH pHt and Ωa values approximately 0.1 and 0.30 units lower, respectively, when compared to pre-industrial estimates. This is in line with global evaluations that surface ocean pHt has declined 0.1 units since the start of the Industrial Revolution (Feely et al., 2004) and that surface ocean saturation state is in a current state of global decline (Friedrich et al., 2012; Jiang et al., 2015). Applying a conservative fixed anthropogenic TCO2 addition of 37 μmol/kg for all years 2014–2019 (Figure 9), we find the relative impact of anthropogenic carbon on pHt and Ωa is variable throughout upwelling and downwelling events, with no statistically significant interannual variation from 2014 to 2019. Astoundingly, when Ωa conditions are elevated during the late-spring/early-summer months (Figure 5H), the apparent contribution of anthropogenic carbon to reduced Ωa is at its greatest (Figure 9, top). Moreover, the contribution of ΔTCO2,anth to pHt appears to be at its annual minimum during this period, suggesting a decoupling mechanism between pHt and Ωa. While our evaluation likely underestimates the true value of ΔTCO2,anth for Oregon coast source water and assumes ΔTCO2,anth remains fixed between 2014 and 2019, we find the results useful in demonstrating the way in which Netarts Bay is effected by ocean acidification. Implementing a fixed ΔTCO2,anth reveals both a decline in the mean pHt and saturation state, as well as more frequent low- pHt, low-saturation state events (Figure 10). Using this estimate, the frequency of low saturation state events (Ωa < 1.5) has increased nearly 240% while that of undersaturation (Ωa < 1.0) events has increased sevenfold. Continued oceanic uptake of carbon will continue to push pHt and Ωa below their modern values, with high-latitude surface waters expected to be fully undersaturated by the end of century (Feely et al., 2009).
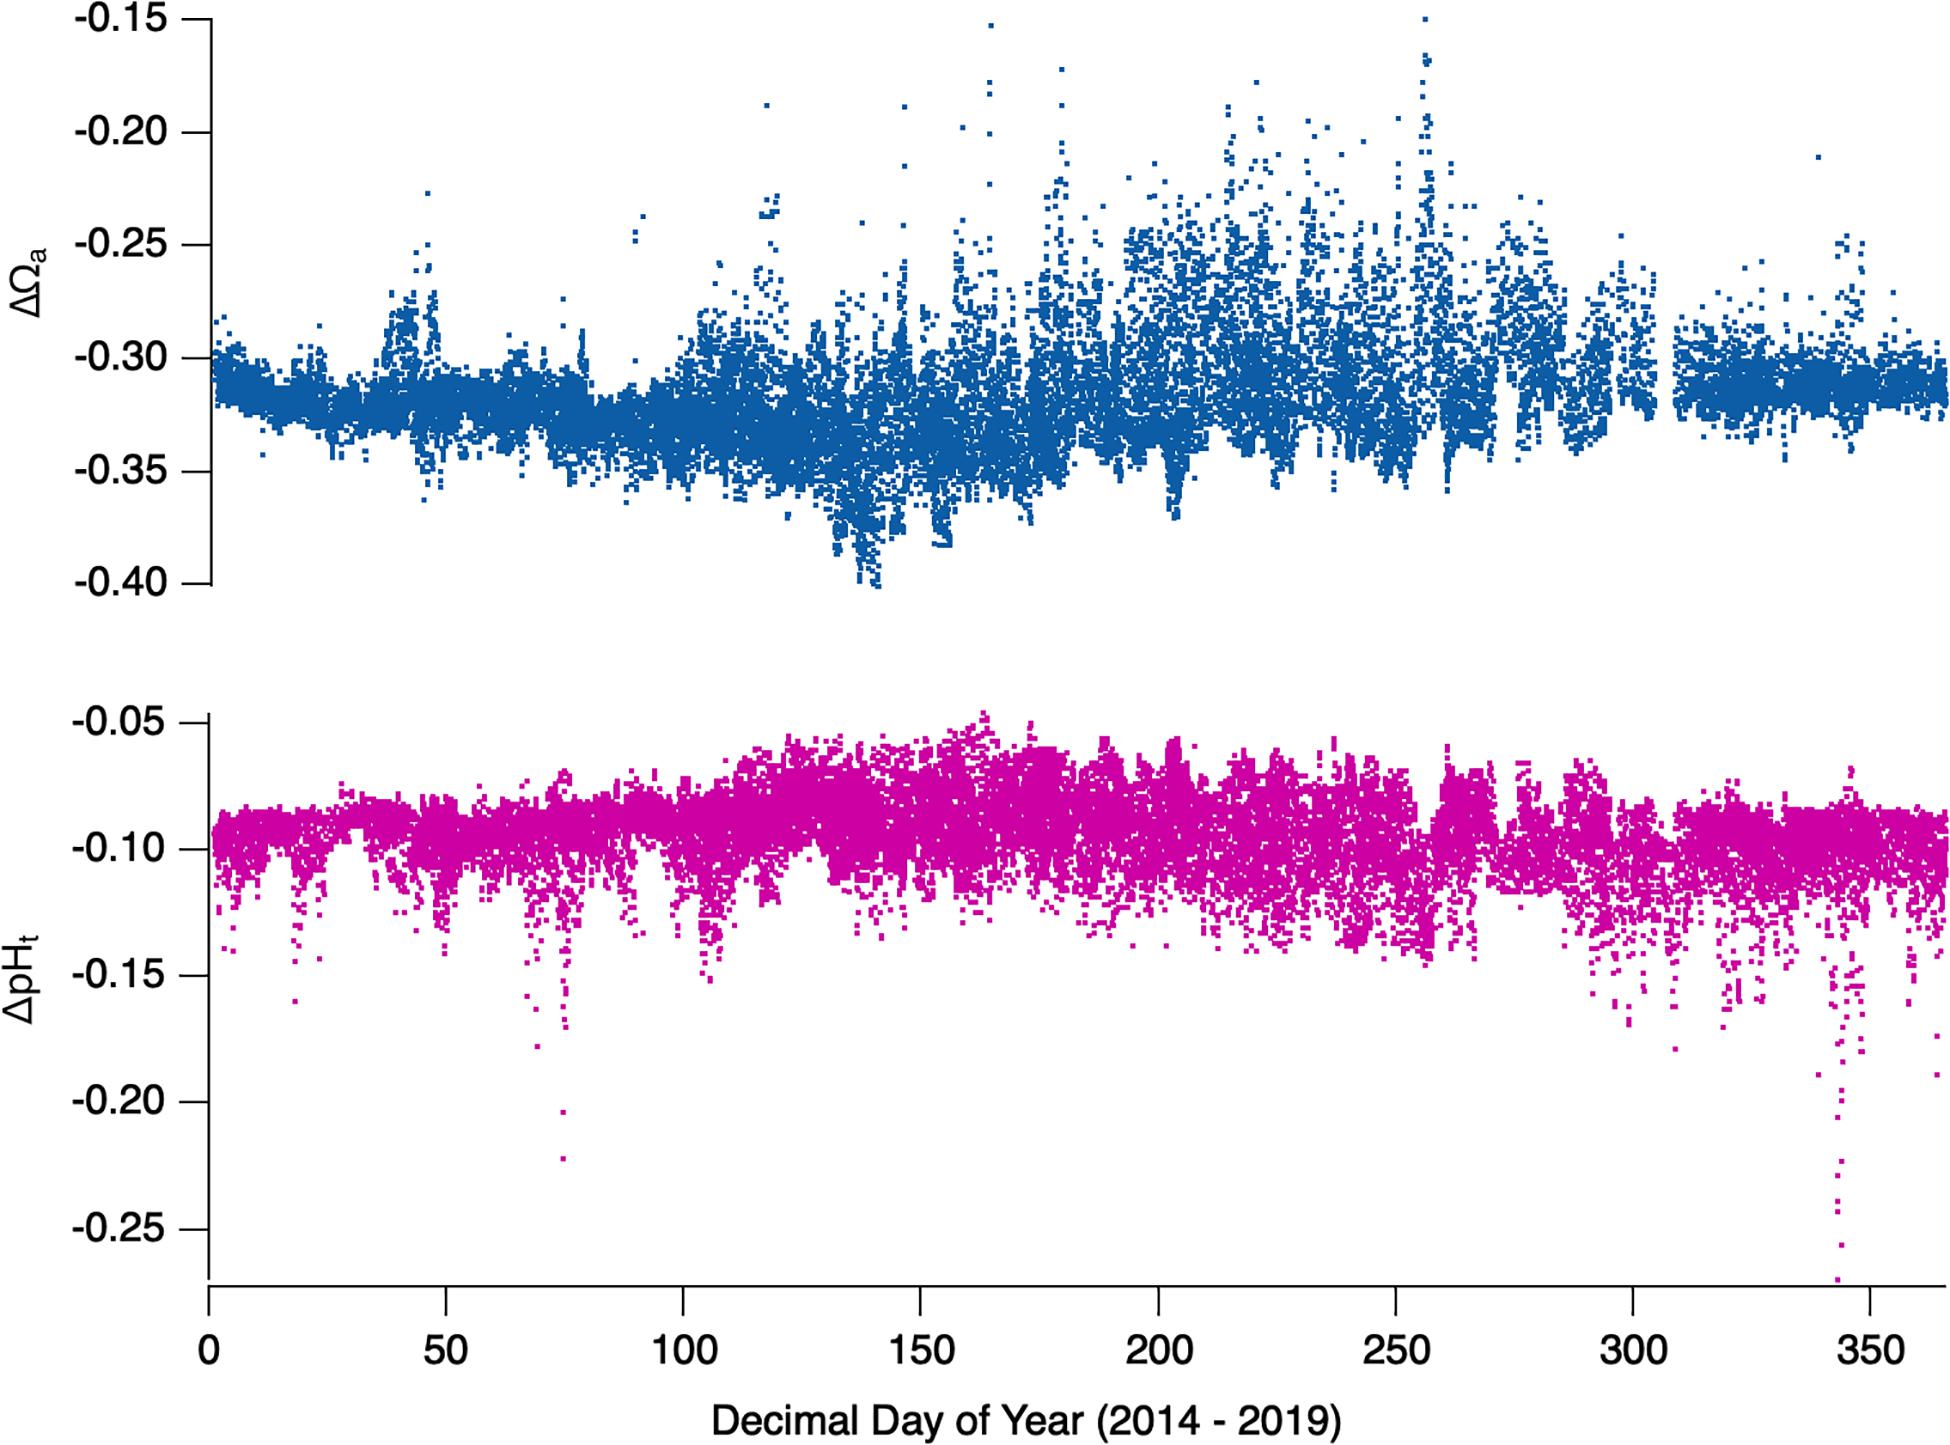
Figure 9. ΔΩa (top) and ΔpHt (bottom) calculated for all years 2014–2019 at WCSH using a conservative nominal value of 37 μmol/kg TCO2 added to west coast of United States surface water since 1850. Values represent approximate negative departures due to anthropogenic CO2.
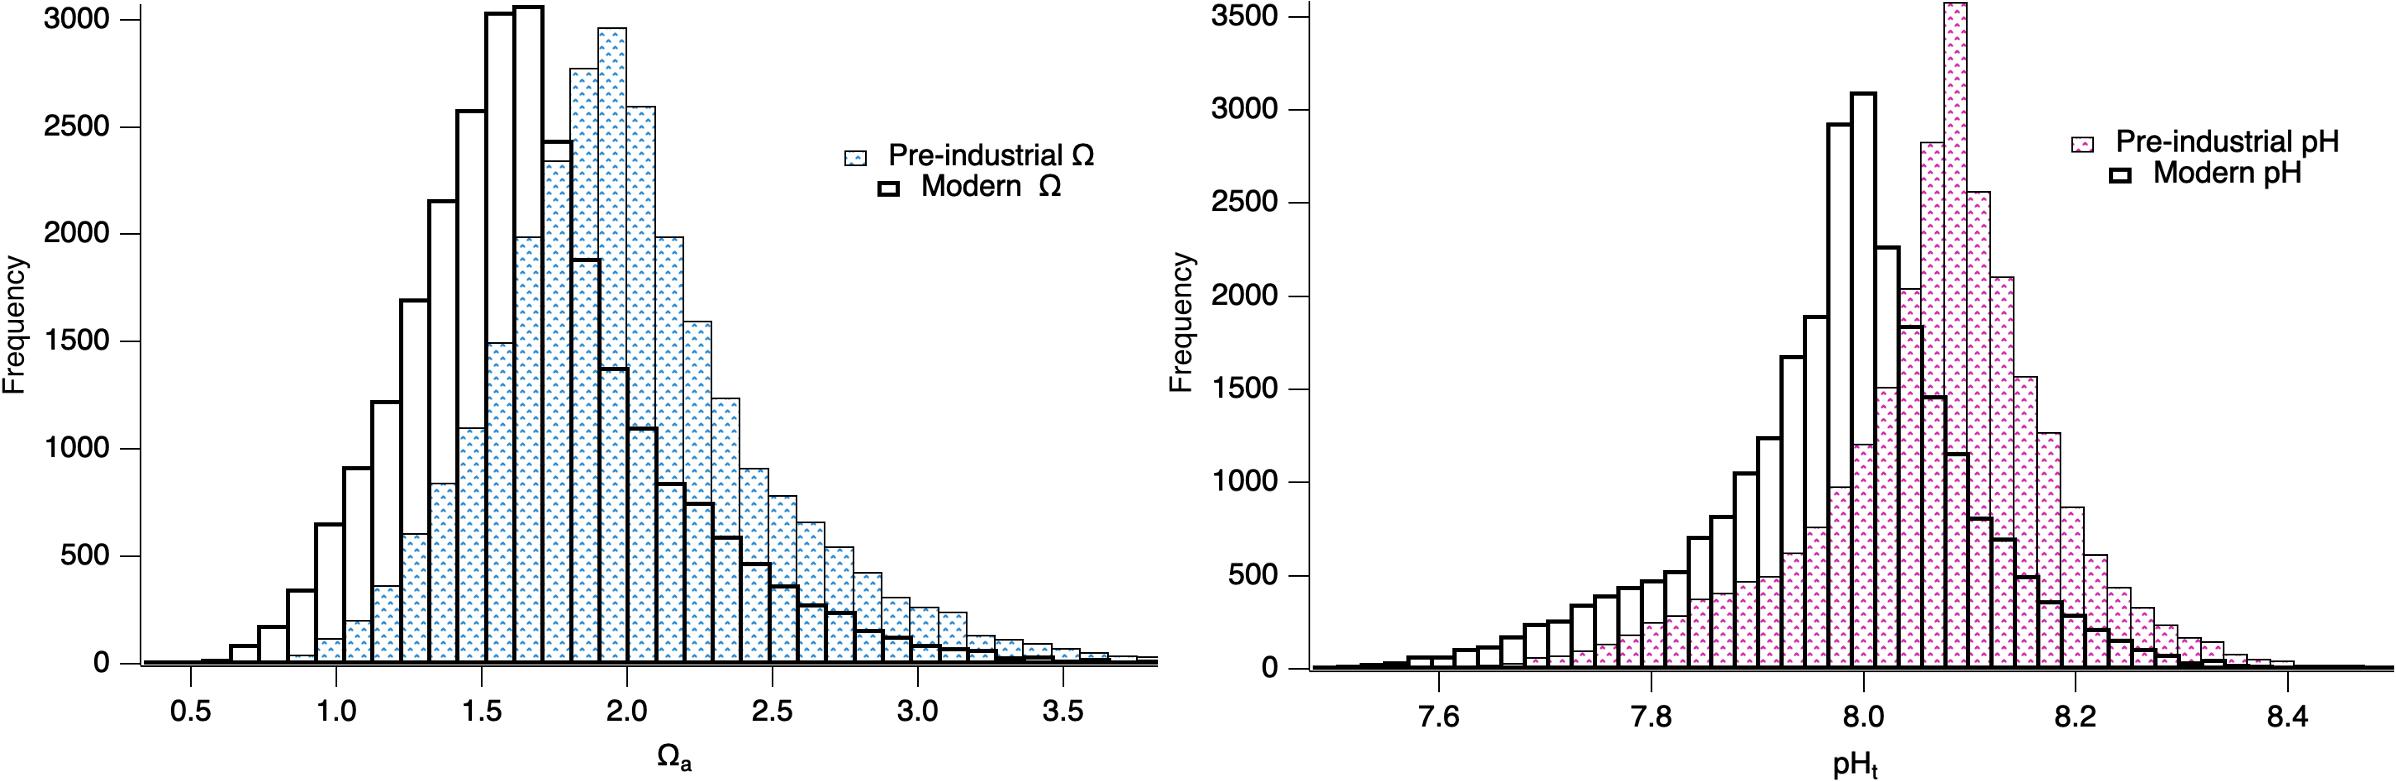
Figure 10. Histogram plot of all hourly calculated Ωa (Left) and pHt (Right) for the 2014–2019 WCSH timeseries.
Conclusion
Netarts Bay is a metabolically dynamic, ocean-dominated estuarine environment with hydrographic and carbonate-system variability occurring on multiple timescales. Summer upwelling, wintertime downwelling, and in situ bay biogeochemistry represent significant drivers of the observed variability in carbonate dynamics. Data presented here show the seasonality, intensity, and duration of high-pCO2 events while illuminating diel, seasonal, and annual patterns of carbonate-system dynamics. Direct estimates of total alkalinity from paired pCO2 and TCO2 measurements suggest local biogeochemical processes not captured by regional, open-ocean alkalinity-salinity relationships. Additionally, in line with global estimates of global surface ocean pHt and calcium carbonate saturation decline, we find that WCSH has experienced an approximate decline in pHt and Ωa of ∼0.1 and ∼0.30 units, respectively, since 1850.
Data Availability Statement
The raw data supporting the conclusions of this article will be made available by the authors, without undue reservation.
Author Contributions
BH was responsible for instrument development. BH and WF were responsible for data acquisition, analysis, and interpretation.
Funding
Funding from NOAA OAP and IOOS programs through an Ocean Technology Transfer award (NA14NOS0120151) and sustained support to NANOOS (NA16NOS0120019).
Conflict of Interest
The authors declare that the research was conducted in the absence of any commercial or financial relationships that could be construed as a potential conflict of interest.
Acknowledgments
The data are available: https://ir.library.oregonstate.edu/concern/datasets/9z903634r?locale=en. We would like to thank the continued participation of the WCSH team, including the sterling leadership of Sue Cudd and Alan Barton, faculty participation and assistance in routine maintenance of the laboratory including Marnie Jo Zirbel, Dale Hubbard, and Joe Jennings, as well as undergraduate and graduate student assistance from Carrie Weekes, Selina Lambert, and Michael Moses.
Footnotes
References
Aristizábal, M. F., Fewings, M. R., and Washburn, L. (2017). Effects of the relaxation of upwelling-favorable winds on the diurnal and semidiurnal water temperature fluctuations in the Santa Barbara channel, California. J. Geophys. Res. Oceans 122, 7958–7977. doi: 10.1002/2017JC013199
Banas, N. S., MacCready, P., and Hickey, B. M. (2009). The Columbia River plume as cross-shelf exporter and along-coast barrier. Cont. Shelf Res. 29, 292–301. doi: 10.1016/j.csr.2008.03.011
Bandstra, L., Hales, B., and Takahashi, T. (2006). High-frequency measurements of total CO2: method development and first oceanographic observations. Mar. Chem. 100, 24–38. doi: 10.1016/j.marchem.2005.10.009
Barton, A., Hales, B., Waldbusser, G. G., Langdon, C., and Feely, R. A. (2012). The Pacific oyster, Crassostrea gigas, shows negative correlation to naturally elevated carbon dioxide levels: implications for near-term ocean acidification effects. Limnol. Oceanography 57, 698–710. doi: 10.4319/lo.2012.57.3.0698
Barton, A., Waldbusser, G., Feely, R., Weisberg, S., Newton, J., Hales, B., et al. (2015). Impacts of coastal acidification on the Pacific Northwest shellfish industry and adaptation strategies implemented in response. Oceanography 25, 146–159. doi: 10.5670/oceanog.2015.38
Brewer, P. G., Bradshaw, A. L., and Williams, R. T. (1986). “Measurements of total carbon dioxide and alkalinity in the North Atlantic Ocean in 1981,” in The Changing Carbon Cycle: A Global Analysis, eds J. R. Trabalka and D. E. Reichle (New York, NY: Springer), 348–370. doi: 10.1007/978-1-4757-1915-4_18
Brewer, P. G., and Goldman, J. C. (1976). Alkalinity changes generated by phytoplankton growth1: alkalinity changes. Limnol. Oceanography 21, 108–117. doi: 10.4319/lo.1976.21.1.0108
Broecker, W. S., Takahashi, T., Simpson, H. J., and Peng, T.-H. (1979). Fate of fossil fuel carbon dioxide and the global carbon budget. Science 206, 409–418. doi: 10.1126/science.206.4417.409
Cai, W.-J., Huang, W.-J., Luther, G. W., Pierrot, D., Li, M., Testa, J., et al. (2017). Redox reactions and weak buffering capacity lead to acidification in the Chesapeake Bay. Nat. Commun. 8:369. doi: 10.1038/s41467-017-00417-7
Cullison Gray, S. E., DeGrandpre, M. D., Moore, T. S., Martz, T. R., Friederich, G. E., and Johnson, K. S. (2011). Applications of in situ pH measurements for inorganic carbon calculations. Mar. Chem. 125, 82–90. doi: 10.1016/j.marchem.2011.02.005
Diaz, R. J., and Rosenberg, R. (2008). Spreading dead zones and consequences for marine ecosystems. Science 321, 926–929. doi: 10.1126/science.1156401
Dickson, A. G. (1981). An exact definition of total alkalinity and a procedure for the estimation of alkalinity and total inorganic carbon from titration data. Deep Sea Res. Part A. Oceanographic Res. Papers 28, 609–623. doi: 10.1016/0198-0149(81)90121-7
Dickson, A. G. (1990). Thermodynamics of the dissociation of boric acid in synthetic seawater from 273.15 to 318.15 K. Deep Sea Res. Part A. Oceanographic Res. Papers 37, 755–766. doi: 10.1016/0198-0149(90)90004-F
Evans, W., Hales, B., and Strutton, P. G. (2013). pCO2 distributions and air–water CO2 fluxes in the Columbia River estuary. Estuarine, Coastal Shelf Sci. 117, 260–272. doi: 10.1016/j.ecss.2012.12.003
Evans, W., Pocock, K., Hare, A., Weekes, C., Hales, B., Jackson, J., et al. (2019). Marine CO2 patterns in the Northern Salish Sea. Front. Mar. Sci. 5:536. doi: 10.3389/fmars.2018.00536
Evans, W., Hales, B., and Strutton, P. G. (2011). Seasonal cycle of surface ocean pCO2 on the oregon shelf. J. Geophys. Res. Atmospheres 116, C05012. doi: 10.1029/2010JC006625
Fassbender, A. J., Alin, S. R., Feely, R. A., Sutton, A. J., Newton, J. A., Krembs, C., et al. (2018). Seasonal carbonate chemistry variability in marine surface waters of the US Pacific Northwest. Earth System Sci. Data 10, 1367–1401. doi: 10.5194/essd-10-1367-2018
Feely, R. A., Alin, S. R., Carter, B., Bednaršek, N., Hales, B., Chan, F., et al. (2016). Chemical and biological impacts of ocean acidification along the west coast of North America. Estuarine, Coastal Shelf Sci. 183, 260–270. doi: 10.1016/j.ecss.2016.08.043
Feely, R. A., Doney, S. C., and Cooley, S. R. (2009). Ocean acidification : present conditions and future changes in a high-CO2 world. Oceanography 22, 36–47. doi: 10.5670/oceanog.2009.95
Feely, R. A., Sabine, C. L., Hernandez-Ayon, J. M., Ianson, D., and Hales, B. (2008). Evidence for upwelling of corrosive “Acidified” water onto the continental shelf. Science 320, 1490–1492. doi: 10.1126/science.1155676
Feely, R. A., Sabine, C. L., Lee, K., Berelson, W., Kleypas, J., Fabry, V. J., et al. (2004). Impact of anthropogenic CO2 on the CaCO3 system in the oceans. Science 305, 362–366. doi: 10.1126/science.1097329
Friedrich, T., Timmermann, A., Abe-Ouchi, A., Bates, N. R., Chikamoto, M. O., Church, M. J., et al. (2012). Detecting regional anthropogenic trends in ocean acidification against natural variability. Nat. Climate Change 2, 167–171. doi: 10.1038/nclimate1372
Gimenez, I., Waldbusser, G. G., Langdon, C. J., and Hales, B. R. (2019). The dynamic ocean acidification manipulation experimental system: separating carbonate variables and simulating natural variability in laboratory flow-through experiments. Limnol. Oceanography: Methods 17, 343–361. doi: 10.1002/lom3.10318
Glanzman (1971). Tidal Hydraulics, Flushing Characteristics and Water Quality of Netarts Bay. Corvallis: Oregon State University.
Hales, B., Chipman, D., and Takahashi, T. (2004). High-frequency measurement of partial pressure and total concentration of carbon dioxide in seawater using microporous hydrophobic membrane contactors. Limnol. Oceanography: Methods 2, 356–364. doi: 10.4319/lom.2004.2.356
Hales, B., Moum, J. N., Covert, P., and Perlin, A. (2005). Irreversible nitrate fluxes due to turbulent mixing in a coastal upwelling system. J. Geophys. Res.: Oceans 110, doi: 10.1029/2004JC002685
Hales, B., Suhrbier, A., Waldbusser, G. G., Feely, R. A., and Newton, J. A. (2017). The carbonate chemistry of the “Fattening line,” Willapa Bay, 2011-2014. Estuar. Coasts; Port Republic 40, 173–186. doi: 10.1007/s12237-016-0136-7
Hofmann, G. E., Smith, J. E., Johnson, K. S., Send, U., Levin, L. A., Micheli, F., et al. (2011). High-Frequency dynamics of ocean pH: a Multi-Ecosystem comparison. PLoS One 6:e28983. doi: 10.1371/journal.pone.0028983
Hu, X., and Cai, W.-J. (2011). An assessment of ocean margin anaerobic processes on oceanic alkalinity budget: anaerobic alkalinity production. Global Biogeochem. Cycles 25:GB3003. doi: 10.1029/2010GB003859
Ianson, D., Allen, S. E., Harris, S. L., Orians, K. J., Varela, D. E., and Wong, C. S. (2003). The inorganic carbon system in the coastal upwelling region west of Vancouver Island, Canada. Deep Sea Res. Part I: Oceanographic Res. Papers 50, 1023–1042. doi: 10.1016/S0967-0637(03)00114-6
Jiang, L.-Q., Feely, R. A., Carter, B. R., Greeley, D. J., Gledhill, D. K., and Arzayus, K. M. (2015). Climatological distribution of aragonite saturation state in the global oceans. Global Biogeochem. Cycles 29, 1656–1673. doi: 10.1002/2015GB005198
Kennish, M. J. (2002). Environmental threats and environmental future of estuaries. Environmental Conserv. 29, 78–107. doi: 10.1017/S0376892902000061
Khatiwala, S., Tanhua, T., Mikaloff Fletcher, S., Gerber, M., Doney, S. C., Graven, H. D., et al. (2013). Global ocean storage of anthropogenic carbon. Biogeosciences 10, 2169–2191. doi: 10.5194/bg-10-2169-2013
Lee, K., Tong, L. T., Millero, F. J., Sabine, C. L., Dickson, A. G., Goyet, C., et al. (2006). Global relationships of total alkalinity with salinity and temperature in surface waters of the world’s oceans. Geophys. Res. Lett. 33:L19605. doi: 10.1029/2006GL027207
Mazzini, P. L. F., Risien, C. M., Barth, J. A., Pierce, S. D., Erofeev, A., Dever, E. P., et al. (2015). Anomalous near-surface low-salinity pulses off the central Oregon Coast. Sci. Rep. 5:17145. doi: 10.1038/srep17145
McCallum, L. (1977). Netarts Bay, Oregon: An Assessment of Human Impact on an Estuarine System. Ph.D. thesis, Department of Geography, Portland State University, Portland. doi: 10.15760/etd.2548
Millero, F. J. (2010). Carbonate constants for estuarine waters. Mar. Freshwater Res. 61, 139–142. doi: 10.1071/MF09254
Mucci, A. (1983). The solubility of calcite and aragonite in seawater at various salinities, temperatures, and one atmosphere total pressure. Am. J. Sci. 283, 780–799. doi: 10.2475/ajs.283.7.780
Nemcek, N., Ianson, D., and Tortell, P. D. (2008). A high-resolution survey of DMS, CO2, and O2/Ar distributions in productive coastal waters. Global Biogeochem. Cycles 22:GB2009. doi: 10.1029/2006GB002879
Peirson, W., Davey, E., Jones, A., Hadwen, W., Bishop, K., Beger, M., et al. (2015). Opportunistic management of estuaries under climate change: a new adaptive decision-making framework and its practical application. J. Environ. Manag. 163, 214–223. doi: 10.1016/j.jenvman.2015.08.021
Pfeiffer-Herbert, A. S., Prahl, F. G., Hales, B., Lerczak, J. A., Pierce, S. D., and Levine, M. D. (2016). High resolution sampling of methane transport in the Columbia River near-field plume: implications for sources and sinks in a river-dominated estuary. Limnol. Ocean. 61, S204–S220. doi: 10.1002/lno.10221
Pierce, S. D., Barth, J. A., Thomas, R. E., and Fleischer, G. W. (2006). Anomalously warm July 2005 in the northern California current: historical context and the significance of cumulative wind stress. Geophys. Res. Lett. 33. doi: 10.1029/2006GL027149
Pringle, J. M., and Dever, E. P. (2009). Dynamics of wind-driven upwelling and relaxation between Monterey Bay and point arena: local-, regional-, and gyre-scale controls. J. Geophys. Res.: Oceans 114. doi: 10.1029/2008JC005016
Quay, P., Sonnerup, R., Munro, D., and Sweeney, C. (2017). Anthropogenic CO2 accumulation and uptake rates in the Pacific Ocean based on changes in the 13C/12C of dissolved inorganic carbon. Global Biogeochem. Cycles 31, 59–80. doi: 10.1002/2016GB005460
Rabalais, N. N., Turner, R. E., Diaz, R. J., and Justic, D. (2009). Global change and eutrophication of coastal waters. ICES J. Mar. Sci. 66, 1528–1537. doi: 10.1093/icesjms/fsp047
Revelle, R., and Suess, H. E. (1957). Carbon dioxide exchange between atmosphere and ocean and the question of an increase of atmospheric CO 2 during the past decades. Tellus 9, 18–27. doi: 10.1111/j.2153-3490.1957.tb01849.x
Strong, A. L., Kroeker, K. J., Teneva, L. T., Mease, L. A., and Kelly, R. P. (2014). Ocean acidification 2.0: managing our changing coastal ocean chemistry. BioScience 64, 581–592. doi: 10.1093/biosci/biu072
Sundquist, E. T., Plummer, L. N., and Wigley, T. M. L. (1979). Carbon dioxide in the ocean surface: the homogeneous buffer factor. Science 204, 1203–1205. doi: 10.1126/science.204.4398.1203
Sutton, A. J., Sabine, C. L., Feely, R. A., Cai, W.-J., Cronin, M. F., McPhaden, M. J., et al. (2016). Using present-day observations to detect when anthropogenic change forces surface ocean carbonate chemistry outside preindustrial bounds. Biogeosciences 13, 5065–5083. doi: 10.5194/bg-13-5065-2016
Takahashi, T., Sutherland, S. C., Chipman, D. W., Goddard, J. G., Ho, C., Newberger, T., et al. (2014). Climatological distributions of pH, pCO2, total CO2, alkalinity, and CaCO3 saturation in the global surface ocean, and temporal changes at selected locations. Mar. Chem. 164, 95–125. doi: 10.1016/j.marchem.2014.06.004
Takeshita, Y., Frieder, C. A., Martz, T. R., Ballard, J. R., Feely, R. A., Kram, S., et al. (2015). Including high-frequency variability in coastal ocean acidification projections. Biogeosciences 12, 5853–5870. doi: 10.5194/bg-12-5853-2015
van Geen, A., Takesue, R. K., Goddard, J., Takahashi, T., Barth, J. A., and Smith, R. L. (2000). Carbon and nutrient dynamics during coastal upwelling off Cape Blanco, Oregon. Deep Sea Res. Part II: Top. Stud. Oceanography 47, 975–1002. doi: 10.1016/S0967-0645(99)00133-2
Vance, J. M. (2012). Proof-of-Concept: Automated High-Frequency Measurements of pCO2 and TCO2 and Real-time Monitoring of the Saturation State of Calcium Carbonate. Thesis, Oregon State University: Corvallis, OR.
Waldbusser, G. G., Hales, B., Langdon, C. J., Haley, B. A., Schrader, P., Brunner, E. L., et al. (2015a). Ocean acidification has multiple modes of action on bivalve larvae. PLoS One 10:e0128376. doi: 10.1371/journal.pone.0128376
Waldbusser, G. G., Hales, B., Langdon, C. J., Haley, B. A., Schrader, P., Brunner, E. L., et al. (2015b). Saturation-state sensitivity of marine bivalve larvae to ocean acidification. Nat. Climate Change 5, 273–280. doi: 10.1038/nclimate2479
Waldbusser, G. G., and Salisbury, J. E. (2014). Ocean acidification in the coastal zone from an organism’s perspective: multiple system parameters, frequency domains, and habitats. Ann. Rev. Mar. Science 6, 221–247. doi: 10.1146/annurev-marine-121211-172238
Waldbusser, G. G., Voigt, E. P., Bergschneider, H., Green, M. A., and Newell, R. I. E. (2011). Biocalcification in the Eastern oyster (Crassostrea virginica) in relation to long-term trends in chesapeake bay pH. Estuaries Coasts 34, 221–231. doi: 10.1007/s12237-010-9307-0
Wetz, M. S., Hales, B., Chase, Z., Wheeler, P. A., and Whitney, M. M. (2006). Riverine input of macronutrients, iron, and organic matter to the Coastal Ocean off Oregon, U.S.A., during the Winter. Limnol. Oceanography 51, 2221–2231. doi: 10.4319/lo.2006.51.5.2221
White, M. M., McCorkle, D. C., Mullineaux, L. S., and Cohen, A. L. (2013). Early exposure of bay scallops (Argopecten irradians) to high CO2 causes a decrease in larval shell growth. PLoS One 8:e61065. doi: 10.1371/journal.pone.0061065
Whitney, M. M., and Garvine, R. W. (2006). Simulating the delaware bay buoyant outflow: comparison with observations. J. Phys. Oceanography 36, 3–21. doi: 10.1175/JPO2805.1
Keywords: ocean acidification, estuarine biogeochemistry, time-series, coastal oceanography, carbonate chemistry, Netarts Bay, Oregon
Citation: Fairchild W and Hales B (2021) High-Resolution Carbonate System Dynamics of Netarts Bay, OR From 2014 to 2019. Front. Mar. Sci. 7:590236. doi: 10.3389/fmars.2020.590236
Received: 31 July 2020; Accepted: 11 December 2020;
Published: 14 January 2021.
Edited by:
Hongjie Wang, Pacific Marine Environmental Laboratory (NOAA), United StatesReviewed by:
Andrea J. Fassbender, Monterey Bay Aquarium Research Institute (MBARI), United StatesSophie Chu, University of Washington, United States
Copyright © 2021 Fairchild and Hales. This is an open-access article distributed under the terms of the Creative Commons Attribution License (CC BY). The use, distribution or reproduction in other forums is permitted, provided the original author(s) and the copyright owner(s) are credited and that the original publication in this journal is cited, in accordance with accepted academic practice. No use, distribution or reproduction is permitted which does not comply with these terms.
*Correspondence: Burke Hales, burke.hales@oregonstate.edu