Links Between the Phytoplankton Community Composition and Trace Metal Distribution in Summer Surface Waters of the Atlantic Southern Ocean
 Johannes J. Viljoen†
  Ian Weir†
  Susanne Fietz*
  Ryan Cloete
  Jean Loock
  Raissa Philibert‡
  Alakendra N. Roychoudhury
- Centre for Trace Metal and Experimental Biogeochemistry, Department of Earth Sciences, University of Stellenbosch, Stellenbosch, South Africa
This study assessed changes in the phytoplankton community related to macronutrient and bioactive trace metal distribution in surface waters of the Atlantic sector of the Southern Ocean, between Cape Town and Antarctica along the GEOTRACES GIPY_05 (mainly along prime meridian) transect in summer 2014–2015. Several general community structure features were reaffirmed, such as the restriction of cyanobacteria to the northern Subtropical Zone, while haptophytes, such as Phaeocystis, along with diatoms, dominate the community north of the Polar Front, and diatoms clearly dominate south of the Polar Front. These community structure changes were often linked with macro- and micro-nutrient composition changes. For example, the concentration of diatoms increased southwards with the availability of silica whereas the cyanobacterial contribution in the northern Subtropical Zone appeared to be linked with labile cobalt depletion. However, these links were not consistent along the entire transect, i.e., no individual nutrient, such as silica or iron, was linked to community composition changes across all water masses. Each station showed a rather unique combination of nutrient and community compositions. Our findings also indicated impacts on the phytoplankton community through trace metal distributions that could be related to a deep mixing event at ∼54∘S and to ice melt at ∼65 and 68∘S. The timing of sampling after such trace metal fluxes proved to be an important consideration, particularly where iron appeared to be preferentially depleted to near-limiting concentrations, possibly driving utilization of other metals. The study highlights the importance of considering a suite of trace metals when assessing controls of phytoplankton variability in the open ocean and emphasizes the need for higher resolution trace metal sampling and multi-element incubation studies to further study the complex relationships between phytoplankton and nutrients.
Introduction
Phytoplankton forms the base of the marine food web and are of particular significance in the Southern Ocean, predominantly in the summer and spring period when large blooms support a profusion of Antarctic life (Deppeler and Davidson, 2017). In addition, phytoplankton are documented as a major driver of macro- and micro-nutrient cycles in the global oceans (Clarke and Leakey, 1996; Sunda and Huntsman, 2000) and play an important role in the carbon export. The ability of phytoplankton to sequester carbon and nutrients is governed by a number of factors ranging from their physical and chemical environment to competition within the community (Hutchins and Bruland, 1998; Deppeler and Davidson, 2017). In light of projected changes in ocean dynamics, constraining variables which govern in situ phytoplankton distribution become fundamental in understanding the distribution and community composition of future oceans (Sarmiento and Le Quéré, 1996; Matebr and Hirst, 1999).
Phytoplankton productivity in the Southern Ocean is limited by macro- and micro-nutrient (trace metal) availability (de Baar et al., 1990; Morel et al., 2003). Trace metals occur in sub-nanomolar concentrations in the open waters of the Southern Ocean, but are responsible for an array of photosynthetic and metabolic functions in phytoplankton (Twining and Baines, 2013). For instance, iron (Fe) is required in the enzyme that catalyzes carbon (C) and nitrogen (N) fixation, zinc (Zn) is required in carbonic anhydrase and responsible for the hydration and dehydration of carbon dioxide (CO2), manganese (Mn) is essential for oxygen evolving enzymes responsible for the oxidation of water during photosynthesis (Sunda, 1989; Twining and Baines, 2013) and copper (Cu) is required in plastocyanin for photosynthetic electron transport (Bruland, 1980; Sunda, 1989). Other trace metals have rather specialized functions, such as cobalt (Co) in the catalytic activity of cobalamin (i.e., vitamin B12). The general proportion in which phytoplankton utilize macro- and micro-nutrients is described by the extended Redfield Ratio: 124C: 16N: 1P: 7.5 × 10⁻³Fe: 8 × 10⁻⁴Zn: 4 × 10⁻⁴Mn: 4 × 10⁻⁴Ni: 3.8 × 10⁻⁴Cu: 2.1 × 10⁻⁴Cd: 1.9 × 10⁻⁴Co (Bruland et al., 1991; Ho et al., 2003). However, metabolic nutrient requirements and the ability to substitute metals in enzymes differ widely among phytoplankton groups and thus, metal availability is likely to shape the community structure.
Although, our understanding of macronutrients and phytoplankton communities is relatively well-constrained, our understanding between in situ phytoplankton communities and trace metals is often hindered by a lack of parallel trace metal and community composition data. The majority of phytoplankton trace metal studies involve incubation experiments, focusing primarily on single species or selected trace metals (e.g., Brand et al., 1983; Sunda and Huntsman, 1995a, 2000; Scharek et al., 1997). Few studies have assessed in situ phytoplankton distributions across various oceanic zones encountered in the Southern Ocean and their unique chemical and physical environments (Wright et al., 2010; Gibberd et al., 2013; Mendes et al., 2015). Some revealed major controls for Southern Ocean phytoplankton, such as temperature, macro- and micro-nutrients, light regime, grazing, and ocean circulation (Findlay and Giraudeau, 2000; Boyd, 2002; Smetacek et al., 2004; Smith and Lancelot, 2004). These studies, however, lack trace metal data. Klunder et al. (2011) and Middag et al. (2011) reported single (Fe and Mn, respectively) and Boye et al. (2012) a suite (Cd, Cu, Mn) of bioactive trace metal distributions across the Atlantic sector of the Southern Ocean and inferred possible biological imprint based solely on chlorophyll-a (chla) or biogenic silica (BSi) concentrations, lacking community composition data. Similar studies have also been conducted in other sectors of the Southern Ocean (Measures et al., 2012 and references therein). Conversely, van Leeuwe et al. (2015) assessed the phytoplankton community structure across a latitudinal gradient only with accompanying dissolved Fe (dFe) concentrations. Several large scale iron enrichment experiments have also been conducted during the past two decades (Coale et al., 1996; de Baar et al., 2005; Boyd et al., 2012 and references therein). To our knowledge, in situ phytoplankton variability related to a suite of essential trace metals has, however, not been assessed in the Southern Ocean.
Accordingly, current initiatives such as the international GEOTRACES program (GEOTRACES, 2019) and, more recently, the BioGeoSCAPES initiative (BioGeoSCAPES, 2018), aim to provide multi-variable data sets focused on macro- and micro-nutrient distributions while elucidating biological processes that influence ocean geochemistry and ultimately, trace metal distribution and speciation. As such, this paper aims to assess the relationship between micro- and macro-nutrient distributions and the phytoplankton community assemblage along the Good Hope monitoring line; a latitudinal transect across the Atlantic sector of the Southern Ocean during summer that includes the crossing of a mid-ocean ridge and the marginal ice zone.
Materials and Methods
Cruise Track
Sampling for this study was undertaken on the SA Agulhas II during the 54th South African National Antarctic Expedition (SANAE54) from December 2014 to February 2015 between Cape Town and Antarctica along the GEOTRACES GIPY_05 transect (mainly along prime meridian) in the Atlantic sector of the Southern Ocean (Figure 1). This cruise consisted of four legs of which legs 1, 3, and 4 are discussed in this study. The first leg (05/12/2014–16/12/2014; herein referred to as “December”) went from Cape Town, South Africa, south-westwards reaching 0°E at ∼55°S and continued south along the 0°E to the Antarctic shelf. This transect is also known as the Bonus Good Hope monitoring line. No samples were taken for trace metals from the second leg to South Georgia and this section will therefore not be further discussed here. The third leg (6/1/2015–23/1/2015; herein referred to as “January”) followed the Bonus Good Hope line southwards again, starting at 46°S 08°E, steaming first southwest toward the prime meridian and then southward to the Antarctic ice shelf. The fourth leg (7/2/2015–15/2/2015; herein referred to as “February”) returned from the Antarctic ice shelf north along the same transect as in December, i.e., along the prime meridian to ∼55°S and thereafter northeast toward Cape Town.
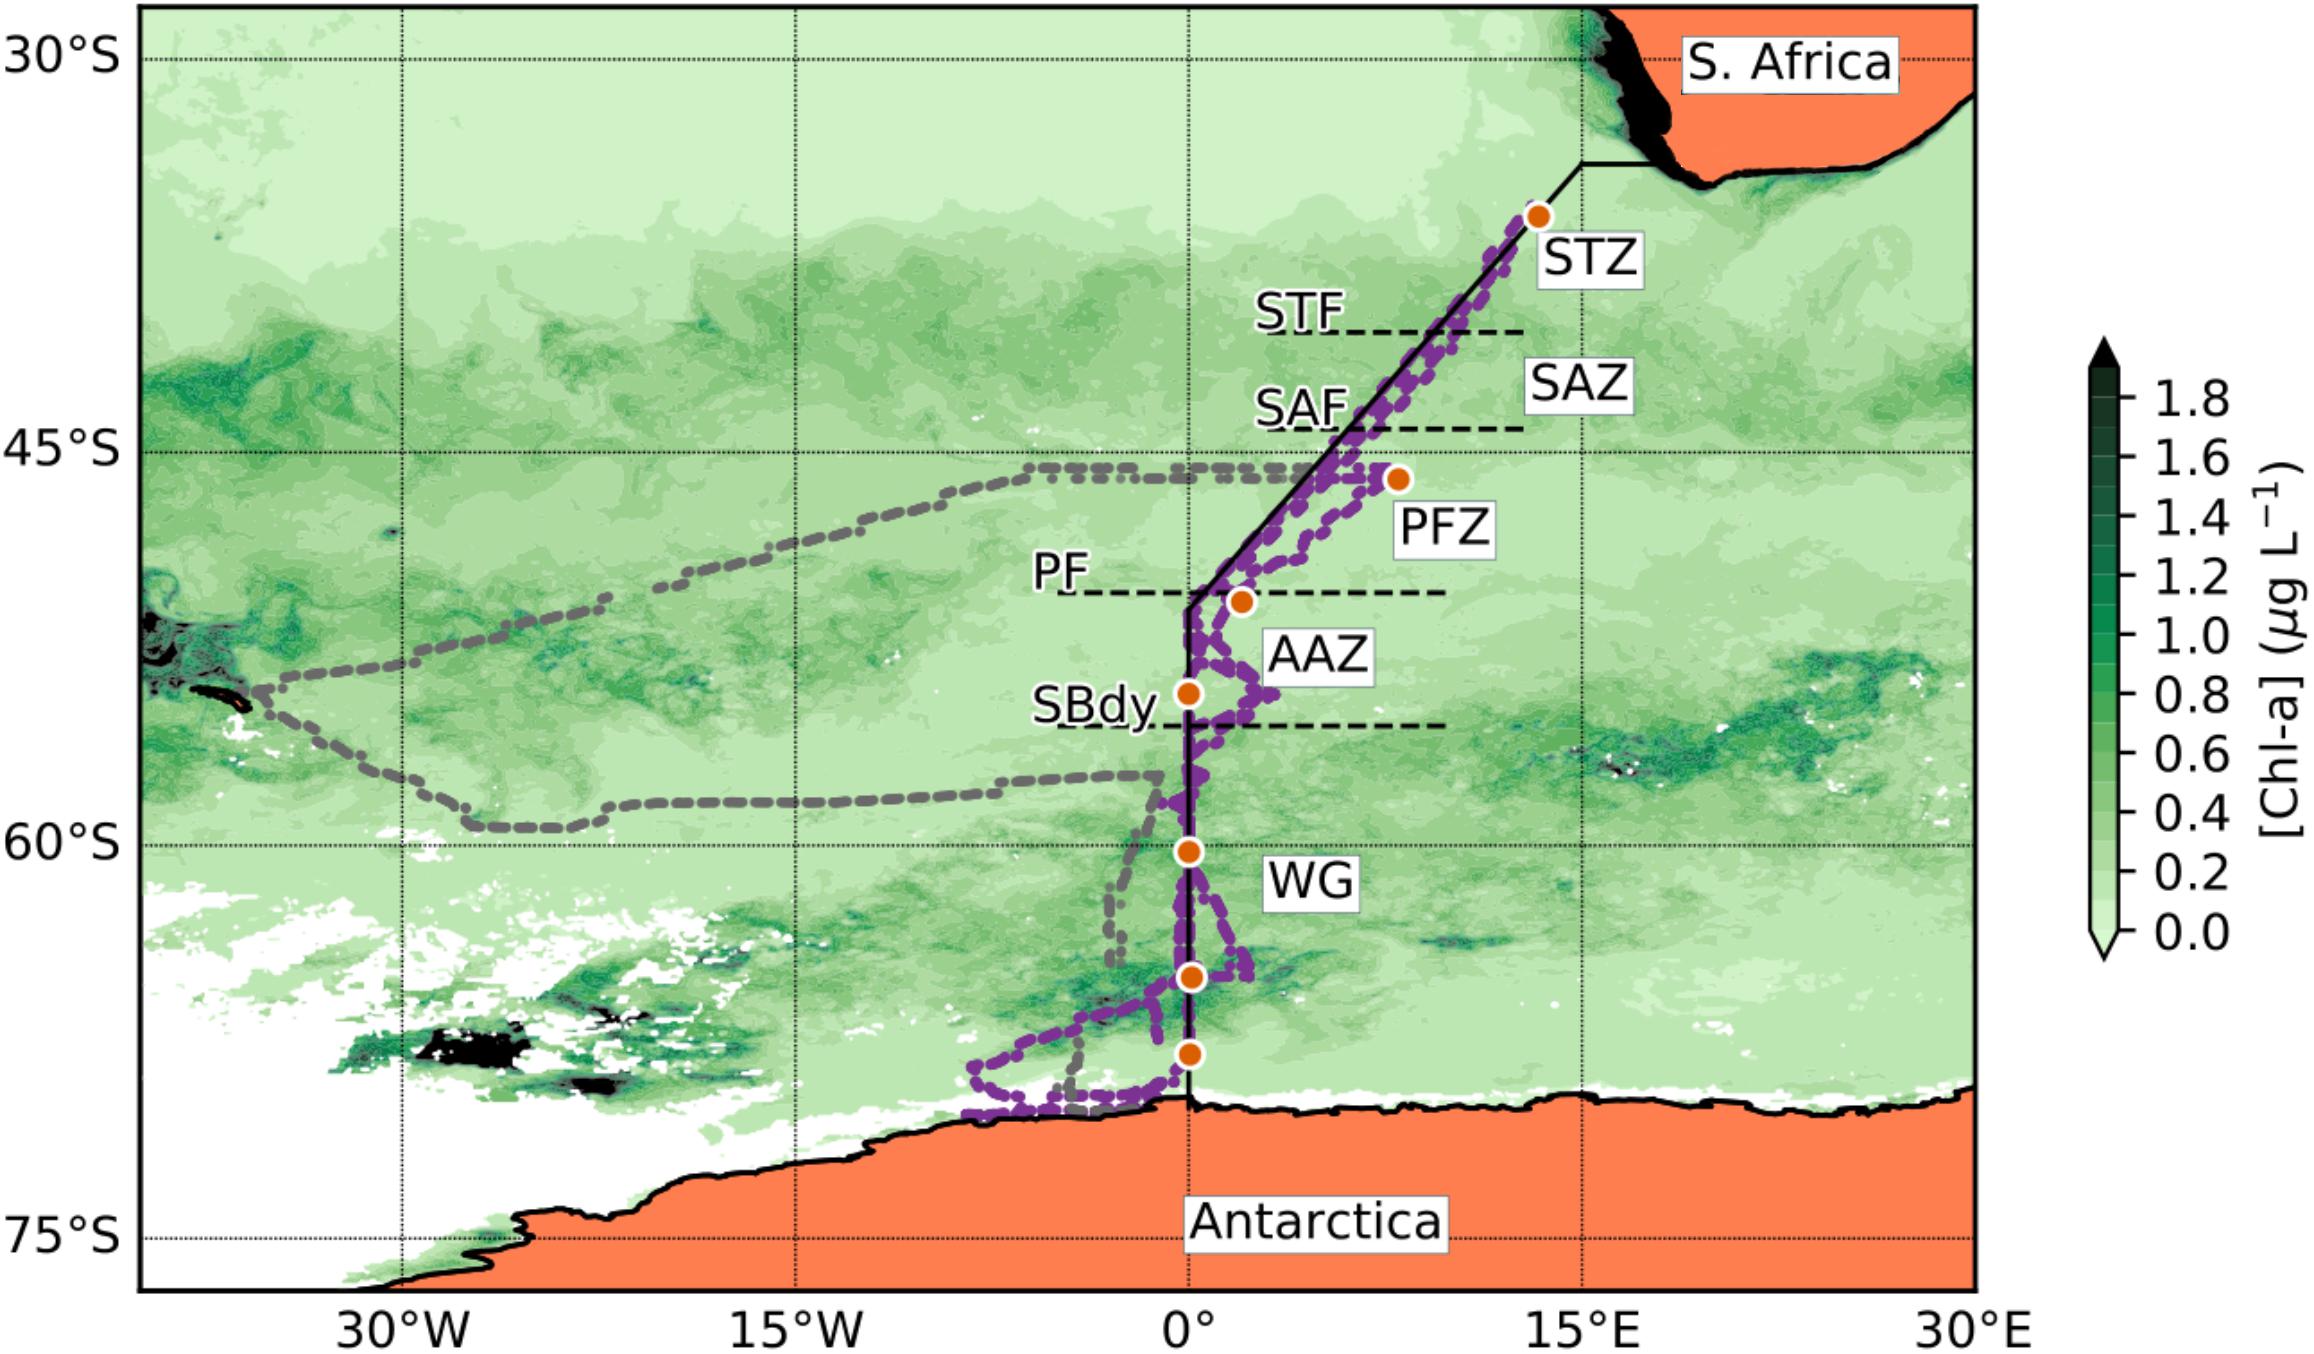
Figure 1. Station positions along the Good Hope line for the SANAE54 cruise. The orange dot symbols indicate the trace metal stations (Table 1). The solid black line represents the Good Hope line. The smaller dots show the actual ship transects during the cruise, purple representing the Good Hope line transect and gray the South Georgia leg. The background shows a seasonal composite of chla concentration for the period of December 2014 to February 2015 (NASA Ocean Biology Processing Group, 2014). The dashed horizontal lines indicate the frontal positions [subtropical front (STF); subantarctic front (SAF); polar front (PF)] and the Southern Boundary (SBdy) of the ACC along the Good Hope line. Black regions on the map represent areas where the chla concentration is higher than 2 μg L-l whereas white regions indicate insufficient chla data due to ice or cloud cover.
Sampling and Analysis
Sea surface temperature and sea surface salinity data were measured continuously on-board with a thermosalinograph system (SBE 45/38, Sea-Bird Electronics; ± 0.002°C and ±0.3 mS/m accuracy) and recorded at 10-min intervals by the scientific data system. All other sampling and analytical procedures are explained in detail below.
Pigments and Determination of Phytoplankton Community Composition
Seawater was collected for chlorophyll-a (chla) and accessory pigment analysis from the continuous underway supply at 5–6 m water depth from the ship’s bow. Water samples (400 mL) were collected approximately at one degree intervals and more frequently when approaching a trace metal station. The resulting sample set constitutes 24 samples representing the surface phytoplankton communities across all major water masses; the Subtropical Zone (STZ), Subantartic Zone (SAZ), Polar Frontal Zone (PFZ), Antarctic Zone (AAZ), and Weddell Gyre (WG) region. The water was filtered under dim light through Whatmann® GF/F glass fiber filters (0.7 μm nominal pore size) and filters were immediately stored at −80°C until analysis after the cruise. Phytoplankton pigments were extracted from freeze-dried filters at −20°C in methanol and analyzed by high-performance liquid chromatography (HPLC) at Laboratoire d’Océanographie de Villefranche/Mer (LOV – CNRS) with a complete Agilent Technologies system that includes LC Chemstation integration software, a refrigerated autosampler, a diode array detector and a reversed-phase C8 Zorbax Eclipse XDB column (maintained at 60°C) as described in detail in Ras et al. (2008). The calculation of phytoplankton community composition based on pigment data was done using the CHEMTAX matrix factorization program (Mackey et al., 1996; Wright et al., 2010). The reader is referred to the Supplementary Information for details regarding the choice of specific pigments and phytoplankton groups in the CHEMTAX processing. Phaeophorbide-a and phaeophytin-a pigments were used to address degradation.
Macronutrient, Biogenic Silica, and SEM Imagery
Surface water was also collected from the continuous underway supply for the analysis of dissolved nutrients (, , Si(OH)4, and ). Seawater was filtered through 0.2 μm pore size syringe filters and frozen at −20°C immediately after sampling. Samples were analyzed within 1 to 2 months of sampling at the University of Cape Town. A Lachat Quick-Chem Flow injection autoanalyzer was used for the analysis of +, and Si(OH)4 (Wolters, 2002; Egan, 2008). Phosphate was analyzed manually according to methods described by Grasshoff et al. (1983) with a SpectronicTM HeliosTM EpsilonTM spectrophotometer at 880 nm. The analytical error of the +, , and Si(OH)4 quantifications are ±0.04, ±0.06, and ±0.02 μM, respectively (Grasshoff et al., 1983), and the coefficient of variance is ∼1% (Patey et al., 2008). Particulate silica samples were collected upon approach/departure to/from station. Approximately 1 L of seawater was filtered onto a 0.45 μm OmniporeTM membrane filter. The filter was then oven-dried for at least 12 h at 60°C. Biogenic silica (BSi) was determined using the NaOH digestion method described by Ragueneau and Tréguer (1994). This involved the hydrolysis of biogenic silica using a hot NaOH solution followed by silicic acid analysis using the modified (see Supplementary Methods) colorimetric detection method of Grasshoff et al. (1983). The reduced silicomolybdic acid species was measured on a Genesys 10-S UV Spectrophotometer at 810 nm. A blank filter interference of 0.04 ± 0.002 and 0.12 μM limit of detection was reported for the NaOH digestion in this study. Instrumental, and other analytical errors associated with the NaOH were reported to be < 4%. Filter samples (0.45 μm OmniporeTM) were further collected for scanning electron microscope (SEM) imaging and carbon-coated. Scanning electron micrographs were used to identify the cells to species level using taxonomic keys provided in Hasle et al. (1996) and Scott and Marchant (2005) as well as online resources on specific genera. Species names were verified using AlgaeBase (Guiry and Guiry, 2018). The technique was purely qualitative to support the phytoplankton community composition determination described above.
Dissolved Trace Metals
All concentrations referred to in this study are of dissolved metal species, except for Co and Cu, where lack of UV-oxidation sees the labile fraction reported. For the purpose of this paper, both dissolved and labile fractions are referred to as “dissolved.” Full depth profiles for a suite of dissolved bioactive trace metals (copper – Cu, zinc – Zn, iron – Fe, nickel – Ni, cobalt – Co, manganese – Mn, and cadmium – Cd) were determined during the cruise (see Cloete et al., 2019 for Cu, Zn, and Ni), but for the purposes of this paper, only surface concentrations at ca. 15–16 m water depth and the metal:PO4 vertical depth slope values of each station (see Supplementary Information for an example calculation) are reported.
Details on materials used, washing procedures, instrument calibration and method validation can be found in Supplementary Information. In brief, trace metal samples were collected from seven CTD stations (Figure 1) using GoFlo bottles housed on a titanium frame, and sub-sampled on-board in a certified class 100 clean container. All sampling and material cleaning procedures strictly followed GEOTRACES protocols (Cutter and Bruland, 2012; Cutter et al., 2014). The trace metal samples reported here were all collected in low density polyethylene (LDPE) bottles following online filtration (AcroPakTM, 0.2 μm). Samples were pre-concentrated (40 times) using a seaFAST-pico SC-4 DX module (Elemental Scientific, Inc.) in a certified class 100 laboratory and analyzed using an Inductively Coupled Plasma Mass Spectrometry (Agilent 7900 ICP-MS) at Stellenbosch University, South Africa.
Data Analysis
Several statistical correlation techniques were implemented to determine (i) nutrient-type behavior of trace metals, (ii) which trace metals and phytoplankton groups behaved similarly across the transect, and (iii) the relationship between phytoplankton groups and macro- and micro-nutrients. Nutrient-type behavior of trace metals is defined, in this paper, as trace metals which behave in a similar fashion to macronutrients in a typical depth-related profile. A typical nutrient profile is described as biological uptake in the surface followed by remineralization below surface waters and consistent concentrations at depth. Nutrient-type behavior of trace metals was inferred here if depth profiles of trace metal versus phosphate concentrations were significantly and positively correlated over the upper 1000 m water column at 95% confidence interval. A principal component analysis (PCA) was performed to assess similarities along the surface transect among trace metals and phytoplankton groups. The PCA was performed in SPSS software with rotation method varimax and Kaiser normalization. The PCA provides the proportion a component contributes to the variance but cannot identify the component itself. The number of surface trace metal data did not allow for determination of canonical coefficients. Non-parametric rank correlation Kendall-Tau was calculated in SPSS to assess the strength of the relation between phytoplankton chemotaxonomic group chla concentrations and macro- or micro-nutrients.
Results
Temperature, Salinity, and Hydrography
Three major fronts of the Antarctic Circumpolar Current (ACC) were crossed along the Good Hope Line transect: Subtropical Front (STF; ∼40.4°S), Subantarctic Front (SAF; ∼44.1°S), and Polar Front (PF; ∼50.4°S; Figure 1). The Southern Boundary (SBdy) of the ACC was located at ∼55.4°S (Supplementary Table S1; Cloete et al., 2019). The frontal positions at the time of this study were identified based on December 2014 temperature data from the eXpendable BathyThermographs (XBT) transect AX25 done on the same cruise (NOAA, 2015) using criteria in Orsi et al. (1995) and Pollard et al. (2002). Using the fronts and the SBdy, we classified the Southern Ocean surface waters in our study into five distinctive zones: STZ, SAZ, PFZ, AAZ, and WG (Figure 1 and Supplementary Table S1).
Sea surface temperatures generally decreased from north to south with temperatures of up to ∼20°C in the STZ, and temperatures of ∼0 to 5°C south of the PF (Supplementary Figure S1A). Salinity also decreased from north to south with salinities of up to 35.7 in the subtropical waters and strong changes down to ∼33.5 through the SAZ (Supplementary Figure S1B). High spatial variability in temperature and salinity was observed in close proximity to some of the fronts, especially the STF (e.g., temperature shifts of ∼5°C observed in February), and the ice shelf (e.g., temperature shifts of ∼5°C observed in January; Supplementary Figure S1A). Seasonal progression toward warmer waters from December to February was also observed, again, especially in the vicinity of the STF, where a ∼4°C increase was found from December to February (Supplementary Figure S1A). In contrast, large seasonal variation in salinity did not occur (Supplementary Figure S1B).
Macronutrients
Nitrate surface concentrations were low throughout the STZ in December (avg. 1.3 μM; Figure 1 and Supplementary Table S2), while displaying a southward increase to ∼25–35 μM in the SAZ and ∼30–40 μM in the PFZ and AAZ (Figure 2A). South of 55°S (i.e., south of the SBdy), nitrate concentrations decreased to ∼10–20 μM, but increased up to ∼30 μM at around 65°S. Average nitrate concentrations in the PFZ and northern AAZ showed much lower concentrations in January and February (∼10–20 μM) compared to December (∼30–40 μM; Figure 2A and Supplementary Table S2). Phosphate gradually increased southward from <0.5 μM in the STZ to mainly ∼1–3 μM in the WG in December (Figure 2B). Consequently, surface molar nitrate to phosphate (N/P) ratios were low in the STZ and WG (mostly < 20) but elevated between the STZ and WG, i.e., between the STF and the SBdy (∼20–100; Supplementary Figure S2 and Supplementary Table S2). Phosphate concentrations indicated a depletion with seasonal progression in the WG, with lower phosphate concentrations in the WG in January and February compared to December (Figure 2B). In all other water masses, January and February phosphate concentrations remained similar to December concentrations.
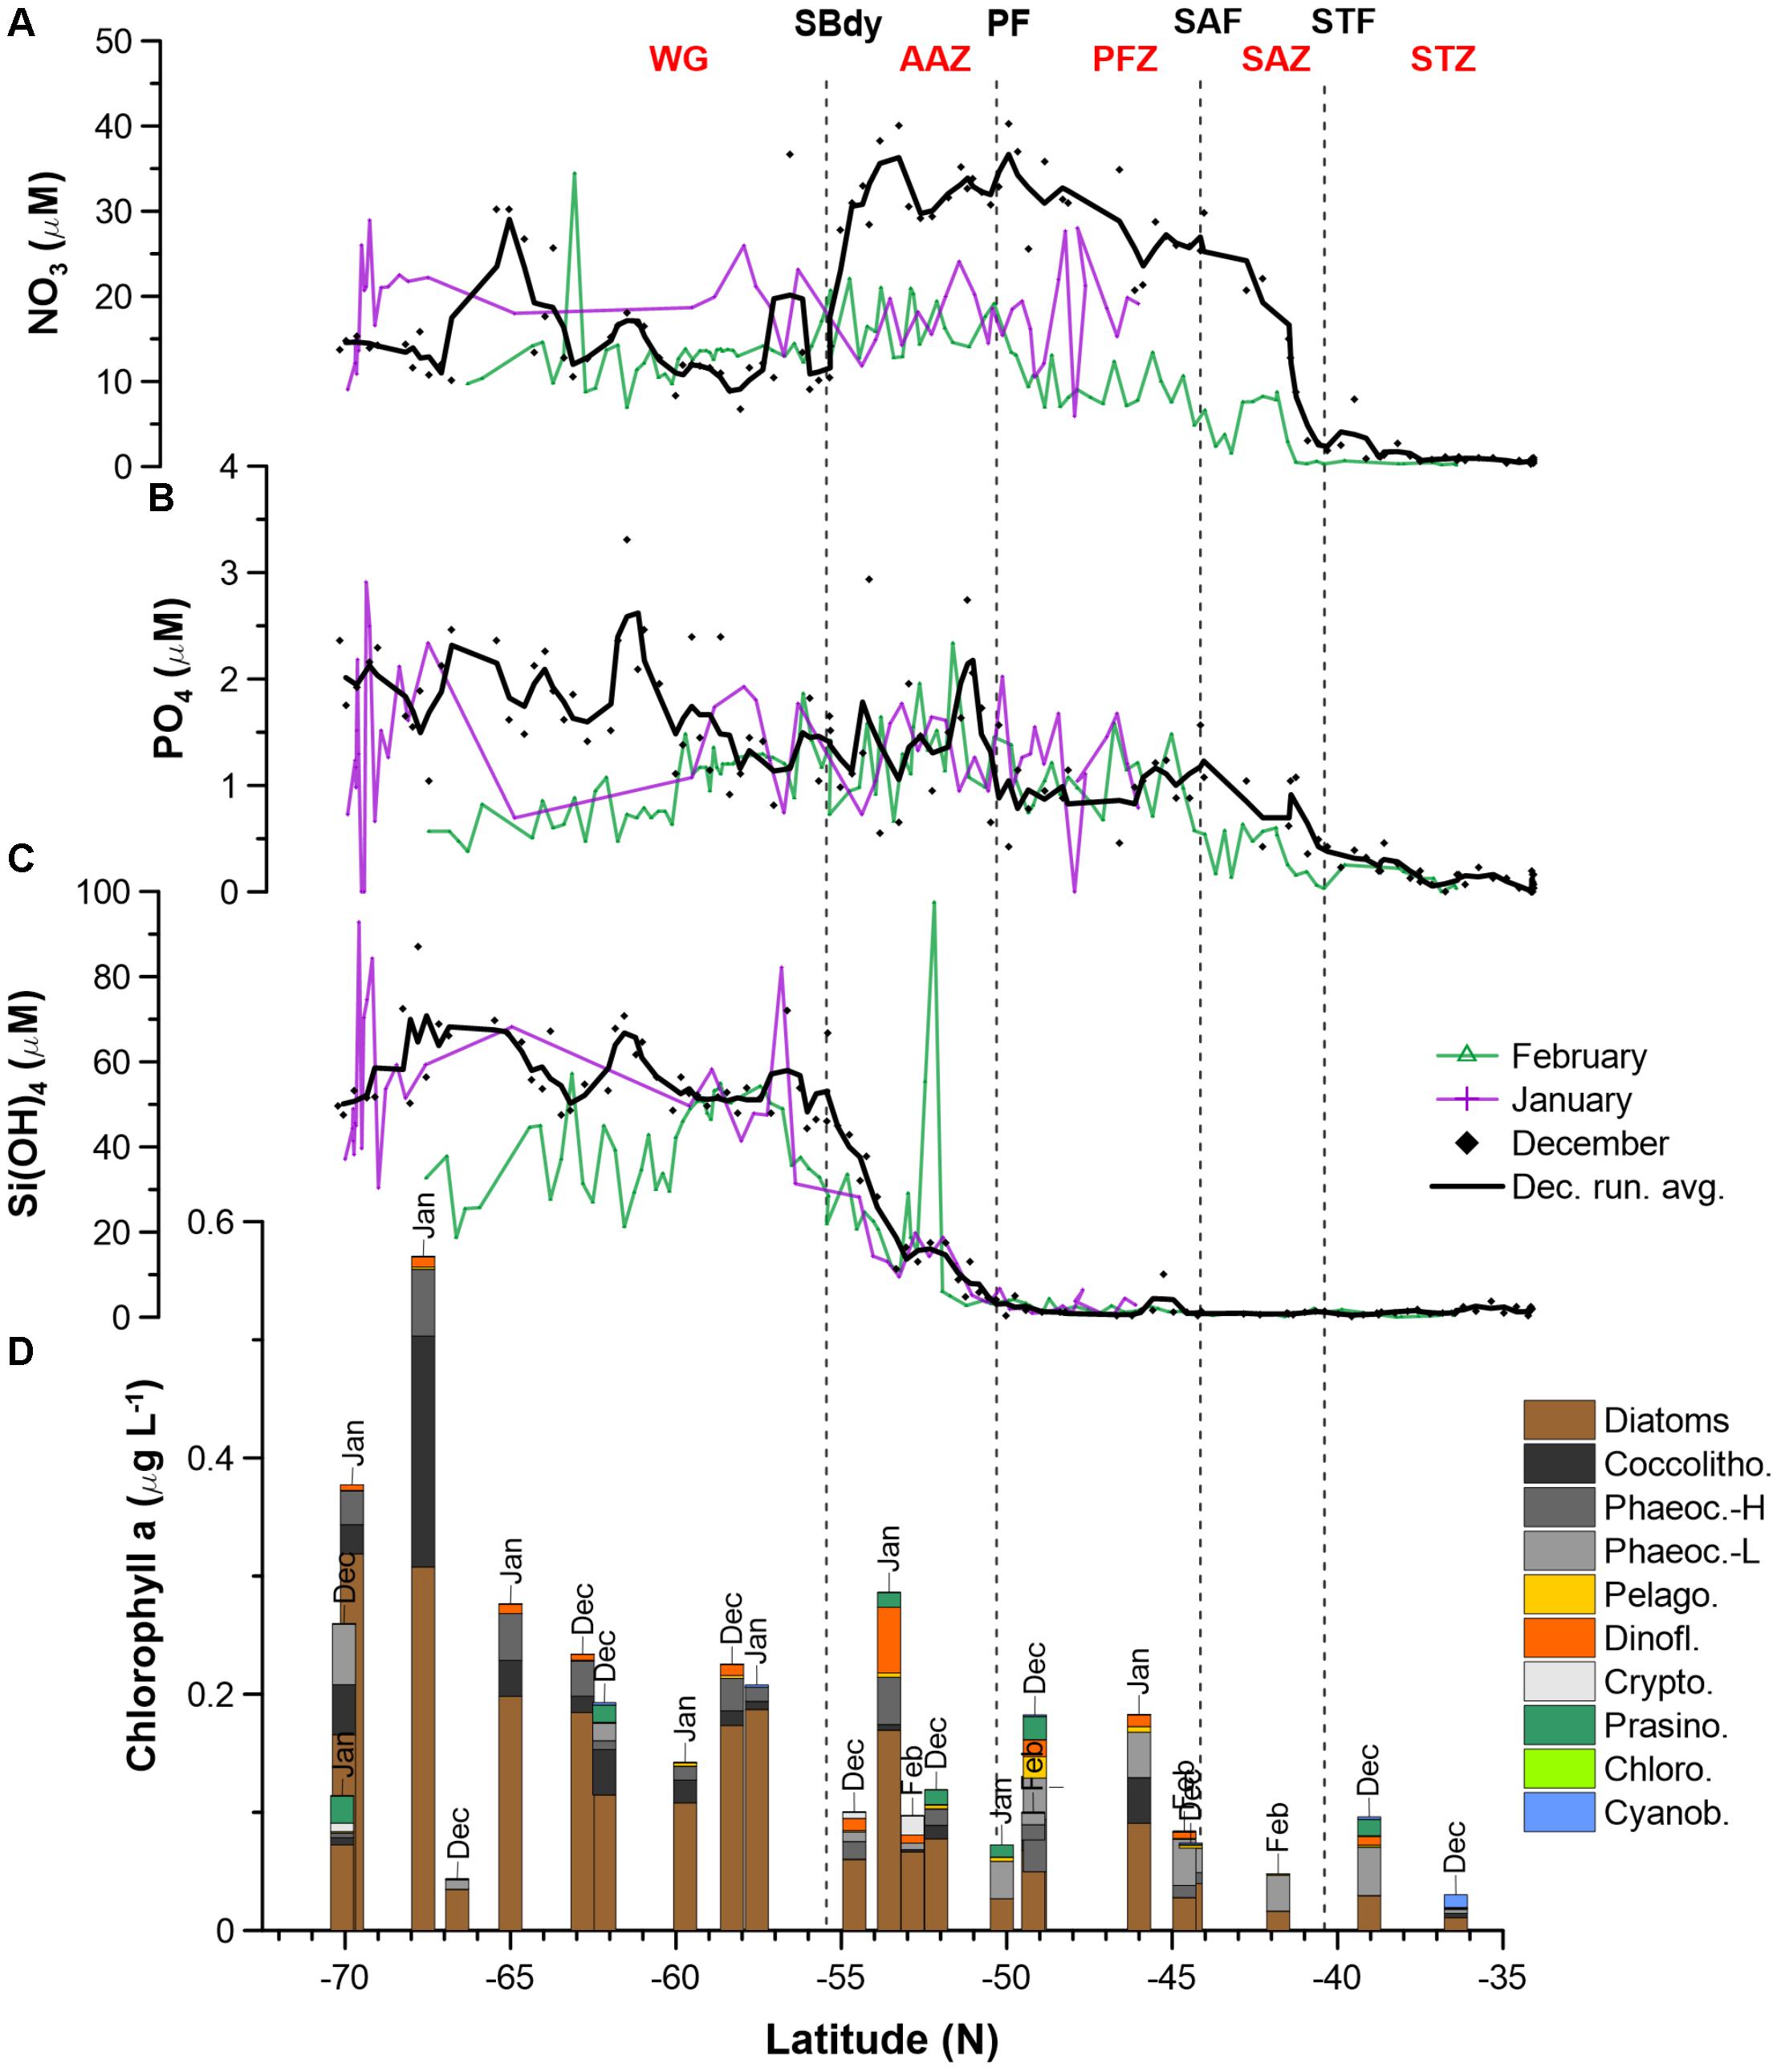
Figure 2. Macronutrient (A: NO3; B: PO4; C: H4SiO4) concentrations and phytoplankton community structure (D) along the Good Hope monitoring Line during the SANAE54 cruise (see Figure 1 for cruise map). Averages and ranges of macronutrient concentrations and ratios, per water mass, can be found in Supplementary Figure S2 and Supplementary Table S2. Detailed phytoplankton pigment concentrations and group contributions to chla can be found in Supplementary Tables S5, S7 and Supplementary Figure S3.
Relatively low concentrations of silicic acid (avg. <3 μM) persisted throughout the STZ, SAZ, and PFZ in December, followed by a sharp rise south of the PF (Figure 2C). Ratios of silicic acid versus nitrate and silicic acid versus phosphate (Si/N and Si/P), showed similar trends – high Si/N and Si/P ratios in the STZ, very low ratios in the SAZ and PFZ, increasing ratios in the AAZ, and highest ratios in the WG (Supplementary Figure S2 and Supplementary Table S2). In January and February, low concentrations of silicic acid (avg. 2.7 μM) also prevailed in the STZ, SAZ and PFZ, but increased south of the PF in the AAZ (avg. 12 μM), and WG (avg. 53 μM). In December, silicic acid concentrations declined in the proximity of the Antarctic shelf (>68°S), while in January – similarly to phosphate – the silicic acid concentrations showed high variability (Figure 2C).
Dissolved Trace Nutrients
Sampling for bioactive dissolved trace metals was conducted at seven stations during the fourth leg of SANAE54, January to February 2015 (Figure 1). In the surface waters south of the STZ, Ni was typically the most abundant micronutrient, followed typically by Zn or Cu, Cd, Fe, and Mn (Table 1 and Supplementary Table S4). Principal component analysis indicated that three components accounted for almost all (98%) the variance in the surface trace metal distribution along the transect (Figure 3A and Supplementary Table S3A). For example, Co and Ni were related negatively and Zn and Mn positively to a first component that explained around 41% of the variance (Figure 3A).
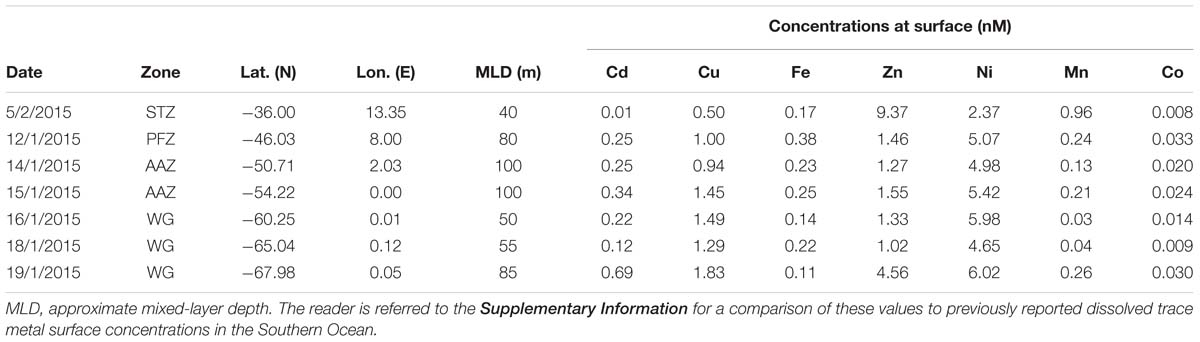
Table 1. Surface trace metal concentrations (in nM) determined at seven stations across the Atlantic sector of the Southern Ocean measured during the third (January) and fourth (February) leg of voyage SANAE54 (see Figure 1 for cruise map).
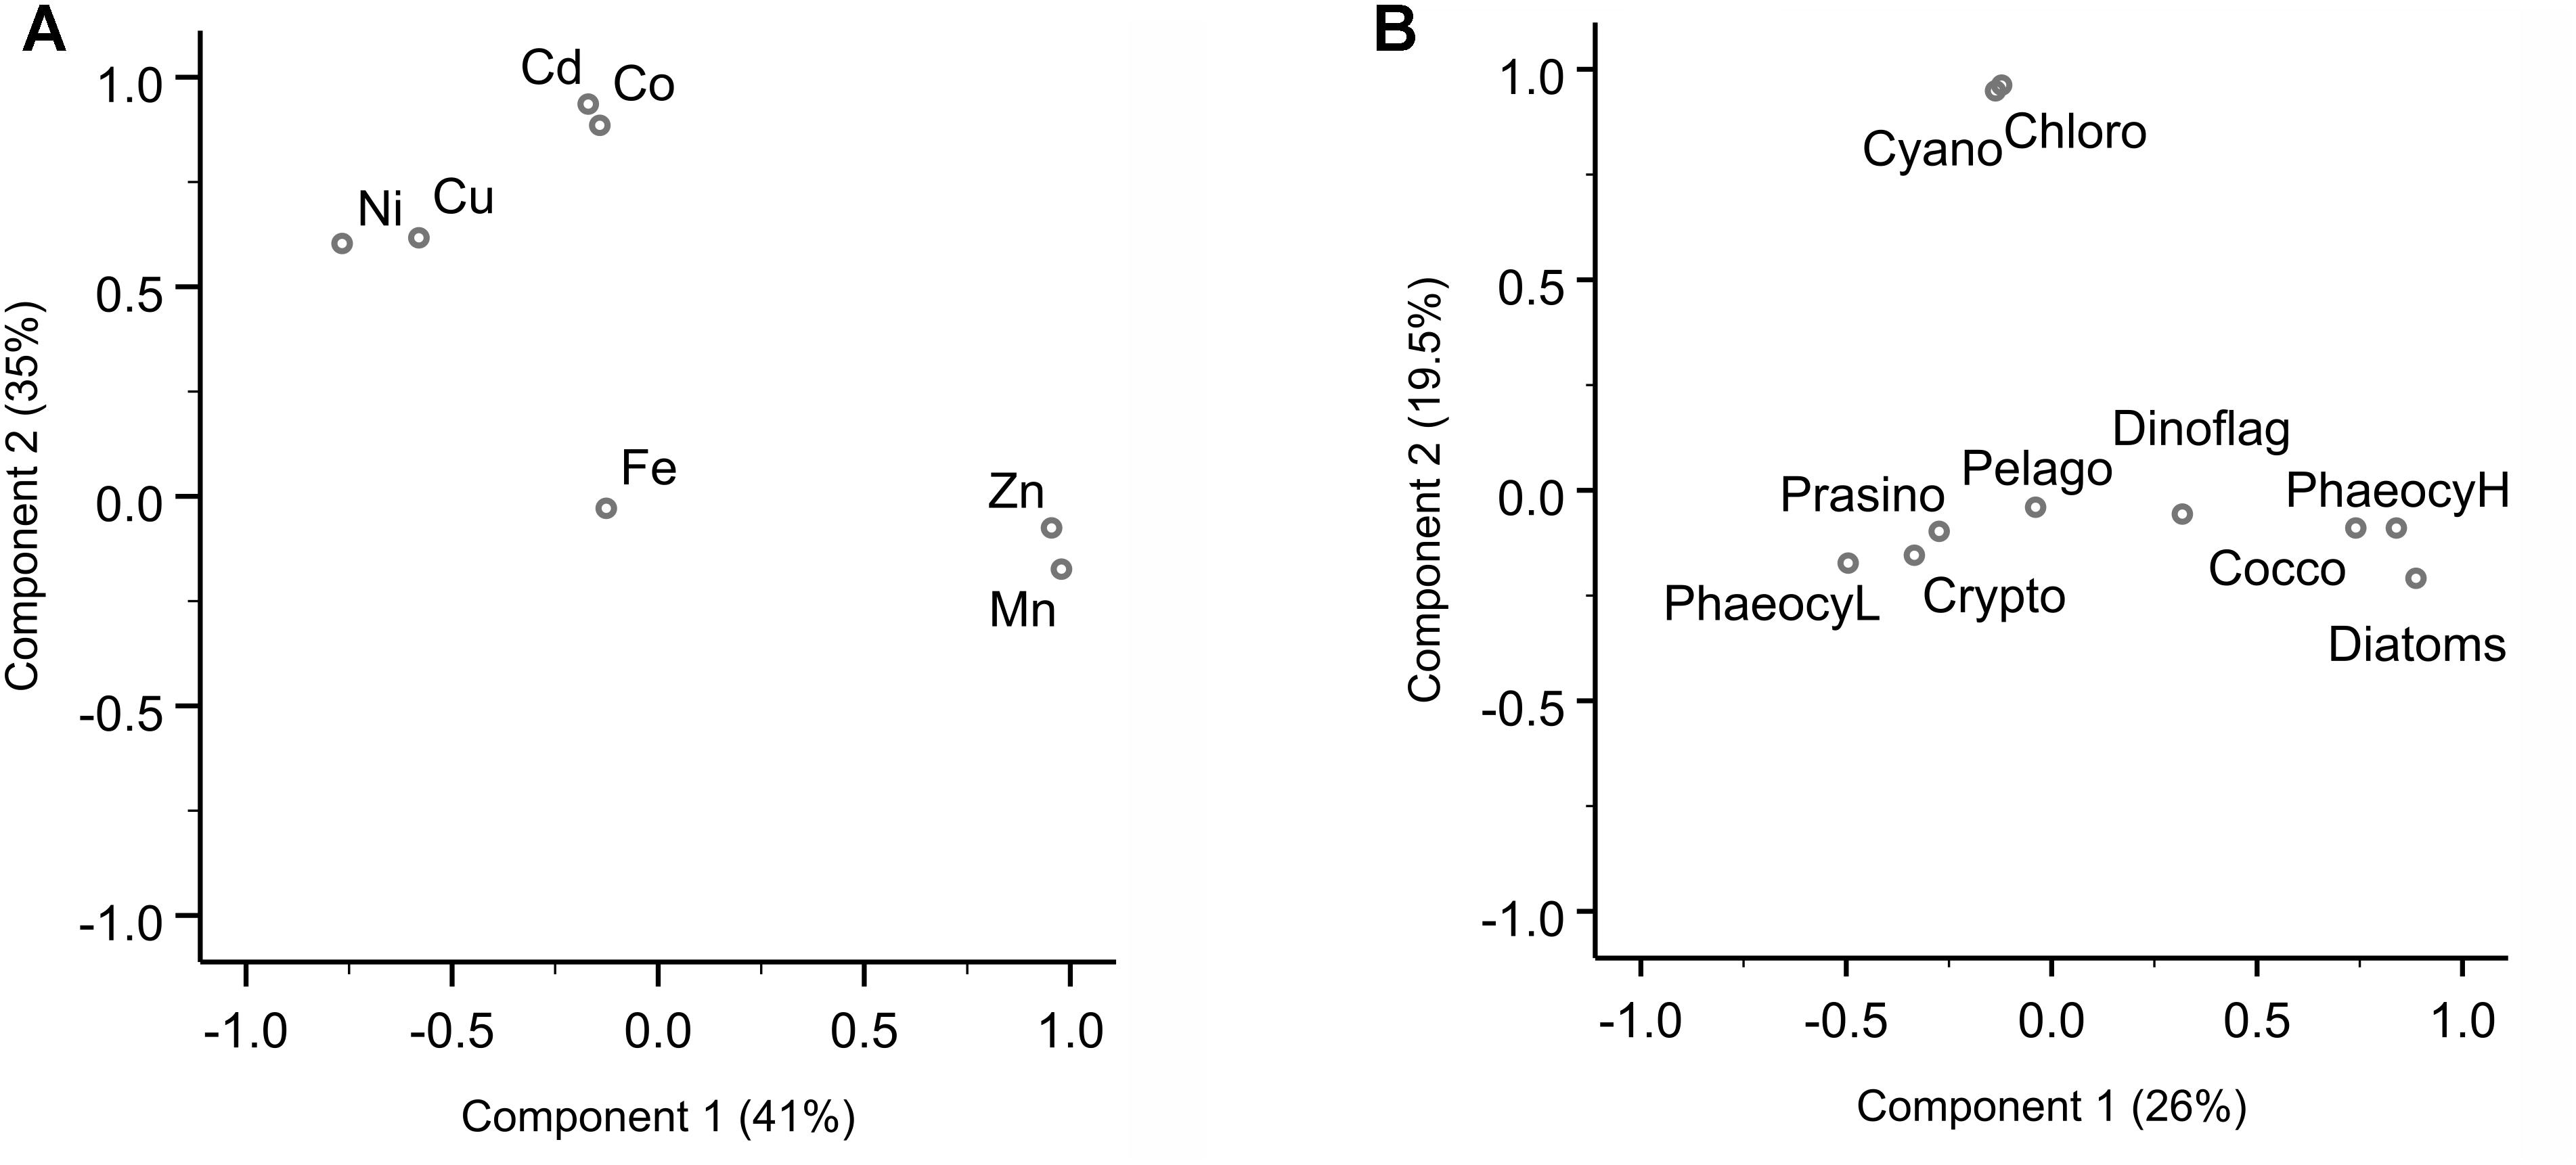
Figure 3. Principal component analysis (PCA) for dissolved trace metal and phytoplankton composition. (A) PCA loading plot of trace metal distribution, where component 1 explains 41% and component 2 35% of the variance. A third component (not shown here) accounts for 22% of the variance (Supplementary Table S3). (B) PCA loading plot of phytoplankton groups, where component 1 explains 26% and component 2 19.5% of the variance. The PCA were carried out in SPSS. Varimax rotated principal components are plotted.
Surface Cu and Ni mainly followed a similar trend as nitrate along the transect (Figure 4A), with southward increasing concentrations from 0.5 and 2.4 nM in the STZ to 1.8 and 6.0 nM in the WG for Cu and Ni, respectively (Table 1). These southward increasing surface concentrations of Cu and Ni were significantly correlated with changes in nitrate (R = 0.85 and 0.86, respectively, P < 0.05). Surface Cu concentration was furthermore significantly correlated with surface silicic acid concentrations (0.84, P < 0.05). The depth profiles of both, Cu and Ni showed nutrient-type characteristics (i.e., significantly, positively correlated to phosphate) at all stations, except at station 68°S (Table 2) pointing to nutrient-like biological uptake in the ice-free surface waters.
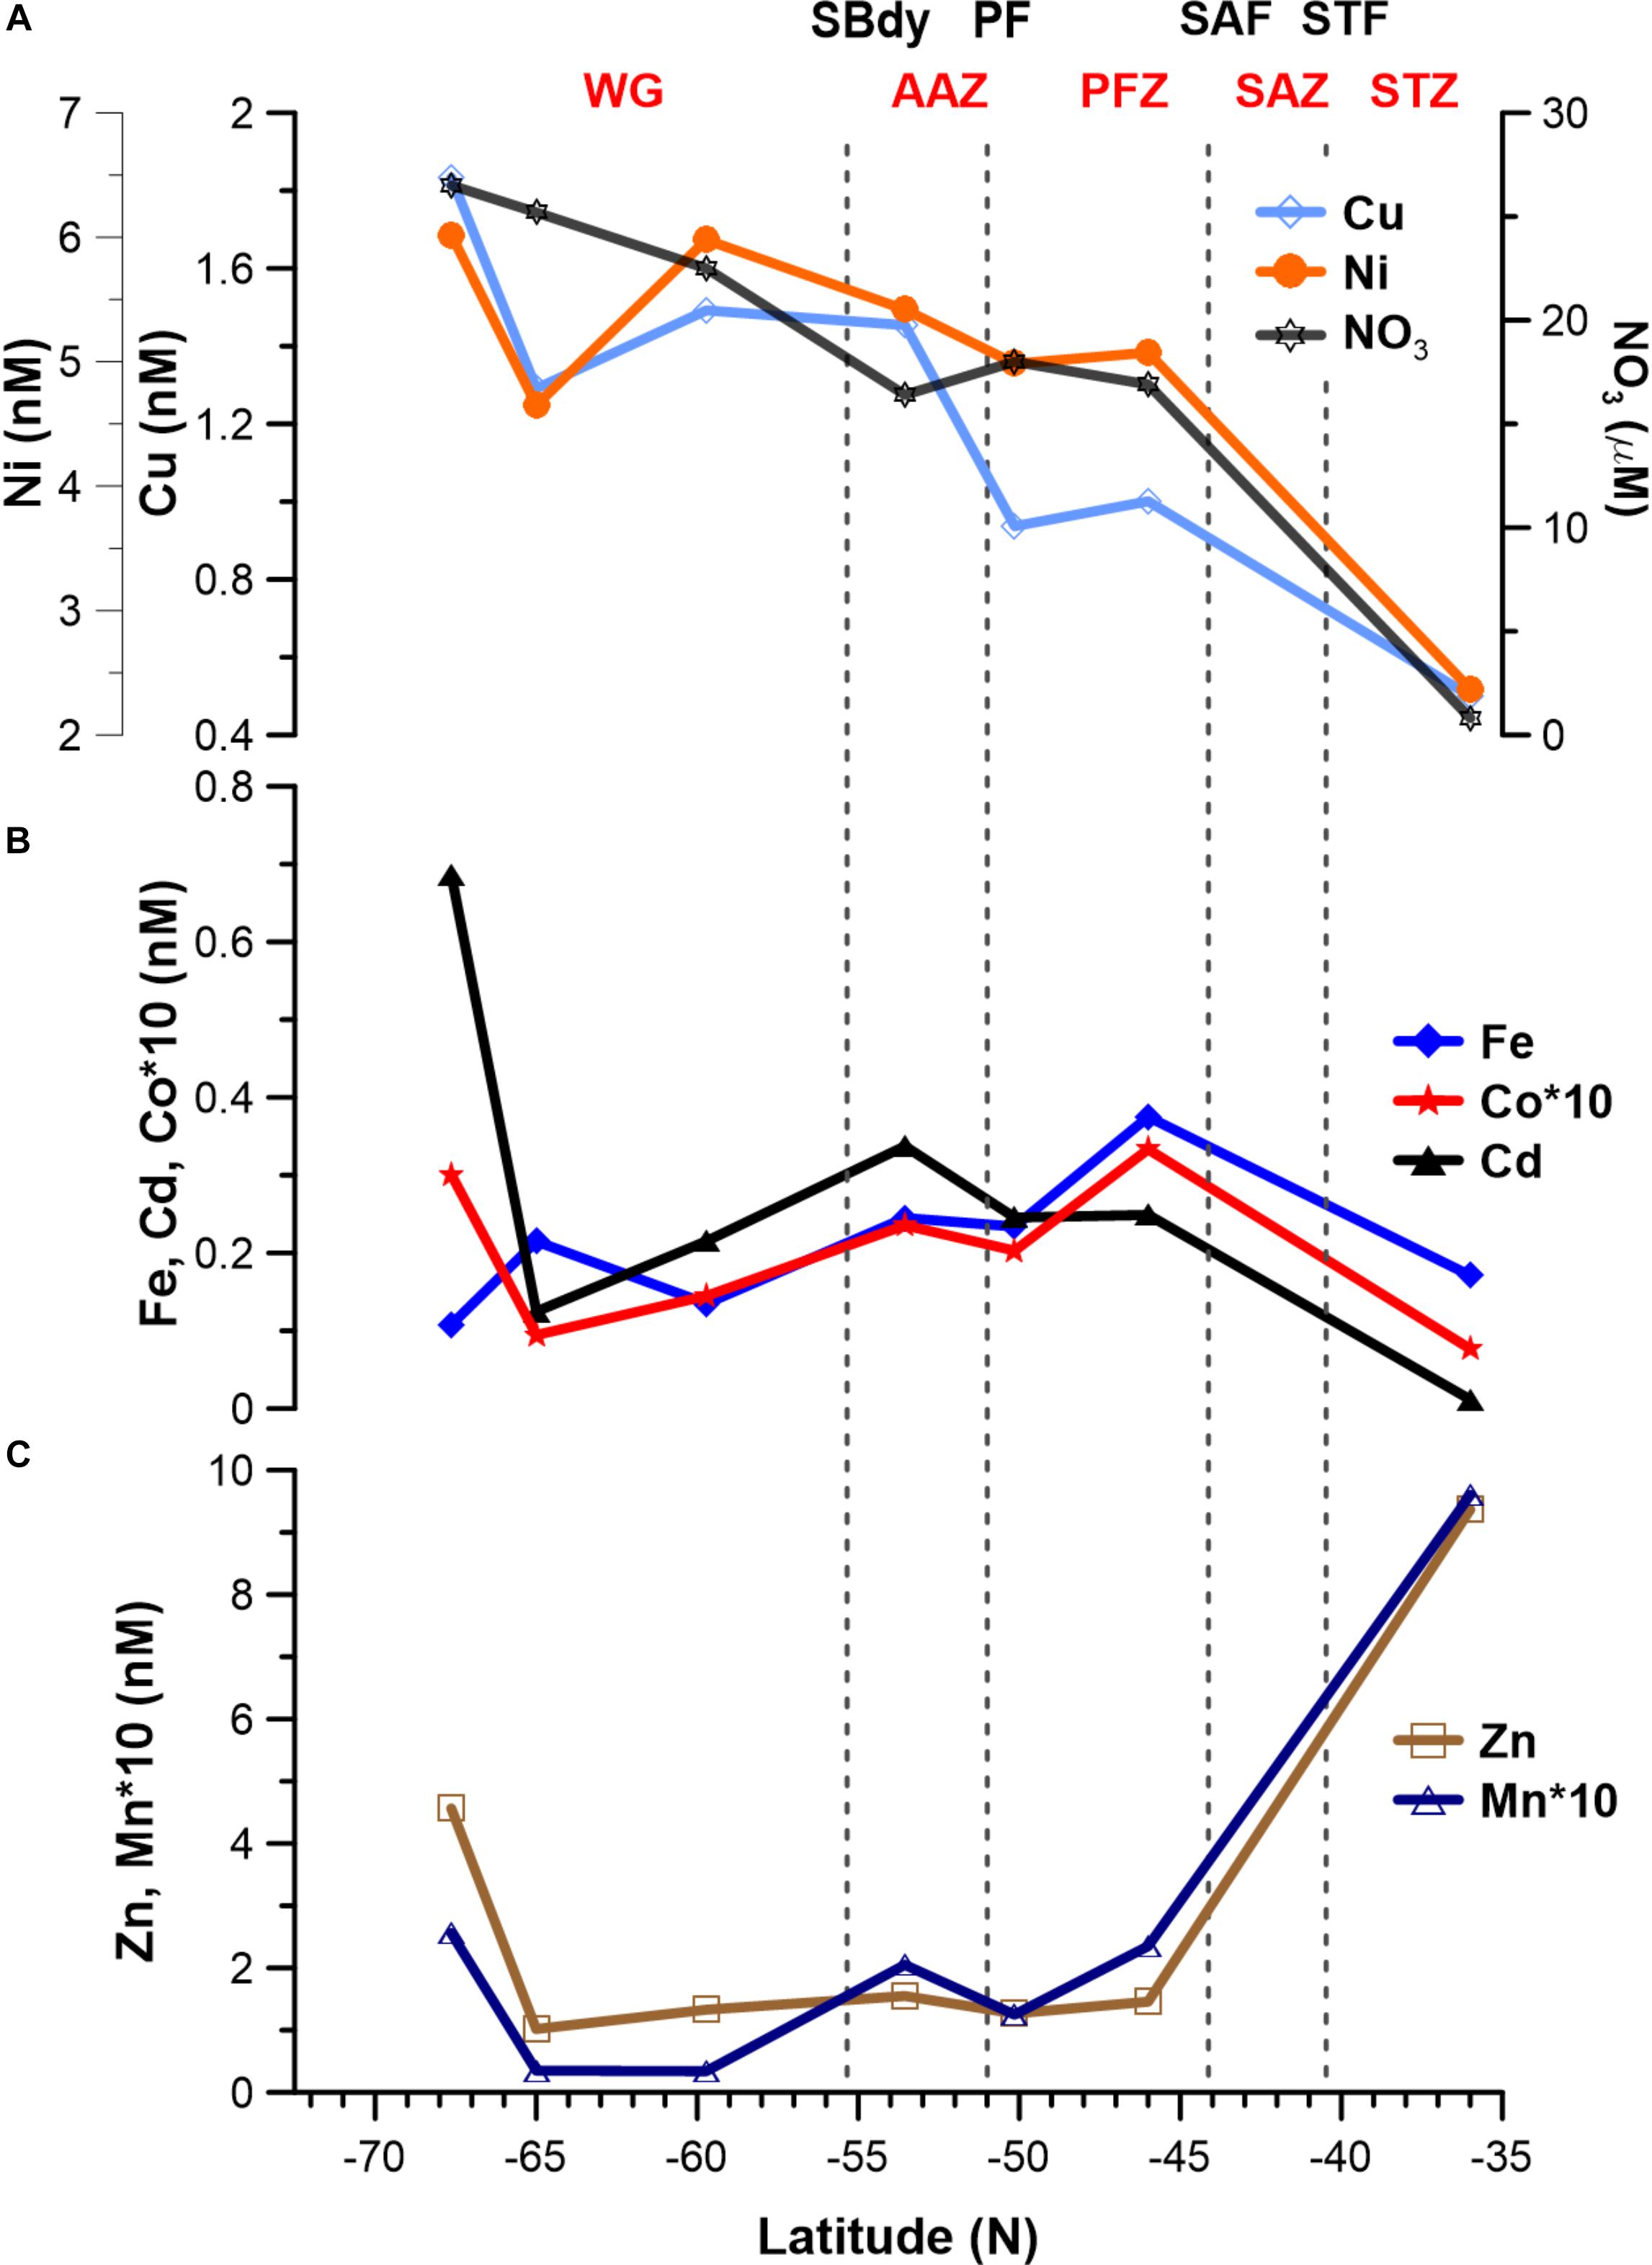
Figure 4. Surface dissolved trace metal distribution for seven stations along the cruise transect (Figure 1). (A) Cu (∗10) and Ni; note that nitrate concentrations are shown in (A) to illustrate the similar trends of some trace metals. (B) Fe, Co (∗10) and Cd. (C) Zn and Mn (∗10).
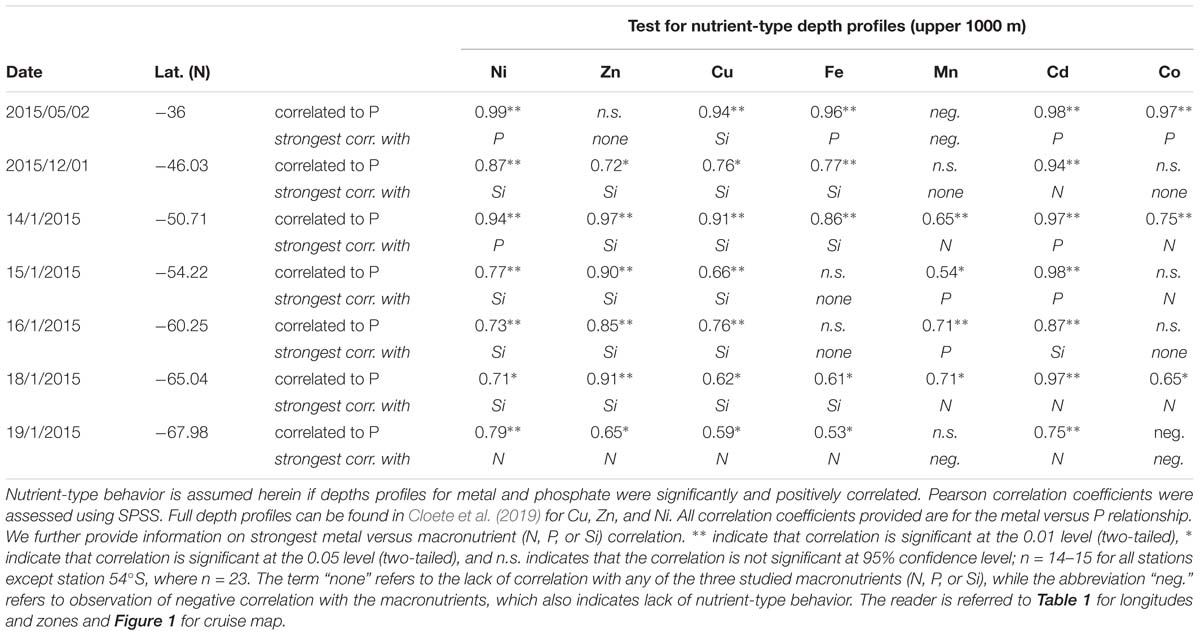
Table 2. Assessment of nutrient-type behavior considering depth profiles over the upper 1000 m of the water column.
Zinc and Mn showed maximum surface concentrations at 36°S (9.4 and 0.96 nM, respectively; Table 1), which strongly decreased southwards across the PFZ and most of the WG (except for a slight increase within the AAZ at 54°S), while increasing again close to the ice shelf at 68°S (Figure 4C). In contrast to Cu and Ni, the Zn and Mn surface distributions were not correlated with macronutrient surface distributions. Depth profiles also lacked significant correlation for Mn with phosphate at several stations south of the Polar Front (i.e., at 54, 65, and 68°S; Table 2). In contrast to Mn, we found nutrient-type depth profiles for Zn at all stations except at 36°S (Table 2).
Cadmium and Co were strongly (positively) related to a second component that explained around 35% of the total variance along the surface water transect (Figure 3A). Cobalt and Cd, both had concentrations that increased from the STZ (0.008 and 0.01 nM, respectively; Table 1) to the PF (maximum of 0.033 nM for Co), but decreased south of the PF (Figure 4B). Closest to the ice shelf a strong increase in Cd and weak increase in Co was found (Figure 4B). Iron distribution in the surface waters was related to a third principal component (Supplementary Table S3A). Throughout the STZ, SAZ, PFZ and into the WG, Fe concentrations in the surface waters changed similarly to those of Cd and Co. However, Fe decreased approaching the ice edge, where all other bioactive metals, including Cd and Co, increased (Figure 4B). The Cd, Co, and Fe surface profiles were not correlated to those of any of the macronutrients. Despite this lack of surface correlation, Cd showed nutrient-type depth profiles at all our stations and Co and Fe showed nutrient-type depth profiles at most stations, but notably not at 54 and 60°S (Table 2).
Phytoplankton Community
Chlorophyll-A and Phaeopigments
Total chla concentrations in the surface waters generally increased from north to south, ranging from 0.03 to 0.57 μg L−1 (Figure 2D and Supplementary Table S5). The highest chla concentrations were seen close to the ice edge. Surface water chla was weakly correlated with macronutrients nitrate, phosphate and silicic acid concentrations (R ≤ 0.44; Table 3A). Total surface chla was furthermore weakly correlated to trace nutrients Cu and Zn (R = 0.6; Table 3B). No significant correlation was found between the surface chla concentrations and the mixed layer depth (not shown). The general lack of strong correlations points toward a complex combination of factors affecting community composition. Phaeopigments, used to infer cell degradation due to grazing (Jeffrey et al., 1997; Wright et al., 2010; Carreto et al., 2016), were not detected in the STZ, SAZ and PFZ, indicating low grazing pressure and cell degradation (Supplementary Figure S4). However, phaeophorbide-a and phaeophytin-a both occurred south of the Polar Front with maximum concentrations of 0.03 and 0.008 μg L−1 (Supplementary Table S8), respectively (Supplementary Figure S4). Maximum phaeopigment:chla ratio (0.2 μg:μg) was observed at 65°S (Supplementary Figure S4 and Supplementary Table S8).
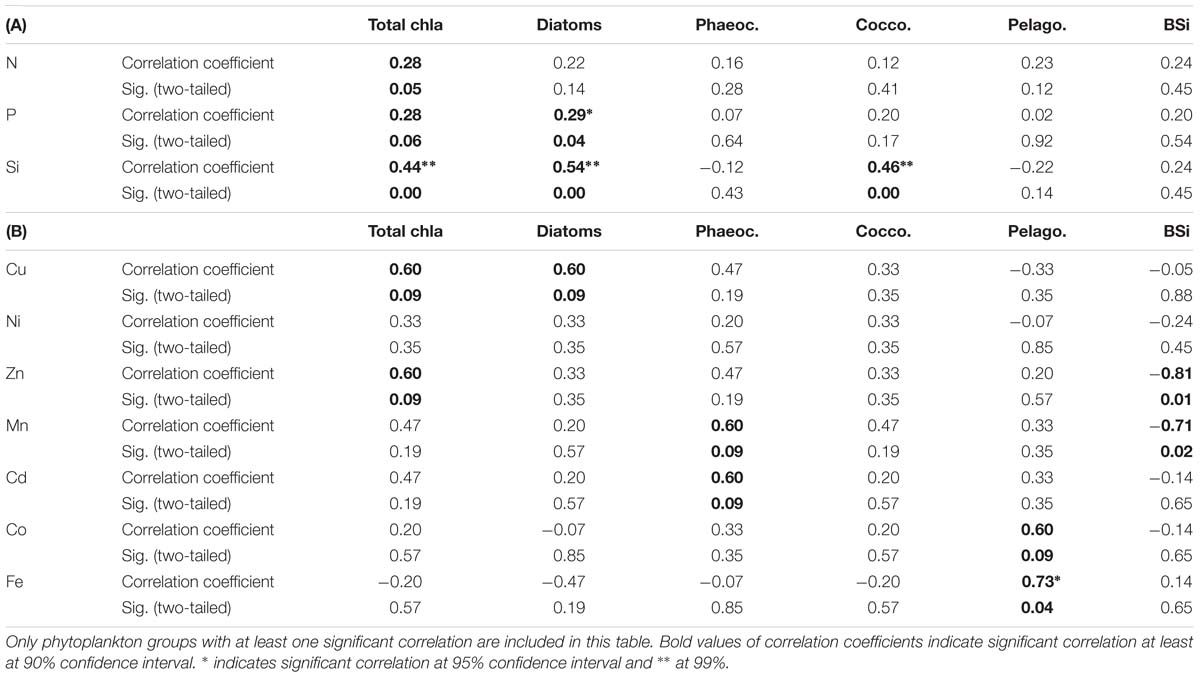
Table 3. Kendall-Tau correlation between selected phytoplankton group chla concentrations as well as biogenic silica concentrations (BSi) with (A) macronutrients, where sample size was n = 24 and (B) dissolved trace nutrients, where sample size was n = 7.
Community Composition
We determined the phytoplankton community composition as chemotaxonomic composition, i.e., groups’ contribution to total chla, using CHEMTAX. The community composition shifted in the surface waters along the north-south transect. For example, the contribution of diatoms to total chla generally increased from north to south from ∼30 to 90% (Supplementary Figure S3), with diatom-derived chla concentrations ranging from ca. 0.01 to 0.3 μg L−1 (Figure 2D). A PCA conducted for the group specific contribution to total chla indicated that two principal components explain 46% of the total variance in the phytoplankton distribution (Figure 3B and Supplementary Table S3). The first component correlated with diatom contribution (Supplementary Table S3). Furthermore, Kendall-Tau tests indicated that diatom-derived chla concentrations along the transect were significantly correlated with silicic acid, phosphate and Cu concentrations (Table 3), and hence these macro- and micro-nutrients might be important drivers for diatom contribution in the Southern Ocean surface waters. In contrast, the diatom-derived chla concentrations were not related to Zn and Cd, even though these represent known primary metals for diatoms. Furthermore, no significant correlation was found between the surface diatom (or any other phytoplankton group investigated here) chla concentrations and the depth of the mixed layer (not shown).
Similar to the diatom-derived surface chla concentrations, the surface BSi concentrations increased throughout the STZ, SAZ, and PFZ from 0.35 μM at 36°S to 4.6 μM at 51°S and remained similarly high until 60°S (Table 4). The BSi concentration in the surface waters was significantly, negatively correlated with micronutrients Zn and Mn (R = −0.81 and −0.71, respectively, Table 3), not with any of the macronutrients, including silicic acid. A very prominent peak in BSi of 13.8 μM was observed at 65°S, while noticeably lower BSi concentrations (<0.76 μM) were encountered within proximity of the ice (south of 65°S; Table 4). The BSi:diatom-chla ratio ranged between ∼13 and ∼70 μmol:μg throughout the STZ, SAZ, PFZ and AAZ, with the exception of a very high ratio at 51°S (∼170 μmol:μg; Table 4). Much lower BSi:diatom-chla ratios were found close to the ice edge (∼1–2 μmol:μg; Table 4), where all micronutrients except Fe were relatively abundant. We used SEM imaging at selected stations to improve the understanding of the community composition. The SEM micrographs from station 54°S, for example, indicated diatoms were ca. 7–55 μm in diameter and comprised of predominantly Chaetoceros spp., Thalassiosira spp., and Fragilariopsis spp. (Supplementary Figure S5).
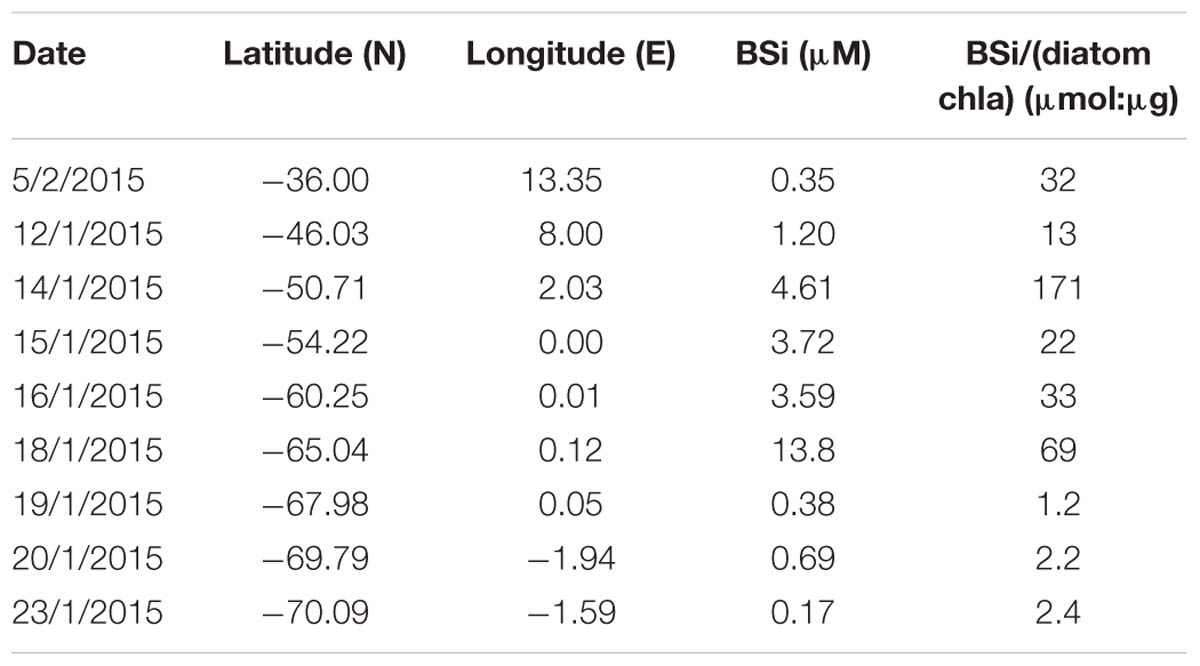
Table 4. Biogenic silica (BSi) and ratio of BSi versus diatom-chla concentration (see Supplementary Table S7 for diatom-chla concentration values) determined at eight stations across the Atlantic sector of the Southern Ocean (see Figure 1 for cruise map).
A second important chemotaxonomic group was represented by haptophytes of the pigment type 6, hereafter coccolithophores (cf. Supplementary Information). Coccolith platelets was been observed using SEM imaging at station 54°S, for example (Supplementary Figure S5A), most likely belonging to the species Emiliania huxleyi, and confirming the unusual presence of coccolithophores south of the PF. Gibberd et al. (2013) previously (2008/2009) reported a lack of contribution of this haptophyte group to total chla in summer in the WG. They observed this remarkable absence in similar macronutrient but lower surface temperature conditions though, compared to our sampling in 2014/2015. Coccolithophores strongly rely on temperature for carbonate shell growth, and our observed temperatures in the WG still fell on the low end of the temperature range reported for coccolithophores (2–15.7°C; Findlay and Giraudeau, 2000), potentially explaining the pigment-based finding of coccolithophore presence down to the WG. Coccolithophore chla concentrations were correlated to the first principal component along with diatoms (Figure 3 and Supplementary Table S3B). Coccolithophore chla ranged between 0.0004 and 0.04 μg L−1 showing a general increase from north to south. However, coccolithophore chla also showed a sudden increase to ∼0.20 μg L−1 at 68°S within the WG (Figure 2D and Supplementary Figures S3, S6A,B). The CHEMTAX software might slightly overestimate the contribution of coccolithophores to chla at the expense of other haptophyte pigment group estimates (e.g., of haptophyte-8), due to the similarity in pigment signatures and the possibility that pigment ratios within groups may have changed over the transect. Such shifts of pigment ratios within groups could not be accounted for in our single bin calculation (cf. Supplementary Information). Nonetheless, the occurrence of coccolithophores is likely, as especially Emiliania huxleyi has been observed in cold waters south of 60°S in the Southern Ocean previously (Cubillos et al., 2007; Smith et al., 2017). This sudden coccolithophore-derived chla peak coincided with the maximum total chla (Figure 2D) as well as above mentioned micronutrients peaks (Figure 4) and relatively rapid changes in salinity (Supplementary Figure S1). In general, however, we did not find any correlation between coccolithophore contribution to total chla and any of the micronutrients at sea surface along the transect (Table 3B). We therefore attribute the sudden changes observed at 68°S to the influence of the receding ice, even though we cannot exclude cross-frontal eddy intrusion lifting nutrient-rich waters closer to the surface and/or providing vertical stability in the euphotic zone (Kahru et al., 2007).
The haptophytes pigment type 8, hereafter Phaeocystis (P. antarctica, cf. Supplementary Information) represented a third important chemotaxonomic group in the southern Atlantic Ocean. The contribution of the Phaeocystis to total chla increased from 36°S to a maximum of 63% at 42°S, but decreased southwards thereafter (Figure 2D and Supplementary Figures S3, S6C). The Phaeocystis chla along the surface transect was not correlated to any macronutrient and only showed a weak correlation with micronutrients Mn and Cd (Table 3B). Phaeocystis antarctica can be differentiated into two acclimation states based on their characteristic pigmentation patterns (i.e., composition of light-harvesting pigments) regulated according to the availability of Fe (details are given in Supplementary Information and in DiTullio et al., 2007 and Wright et al., 2010). Along our surface transect, the two forms showed generally contrasting trends (Figure 2D and Supplementary Figure S6D): the contribution to total chla of P. antarctica with the characteristic pigmentation pattern of Fe replete conditions (Phaeocystis-H) was low in the STZ and SAZ, but increased southwards, while the contribution to total chla of P. antarctica with the characteristic pigmentation pattern of Fe depleted conditions (Phaeocystis-L) was relatively high throughout the STZ, SAZ and PFZ, and decreased south of the Polar Front (Figure 2D and Supplementary Figure S3). As a consequence, the chla concentration derived from Phaeocystis-H correlated with principal component one, similarly to diatom chla (Figure 3), while chla concentration from Phaeocystis-L correlated with a separate principal component, distinct to all other groups investigated in this study (Supplementary Table S3B). Notably, neither form was correlated to Fe concentration along our surface transect nor to any other macro- nor micro-nutrient investigated (not shown) except Phaeocystis-L being negatively correlated to Cu (R = −0.78; P < 0.05).
Other phytoplankton groups showed only minor contributions to total chla (<20%) and few general north-south trends. Cyanobacteria and chlorophytes contribution to total chla correlated with a second principal component (Figure 3B), but neither was correlated to macro- or micro-nutrient concentrations (not shown). Cyanobacteria, for example, dominated the phytoplankton community with a contribution of ∼36% in the STZ at 36°S, but contributed < 2% south of the SAZ (Figure 2D). All other groups correlated best with a third principal component (Supplementary Table S3B) and their occurrence did not show trends across the surface water masses. For instance, sudden peaks in contribution to total chla by dinoflagellates (19%) and cryptophytes (17%) were observed at 54 and 53°S, respectively, while prasinophytes showed a prominent peak close to the Antarctic ice at 70°S (Figure 2D and Supplementary Figure S3). Interestingly, a correlation between pelagophyte chla concentration and Fe was found as well as a weak correlation with Co (Table 3B).
Seasonal Variability
Several sample sites were revisited on different legs of the SANAE54 expedition, allowing for an evaluation of seasonal progression. The community structure at 44°S for example, was very similar between December and January (Figure 2D and Supplementary Figure S3). At 49°S, the December community contained important contributions of picophytoplankton, such as flagellate eukaryotes and cyanobacteria, not seen in February at this station. Three samples were furthermore taken in close proximity of 70°S in December and January. One sample was collected at 70°S on 16 December, one at 69.7°S on 20 January, and a third at 70.1°S on 23 January. The December community showed a chla concentration of 0.26 μg L−1 in the range of the two January communities (0.38 and 0.11 μg L−1). Diatoms dominated all three communities with around 63–64% contribution to total chla, while contributions of coccolithophores (16%) and Phaeocystis-L (20%) were higher in December compared to the January communities.
Discussion
Routinely studied environmental variables, such as macronutrients and temperature are well-documented to influence the phytoplankton community structure. Indeed, our findings indicate that certain shifts in community structure were explained by major shifts in sea surface temperature or macronutrients. For example, cyanobacteria were, as expected, constrained to the warmer waters of the STZ. Furthermore, Phaeocystis dominance observed north of the Polar Front, and diatom dominance observed south of the Polar Front, were both associated with the availability of silicic acid. Other observed shifts in community structure, especially those within the major oceanic zones were less straightforward. We therefore additionally probed the relation between the phytoplankton and the essential, but less-well explored micronutrients, such as Zn, Mn, Fe, Cu, Cd, and Co. We could not identify single micronutrients, such as Fe, driving the phytoplankton and biogeochemical compositions across all surface water masses along the Good Hope Line transect. In the absence of such a single, predominant factor, we address here variable and potentially interacting drivers within and across the major oceanic zones.
Subtropical Zone
The STZ was characterized by low chla concentrations, especially at the northernmost station (36°S). At 36°S, this low chla community was dominated by cyanobacteria and diatoms, both contributing ∼36%, with lesser contributions from coccolithophores and Phaeocystis. Similar high contribution of cyanobacteria in the STZ, consisting of Synechococcus and Prochlorococcus, was observed previously (Gibberd et al., 2013). The contribution of cyanobacteria to total chla dropped to less than 2% at 39°S accompanied by a diversified community with important contributions by prasinophytes, dinoflagellates, diatoms, and haptophytes. Such a diverse community dominated by smaller phytoplankton groups in the STZ might be due to the warm waters (Schlüter et al., 2011; Mendes et al., 2015; van Leeuwe et al., 2015) and/or the low nitrate and phosphate concentrations (Hudson and Morel, 1990; van Leeuwe et al., 2015). The observed low Fe concentrations may have limited most phytoplankton, being an obligate requirement for all phytoplankton groups, but further constraints seemed to have resulted from macronutrient and trace nutrient compositon at this station. For example, persisting low silicic acid concentrations throughout the STZ may further drive lower diatom contributions allowing higher contributions of other phytoplankton groups. However, at 36°S the high Si/N and low N/P ratios points to insufficient utilization of silicic acid and phosphate, and the large contribution of cyanobacteria at 36°S might be due to N2 fixating groups or other, flexible utilization of nitrogen sources, promoted in such low nitrate environments (e.g., Moore et al., 2002).
Some micronutrients, such as Zn and Mn occurred in high concentrations at 36°S compared to those observed further south and were possibly not (co-)limiting factors. Zinc and Mn showed an apparent lack of surface depletion and, consequently, lack nutrient-type depth profiles at 36°S. This may be at least partially explained by the large contribution of cyanobacteria at this station, as, for instance, Synechococcus and Prochlorococcus demonstrate no measurable cellular requirement for Zn (Sunda and Huntsman, 1995a). Nonetheless, it is likely that is was not only due to the lack of biological uptake, but due to external influx or recharge, such as an eddy flux from the Agulhas current (e.g., Zn; Penven et al., 2001) and/or in situ photochemical reduction at surface (e.g., Mn; Boye et al., 2012; Wu et al., 2014). Such external influx or recharge systems, rather than phytoplankton control, may explain the unusual metal abundance ranking of Zn > Ni > Mn > Cu > Fe > Cd > Co observed in the surface seawater at 36°S (Supplementary Table S4).
Copper, may also not have reached (co-)limiting concentrations at 36°S as the uptake ratio, defined as the slope of correlation between Cu and phosphate, was low (0.28 nmol/μmol; Table 5) relative to the uptake ratios observed further south. Nonetheless, the depletion of Cu in the STZ may somewhat be attributed to Cu-utilizing groups, such as diatoms, for the key metabolic mechanism of photosynthetic electron transport in the Cu containing enzyme plastocyanin (Bruland, 1980; Sunda, 1989). Similarly, the depletion of Cd to levels below 0.01 nM may be attributed to biological uptake, specifically to Cd’s role in the functioning of the carbonic anhydrase (Price and Morel, 1990; Lane and Morel, 2000).
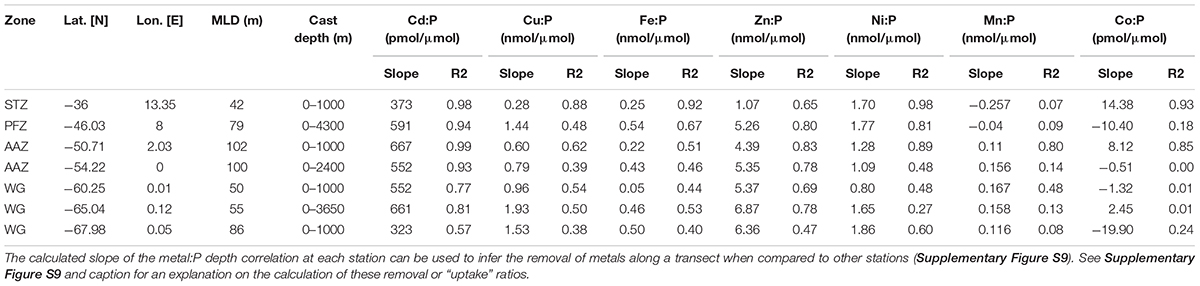
Table 5. Metal:PO4 removal ratios from the calculated slope and their respective coefficient of determination for the entire depth profile at all trace metal stations.
Nickel concentrations were relatively low at 36°S compared to stations further south (Table 1) and may have reached (co-)limiting concentrations at this station. The uptake of Ni was relatively high at 36°S (1.7 nmol/μmol; Table 5). Nickel is required for active hydrogen uptake in some nitrogen-fixing cyanobacteria (Daday et al., 1985; Dupont et al., 2008). Synechococcus have been observed at station 36°S previously (Gibberd et al., 2013), and there is thus a possibility that some of the cyanobacteria at this low nitrate station 36°S could be nitrogen-fixing. Such cyanobacteria-specific uptake, as opposed to diatom-related uptake, could then explain the fact that Ni depth profiles are dissimilar to silicic acid preferential uptake or remineralization and rather a stronger correlation to phosphate (Table 2). Further support for cyanobacterial influence on trace metals is provided by recorded markedly low concentrations of Co relative to the remainder of the transect. Cobalt, the least abundant metal at 36°S, is an obligate requirement for cyanobacteria, and cannot be substituted by Zn (Sunda and Huntsman, 1995a; Saito and Moffett, 2002; Saito et al., 2002). Further, the coccolithophore Emiliania huxleyi is thought to have a Co requirement that can be somewhat substituted by Zn, whereas the diatoms Thalassiosira pseudonana and Thalassiosira oceanica have a Zn requirement that can be met by Co (Sunda and Huntsman, 1995a; Saito and Goepfert, 2008). Thus Co is a metabolic requirement of all three major phytoplankton groups and this may explain the observed strong surface depletion and nutrient-like behavior of Co at 36°S.
It appears thus that, in the northern STZ (at around 36°S), silicic acid (low diatom contribution) and nitrate (promoting N2-fixing groups), along with micronutrients Fe (constraining total abundance) and Co (possibly constraining cyanobacteria) may be important in shaping the phytoplankton abundance and community composition. Most of these constraints seemed to be alleviated in the southern section of the STZ, at 39°S, where we observed higher N:P ratios concurrent with a shift in the community structure, i.e., a drop in cyanobacteria contribution and increase in Phaeocystis (especially Phaeocystis-L) and diatoms, thus a community more similar to the waters of the SAZ.
North of the Polar Front
The SAZ community, determined in February at 42°S, was characterized by low chla concentration, similar to the STZ, but dominated by Phaeocystis with lower abundance of diatoms. Low Si/N ratios (<1 mol/mol) may have inhibited diatom growth (Brzezinski, 1985), hence lessening diatom competition for other nutrients and allowing other groups such as Phaeocystis to dominate the community. Phaeocystis-dominated waters in February have been reported in the Atlantic SAZ previously by Gibberd et al. (2013) albeit at ∼10 fold higher total chla concentrations (∼0.45 μg L−1 compared to our February total chla of ∼0.05 μg L−1) and ∼2.5 fold higher nitrate and phosphate concentrations. This suggests that lower chla concentrations reported here may be linked to a more depleted February nitrate and phosphate pool. Substantial nitrate removal (e.g., ∼51% at 42°S) was evident from December to February.
The majority of communities encountered in the PFZ were also comprised of mainly Phaeocystis and lower contribution of diatoms. High nitrate concentrations (∼30 μM), noticeably higher than annual World Ocean Atlas averages (∼19 μM) reported for this region (Garcia et al., 2013), and high N/P molar ratios (35:1) were observed in December in the PFZ. On the same cruise, Viljoen et al. (2018) established that the residing community in the mixed layer of the PFZ was predominantly affected by light limitation with iron as co-limiting factor. The low Si/N (0.3:1) and Si/P (3:1) ratios suggested that diatom productivity was likely also co-limited by silicic acid. The under-utilization of nitrate in the PFZ was therefore possibly caused by light, iron and silicic acid co-limitation. The nitrate was, however, largely removed between December and February (−68% at 44.5°S), possibly as a result of shifts in the community from diatom to a Phaeocystis dominance. Close to the PF, in contrast, possibly under the influence of higher silicic acid availability, the community showed contrasting seasonal shifts, from Phaeocystis dominance in December to diatom dominance in February.
Trace nutrient data were measured at 46°S (PFZ). Most trace metals showed increased surface concentrations compared to those observed in the STZ, except Zn and Mn. Surface Fe at 46°S was the highest encountered at all stations, but our accompanying data indicated Fe limitation. For instance, pigment composition indicated the dominance of the Phaeocystis form acclimated to low-iron availability (Phaeocystis-L) across the STZ, SAZ, and PFZ. Also, the Fe:P ratio (0.21 nmol/μmol) in the surface water was much lower than typical Southern Ocean diatom and autotrophic flagellate cellular quotas (ca. 1–2 nmol/μmol; Twining and Baines, 2013) or average global phytoplankton quotas (∼7.5 nmol/μmol; Moore et al., 2013), pointing to potential Fe limitation. Manganese likely co-limited phytoplankton growth with Fe at 46°S, since our observed Mn:P (0.13 nmol/μmol) at 46°S was much lower than published average phytoplankton cellular requirements (2.8 nmol/μmol; Moore et al., 2013).
All essential trace metals showed nutrient-like depth profiles at 46°S (PFZ) over the upper 100 m of the water column, i.e., bio-utilization at surface. Most showed, however, stronger depth profile correlations with silicic acid than with nitrate or phosphate. This points to simultaneous uptake of most metals and silicic acid, and therefore to a community largely dependent on silicic acid, such as the dominating diatoms. The vertical metal:P slope ratios of some metals (Table 5), such as Zn:P of 5.26 nmol/μmol at 46°S were, however, much lower than published Southern Ocean diatom cellular Zn/P quotas (∼15 nmol/μmol; Twining and Baines, 2013). The observed Zn concentration, for example, might thus have limited the diatom growth in the PFZ. In contrast, the molar Zn/P ratio at the surface of 0.8 was close to the general (group unspecific) cellular phytoplankton average of 0.8 nmol/μmol (Moore et al., 2013), and Zn was therefore possibly not limiting other phytoplankton groups. Cobalt only indicated weak surface depletion and a negative Co/P uptake ratio (slope), even though some of the prominent groups encountered at this station, such as diatoms and coccolithophores, utilize Co. The observed surface Co/P ratio of ∼0.02 nmol/μmol at 46°S, could be limiting at least the diatom community, considering a suggested average Southern Ocean diatom cellular Co:P quota of around 0.03 nmol/μmol (Tagliabue et al., 2018). However, the Co might have been replaced by Zn in all major contributing phytoplankton groups; diatoms (Price and Morel, 1990), Phaeocystis (Saito and Goepfert, 2008), and coccolithophores (Xu et al., 2007) and thus might not have resulted in co-limitation.
At 49 and 50°S, in the vicinity of the Polar Front, the communities were primarily Phaeocystis-dominated, with large contributions of diatoms, and small contributions from picoplankton. At both stations nitrate appeared to be under-utilized while low, possibly limiting, silicic acid concentrations prevailed. The deep mixed layer (∼100 m) might have further led to the Phaeocystis-dominated community, as Phaeocystis have been shown to dominate over diatoms in deeply mixed waters due to their photosynthetic properties that allow for efficient light usage under varying light conditions (Alderkamp et al., 2012a) and their ability to form colonies that are more resistant to turbulent water (Schoemann et al., 2005; Rousseau et al., 2007). In addition, near-limiting surface concentrations of essential trace metals such as Fe (∼0.2 nM), along with low Zn, Mn and Co, may have resulted in the low chla encountered at 50°S and the relatively low Fe:P uptake ratio (Table 5), as well as in the Phaeocystis dominance over diatoms, since autotrophic flagellates, such as Phaeocystis, typically have lower metal requirements than diatoms in the Southern Ocean (Twining and Baines, 2013).
South of the Polar Front, Including Bouvet Triple Junction and Ice Edge
In the AAZ, south of the Polar Front, the community was typically dominated by diatoms, but with notable contributions of haptophytes (both coccolithophores and Phaeocystis), dinoflagellates and prasinophytes. Relatively high surface concentrations of chla and all trace metals except Zn and Mn were found at 54°S compared to stations immediately north and south of this station along the transect, while macronutrients were slightly depleted (Figure 4). These surface features were accompanied by an increase in Zn concentrations in deep water (Supplementary Figure S7; Cloete et al., 2019) and increase in Mn and Fe concentrations in the sub-surface at 54°S. These sub-surface and deep water features were attributed to the Bouvet Triple Junction (52–56°S) known for periodic hydrothermal plume activity (Klunder et al., 2011; Middag et al., 2011; Boye et al., 2012; Cloete et al., 2019). The exceptionally high concentrations of known hydrothermal metals Mn (<0.67 nM; Supplementary Figure S7) and Fe (<0.94 nM) that this study measured at 350 m depth supports the possibility of hydrothermal activity (Klunder et al., 2011). A deep mixed layer (∼100 m) may have made this sub-surface trace nutrient pool available to the phytoplankton at surface prior to our sampling, and subsequent phytoplankton uptake possibly lead to the observed depletion in the surface layer (sampled at ca. 15–16 m). Degradation pigments, absent north of the Polar Front, were detected here at the time of our trace metal sampling (January), which points to a more mature community, indicating that we sampled post-blooming conditions. The lower chla observed in December and February compared to the January conditions also supports the concept of a short-lived phytoplankton bloom in January caused by a periodic trace metal influx. In summary, we suspect that a trace metal influx prior to our trace metal sampling in January as a result of a deep mixing event, possibly adding hydrothermally sourced dissolved trace metals, may have caused an early stage local bloom, and that our occupation of this station in January reflected waning bloom conditions.
The community structure south of the SBdy, in the WG, was characterized by some of the highest chla concentrations along the transect, but lowest community diversity. Diatoms typically dominated these waters with notable contributions of haptophytes. High silicic acid concentrations as well as a shoaling of the mixed layer encountered in the WG, likely favored diatom productivity at the expense of the community diversity (Arrigo, 1999; Sedwick et al., 2007). The diatom dominance is also supported by Cu concentrations that increased toward the south, which may be attributed to the upwelling of the relatively Cu enriched deep waters further south (Cloete et al., 2019). Further, the stronger correlation between Cu and silicic acid compared to Cu and nitrate or phosphate at all stations except at 68°S (Table 2), points to preferential uptake or remineralization of Cu by the silicified phytoplankton in the ice-free surface waters. At 60 and 65°S, for example, a low salinity feature and a temperature inversion were observed, accompanied by a shoaling of the mixed layer to 50 m, most likely a result of low density waters from ice melt producing stratified waters in this region (Wright et al., 2010). Ice melt began approximately a week prior to our sampling at 65°S (Supplementary Figure S8; Viljoen et al., 2018). Water column stratification caused by melt waters could have acted as a hydrographic barrier and may have limited vertical resupply of nutrients and led to the dominance of diatoms (Schlüter et al., 2011; Tagliabue et al., 2014; Mendes et al., 2015). At 65°S, Si/N and N/P ratios indicate waters dominated by diatoms (Arrigo, 1999; Smith and Asper, 2001), and chla and BSi concentrations, as well as metal:P ratios all suggested that we encountered diatom bloom conditions. The dominance of diatoms at this station is in good agreement with Cloete et al. (2019) who showed that diatoms are the cause for a sharp increase found of most metal:P slope ratios (Fe, Zn, Cu, and Ni; Table 5) due to high metal:P requirements (Twining and Baines, 2013). In addition, the highest phaeopigment:chla ratios were recorded here, indicative of post-bloom communities and grazing, at the time of sampling at this station (January).
The presence of Phaeocystis can be used to obtain further information on metal limitation. Phaeocystis was dominant in its state acclimated to high iron conditions (Phaeocystis-H) throughout most of the WG. This presence of Phaeocystis-H may be a result of acclimation to earlier high Fe surface concentrations released from the above-mentioned ice melt prior to our sampling at 65°S. At the time of sampling, low and possibly limiting Fe concentrations and surface Fe/P ratios indicated an Fe-limited community. Further incubation experiments conducted in this region support an Fe-limited community (Viljoen et al., 2018). In addition, the strong Mn and Cd depletions may be related to the importance of Mn and Cd in Fe deficient waters as Fe-deficient conditions increase the Mn and Cd uptake (Peers and Price, 2004; Middag et al., 2018). Hence, we suspect that the ice melt released Fe and possibly other trace metals. The Fe, a ubiquitous requirement, was utilized fastest by all phytoplankton groups, and became depleted in the waning conditions. The depletion of Fe led to unusual utilization of other metals such as Mn, causing particular surface profiles.
Similar pattern could be observed south of 68°S, close to the ice edge. Here, environmental and chemical conditions were notably different to other stations in the WG, accompanied by a greater community variability. For example, at station 68°S visited in January, the highest chla, and some of the highest surface trace metal concentrations were encountered, with the marked exception of strongly depleted Fe. In addition, diatoms only contributed around 55% to total chla, accompanied with the highest coccolithophore contribution (34% to total chla) at 68°S in January, despite the abundant silicic acid and high Si/N ratios. Coccolithophores, such as Emiliania huxleyi, have a lower cellular requirement for Fe than diatoms (Brand, 1991; Sunda and Huntsman, 1995b; Muggli and Harrison, 1996), which allows them to grow in regions where diatoms are limited by Fe (Brand, 1991; Muggli and Harrison, 1997). Concurrently, coccolithophores have a higher quota for Co and Cd than diatoms (Ho et al., 2003). Therefore, large coccolithophore contribution in the surface water at 68°S may have been related to Fe approaching limiting concentrations, inhibiting diatom growth, as well the abundance of Co and Cd, essential in coccolithophore metabolic functions. The presence of the high iron acclimated-form of Phaeocystis (Phaeocystis-H) indicated that there was possibly again (similar to conditions encountered previously at 65°S) high availability of Fe prior to the sampling as it has been documented that they take at least 2 days to fully acclimate to high iron conditions by adjusting their photosynthetic pigments (Sedwick et al., 2007; Viljoen et al., 2018). Therefore we assume that the recent ice melt (as mentioned above) here too induced increased trace metal supply (Grotti et al., 2001; Alderkamp et al., 2012b) and subsequent community that preferentially utilized Fe resulting in near limiting Fe concentrations.
Conclusion
In this study, we have seen a variety of physical (temperature, salinity, mixed layer, depth and the resulting water column structure) and chemical (macronutrients) properties influence phytoplankton abundance and shape community structure. In addition, we showed how micronutrients are a vital, additional parameter which can account for variability when physical and/or macronutrients observations cannot. However, patterns were not consistent across all water masses and hence, each water mass appears to feature very complex macro- and micro-nutrient interactions driving the community composition.
Our findings corroborate the importance of Fe as an essential trace metal affecting the community composition. Nonetheless, the importance of considering the influence of a suite trace metals, especially Zn and Co, has also been shown in this study when localized blooms could not be explained by macronutrients, or Fe alone. The timing of trace metal fluxes brought about by summer ice melt, deep mixing events and/or potential hydrothermal inputs proved to be a pivotal factor in the community interpretation. Therefore, when making inferences about the community structure and trace metal distribution we strongly recommend future studies to consider timing of such influx events.
Despite a few observed consistent relationships, the general lack of strong correlations reflects the complex nature of the interactions between phytoplankton and nutrients, including trace nutrients, and points toward a number of factors affecting phytoplankton community composition. We therefore note the difficulty to discern clear trends from this snapshot summer transect and the need for detailed time series and incubation studies.
Author Contributions
JV, IW, and SF wrote the manuscript. SF and AR conceived and designed the study and acquired funding. JV, IW, RC, JL, and RP contributed data and interpretation. All co-authors reviewed and edited this or previous versions of the manuscript and gave final approval for publication.
Funding
The work leading to these results received funding from the National Research Foundation (NRF) under the SANAP (Grant Nos. 110715 and 110731), Bilateral (Grant No. 114677), and CPRR (Grant No. 105826) programs. JV acknowledges funding from NRF through a Masters Innovation Scholarship. IW acknowledges the financial assistance of the NRF through the South African National Antarctic Program (Grant No. 110731).
Conflict of Interest Statement
RP was employed at the Centre for Trace Metal and Experimental Biogeochemistry, Department of Earth Sciences, University of Stellenbosch, during the time of this study. RP is now employed at Hatfield Consultants, North Vancouver, BC, Canada. This has no impact on the study submitted.
The remaining authors declare that the research was conducted in the absence of any commercial or financial relationships that could be construed as a potential conflict of interest.
Acknowledgments
The authors thank the crew of the research vessel SA Agulhas II, Department of Environmental Affairs (DEA), and all the scientific cruise participants of SANAE 54.
Supplementary Material
The Supplementary Material for this article can be found online at: https://www.frontiersin.org/articles/10.3389/fmars.2019.00295/full#supplementary-material
References
Alderkamp, A. C., Kulk, G., Buma, A. G. J., Visser, R. J. W., Van Dijken, G. L., Mills, M. M., et al. (2012a). The effect of iron limitation on the photophysiology of Phaeocystis antarctica (prymnesiophyceae) and Fragilariopsis cylindrus (bacillariophyceae) under dynamic irradiance. J. Phycol. 48, 45–59. doi: 10.1111/j.1529-8817.2011.01098.x
Alderkamp, A. C., Mills, M. M., van Dijken, G. L., Laan, P., Thuróczy, C.-E., and Gerringa, L. J. A. (2012b). Iron from melting glaciers fuels phytoplankton blooms in the Amundsen Sea (Southern Ocean): Phytoplankton characteristics and productivity. Deep. Res. Part II Top. Stud. Oceanogr. 7, 32–48. doi: 10.1016/j.dsr2.2012.03.005
Arrigo, K. R. (1999). Phytoplankton community structure and the drawdown of nutrients and CO2 in the Southern Ocean. Science 283, 365–367. doi: 10.1126/science.283.5400.365
BioGeoSCAPES (2018). BioGeoSCAPES: Ocean Metabolism and Nutrient Cycles on a Changing Planet. Available at: https://www.biogeoscapes.org/ doi: 10.1126/science.283.5400.365 (accessed May 9, 2019).
Boyd, P., Bakker, D., and Chandler, C. (2012). A new database to explore the findings from large-scale ocean iron enrichment experiments. Oceanography 25, 64–71. doi: 10.5670/oceanog.2012.104
Boyd, P. W. (2002). Environmental factors controlling phytoplankton processes in the Southern Ocean. J. Phycol. 38, 844–861. doi: 10.1046/j.1529-8817.2002.t01-1-01203.x
Boye, M., Wake, B. D., Lopez Garcia, P., Bown, J., Baker, A. R., and Achterberg, E. P. (2012). Distributions of dissolved trace metals (Cd, Cu, Mn, Pb, Ag) in the southeastern Atlantic and the Southern Ocean. Biogeosciences 9, 3231–3246. doi: 10.5194/bg-9-3231-2012
Brand, L. E. (1991). Minimum iron requirements of marine phytoplankton and the implications for the biogeochemical control of new production. Limnol. Oceanogr. 36, 1756–1771. doi: 10.4319/lo.1991.36.8.1756
Brand, L. E., Sunda, W. G., and Guillard, R. R. L. (1983). Limitation of marine phytoplankton reproductive rates by zinc, manganese, and iron1. Limnol. Oceanogr. 28, 1182–1198. doi: 10.4319/lo.1983.28.6.1182
Bruland, K. W. (1980). Oceanographic distributions of cadmium, zinc, nickel, and copper in the North Pacific. Earth Planet Sci. Lett. 47, 176–198. doi: 10.1016/0012-821X(80)90035-7
Bruland, K. W., Donat, J. R., and Hutchins, D. A. (1991). Interactive influences of bioactive trace metals on biological production in oceanic waters. Limnol. Oceanogr. 36, 1555–1577. doi: 10.4319/lo.1991.36.8.1555
Brzezinski, M. A. (1985). The Si:C:N ratio of marine diatoms: interspecific variability and the effect of some environmental variables. J. Phycol. 21,347–357. doi: 10.1111/j.0022-3646.1985.00347.x
Carreto, J. I., Montoya, N. G., Carignan, M. O., Akselman, R., Acha, E. M., and Derisio, C. (2016). Environmental and biological factors controlling the spring phytoplankton bloom at the patagonian shelf-break front – Degraded fucoxanthin pigments and the importance of microzooplankton grazing. Prog. Oceanogr. 146, 1–21. doi: 10.1016/j.pocean.2016.05.002
Clarke, A., and Leakey, R. J. G. (1996). The seasonal cycle of phytoplankton, macronutrients, and the microbial community in a nearshore antarctic marine ecosystem. Limnol. Oceanogr. 41, 1281–1294. doi: 10.4319/lo.1996.41.6.1281
Cloete, R., Loock, J. C., Mtshali, T., Fietz, S., and Roychoudhury, A. N. (2019). Winter and summer distributions of Copper, Zinc and Nickel along the International GEOTRACES Section GIPY05: insights into deep winter mixing. Chem. Geol. 511, 342–357. doi: 10.1016/J.CHEMGEO.2018.10.023
Coale, K. H., Johnson, K. S., Fitzwater, S. E., Gordon, R. M., Tanner, S., Chavez, F. P., et al. (1996). A massive phytoplankton bloom induced by an ecosystem-scale iron fertilization experiment in the equatorial Pacific Ocean. Nature 383, 495–501. doi: 10.1038/383495a0
Cubillos, J. C., Wright, S. W., Nash, G., De Salas, M. F., Griffiths, B., Tilbrook, B., et al. (2007). Calcification morphotypes of the coccolithophorid Emiliania huxleyi in the Southern Ocean: Changes in 2001 to 2006 compared to historical data. Mar. Ecol. Prog. Ser. 348, 47–54. doi: 10.3354/meps07058
Cutter, G., Codispoti, L., Croot, P., Francois, R., Lohan, M., Rutgers Van, et al. (2014). Sampling and Sample-Handling Protocols for GEOTRACES Cruises. Version 2.0.
Cutter, G. A., and Bruland, K. W. (2012). Rapid and noncontaminating sampling system for trace elements in global ocean surveys. Limnol. Oceanogr. Methods 10, 425–436. doi: 10.4319/lom.2012.10.425
Daday, A., Mackerras, A. H., and Smith, G. D. (1985). The effect of nickel on hydrogen metabolism and nitrogen fixation in the cyanobacterium anabaena cylindrica. Microbiology 131, 231–238. doi: 10.1099/00221287-131-2-231
de Baar, H. J. W., Boyd, P. W., Coale, K. H., Landry, M. R., Tsuda, A., Assmy, P., et al. (2005). Synthesis of iron fertilization experiments: from the iron age in the age of enlightenment. J. Geophys. Res. 110, 1–24. doi: 10.1029/2004JC002601
de Baar, H. J. W., Buma, A. G. J., Nolting, R. F., Cadee, G. C., Jacques, G., and Treguer, P. J. (1990). On iron limitation of the Southern Ocean: experimental observations in the Weddell and Scotia Seas. Mar. Ecol. Prog. Ser. 65, 105–122. doi: 10.3354/meps065105
Deppeler, S. L., and Davidson, A. T. (2017). Southern Ocean phytoplankton in a changing climate. Front. Mar. Sci. 4:40. doi: 10.3389/fmars.2017.00040
DiTullio, G. R., Garcia, N., Riseman, S. F., and Sedwick, P. N. (2007). Effects of iron concentration on pigment composition in Phaeocystis antarctica grown at low irradiance. Biogeochemistry 83, 71–81. doi: 10.1007/978-1-4020-6214-8_7
Dupont, C. L., Barbeau, K., and Palenik, B. (2008). Ni uptake and limitation in marine Synechococcus strains. Appl. Environ. Microbiol. 74, 23–31. doi: 10.1128/AEM.01007-07
Egan, L. (2008). Determination of Nitrate and/or Nitrite in Brackish or Seawater by Flow Injection Analysis. QuikChem Method 31-107-04-1-C. Milwaukee, WI: Lachat Instruments.
Findlay, C. S., and Giraudeau, J. (2000). Extant calcareous nannoplankton in the Australian Sector of the Southern Ocean (austral summers 1994 and 1995). Mar. Micropaleontol. 40, 417–439. doi: 10.1016/S0377-8398(00)00046-3
Garcia, H. E., Locarnini, R. A., Boyer, T. P., Antonov, J. I., Baranova, O. K., Zweng, M. M., et al. (2013). “World Ocean Atlas 2013. Vol. 4: Dissolved Inorganic Nutrients (phosphate, nitrate, silicate),” in NOAA Atlas NESDIS 76, eds S. Levitus and A. Mishonov (Silver Spring: NOAA).
GEOTRACES (2019). An International Study of the Marine Biogeochemical Cycles of Trace Elements and their Isotopes. Available at: http://www. geotraces.org/ (accessed May 9, 2019).
Gibberd, M. J., Kean, E., Barlow, R., Thomalla, S., and Lucas, M. (2013). Phytoplankton chemotaxonomy in the Atlantic sector of the Southern Ocean during late summer 2009. Deep. Res. Part I Oceanogr. Res. Pap. 78, 70–78. doi: 10.1016/j.dsr.2013.04.007
Grasshoff, K., Ehrhardt, M., Kremling, K., and Almgren, T. (1983). Methods of Seawater Analysis. Weinheim: Verlag Chemie.
Grotti, M., Soggia, F., Abelmoschi, M. L., Rivaro, P., Magi, E., and Frache, R. (2001). Temporal distribution of trace metals in Antarctic coastal waters. Mar. Chem. 76, 189–209. doi: 10.1016/S0304-4203(01)00063-9
Guiry, M. D., and Guiry, G. M. (2018). AlgaeBase. Galw: World-wide Electron. Publ. Natl. Univ. Ireland.
Hasle, G. R., Syvertsen, E. E., Steidinger, K. A., and Tangen, K. (1996). Identifying Marine Diatoms and Dinoflagellates. Cambridge: Academic Press.
Ho, T. Y., Finkel, Z. V., Milligan, A. J., Wyman, K., Falkowski, P. G., and Morel, F. M. M. (2003). The elemental composition of some marine phytoplankton. J. Phycol. 39, 1145–1159.
Hudson, R. J. M., and Morel, F. M. M. (1990). lron transport in marine phytoplankton: Kinetics of cellular and medium coordination reactions. Limnol. Oceanogr. 35, 1002–1020. doi: 10.4319/lo.1990.35.5.1002
Hutchins, D. A., and Bruland, K. W. (1998). Iron-limited diatom growth and Si:N uptake ratios in a coastal upwelling regime. Nature 393, 561–564. doi: 10.1038/31203
Jeffrey, S. W., Mantoura, R. F. C., and Wright, S. W. (1997). Phytoplankton Pigments in Oceanography: Guidelines to Modern Oceanography. Paris: UNESCO Publishing.
Kahru, M., Mitchell, B. G., Gille, S. T., Hewes, C. D., and Holm-Hansen, O. (2007). Eddies enhance biological production in the Weddell-Scotia Confluence of the Southern Ocean. Geophys. Res. Lett. 34:L14603. doi: 10.1029/2007GL030430
Klunder, M. B., Laan, P., Middag, R., De Baar, H. J. W., and van Ooijen, J. C. (2011). Dissolved iron in the Southern Ocean (Atlantic sector). Deep. Res. Part II Top. Stud. Oceanogr. 58, 2678–2694. doi: 10.1016/j.dsr2.2010.10.042
Lane, T. W., and Morel, F. M. M. (2000). A biological function for cadmium in marine diatoms. Proc. Natl. Acad. Sci. U.S.A. 97, 4627–4631. doi: 10.1073/pnas.090091397
Mackey, M. D., Mackey, D. J., Higgins, H. W., and Wright, S. W. (1996). CHEMTAX- a program for estimating class abundances from chemical markers: application to HPLC measurements of phytoplankton. Mar. Ecol. Prog. Ser. 144, 265–283. doi: 10.3354/meps144265
Matebr, R. J., and Hirst, A. C. (1999). Climate change feedback on the future oceanic CO2 uptake. Tellus B 51, 722–733. doi: 10.1034/j.1600-0889.1999.t01-1-00012.x
Measures, C., Hatta, M., and Grand, M. (2012). Bioactive trace metal distributions and biogeochemical controls in the Southern Ocean. Oceanography 25,122–133. doi: 10.5670/oceanog.2012.85
Mendes, C. R. B., Kerr, R., Tavano, V. M., Cavalheiro, F. A., Garcia, C. A. E., Gauns Dessai, D. R., et al. (2015). Cross-front phytoplankton pigments and chemotaxonomic groups in the Indian sector of the Southern Ocean. Deep. Res. Part II Top. Stud. Oceanogr. 118, 221–232. doi: 10.1016/j.dsr2.2015.01.003
Middag, R., de Baar, H. J. W., Laan, P., Cai, P. H., and van Ooijen, J. C. (2011). Dissolved manganese in the Atlantic sector of the Southern Ocean. Deep Sea Res. Part II Top. Stud. Oceanogr. 58, 2661–2677. doi: 10.1016/J.DSR2.2010.10.043
Middag, R. S., van Heuven, M. A. C., Bruland, K. W., and de Baar, H. J. W. (2018). The relationship between cadmium and phosphate in the Atlantic Ocean unravelled. earth planet. Sci. Lett. 492, 79–88. doi: 10.1016/j.epsl.2018.03.046
Moore, C. M., Mills, M. M., Arrigo, K. R., Berman-Frank, I., Bopp, L., Boyd, P. W., et al. (2013). Processes and patterns of oceanic nutrient limitation. Nat. Geosci. 6, 701–710. doi: 10.1038/ngeo1765
Moore, L. R., Post, A. F., Rocap, G., and Chisholm, S. W. (2002). Utilization of different nitrogen sources by the marine cyanobacteria Prochlorococcus and Synechococcus. Limnol. Oceanogr. 47, 989–996. doi: 10.4319/lo.2002.47.4.0989
Morel, F. M. M., Milligan, A. J., and Saito, M. A. (2003). Marine bioinorganic chemistry: the role of trace metals in the oceanic cycles of major nutrients. Geochemistry 6, 113–143. doi: 10.1016/b0-08-043751-6/06108-9
Muggli, D. L., and Harrison, P. J. (1996). Effects of nitrogen source on the physiology and metal nutrition of Emiliania huxleyi grown under different iron and light conditions. Mar. Ecol. Prog. Ser. 130, 255–267. doi: 10.3354/meps130255
Muggli, D. L., and Harrison, P. J. (1997). Effects of iron on two oceanic phytoplankters grown in natural NE subarctic pacific seawater with no artificial chelators present. J. Exp. Mar. Bio. Ecol. 212, 225–237. doi: 10.1016/s0022-0981(96)02752-9
NASA Ocean Biology Processing Group (2014). VIIRSN Level-3 Standard Mapped Image. Maint. Greenbelt MD: NASA Ocean Biol. Distrib. Act. Arch. Cent. (OB.DAAC).
Orsi, A. H., Whitworth, T., and Nowlin, W. D. (1995). On the meridional extent and fronts of the Antarctic Circumpolar Current. Deep. Res. Part I 42, 641–673. doi: 10.1016/0967-0637(95)00021-W
Patey, M. D., Rijkenberg, M. J. A., Statham, P. J., Stinchcombe, M. C., Achterberg, E. P., and Mowlem, M. (2008). Determination of nitrate and phosphate in seawater at nanomolar concentrations. Trends Anal. Chem. 27, 169–182. doi: 10.1016/j.trac.2007.12.006
Peers, G., and Price, N. M. (2004). A role for manganese in superoxide dismutases and growth of iron-deficient diatoms. Limnol. Oceanogr. 49, 1774–1783. doi: 10.4319/lo.2004.49.5.1774
Penven, P., Lutjeharms, J. R. E., Marchesiello, P., Roy, C., and Weeks, S. J. (2001). Generation of cyclonic eddies by the Agulhas Current in the lee of the Agulhas Bank. Geophys. Res. Lett. 28, 1055–1058. doi: 10.1029/2000GL011760
Pollard, R. T., Lucas, M. I., and Read, J. F. (2002). Physical controls on biogeochemical zonation in the Southern Ocean. Deep. Res. Part II Top. Stud. Oceanogr. 49, 3289–3305. doi: 10.1016/S0967-0645(02)00084-X
Price, N. M., and Morel, F. M. M. (1990). Cadmium and cobalt substitution for zinc in a marine diatom. Nature 344, 658–660. doi: 10.1038/344658a0
Ragueneau, O., and Tréguer, P. (1994). Determination of biogenic silica in coastal waters: applicability and limits of the alkaline digestion method. Mar. Chem. 45, 43–51. doi: 10.1016/0304-4203(94)90090-6
Ras, J., Claustre, H., and Uitz, J. (2008). Spatial variability of phytoplankton pigment distributions in the Subtropical South Pacific Ocean: comparison between in situ and predicted data. Biogeosciences 5, 353–369. doi: 10.5194/bgd-4-3409-2007
Rousseau, V., Chrétiennot-Dinet, M.-J., Jacobsen, A., Verity, P., and Whipple, S. (2007). The life cycle of Phaeocystis: state of knowledge and presumptive role in ecology. Biogeochemistry 83, 29–47. doi: 10.1007/s10533-007-9085-3
Saito, M. A., and Goepfert, T. J. (2008). Zinc-cobalt colimitation of Phaeocystis antarctica. Limnol. Oceanogr. 53, 266–275. doi: 10.4319/lo.2008.53.1.0266
Saito, M. A., and Moffett, J. W. (2002). Temporal and spatial variability of cobalt in the Atlantic Ocean. Geochim. Cosmochim. Acta 66, 1943–1953. doi: 10.1016/S0016-7037(02)00829-3
Saito, M. A., Moffett, J. W., Chisholm, S. W., and Waterbury, J. B. (2002). Cobalt limitation and uptake in Prochlorococcus. Limnol. Oceanogr. 47, 1629–1636. doi: 10.4319/lo.2002.47.6.1629
Sarmiento, J. L., and Le Quéré, C. (1996). Oceanic carbon dioxide uptake in a model of century-scale global warming. Science 274, 1346–1350. doi: 10.1126/SCIENCE.274.5291.1346
Scharek, R., Van Leeuwe, M. A., and De Baar, H. J. W. (1997). Responses of Southern Ocean phytoplankton to the addition of trace metals. Deep Sea Res. Part II Top. Stud. Oceanogr. 44, 209–227. doi: 10.1016/S0967-0645(96)00074-4
Schlüter, L., Henriksen, P., Nielsen, T. G., and Jakobsen, H. H. (2011). Phytoplankton composition and biomass across the southern Indian Ocean. Deep Sea Res. Part I Oceanogr. Res. Pap. 58, 546–556. doi: 10.1016/j.dsr.2011.02.007
Schoemann, V., Becquevort, S., Stefels, J., Rousseau, V., and Lancelot, C. (2005). Phaeocystis blooms in the global ocean and their controlling mechanisms: a review. J. Sea Res. 53, 43–66. doi: 10.1016/j.seares.2004.01.008
Scott, F. J., and Marchant, H. J. (2005). Antarctic Marine Protists. Canberra: Australian Biological Resources Study and Australian Antarctic Division.
Sedwick, P. N., Garcia, N. S., Riseman, S. F., Marsay, C. M., and DiTullio, G. R. (2007). Evidence for high iron requirements of colonial Phaeocystis antarctica at low irradiance. Biogeochemistry 83, 83–97. doi: 10.1007/978-1-4020-6214-8_8
Smetacek, V., Assmy, P., and Henjes, J. (2004). The role of grazing in structuring Southern Ocean pelagic ecosystems and biogeochemical cycles. Antarct. Sci. 16, 541–558. doi: 10.1017/S0954102004002317
Smith, H. E. K., Poulton, A. J., Garley, R., Hopkins, J., Lubelczyk, L. C., and Drapeau, D. T. (2017). The influence of environmental variability on the biogeography of coccolithophores and diatoms in the Great Calcite Belt. Biogeosciences 14, 4905–4925. doi: 10.5194/bg-14-4905-2017
Smith, W. O., and Asper, V. L. (2001). The influence of phytoplankton assemblage composition on biogeochemical characteristics and cycles in the southern Ross Sea, Antarctica. Deep. Res. Part I 48, 137–161. doi: 10.1016/S0967-0637(00)00045-5
Smith, W. O., and Lancelot, C. (2004). Bottom-up versus top-down control in phytoplankton of the Southern Ocean. Antarct. Sci. 16, 531–539. doi: 10.1017/S0954102004002305
Sunda, W. G. (1989). Trace metal interactions with marine phytoplankton. Biol. Oceanogr. 6, 411–442. doi: 10.1080/01965581.1988.10749543
Sunda, W. G., and Huntsman, S. A. (1995a). Cobalt and zinc interreplacement in marine phytoplankton: biological and geochemical implications. Limnol. Oceanogr. 40, 1404–1417. doi: 10.4319/lo.1995.40.8.1404
Sunda, W. G., and Huntsman, S. A. (1995b). Iron uptake and growth limitation in Oceanic and Coastal Phytoplankton. Mar. Chem. 50, 189–206. doi: 10.1016/0304-4203(95)00035-p
Sunda, W. G., and Huntsman, S. A. (2000). Effect of Zn, Mn, and Fe on Cd accumulation in phytoplankton: implications for oceanic Cd cycling. Limnol. Oceanogr. 45, 1501–1516. doi: 10.4319/lo.2000.45.7.1501
Tagliabue, A., Hawco, N. J., Bundy, R. M., Landing, W. M., Milne, A., Morton, P. L., et al. (2018). The role of external inputs and internal cycling in shaping the global ocean cobalt distribution: insights from the first cobalt biogeochemical model. Glob. Biogeochem. Cycles 32, 594–616. doi: 10.1002/2017GB005830
Tagliabue, A., Sallée, J.-B., Bowie, A. R., Lévy, M., Swart, S., and Boyd, P. W. (2014). Surface-water iron supplies in the Southern Ocean sustained by deep winter mixing. Nat. Geosci. 7, 314–320. doi: 10.1038/ngeo2101
Twining, B. S., and Baines, S. B. (2013). The trace metal composition of marine Phytoplankton. Ann. Rev. Mar. Sci. 5, 191–215. doi: 10.1146/annurev-marine-121211-172322
van Leeuwe, M. A., Kattner, G., van Oijen, T., de Jong, J. T. M., and de Baar, H. J. W. (2015). Phytoplankton and pigment patterns across frontal zones in the Atlantic sector of the Southern Ocean. Mar. Chem. 177, 510–517. doi: 10.1016/j.marchem.2015.08.003
Viljoen, J. J., Philibert, R., Van Horsten, N., Mtshali, T., Roychoudhury, A. N., Thomalla, S., et al. (2018). Phytoplankton response in growth, photophysiology and community structure to iron and light in the Polar Frontal Zone and Antarctic waters. Deep Res. Part I Oceanogr. Res. Pap. 141, 118–129. doi: 10.1016/j.dsr.2018.09.006
Wolters, M. (2002). Determination of Silicate in Brackish or Seawater by Flow Injection Analysis. QuikChem Method 31-114-27-1-D. Milwaukee, WI: Lachat Instruments.
Wright, S. W., van den Enden, R. L., Pearce, I., Davidson, A. T., Scott, F. J., and Westwood, K. J. (2010). Phytoplankton community structure and stocks in the Southern Ocean (30-80E) determined by CHEMTAX analysis of HPLC pigment signatures. Deep Res. Part II Top. Stud. Oceanogr. 57, 758–778. doi: 10.1016/j.dsr2.2009.06.015
Wu, J., Roshan, S., and Chen, G. (2014). The distribution of dissolved manganese in the tropical-subtropical North Atlantic during US GEOTRACES 2010 and 2011 cruises. Mar. Chem. 166, 9–24. doi: 10.1016/j.marchem.2014.08.007
Keywords: cyanobacteria, diatoms, GEOTRACES, ice edge, Phaeocystis antarctica, photosynthetic pigments
Citation: Viljoen JJ, Weir I, Fietz S, Cloete R, Loock J, Philibert R and Roychoudhury AN (2019) Links Between the Phytoplankton Community Composition and Trace Metal Distribution in Summer Surface Waters of the Atlantic Southern Ocean. Front. Mar. Sci. 6:295. doi: 10.3389/fmars.2019.00295
Received: 12 January 2019; Accepted: 20 May 2019;
Published: 06 June 2019.
Edited by:
Antonio Tovar-Sanchez, Spanish National Research Council (CSIC), SpainReviewed by:
Rahul Mohan, National Centre for Antarctic and Ocean Research, IndiaAntonio Cobelo-Garcia, Spanish National Research Council (CSIC), Spain
Benjamin Twining, Bigelow Laboratory for Ocean Sciences, United States
Copyright © 2019 Viljoen, Weir, Fietz, Cloete, Loock, Philibert and Roychoudhury. This is an open-access article distributed under the terms of the Creative Commons Attribution License (CC BY). The use, distribution or reproduction in other forums is permitted, provided the original author(s) and the copyright owner(s) are credited and that the original publication in this journal is cited, in accordance with accepted academic practice. No use, distribution or reproduction is permitted which does not comply with these terms.
*Correspondence: Susanne Fietz, sfietz@sun.ac.za
†These authors have contributed equally to this work
‡Present address: Raissa Philibert, Hatfield Consultants, North Vancouver, BC, Canada