Tidewater Glaciers and Bedrock Characteristics Control the Phytoplankton Growth Environment in a Fjord in the Arctic
 Laura Halbach1,2
  Mikko Vihtakari1,3
  Pedro Duarte1
  Alistair Everett1
  Mats A. Granskog1
  Haakon Hop1,4
  Hanna M. Kauko1
  Svein Kristiansen4
  Per I. Myhre1
  Alexey K. Pavlov1,5,6
  Ankit Pramanik1,7
  Agnieszka Tatarek8
  Tomas Torsvik1
  Józef M. Wiktor8
  Anette Wold1
  Angela Wulff9 Harald Steen1
  Philipp Assmy1*
- 1Norwegian Polar Institute, Fram Centre, Tromsø, Norway
- 2Department of Marine Science, University of Gothenburg, Gothenburg, Sweden
- 3Institute of Marine Research, Fram Centre, Tromsø, Norway
- 4Department of Arctic and Marine Biology, Faculty of Biosciences, Fisheries and Economics, UiT The Arctic University of Norway, Tromsø, Norway
- 5Marine Physics Department, Institute of Oceanology, Polish Academy of Sciences, Sopot, Poland
- 6Akvaplan-niva, Fram Centre, Tromsø, Norway
- 7National Centre for Polar and Ocean Research, Goa, India
- 8Marine Ecology Department, Institute of Oceanology, Polish Academy of Sciences, Sopot, Poland
- 9Department of Biological and Environmental Sciences, University of Gothenburg, Gothenburg, Sweden
Meltwater discharge from tidewater glaciers impacts the adjacent marine environment. Due to the global warming, tidewater glaciers are retreating and will eventually terminate on land. Yet, the mechanisms through which meltwater runoff and subglacial discharge from tidewater glaciers influence marine primary production remain poorly understood, as data in close proximity to glacier fronts are scarce. Here, we show that subglacial meltwater discharge and bedrock characteristics of the catchments control the phytoplankton growth environment inside the fjord, based on data collected in close proximity to tidewater glacier fronts in Kongsfjorden, Svalbard from 26 to 31 July 2017. In the southern part of the inner fjord, glacial meltwater from subglacial discharge was rich in fine sediments derived from erosion of Devonian Old Red Sandstone and carbonate rock deposits, limiting light availability for phytoplankton (0.6 mg m−3 Chl a on average, range 0.2–1.9 mg m−3). In contrast, coarser sediments derived from gneiss and granite bedrock and lower subglacial discharge rates were associated with more favourable light conditions facilitating a local phytoplankton bloom in the northern part of the inner fjord with mean Chl a concentration of 2.8 mg m−3 (range 1.3–7.4 mg m−3). In the northern part, glacier meltwater was a direct source of silicic acid through weathering of the silica-rich gneiss and granite bedrock. Upwelling of the subglacial freshwater discharge plume at the Kronebreen glacier front in the southern part entrained large volumes of ambient, nutrient-rich bottom waters which led to elevated surface concentrations of ammonium, nitrate, and partly silicic acid. Total dissolved inorganic nitrogen transported to the surface with the upwelling of the subglacial discharge plume has a significant potential to enhance summer primary production in Kongsfjorden, with ammonium released from the seafloor being of particular importance. The transition from tidewater to land-terminating glaciers may, thus, reduce the input of nutrients to the surface layer with negative consequences for summer productivity.
Introduction
High latitude regions are undergoing rapid and considerable alterations due to climate change (IPCC, 2014). One of the most evident consequences of long-term climate warming is the retreat of glaciers. On the archipelago of Svalbard, located in the European high Arctic (74–81°N, 10–35°E), over 57% of the land area is covered by glaciers (Nuth et al., 2013). In recent decades, the retreat of glaciers has accelerated (Kohler et al., 2007; Østby et al., 2017) due to increasing summer temperatures (Nordli et al., 2014). At the west coast of Spitsbergen, the largest island of the archipelago, an increased prevalence of warm Atlantic Water (AW) displacing cold coastal water has caused an expedited melting of tidewater glaciers, which terminate directly into the sea (Schauer et al., 2004; Blaszczyk et al., 2009; Walczowski et al., 2017). These glaciers modify the hydrography and biogeochemistry of fjords through meltwater runoff (Straneo et al., 2011; Bartholomaus et al., 2013; Meire et al., 2016b; Kanna et al., 2018; Cape et al., 2019) and offer important foraging areas for seabirds, seals, and white whales (Lydersen et al., 2014; Urbanski et al., 2017; Everett et al., 2018). The continuing retreat of tidewater glaciers, which will eventually terminate on land, is expected to have negative consequences for fjord circulation, productivity, and commercial fisheries (Meire et al., 2017; Torsvik et al., 2019), emphasising the need to improve our understanding of biological-physical coupling in partly or fully glaciated fjords.
Kongsfjorden, located on the west coast of Spitsbergen (Figure 1), has many tidewater glaciers and has been nearly sea ice free since 2011 (Pavlova et al., 2019). Meltwater from tidewater glaciers represent the main freshwater source to the fjord (Pramanik et al., 2018). Other sources are snow melt, precipitation, groundwater discharge, and runoff from rivers, which are fed by melting snow and glacier ice (Cottier et al., 2005). The meltwater inflow generally starts in June, peaks in July-August and ends around September (Darlington, 2015). The glacier meltwater and associated sediment particle load create strong freshwater and turbidity gradients from the inner to the outer part of the fjord (Svendsen et al., 2002; Pavlov et al., 2019). This meltwater-induced gradient influences the growth environment of primary producers (Piquet et al., 2014; van de Poll et al., 2016; Calleja et al., 2017; Hegseth et al., 2019).
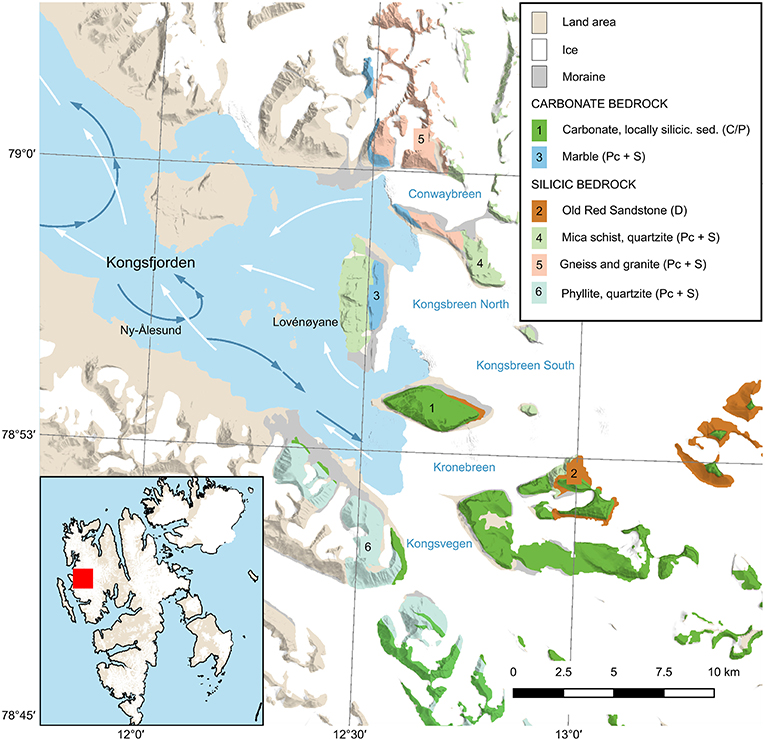
Figure 1. Kongsfjorden, Svalbard, with bedrock geological units relevant for this study: carbonate (1), Old Red Sandstone (2), marble (3), mica schist (4), gneiss and granite (5) phyllite, and quartzite (6). Stratigraphic ages for the units are given in parentheses: (C/P) = Carboniferous/Permian; (Pc + S) = Precambrian + Silurian, (D) = Devonian. Arrows indicate currents based on Hop et al. (2019), blue shows deep fjord water, and white surface water. Geological map is based on data from the Norwegian Polar Institute (Dallmann, 2015).
The transport of glacier meltwater into the marine environment depends on the position of the glacier terminus and its geomorphology (Syvitski et al., 1987; Syvitski, 1989; Motyka et al., 2003). Land-terminating glaciers discharge their meltwater into the sea via surface runoff from rivers, whereas meltwater from tidewater glaciers enters the fjord mainly by subglacial discharge below sea level. Tidewater glaciers melt along their front where the ice is in contact with warmer fjord water (Schild et al., 2018) and this melt is amplified by local meltwater plumes, which transport large volumes of meltwater from sub- or englacial drainage systems into the fjord (Syvitski, 1989). When subglacial low-density water enters the fjord at the base of the glacier, it rises towards the surface, entraining large volumes of ambient fjord water (Morton et al., 1956; Holland and Jenkins, 1999) and can lead to a continuous upwelling of nutrients (Meire et al., 2017). Glacier ice and meltwater itself can also be direct sources of nutrients (Hodson et al., 2005; Fransson et al., 2015; Meire et al., 2016a). The mineralogical characteristics of the particles eroded by the glacier and contained within the meltwater runoff depend on the lithology of the underlying bedrock (Smith, 1978; Ashley, 2002; Hodder et al., 2007). Chemical weathering can enrich glacier meltwater in silicic acid (Meire et al., 2016a), phosphate and nitrate (Hodson et al., 2005), whereas elevated ammonium concentrations can result from microbial degradation of organic matter within the snowpack and glacier ice, or particle-bound ammonium (Kumar et al., 2016). Ammonium concentrations, therefore, do not only depend on the bedrock-glacier interactions in contrast to silicic acid (Hodson et al., 2005; Wynn et al., 2007).
Knowledge on the influence of tidewater glaciers on fjord production and nutrient dynamics has only recently emerged (Meire et al., 2017; Hopwood et al., 2018) and we still lack data from close proximity to glacier fronts to better understand the mechanisms and underlying dynamics. By combining ship-, land- and helicopter-based sampling close to tidewater glaciers (from metres to kilometres distance to the glacier fronts), we studied light, inorganic nutrient and phytoplankton dynamics in Kongsfjorden, Svalbard, during the summer melt season. In this way, we aim to improve our understanding of the effects of freshwater discharge from tidewater glaciers in an high-Arctic fjord ecosystem. This knowledge is urgently needed given the rapid retreat and transformations of tidewater glaciers in Kongsfjorden and around the globe. We expected glacier meltwater discharge to impact phytoplankton production in the fjord through (1) reduced ambient light levels caused by high suspended matter content close to the glacier fronts and (2) nutrient fertilisation away from the glacier fronts, either directly through meltwater discharge or indirectly through subglacial discharge-induced upwelling when sediment particles have settled.
Methods
Study Area
Kongsfjorden is located on the west coast of the Svalbard archipelago (79°N, 11–12°E) and extends over a length of 20 km with width ranging from 4 to 10 km (Svendsen et al., 2002; Figure 1). Kongsfjorden is about 350 m deep at the mouth and becomes gradually narrower and shallower towards the interior, with typical depths <100 m for areas east of the research settlement Ny-Ålesund. At the fjord entrance, a sill is only partially present, thus allowing exchange of intermediate and deep fjord waters with offshore water masses comprising warm, saline AW of the West Spitsbergen Current and cold, less saline Arctic waters flowing northwards along the Spitsbergen shelf (Cottier et al., 2005). The islands Lovénøyane create a shallow sill (about 20 m average depth) towards the inner glaciated basin, with the greatest basin depth (95 m) located on the southern side of Kongsfjorden. There are four tidewater glaciers in the inner part of Kongsfjorden: Kongsvegen, Kronebreen, Kongsbreen, and Conwaybreen (Figure 1). Kronebreen and Kongsvegen drain through a shared terminus which is around 70 m deep. Kronebreen currently occupies about 70% of the glacier width at the terminus (Sund et al., 2011), and together these glaciers form the largest terminus in Kongsfjorden. The terminus of Kongsbreen is divided into a northern branch (Kongsbreen North) and southern branch (Kongsbreen South). Though described as tidewater termini, it should be noted that large parts of Kongsbreen South as well as Conwaybreen are resting on exposed bedrock above the water line. Of these glaciers, the largest runoff volume drains through the terminus of Kronebreen with 0.9 km3 in 2017, while Kongsvegen, Kongsbreen South, Kongsbreen North, and Conwaybreen released 0.4, 0.04, 0.2, and 0.1 km3, respectively, in 2017 (Pramanik et al., 2018; see also Supplementary Methods).
The northern and southern glacier catchments differ in the bedrock composition: carbonate bedrock together with Devonian Old Red Sandstone deposits (stratigraphic units 1 and 2 in Figure 1) dominate in the southern basin with phyllite and quartzite (unit 6) as minor components, whereas metamorphic and granitic rocks (mica schist, quartzite, and minor marble, units 4 and 5) likely make up most of the bedrock in the northern basin (Dallmann, 2015).
Sample Collection
Samples were collected during the “Glacier front” expedition with RV Lance between 26 to 31 July 2017 in Kongsfjorden. Sampling stations were clustered based on their similar hydrography and distance to glacier fronts as: Northern Glacier Zone (NGZ; close to the termini of Conwaybreen and Kongsbreen North), Southern Glacier Zone (SGZ; close to the shared terminus of Kronebreen and Kongsvegen), Inner Zone (IZ; stations in the inner fjord area, more distant to glaciers), and Outer Zone (OZ; stations further out in the fjord; Figures 1, 2). The sampling was performed along transects perpendicular to the glacier fronts and across the gateways of the SGZ and NGZ (Figure 2).
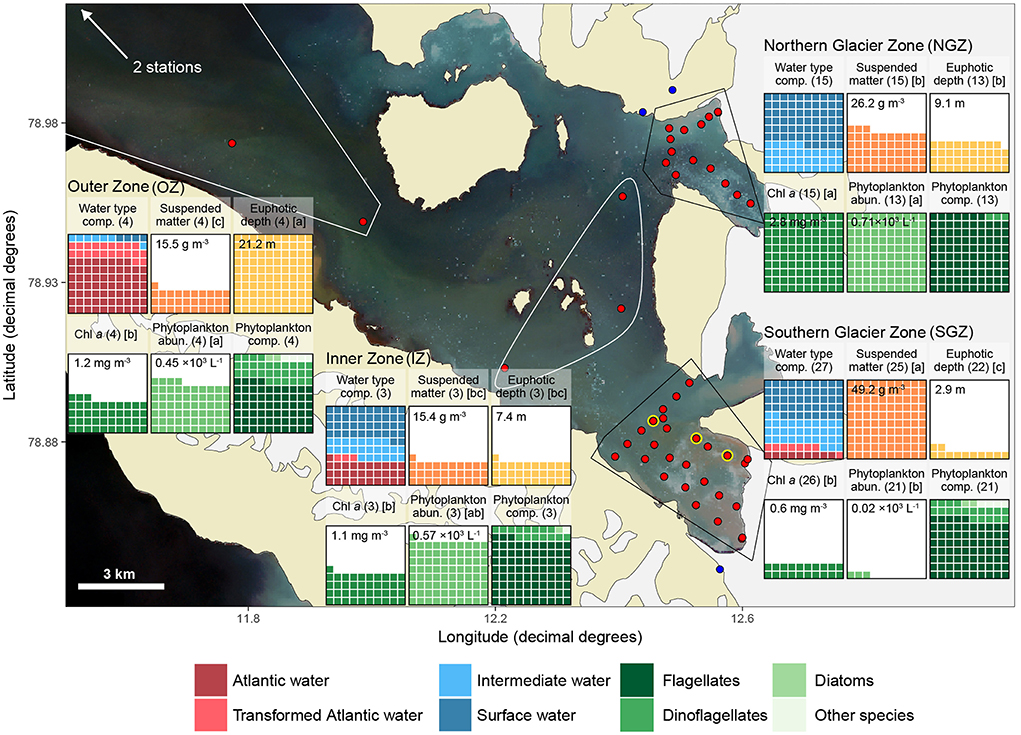
Figure 2. Overview of sampling locations and major differences among them. Red dots indicate ship or helicopter-based sampling stations, yellow circle locations where sediment cores were collected, and blue dots sampling from terrestrial glacial meltwater rivers originating from land-terminating glaciers. Waffle charts are arranged in 10 × 10% grid with each cell representing 1% of maximum average value for a variable across all zones for all boxes except the first and last one, which are scaled to mean value within each zone (i.e., represent composition). Polygons bound the stations within each zone. The satellite photo in the background obtained on 31 July 2017 from Sentinel-2 (https://scihub.copernicus.eu/) shows the water colour during sampling. Suspended matter and Chl a values were averaged for the upper 10 m for each station. Other variables represent values for the entire sampling range (0 m-bottom). Numbers in brackets after waffle-chart headers indicate number of replicates and letters indicate multiple comparisons test results: differing letters indicate statistically significant differences between zones for each variable, respectively. Mean values are given for non-compositional parameters in each box. See Table 1 for mean values, ranges, and standard deviations.
Biogeochemical variables such as nutrients, Chl a, phytoplankton and suspended matter were sampled from RV Lance at stations located between 0.03 and 36 km from the glacier fronts and by helicopter in close proximity to the glacier fronts. On board the ship, water samples were collected with Niskin bottles mounted on a rosette sampler equipped with a CTD (conductivity-temperature-depth, Sea-Bird Electronics, Bellevue, WA, USA), photosynthetically active radiation (400–700 nm, PAR; Spherical underwater Quantum Sensor Li-193, LI-COR Biosciences) and fluorescence (WETStar, Sea-Bird Electronics) sensors. The sampling depths ranged between 0 and 55 m in the Inner and Glacier zones and down to 100 m in the Outer Zone. Sampling depth intervals were 0, 1, 5, 10, 25/30, 50, and 100 m depending on bottom depths and Chl a maxima. From helicopter, sampling was done by means of a Hydro-Bios CTD rosette at 33 m distance to the Kronebreen and 93 m distance to the Conwaybreen front. The rosette sampler equipped with a CTD and 8 Niskin bottles was attached 5 m above a 500 kg counterweight, which was connected to a line of 100 m length. Sampling was conducted by lowering the counterweight to the bottom and then pulling up slowly (1 m s−1) while the helicopter itself was well above the glacier. Surface runoff from terrestrial glacial meltwater rivers was collected ashore into containers, transferred to the ship and immediately processed on board. To determine the ammonium concentration in sediment pore water, sediment cores were retrieved using a UWITEC gravity corer (Ø10 cm) at three stations with varying distances to the glacier front in the SGZ (locations shown on Figure 2 as yellow circled red dots).
Sample Processing
To determine total suspended matter, water samples of varying volume of 0.05–1.75 L (depending on the amount of suspended particles), were filtered through 25 mm diameter, pre-weighted and pre-combusted (at 450°C for 12 h) Whatman GF/F filters (GE Healthcare, Little Chaltfont, UK). After filtration, filters were dried in an oven at 60°C for ~24 h and stored at room temperature afterwards. Suspended matter was determined by weighing the filters on a Sartorius Quintix scale (Sartorius, Göttingen, Germany) and subtracting the weight of the initial combusted blank filter. For Chlorophyll a (Chl a) analysis, water samples were filtered through 25 mm diameter Whatman GF/F filter. Afterwards, Chl a was extracted in 5 mL 100% methanol for at least 12 h at 5°C in darkness and, then, measured with a Turner Designs AU10 fluorometer (Turner Designs, California, USA) at room temperature. The fluorometer was calibrated using Chl a standard from Anacystis nidulans algae (Sigma Aldrich C6144; Knap et al., 1996). The influence of the high sediment load near the glacier fronts on the fluorometer readings was examined by filtering nine samples through 0.2 μm GF/F filters with a syringe. No major effect of the sediment on Chl a concentration was found (mean change of 0.095 mg m−3 in Chl a).
One phytoplankton sample per station from 1, 5, or 10 m depth was examined for its taxonomic composition (see Table S1 for depth distributions among zones). Samples were transferred into 200 mL brown glass bottles and preserved with an aldehyde mixture (final concentration for glutaraldehyde was 0.1% and for hexamethylenetetramine-buffered formaldehyde 1%; Tsuji and Yanagita, 1981). The samples were stored in a cold (5°C) and dark place until analyses conducted at the Institute of Oceanology, Sopot, Poland. Depending on the phytoplankton and sediment density in the sample, a volume of 10–50 mL was settled in Utermöhl sedimentation chambers (Hydro-Bios, Kiel, Germany) for 48 h. Cells were counted and identified to lowest possible taxonomic level using an inverted Nikon Ti-S light and epifluorescence microscope at 100–600 × magnifications depending on the size of the organisms examined following Andersen and Throndsen (2003). All organisms were counted in transects and only when the number of cells was below 400–500 across bottom chamber surface, they were counted in the whole chamber. Phytoplankton taxa were grouped into higher taxonomic units: flagellates of non-determined taxonomic affinity, dinoflagellates, diatoms and others (Figure 2). Detailed species and group abundances are shown in Table S3.
Subsamples for nutrient analyses were collected in 20 mL acid-washed scintillation vials, fixed with 0.2 mL chloroform and stored at 4°C until processing (Hagebø and Rey, 1984). The concentrations of nitrite, nitrate, phosphate, and silicic acid were determined spectrophotometrically with a modified Skalar autoanalyser (Skalar Analytical Instruments, Breda, Netherlands) at wavelengths of 540, 540, 810, and 810 nm, respectively.
Subsamples for ammonium were collected into 10 mL Falcon polypropylene tubes and analysed immediately on board. Concentrations were measured spectrophotometrically in triplicates as described by Solorzano (1969), with colour development at 50°C in a water bath over 1 h. For ammonium blanks, Milli-Q water was used. The detection limit was 0.09 mg m−3 and the precision of analyses 2.0%. A high turbidity in the water samples, particularly in the glacier plume, can affect the spectrophotometer readings. Therefore, samples were filtered through 0.2 μm syringe filters before addition of reagents. Sediment pore water was collected (5–10 mL) with rhizons of 0.2 μm pore size attached to a syringe (Seeberg-Elverfeldt et al., 2005). Pore-water samples <10 mL were topped up with Milli-Q water to obtain a sample volume of 10 mL for all measurements, which was accounted for in the calculation of ammonium concentrations. Since ammonium concentrations were very high in pore water, samples were diluted 10× and measured using a 1 cm instead of a 5 cm cuvette.
Light Measurements
The euphotic depth was calculated as 0.1% of surface irradiance derived from the rosette-attached PAR sensor (QCP-2300-HP; Biospherical Instruments). The 0.1% threshold was chosen over 1% since many phytoplankton species can cope with 0.1% of incident PAR, especially when adapted to more turbid, brackish environments. Planar downwelling spectral irradiance Ed (λ) was measured with a factory calibrated RAMSES ACC-VIS spectroradiometer (TriOS Mess- und Datentechnik GmbH, Rastede, Germany) in the wavelength range 320–950 nm. The spectroradiometer was attached to a metal frame and lowered to the water with a ship crane several metres away from the ship to avoid shading from the ship. Measurements were done with a vertical resolution of ca. 1 m, and on the sunny side of the vessel in case of clear sky conditions, at selected stations along the transect (Table S4). The pressure sensor was calibrated to air pressure at sea level prior each cast. A mean of Ed (PAR) measurements that fall within the euphotic zone depth is presented for each glacier front (NGZ and SGZ). The mean euphotic depths were 4.5 and 2 m with ranges of 0–12.7 and 0.3–5.2 m for NGZ and SGZ, respectively. Photosynthetically usable radiation (PUR) indicates the irradiance in the PAR range that is usable for the algae based on their specific spectral absorption characteristics. Ed (PUR) was calculated using the same depth ranges as used for Ed (PAR) following equation 8 in Morel et al. (1987) and by using a typical low-light acclimated Euglenophytes absorption spectrum (Johnsen and Sakshaug, 2007, their Fig. 2A, pigment group 8) because of high abundance of Eutreptiella sp. in our samples.
The diffuse attenuation coefficient Kd (PAR) (m−1) was calculated (equation 5.2 in Kirk, 2011) on average between 2 and 3.5 m depth for NGZ and 1 and 3 m depth for SGZ stations (exact depth range [Table S4] depending on measurement depths at each station and vertical extent of reliable measurements):
where Ed (PAR, z1) and Ed (PAR, z2) represent the downwelling irradiance at respective depths z1 and z2 (m).
Calculation of Ammonium Fluxes
To obtain rough estimates of ammonium fluxes across the sediment-water interface Fick's first law of diffusion was used and corrected for interference with sediment according to Boudreau (1997):
where Jsed is the flux (μmol NH4 m−2 h−1), ϕ the sediment porosity, Dsed the diffusion coefficient for sediments, dC the difference in concentration of ammonium in pore water across dx—the change in sediment depth. Since sediment porosity (ϕ) was not measured in our study, the reference value of 0.44 (0–10 cm core depth) was used, measured by Sevilgen et al. (2014) in Kongsfjorden. Temperatures measured at the sampling locations closest to the sea floor by the CTD were 5.8, 5.2, and 3°C, respectively. Therefore, the diffusion coefficient in sediments was calculated using the molecular diffusion coefficient for ammonium in seawater (DSW) at 5°C (Schulz and Zabel, 2006) and the tortuosity. The tortuosity describes the degree of deviation of the pathway a molecule must take around particles, since the diffusion in sediment cannot follow a straight course as defined for the diffusion coefficient in free solutions. To estimate the tortuosity, we used the equation discussed in Schulz and Zabel (2006), based on Boudreau (1997):
Nutrient Entrainment Rates and Primary Production Estimates
Buoyant plumes of subglacial meltwater discharge entrain ambient seawater as they rise (Morton et al., 1956), thus providing a mechanism for deep, nutrient rich waters to be transported rapidly to the surface. In order to estimate the potential primary production that can be sustained by subglacial discharge-induced nutrient upwelling in Kongsfjorden, as done in Meire et al. (2017), the plume entrainment rates were modelled on the basis of subglacial meltwater discharge rates and plume dynamics at Kronebreen for 2017 using PyPlume (Everett, 2018; see Supplementary Methods sections Modelling of Glacier Runoff Rates and Modelling of Plume Entrainment Rates for details). The nutrient upwelling was calculated by multiplying the mean dissolved inorganic nitrogen (DIN; including ammonium, nitrate and nitrite) and nitrate concentrations of 7.1 and 4.2 mmol m−3 (bottom water > 50 m, 0.7–3.3 km distance to Kronebreen glacier front), respectively, by the upwelling volume driven by the plume. The upwelling volume from the nutrient sampling date (27 July 2017) was used, due to the lack of seasonal nutrient data in close proximity to the glacier front. Nitrogen concentrations were converted to carbon using the C:N ratio of 7.7 for the Svalbard region (Tamelander et al., 2013). Subsequently, areal production was calculated from the total new production and the Kongsfjorden area (242 km2 based on 2017's glacier front positions) and compared to the literature to evaluate the potential of the subglacial discharge-induced nutrient upwelling to fuel primary production in Kongsfjorden.
Data Analysis
To account for the vertical variability within the water column, data from each station were grouped into two different depth layers: surface layer (0–10 m) and bottom layer (25–90 m). Statistical analyses were performed using R (R Core Team, 2019). A significance level of p < 0.05 was applied in all statistical tests, with p-value corrections for multiple comparisons when needed. Multiple comparisons were performed using the max-t method described in Herberich et al. (2010), which was designed for heteroscedastic and unbalanced datasets. Multiple comparisons were computed for raw values using the multcomp (Hothorn et al., 2008), multcompView (Graves et al., 2015), and sandwich (Zeileis, 2006) R packages and are expressed as letters. The letters are organised alphabetically and differing letters indicate statistically significant difference between zones (Figures 2, 7, S7). A graphical overview of explanatory variables (water type and depth, suspended matter, euphotic depth as well as phytoplankton community parameters, Figure 2) was compiled using maximum average values for zones as a scaling parameter for each explanatory variable. Raw values used in the computation of the graphical overview of Figure 2 and throughout the study of Chl a, phytoplankton abundance and phytoplankton community composition are presented in Supplementary Material (Figure S6), in addition to the performed principal component analysis (PCA, see Supplementary Material, section Phytoplankton Community Analysis and Figure S5). Chl a data were log-transformed for Spearman's correlations with nutrients.
The Brunt-Väisälä-frequency (N2), a measure of surface-layer stratification, was calculated with the oce package (Kelley and Richards, 2018). For the mixed layer depth, the maximum value of N2 was used. To separate the different water masses within the study area (Figure 3), stations were classified according to Cottier et al. (2005) as follows: internal water masses such as Surface Water (SW), external water masses such as AW, and waters of mixed origin Transformed Atlantic Water (TAW), and Intermediate water (IW). The water types Local water and Arctic water (T < 1°C) were only present at a few stations and were therefore not considered further.
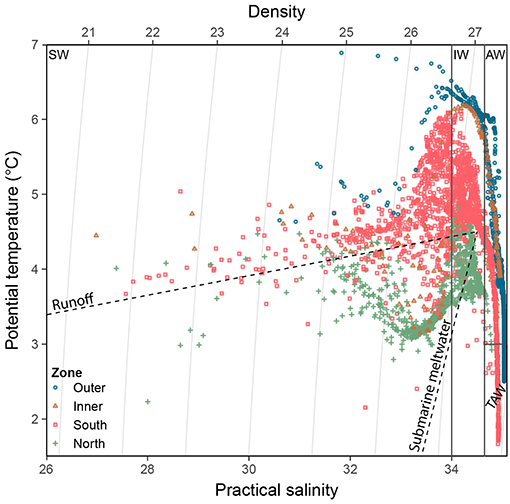
Figure 3. Temperature-salinity diagram of CTD data for each zone. Water mass classification is according to Cottier et al. (2005). Water mass type abbreviations: SW, Surface Water; IW, Intermediate Water; AW, Atlantic Water; TAW Transformed Atlantic Water. Dashed lines represent runoff mixing line (subglacial and supraglacial meltwater discharges, near horizontal, towards 0°C and 0 salinity) and submarine meltwater mixing line (formed through melting along the glacier front, near vertical towards −90°C and 0 salinity; Mankoff et al., 2016).
Data used in the study are available through the Norwegian Polar Data Centre (doi: 10.21334/npolar.2019.56c2cd62). Shapefiles used for maps (Figures 1, 2) were obtained from the Norwegian Polar Institute (http://geodata.npolar.no).
Results
Physical Environment
Important differences between physical and biological parameters among zones are summarised in Figure 2 and a more detailed overview of the main parameters used in this study is given in Table 1 (see also Figures S1, S7–S9 for vertical water column profiles including Chl a, suspended matter, nutrients, salinity and temperature). The water mass composition differed across the four zones (Figures 2, 3). Deeper waters were composed of Atlantic water types (AW and TAW), which generally became fresher and cooler towards the inner fjord. Inflow of Atlantic water types mainly followed the southern shore towards the SGZ, where remnants of deep fjord water can be observed, whereas inflow to the NGZ contained mostly mixed water masses (Figure 3). SW and IW were predominantly warmer in the NGZ than in the SGZ, and gradually disappeared towards the outer fjord. In Figure 3, dashed lines illustrate the gradients of mixing with runoff (subglacial or supraglacial meltwater discharge) and submarine meltwater (formed through melting along the glacier front) and reflect their relative proportions (Mankoff et al., 2016). Mixing of SW and IW in the SGZ showed a tendency to follow the gradient of the subglacial discharge mixing line, indicating that subglacial discharge may be the dominant source of freshwater in this zone. In contrast, mixing in the NGZ was closer to the gradient of the meltwater mixing line, suggesting a stronger influence of submarine melting, likely due to the comparably lower volumes of subglacial discharge. The main subglacial discharge plume outflow at the SGZ was clearly visible as red-brownish water colour (Supplementary Video). The plume was detected in the upper 14 m of the water column at 33 m distance from the glacier front as indicated by the sharp decrease in salinity and temperature at the northernmost glacier front station at Kronebreen (Figure S2).
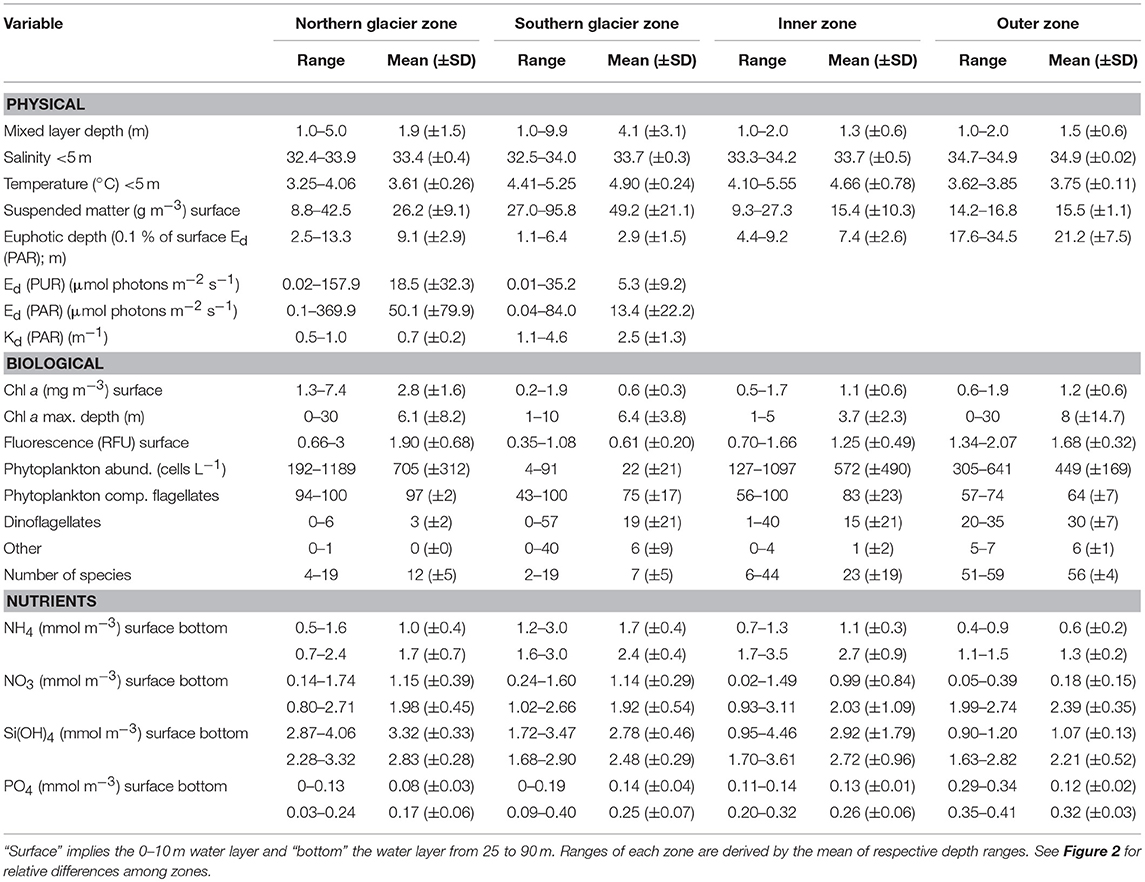
Table 1. Physical and biological variables (range, mean, SD) measured in the four designated zones in Kongsfjorden (Figure 2).
The two glacier zones differed in suspended matter contribution, with higher mean suspended matter loads at the main outflow area in the SGZ compared to the NGZ (46 and 28 g m−3, respectively; Table 1, Figures 2, 4). The highest suspended matter concentration (96 g m−3) was measured at the northernmost Kronebreen station, matching the position of one of the major subglacial discharge plumes. Suspended matter concentrations had a mean concentration of 14 g m−3 in the IZ and OZ. Suspended matter characteristics in the IZ were, however, largely influenced by the SGZ glacier subglacial discharge plume as indicated by the red-brownish water colour. Water colour was clearly different between the SGZ and NGZ (Figure 5), likely due to the differences in sediment load and bedrock geology of the catchments (Figure 1): we observed a red-brownish colour in the SGZ, while the NGZ had a milky green colour.
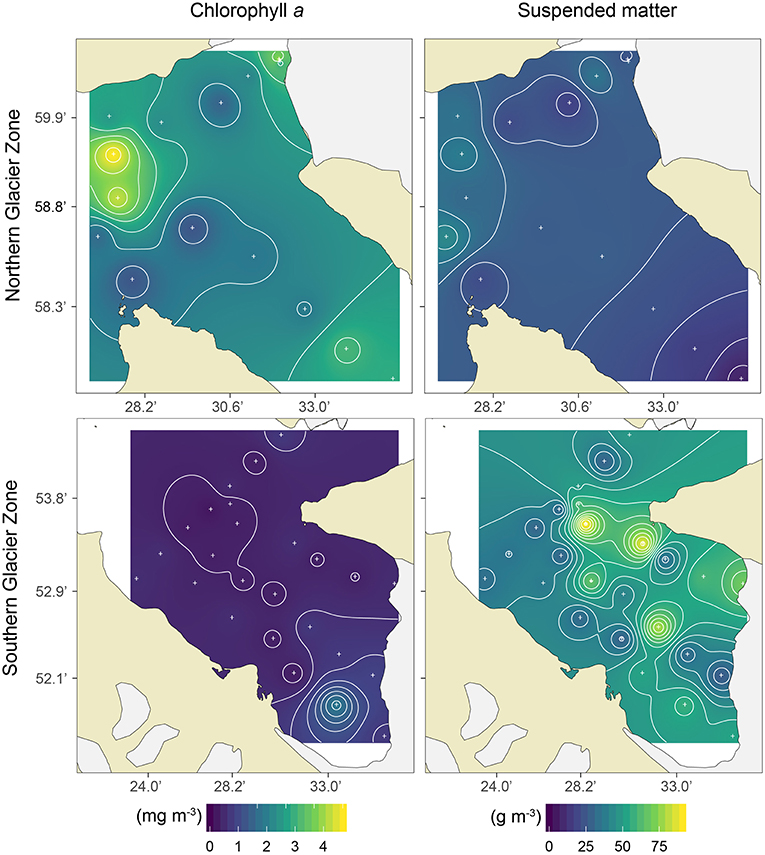
Figure 4. Surface (≤10 m) Chlorophyll a (mg m−3; left panels) and suspended matter (g m−3; right panels) concentrations in the Northern Glacier Zone (upper panels) and Southern Glacier Zone (lower panels) in Kongsfjorden.
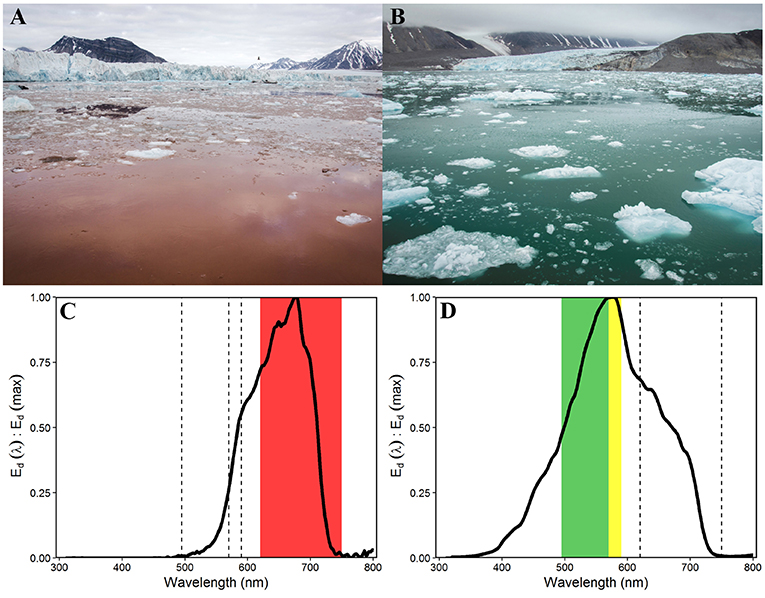
Figure 5. Contrasting water colouration in the Southern Glacier Zone (A) and Northern Glacier Zone (B, photo shows Conwaybreen glacier front), due to different sediment loads and characteristics (photos: Laura Halbach). Normalised spectral irradiance Ed (λ) at 2 m water depth at 685 m distance to Kronebreen (C) and at 375 m distance to Conwaybreen (D) (Ed (PAR) 0.1 and 48.2 μmol photons m−2 s−1, respectively) with maximum downwelling irradiance in red (620–750 nm), green (495–570 nm), and yellow (570–590 nm) wavelengths, respectively.
The differences in suspended matter load and characteristics between the NGZ and SGZ were also reflected in diffuse attenuation coefficients, euphotic depths and downwelling irradiance levels (Table 1, Figures 2, 6). The diffuse attenuation coefficient, Kd (PAR), was higher in the SGZ compared to the NGZ (2.5 and 0.7 m−1, respectively; for multispectral light attenuation values, Kd (λ), see Table S4). Consequently, the mean euphotic depth (as 0.1% of surface irradiance) was 3 m in the SGZ compared to 9 m in the NGZ. The mean downwelling planar irradiance measured in the PAR range at depths within the euphotic layer was lower in the SGZ compared to the NGZ (13.4 and 50.1 μmol photons m−2 s−1, respectively; Table 1, see Figure S3 for vertical profiles of downwelling planar irradiances). Also, Ed (PUR) was lower in SGZ than in NGZ. Further, the light quality differed between the SGZ and NGZ (Figure 5). Spectral irradiance measurements at 2 m depth at the innermost stations show maximum downwelling irradiance in the red (620–750 nm) and green/yellow (495–570/570–590 nm) wavelengths in the SGZ and NGZ, respectively, consistent with the varying water colour (Figure 5). Despite higher mean suspended matter loads, the euphotic depth in the NGZ did not differ from that in the IZ, reflecting the effect of differences in sediment characteristics on light penetration (Figures 2, 6). The mixed layer depth was deeper than the euphotic depth in the SGZ and shallower in the NGZ (Figure 6).
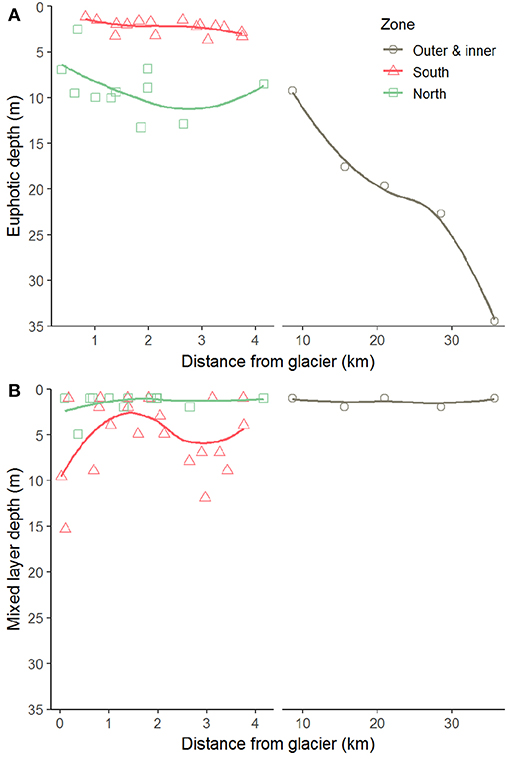
Figure 6. Euphotic (A) and mixed layer (B) depths along transects perpendicular to the glacier fronts in Kongsfjorden. The thick line indicates local polynomial regression fit.
Nutrients
Surface nitrate, silicic acid, and ammonium concentrations were elevated in the inner fjord zones and decreased towards the mouth of Kongsfjorden (Figures 7A,C,D, left panels). In contrast, surface phosphate concentrations did not demonstrate a clear trend with distance from glacier fronts (Figure 7B, left panel). All nutrient concentrations were generally higher in AW than in SW (Figure 7, right panels). Phosphate and ammonium concentrations were higher in SGZ compared to NGZ, while silicic acid concentrations had the opposite pattern (Figure 7, mid panels). All nutrient concentrations generally increased with water depth, except for silicic acid (Table 1). Nutrient measurements from terrestrial glacial meltwater rivers revealed silicic acid concentrations of 5–12.5 mmol m−3 and phosphate concentrations of 0.02–0.18 mmol m−3 (Table 2, Figure 7, mid panels). Nitrate and ammonium concentrations were in a similar range (0.4–2.3 and 0.7–1.7 mmol m−3, respectively).
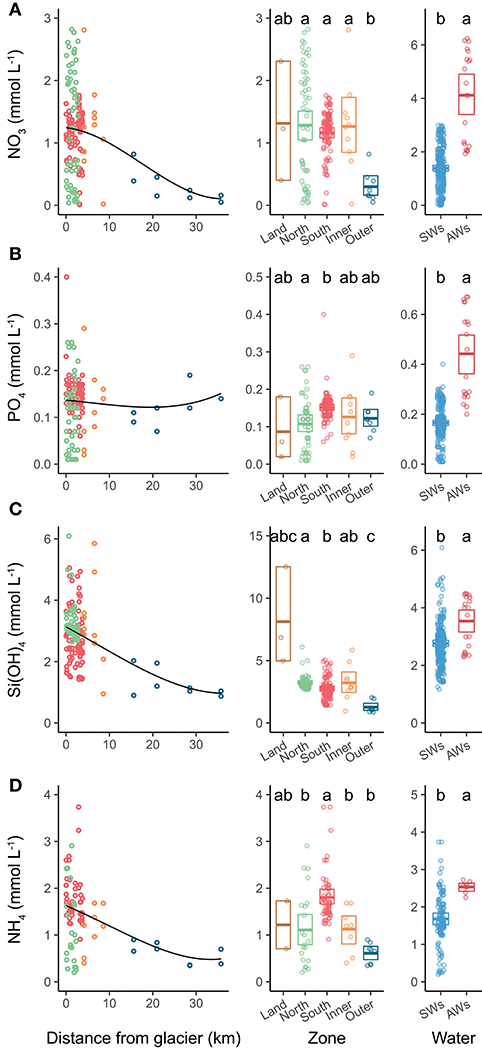
Figure 7. Nutrient concentrations in relation to distance from glacier (left panels), comparison among zones (mid panels) and among water types (right panels). Left and mid panels represent nutrients sampled between 0 and 10 m. The black line in left panels indicates local polynomial regression fit. The panels on the right include all depths from Southern and Northern Glacier Zones, with water masses as in Figure 3. (A) nitrate, (B) phosphate, (C) silicic acid, and (D) ammonium. Letters on right panels indicate pairwise permutation test results: differing letters indicate significantly different nutrient concentrations between zones. The crossbars indicate mean values and box margins bootstrapped 95% confidence intervals. Points represent values for individual samples.
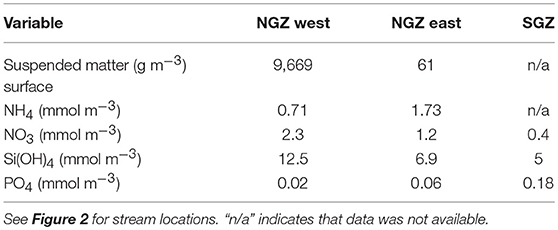
Table 2. Nutrient and total suspended matter concentrations in terrestrial glacial meltwater rivers in the Northern Glacier Zone (NGZ) and in the Southern Glacier Zone (SGZ).
Ammonium concentrations reached 3 mmol m−3 at 50 m water depth in the SGZ. Sediment pore-water at the SGZ had elevated ammonium concentrations at the sediment-water interface (6–31 mmol m−3) and concentrations increased with sediment depth (Figure S4). Moreover, there was a positive flux of ammonium at the sediment-water interface, which increased with increasing distance to the glacier front (3, 18, and 34 μmol m−2 d−1 at 0.69, 1.82, and 3.42 km distance, respectively).
In SW, nitrate, phosphate and ammonium showed a positive relationship with salinity irrespective of glacier zone (Figure 8). In contrast, silicic acid showed a negative relationship with salinity in SW, pointing to glacier melt water that has been in contact with silica-rich bedrock as an important source for silicic acid.
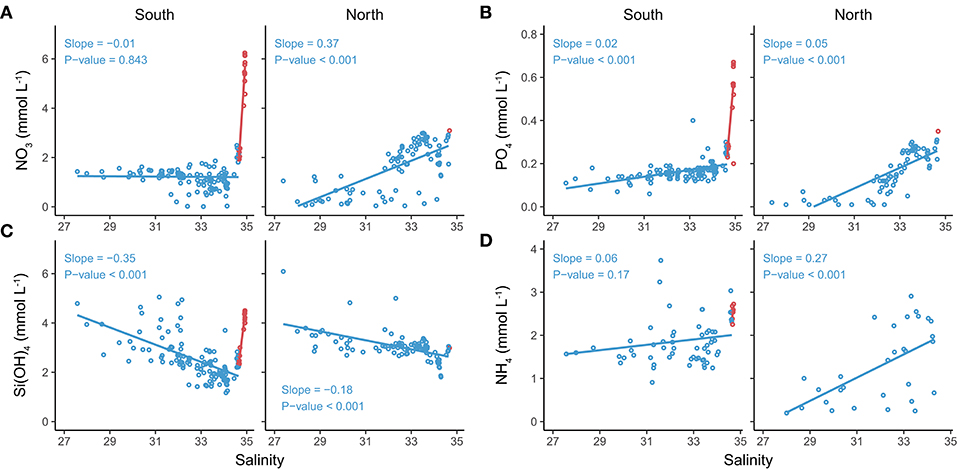
Figure 8. Relationship between nutrient concentrations and salinities for surface (blue) and Atlantic waters (red), classified according to Cottier et al. (2005), in the Southern and Northern Glacier Zones. (A) nitrate and phosphate, (B) silicic acid and ammonium. Slopes and their p-values for surface waters are in blue font.
Phytoplankton Biomass, Abundance and Community Composition
Spatial differences in Chl a concentration, a proxy of phytoplankton biomass, among zones are displayed in Figure 4 and summarised in Figure 2. Chl a concentrations in the surface layer (0–10 m) were highest in the NGZ (mean 2.3 mg m−3) followed by the IZ and OZ (1.1 and 0.9 mg m−3, respectively), and lowest in the SGZ (0.6 mg m−3; Table 1). A phytoplankton bloom dominated by Eutreptiella sp. and Pyramimonas sp. was found in close proximity to the glacier front in the NGZ (Chl a maxima of 4.7 and 10.6 mg m−3 at 1 and 5 m depth, respectively). Chl a fluorescence measurements made in situ (with the CTD-mounted fluorometer) confirmed the trend of a higher phytoplankton biomass in the NGZ compared to the SGZ.
Chl a concentration generally echoed the trends in phytoplankton abundance, but the IZ and OZ did not significantly differ from the NGZ despite significant differences in Chl a concentrations (Figure 2). NGZ and SGZ differed significantly in phytoplankton abundance and biomass (Chl a). In terms of abundance, the phytoplankton community was dominated by indetermined flagellates followed by dinoflagellates. The contribution of dinoflagellates gradually increased towards outer Kongsfjorden. Diatoms were nearly absent in the glacier front zones (mean abundance 0.25 × 10³ cells L−1; Figure 2; Table S2) but had considerably higher abundance in the IZ and OZ (mean abundance 5.7 × 10³ cells L−1). At the species level, the NGZ and SGZ were clearly separated from the IZ and OZ as revealed by PCA (Table S3, Figure S5). Distance from glaciers best explained (R2 = 0.74) the community gradient along the fjord (Table S3). Gymnodinium sp. 10–20 μm, Prorocentrum cordatum, Pyramimonas sp., and Eutreptiella sp. were more abundant in the NGZ, and to some extent also in the SGZ, than further out in the fjord (Table S2). On the other hand, Prorocentrum minimum, Gymnodinium galeatum, G. gracilentum, Phaeocystis pouchetii, among many other species, were more abundant in the outer stations than towards the glaciers. The number of phytoplankton species was higher in the IZ and OZ compared to the glacier front zones (Table S2).
All nutrients, except for silicic acid, showed a significant negative correlation with Chl a. Ammonium and phosphate had the strongest negative correlation (R = −0.54, p < 0.001 and R = −0.4, p < 0.001, respectively), followed by nitrate (R = −0.22, p < 0.05).
Estimated Primary Production Sustained by Subglacial Discharge-Induced Nutrient Upwelling
The proportional volume of water entrained into the subglacial discharge plume varied depending upon the discharge, with lower discharges entraining comparatively higher fractions of deep water. The mean entrainment rate of 8.3 × 10⁶ m3 day−1 was generally up to three times higher than the discharge rate 2.7 × 10⁶ m3 day−1, during 2017. Since data on bottom water nutrient content were only available for 27 July 2017, we used that day's entrainment rate of 33 × 106 m3 day−1 at a discharge rate of 11 × 106 m3 day−1, which yielded upwelling fluxes of 24 × 104 and 14 × 104 mol N day−1 for dissolved inorganic nitrogen (DIN) and nitrate, respectively (Table 2). The bottom water nitrate and ammonium concentrations used in our calculations are within the range of previous own measurements during July 2013–2017 within 3.4–9.8 km distance from the Kronebreen glacier front. The estimated upwelling fluxes could subsequently sustain primary production rates of 91 and 54 mg C m−2 day−1 using DIN and nitrate as nitrogen sources, respectively, and a phytoplankton C:N ratio of 7.7. Obtained primary production estimates are representative for the summer melt season when discharge and entrainment rates are close to their maximum (from early July and end of July-mid August; maximum discharge rates were observed in mid-July). Note that seasonal variations in bottom water nitrate concentrations, as shown by Calleja et al. (2017), in addition to variable light conditions and stratification, are not considered in these estimates.
Discussion
The geology of glacier catchments and glacier discharge influence local light and nutrient regimes and, thus, phytoplankton production in glaciated fjords (Figure 9). In Kongsfjorden, glacier meltwater itself, after having been in contact with silica-rich bedrock, can be a direct source of silicic acid (section Glacier Meltwater as a Direct Source for Nutrients), while nutrients contained in AW or ammonium released from the seafloor (section Nutrient Supply by Atlantic Water and Release from the Sea Floor) are brought to the surface by upwelling of nutrient-rich bottom waters initiated by subglacial discharge (section Subglacial Discharge-Induced Upwelling of Nutrients). Differences in bedrock geology and meltwater discharge rates between the SGZ and NGZ were reflected in varying suspended matter loads and contrasting light regimes (section The Influence of Glacier-Driven Bedrock Erosion and Nutrient Upwelling on Phytoplankton Growth). In the SGZ, phytoplankton abundance was reduced due to light limitation, whereas, in the NGZ, more favourable light conditions facilitated a flagellate-dominated phytoplankton bloom. Upwelled nutrients at the Kronebreen glacier front in the SGZ could potentially sustain primary production rates up to 24% of mean summer primary production previously measured in Kongsfjorden, highlighting the importance of nutrient-rich seawater entrainment by subglacial discharge for summer primary production.
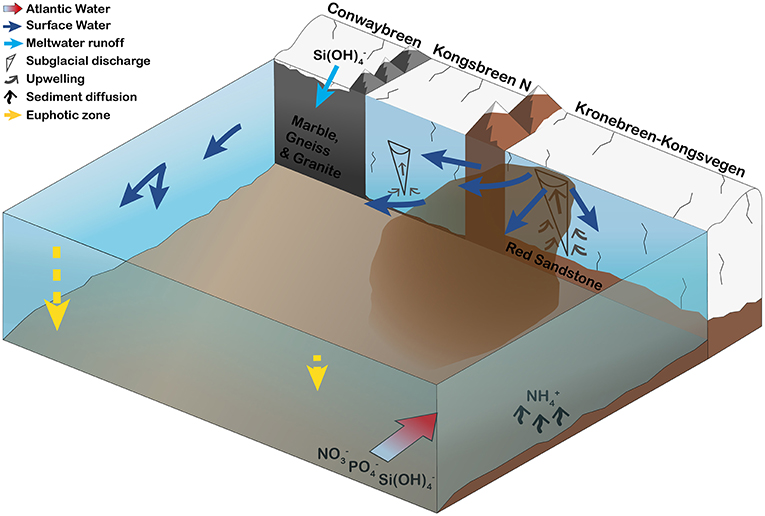
Figure 9. Schematic illustration of the major tidewater glacier and bedrock characteristics that control phytoplankton growth conditions in inner Kongsfjorden during summer. Four tidewater glaciers are surrounding the inner fjord basin: Conwaybreen, Kongsbreen (only northern branch shown), and Kronebreen-Kongsvegen. Conwaybreen grounded at or slightly below the waterline delivers meltwater mainly through surface runoff (riverine discharge) and submarine melting. There, glacier meltwater is rich in silicic acid through glacial-driven bedrock erosion. In contrast, buoyant subglacial discharge plumes at Kronebreen-Kongsvegen and to minor extent also at Kongsbreen North entrain large volumes of ambient, nutrient-rich deeper waters. Thereby, phosphate, nitrate and silicic acid contained within Atlantic Water entering the inner fjord basin along the southern shoreline and ammonium being released locally from the seafloor, are transported to the surface. Differences in meltwater discharge rates and bedrock geology lead to high suspended matter loads in the Southern Glacier Zone and, thus, limiting phytoplankton growth. In the Northern Glacier Zone, lower suspended matter loads and different sediment characteristics create more favourable light conditions (deeper euphotic zone), enabling a flagellate-dominated phytoplankton bloom in 2017. The bloom was likely fuelled by nutrient advection from the southern towards the northern fjord zone.
Glacier Meltwater as a Direct Source for Nutrients
Our results confirm that glacier discharge can have both direct and indirect effects on nutrient dynamics in the fjord. We found that glacier meltwater can be a direct source of silicic acid, as indicated by its high concentrations in low-salinity SW and terrestrial glacial meltwater rivers. The decrease of silicic acid with increasing salinity in both SGZ and NGZ reflects the dilution of glacier meltwater containing high silicic acid concentrations with ambient fjord water having lower concentrations. In addition, the difference in silicic acid in the inner fjord compared to the outer fjord likely reflects silicic acid input by glacier meltwater at the head of Kongsfjorden. Our findings are in line with the study by Fransson et al. (2015) showing high silicic acid concentrations in close proximity to glaciers in Tempelfjorden, Svalbard. Further, our results are consistent with the studies by Azetsu-Scott and Syvitski (1999), Meire et al. (2016a), and Kanna et al. (2018) showing elevated silicic acid concentrations in glacier ice (9.14 and 4.7 mmol m−3, former two studies, respectively) and proglacial rivers in fjords of Greenland (latter two studies). Due to our sampling during the post bloom period and low abundance of diatoms, we suggest dilution as the main factor influencing silicic acid values, while biological processes seemed to have played a minor role.
Moreover, we found that the silicic acid content of glacier meltwater is dependent on the underlying bedrock type. In our study region, silica-rich bedrock is present in both the NGZ and SGZ, but in the latter catchment, carbonate bedrock is the dominant type (Figure 1), which might explain the higher silicic acid concentration in the NGZ. Through contact with silica-containing bedrock, glacier meltwater can be enriched in silicic acid and transported into the fjord by either subglacial discharge or surface runoff by meltwater rivers (Aciego et al., 2015). In addition to bedrock lithology, the enrichment of glacier meltwater with silicic acid through rock weathering is also dependent on the extent of a subglacial drainage system and ice bedrock interaction time. The high variation in silicic acid concentrations in the meltwater stream samples likely reflects different conditions for silicic acid enrichments due to varying bedrock lithology and glacier drainage characteristics, which was previously shown by Meire et al. (2016a). Our results suggest that the mechanisms of silicic acid input to the fjord by glacier meltwater discharge are comparable between Greenland fjords (Meire et al., 2016a) and Kongsfjorden, despite the much larger silicic acid input from the Greenland ice sheet.
In contrast to silicic acid, glacier meltwater was likely only a minor source for nitrate, ammonium and phosphate, as these were found in moderately low concentrations in terrestrial meltwater rivers. Due to the uptake of nitrate, ammonium and phosphate by the flagellate-dominated bloom in the NGZ, the relationship of these nutrients with salinity in this part of the fjord cannot be used as a robust indicator for the nutrient content of meltwater (Figure 7). In the SGZ, where phytoplankton biomass was low, the positive relationship between these nutrient concentrations with salinity confirms the low input by glacier discharge. The low ammonium content in glacier meltwater has already been shown by Wynn et al. (2007) for Midtre Lovénbreen in Kongsfjorden (<0.52 mmol m−3), while the study by Hodson et al. (2005) points to a high inter-annual variability in nitrogen fluxes for the same glacier. Microbial nitrification can influence ammonium levels in seawater, on glacier ice surfaces or runoff on short timescales and adds to the uncertainties in deciphering the effect of glaciers on ammonium availability. Further, the ability of ammonium to adsorb onto the mineral matrix of particles, particularly clays (Hodson et al., 2005; Schulz and Zabel, 2006; Kumar et al., 2016), potentially contributes to the prevailing variability in ammonium concentrations. We cannot rule out that the removal of sediment particles through filtration prior to the measurements could have contributed to the relatively large variability in ammonium concentrations in our study.
Nutrient Supply by Atlantic Water and Release From the Sea Floor
The higher concentrations of nitrate, phosphate, and to some extent silicic acid in the deeper AW waters in the fjord compared to SW, indicate that advection of AW into Kongsfjorden represents a substantial source for these nutrients that can subsequently be transported to the surface through upwelling. The elevated ammonium concentrations in the bottom layer and positive flux at the sediment-water interface point to the sea floor as a major source for local ammonium release. Ammonium in sediments usually originates from microorganisms using organic material for respiration under anoxic conditions and excretion by benthic organisms (Christensen et al., 1987; Maksymowska-Brossard and Piekarek-Jankowska, 2001). Fluxes of ammonium vary spatially and temporally in response to terrigenous runoff, phytodetritus deposition, and varying bacterial respiration rates (Maksymowska-Brossard and Piekarek-Jankowska, 2001; Gihring et al., 2010). This variation might explain the difference between the ammonium flux from water into the sediments (i.e., negative) measured in Kongsfjorden with incubation experiments by Gihring et al. (2010) and the flux out of the sediments calculated in this study. Increasing ammonium concentrations with water depth in front of Kronebreen were also found by van de Poll et al. (2016) reaching 1.4 mmol m−3 close to the sediment surface and support the fluxes estimated in this study. In addition, the seasonal study by Calleja et al. (2017) also showed increasing ammonium concentrations with water depth for the station closest to Kronebreen for May, August, and October with values of 0.7, 2.9, and 1.76 mmol m−3, respectively.
Subglacial Discharge-Induced Upwelling of Nutrients
Upwelling of bottom waters was likely the main pathway for the supply of nitrate, phosphate, and ammonium in inner Kongsfjorden. The mixing of the water masses adjacent to the subglacial plume is reflected by the increased mixed layer depth close to the glacier front (Figure 6). The highly turbid subglacial outflow at the Kronebreen terminus (Supplementary Video), drives the upwelling of bottom waters in Kongsfjorden, in addition to wind-induced upwelling (Cottier et al., 2010; Sundfjord et al., 2017). The relative importance of plume- vs. wind-induced upwelling (e.g., Meire et al., 2016b; Sundfjord et al., 2017; Meslard et al., 2018) could not be determined, but results from runoff and entrainment models show that the entrainment rate through subglacial discharge-induced upwelling at the Kronebreen terminus was on average three times higher than the subglacial discharge of meltwater. Thus, high amounts of nutrients are carried from depth to the surface (23 × 104 mol DIN day−1 using discharge rates from July, Table 3). Subglacial discharge at Kongsbreen North (e.g., Schild et al., 2018) will likely also drive a nutrient upwelling along its front. In contrast, most of Conwaybreen and Kongsbreen South are grounded at or only slightly below the waterline and have considerably lower volumes of subglacial discharge. They deliver the meltwater mainly through surface runoff (riverine discharge) and submarine melting and do not replenish surface nutrients through upwelling.
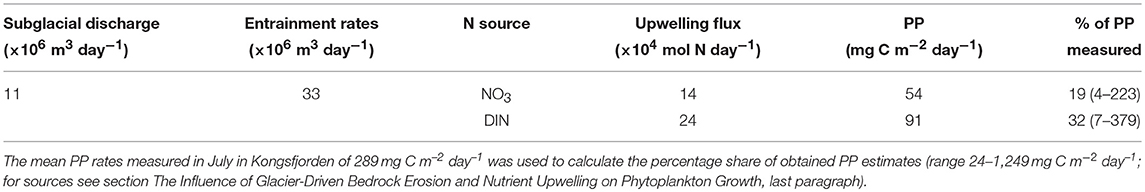
Table 3. Potential primary production (PP) rates sustained by nutrient upwelling-induced by subglacial discharge at Kronebreen. Modelled entrainment rates relate to sampling of nutrients on 27 July 2017. For nitrate (NO3) and dissolved inorganic nitrogen (DIN) concentrations, a mean of all Kronebreen stations at ≥50 m water depth was converted to μM carbon using the C:N ratio of 7.7 for Svalbard (Tamelander et al., 2013).
Comparison of Nutrient Upwelling in Kongsfjorden and Godthåbsfjord, Greenland
Similar data to that obtained in Kongsfjorden are available for Kangiata Nunata Sermia (KNS), a Greenlandic glacier draining into Godthåbsfjord. The deep water in Godthåbsfjord is more nutrient rich with ~9 mmol m−3 nitrate at 150 m depth (Meire et al., 2017) compared to ~6 mmol m−3 at 70 m depth in front of Kronebreen. Discharge rates are also considerably higher at KNS, with peak summer discharges around 800 m3 s−1 (Slater et al., 2017) compared to 250 m3 s−1 at Kronebreen. However, KNS has a much deeper terminus than Kronebreen, such that Slater et al. (2017) estimated that a discharge of 50 m3 s−1 is required for a plume to reach within 5 m of the surface, whereas our results show that for Kronebreen discharges of only 4 m3 s−1 will reach the upper 5 m. Observations of plumes at KNS and Kronebreen support this: Slater et al. (2017) observed a single intermittent plume at the terminus of KNS for fewer than 50 days over the melt season; while at Kronebreen, How et al. (2017) observed multiple plumes almost constantly for ~100 days. Therefore, while the nitrate upwelling rate of 14 × 104 mol N day−1 calculated for Kronebreen is smaller than the 40–400 × 104 mol N day−1 estimated for Godthåbsfjord by Meire et al. (2017), over the course of a season, the difference between the nutrient input of Kongsfjorden and Godthåbsfjord glaciers may not be as large. However, data necessary to fully understand this seasonal variability are currently not available. In addition, the local release of ammonia at the seafloor and subsequent upwelling seems to be an important component in Kongsfjorden, which has not been reported for Greenland glacier systems.
The Influence of Glacier-Driven Bedrock Erosion and Nutrient Upwelling on Phytoplankton Growth
Differences in glacier-driven bedrock erosion had a strong impact on local light regimes and thus phytoplankton growth conditions (Figure 9). By comparing contrasting glacier fronts, we showed that phytoplankton biomass is strongly reduced at very close proximity to the glacier front depending on the bedrock composition in the catchments and the architecture of the subglacial drainage system. In the SGZ, the subglacial melt water was rich in fine-grained suspended matter derived from layered, “soft” bedrock types as carbonate and Devonian Old Red Sandstone deposits (stratigraphic units 1 and 2 in Figure 1), hence limiting light available for phytoplankton. The mixed layer depth in the SGZ was located below the euphotic depth (mean of 3 m), hence keeping phytoplankton partly below the layer with enough light available for photosynthesis. The light limitation was reflected in the low Chl a levels and low phytoplankton abundances, despite moderately high nutrient concentrations.
In contrast to the SGZ, more favourable light conditions enabled a local phytoplankton bloom with a mean Chl a concentration of 2.8 mg m−3 in the NGZ. Maximum Chl a concentrations of 10.6 and 6.7 mg m−3 Chl a were observed at a distance of 0.1 and 1.9 km from the Conwaybreen glacier front, respectively. There, the bedrock consisting of metamorphic rocks such as gneiss, granite (stratigraphic unit 5 in Figure 1) and mica schist (stratigraphic unit 4) tends to be harder and more resistant to glacial erosion compared to the layered, “soft” bedrock types in the SGZ catchment (Elverhøi et al., 1980). Grains originating from this bedrock type are also coarser and heavier, thus they will likely be deposited within closer distance from the glacier front than fine-grained sediments (Meslard et al., 2018). Consequently, less suspended matter was entrained resulting in a deeper euphotic zone. The euphotic depth was located at 7 m on average in the NGZ, well below the mixed layer depth, enabling phytoplankton to stay within the euphotic zone. The spatial match of low suspended matter loads and high Chl a levels (Figure 4), suggests that light limitation was a key factor controlling phytoplankton growth in the inner fjord zones.
Growth of the flagellate-dominated bloom community was likely limited by ammonium and phosphate, as indicated by the strong negative correlations with Chl a, and dependent on the indirect input of these nutrients by adjacent tidewater glaciers. In fact, model simulations revealed that circulation at the surface flows from the southern towards the northern basin of Kongsfjorden (Sundfjord et al., 2017; Torsvik et al., 2019). Therefore, advection of upwelled nutrients towards the location of the bloom in the NGZ likely sustained the bloom, while suspended matter loads were reduced along the way since coarser sediments are deposited within the first km of the glacier terminus (Meslard et al., 2018). Interestingly, higher Chl a concentrations for the northern than for the southern shore of Kongsfjorden have been reported in Hegseth et al. (2019) for the area close to the IZ, supporting the surface advection of nutrients from the SGZ towards the NGZ. In the OZ, ammonium and nitrate concentrations were lowest among all zones (mean of 0.6 and 0.18 mmol m−3, respectively), likely limiting phytoplankton growth despite the beneficial light conditions.
Our results are consistent with the results of van de Poll et al. (2018) showing stronger nutrient limitation in the central part of Kongsfjorden (corresponding to OZ in this study) compared to the inner part. The trend of generally higher Chl a levels in the inner fjord basin compared to the outer fjord zone was previously described for Kongsfjorden by Calleja et al. (2017) and Hegseth and Tverberg (2013) for May. Later in the season during August, Chl a concentrations and phytoplankton abundance showed the opposite trend (Calleja et al., 2017). However, the spatial variability in Chl a levels and phytoplankton abundance in the inner fjord basin revealed in this survey, was likely missed by the other studies due to the use of a single transect covering only few stations in the southern glacier basin of Kongsfjorden. A flagellate-dominated phytoplankton community is typical for Kongsfjorden during summer (Piwosz et al., 2009; Piquet et al., 2010; Hodal et al., 2012, Hegseth et al., 2019), while the dominance of Eutreptiella sp. in the bloom at the NGZ seems to be a rather local phenomenon close to the glacier front, which is consistent with species of this genus known to dominate in brackish waters (Olli et al., 1996).
Recent studies have demonstrated that tidewater glaciers sustain high phytoplankton production throughout summer in Greenland fjords and coastal waters (e.g., Juul-Pedersen et al., 2015; Arrigo et al., 2017; Meire et al., 2017). In Svalbard, studies have shown that the inflow of glacier meltwater influences the timing, community composition, and location of phytoplankton blooms (Piquet et al., 2014; van de Poll et al., 2016) but we still lack information whether an increased meltwater runoff and subglacial discharge also sustains higher primary production during summer. The nutrient budget revealed that our primary production estimate, sustained by the upwelled nitrate and DIN, could contribute 19 and 32%, respectively, to the mean primary production rates of 289 mg C m−2 day−1 measured in Kongsfjorden during July (range: 24–1,249 mg C m−2 day−1, values obtained from Eilertsen et al., 1989; Hop et al., 2002; Piwosz et al., 2009; Iversen and Seuthe, 2011; all hourly measured rates were corrected by a factor 0.76 since the daily mean production rate is 76% of noon rates shown in Hop et al. (2002) based on measurements by S.-Å. Wängberg and K. Gustavson). The higher DIN-based primary production estimate was a result of the elevated ammonium concentrations near the glacier front. In Kongsfjorden, data on primary production are limited and have a low seasonal resolution (Hegseth et al., 2019). The few available measurements, however, show generally lower assimilation rates during summer than spring and suggest that the build-up of biomass is constrained by low nutrient levels and, close to the glacier front, low light availability. Nitrogen is the limiting nutrient in the Arctic during summer (Codispoti et al., 2013), and ammonium is in fact the preferred nitrogen source for phytoplankton (Raven et al., 1992; Glibert et al., 2016). Thus, the substantial supply of ammonium to the surface by subglacial discharge-induced upwelling likely stimulates primary production in the fjord. Our results, hence, highlight the importance of considering ammonium when investigating phytoplankton dynamics as a function of glacier proximity, particularly in shallow fjords such as Kongsfjorden, where ammonium may be released locally from the sea floor. The nutrients supplied by tidewater glaciers through subglacial-induced upwelling can promote phytoplankton blooms downstream of the glacier fronts.
Conclusions
The rapid retreat of tidewater glaciers and increasing meltwater discharge calls for a comprehensive understanding on how the antagonistic effects of light attenuation by glacier-derived sediments and fertilisation by nutrient input impact primary production in the adjacent marine ecosystem. Our results demonstrate the important role of tidewater glaciers in controlling the phytoplankton growth environment in Kongsfjorden. We show that differences in bedrock geology and subglacial discharge rates are the dominant factors controlling the light regime and nutrient dynamics in close proximity to glacier fronts. The substantial inorganic nutrient supply to the surface, through subglacial discharge-induced upwelling, may fuel primary production further downstream once sediment particles have settled out of the euphotic zone. In Kongsfjorden, subglacial discharge plumes reach the euphotic zone despite relatively low discharge rates and ammonium plays a particularly important role due to shallow grounding lines.
The transition from tidewater to land-terminating glaciers reduces water exchange rates in the inner fjord areas, which results in an enhanced stratification during summer months due to the removal of subglacial plume discharge (Torsvik et al., 2019). This might eventually lead to a lower carrying capacity of the marine ecosystem in glaciated fjords. For future studies we encourage measurements of seasonal and interannual primary production and bottom water nutrients, including ammonium, to fully assess the fertilising effect of subglacial discharge by tidewater glaciers in Kongsfjorden.
Author Contributions
PA, HH, HS, MV, MAG, and PD planned the study. PA, PD, AWo, MV, LH, HH, HK, and SK conducted the field work. HK and AKP analysed the light data. JW and AT analysed the phytoplankton data. AP developed the runoff and AE the entrainment model. PM provided and introduced the geological data. AWu contributed to the interpretation of light and phytoplankton data and TT to the interpretation of oceanographical data. LH, MV, and PA analysed all data. MV did the statistical analyses and produced all maps. LH wrote the manuscript and all co-authors contributed to the final version.
Funding
This study was supported by the Centre for Ice, Climate, and Ecosystems (ICE) at the Norwegian Polar Institute and the Research Council of Norway (TIGRIF project #243808 and Boom or Bust project #244646). HK and PA were supported by the Norwegian Ministries of Foreign Affairs and Climate and Environment, programme Arktis 2030 (project ID Arctic). AKP and MAG were supported by the Polish-Norwegian Research Programme operated by the National Centre for Research and Development under the Norwegian Financial Mechanism 2009–2014 in the framework of Project Contract Pol-Nor/197511/40/2013, CDOM-HEAT.
Conflict of Interest Statement
The authors declare that the research was conducted in the absence of any commercial or financial relationships that could be construed as a potential conflict of interest.
Acknowledgments
We would like to thank the captain and crew of the RV Lance. We acknowledge Jack Kohler for his input on the status of Kongsforden's glaciers and Elizabeth Robertson for her help with calculating ammonium—sediment fluxes. We thank Gesine Mollenhauer for providing the UWITEC gravity corer.
Supplementary Material
The Supplementary Material for this article can be found online at: https://www.frontiersin.org/articles/10.3389/fmars.2019.00254/full#supplementary-material
References
Aciego, S. M., Stevenson, E. I., and Arendt, C. A. (2015). Climate versus geological controls on glacial meltwater micronutrient production in southern Greenland. Earth Planet. Sci. Lett. 424, 51–58. doi: 10.1016/j.epsl.2015.05.017
Andersen, P., and Throndsen, J. (2003). “Estimating cell numbers,” in Manual on Harmful Microalgae, eds G. M. Hallegraeff, D. M. Anderson, and A. D. Cembella (Paris: UNESCO Publishing), 99–129.
Arrigo, K. R., van Dijken, G. L., Castelao, R. M., Luo, H., Rennermalm, Å. K., Tedesco, M., et al. (2017). Melting glaciers stimulate large summer phytoplankton blooms in southwest Greenland waters. Geophys. Res. Lett. 44, 6278–6285. doi: 10.1002/2017GL073583
Ashley, G. M. (2002). “Glaciolacustrine environments,” in Modern and Past Glacial Environments, ed J. Menzies (Oxford: Butterworth Heinemann), 335–359. doi: 10.1016/B978-075064226-2/50014-3
Azetsu-Scott, K., and Syvitski, J. P. M. (1999). Influence of melting icebergs on distribution, characteristics and transport of marine particles in an East Greenland fjord. J. Geophys. Res. 104, 5321–5328. doi: 10.1029/1998JC900083
Bartholomaus, T. C., Larsen, C. F., and O'Neel, S. (2013). Does calving matter? Evidence for significant submarine melt. Earth Planet. Sci. Lett. 380, 21–30. doi: 10.1016/j.epsl.2013.08.014
Blaszczyk, M., Jania, J. A., and Hagen, J. O. (2009). Tidewater glaciers of Svalbard: recent changes and estimates of calving fluxes. Polish Polar Res. 30, 85–142.
Boudreau, B. P. (1997). Diagenetic Models and Their Implementation: Modelling Transport and Reactions in Aquatic Sediments. Berlin; Heidelberg, NY: Springer Verlag. doi: 10.1007/978-3-642-60421-8
Calleja, M. L., Kerhervé, P., Bourgeois, S., Kedra, M., Leynaert, A., Devred, E., et al. (2017). Effects of increase glacier discharge on phytoplankton bloom dynamics and pelagic geochemistry in a high Arctic fjord. Prog. Oceanogr. 159, 195–210. doi: 10.1016/j.pocean.2017.07.005
Cape, M. R., Straneo, F., Beaird, N., Bundy, R. M., and Charette, M. A. (2019). Nutrient release to oceans from buoyancy-driven upwelling at Greenland tidewater glaciers. Nat. Geosci. 12, 34–39. doi: 10.1038/s41561-018-0268-4
Christensen, J. P., Smethie, W. M., and Devol, A. H. (1987). Benthic nutrient regeneration and denitrification on the Washington continental shelf. Deep Sea Res. Part A Oceanogr. Res. Pap. 34, 1027–1047. doi: 10.1016/0198-0149(87)90051-3
Codispoti, L. A., Kelly, V., Thessen, A., Matrai, P., Suttles, S., Hill, V., et al. (2013). Synthesis of primary production in the Arctic Ocean: III. Nitrate and phosphate based estimates of net community production. Prog. Oceanogr. 110, 126–150. doi: 10.1016/j.pocean.2012.11.006
Cottier, F. R., Nilsen, F., Skogseth, R., Tverberg, V., Skarð*hamar, J., and Svendsen, H. (2010). Arctic fjords: a review of the oceanographic environment and dominant physical processes. Geol. Soc. London, Spec. Publ. 344, 35–50. doi: 10.1144/SP344.4
Cottier, F. R., Tverberg, V., Inall, M., Svendsen, H., Nilsen, F., and Griffiths, C. (2005). Water mass modification in an Arctic fjord through cross-shelf exchange: the seasonal hydrography of Kongsfjorden, Svalbard. J. Geophys. Res. Ocean. 110, 1–18. doi: 10.1029/2004JC002757
Dallmann, W. K. (2015). Geoscience Atlas of Svalbard. Tromsø: Norwegian Polar Institute, Report 148.
Darlington, E. (2015). Meltwater Delivery from the Tidewater Glacier Kronebreen to Kongsfjorden, Svalbard; Insights from in situ and Remote-Sensing Analyses of sediment plumes (PhD Thesis). Loughborough University.
Eilertsen, H. C., Taasen, J. P., and Weslawski, J. M. (1989). Phytoplankton studies in the fjords of West Spitzbergen: physical environment and production in spring and summer. J. Plankton Res. 11, 1245–1260. doi: 10.1093/plankt/11.6.1245
Elverhøi, A., Liestøl, O., and Nagy, J. (1980). Glacial erosion, sedimentation and microfauna in the inner part of Kongsfjorden, Spitsbergen. Nor. Polarinst. Skr. 172, 33–58.
Everett, A., Kohler, J., Sundfjord, A., Kovacs, K. M., Torsvik, T., Pramanik, A., et al. (2018). Subglacial discharge plume behaviour revealed by CTD-instrumented ringed seals. Sci. Rep. 8:13467. doi: 10.1038/s41598-018-31875-8
Fransson, A., Chierici, M., Nomura, D., Granskog, M. A., Kristiansen, S., Martma, O., et al. (2015). Effect of glacial drainage water on the CO2 system and ocean acidification state in an Arctic tidewater-glacier fjord during two contrasting years. J. Geophys. Res. Ocean. 120, 2413–2429. doi: 10.1002/2014JC010320
Gihring, T. M., Lavik, G., Kuypers, M. M. M., and Kostka, J. E. (2010). Direct determination of nitrogen cycling rates and pathways in Arctic fjord sediments (Svalbard, Norway). Limnol. Oceanogr. 55, 740–752. doi: 10.4319/lo.2010.55.2.0740
Glibert, P. M., Wilkerson, F. P., Dugdale, R. C., Raven, J. A., Dupont, C. L., Leavitt, P. R., et al. (2016). Pluses and minuses of ammonium and nitrate uptake and assimilation by phytoplankton and implications for productivity and community composition, with emphasis on nitrogen-enriched conditions. Limnol. Oceanogr. 61, 165–197. doi: 10.1002/lno.10203
Graves, S., Piepho, H.-P., Selzer, L., and Dorai-Raj, S. (2015). multcompView: Visualizations of Paired Comparisons. R Package Version 0.1-7. Available online at: https://CRAN.R-project.org/package=multcompView
Hagebø, M., and Rey, F. (1984). Lagring av sjøvann til analyse av næringssalter. English summary. Fisk. Havet 4:12.
Hegseth, E. N., Assmy, P., Wiktor, J., Kristiansen, S., Leu, E., Piquet, A. M.-T., et al. (2019). “Phytoplankton seasonal dynamics in Kongsfjorden, Svalbard and the adjacent shelf,” in The Ecosystem of Kongsfjorden, Svalbard, Advances in Polar Ecology 2, eds H. Hop and C. Wiencke (Cambridge: Springer), 173–228.
Hegseth, E. N., and Tverberg, V. (2013). Effect of Atlantic water inflow on timing of the phytoplankton spring bloom in a high Arctic fjord (Kongsfjorden, Svalbard). J. Mar. Syst. 113–114, 94–105. doi: 10.1016/j.jmarsys.2013.01.003
Herberich, E., Sikorski, J., and Hothorn, T. (2010). A robust procedure for comparing multiple means under heteroscedasticity in unbalanced designs. PLoS ONE 5:e9788. doi: 10.1371/journal.pone.0009788
Hodal, H., Falk-Petersen, S., Hop, H., Kristiansen, S., and Reigstad, M. (2012). Spring bloom dynamics in Kongsfjorden, Svalbard: Nutrients, phytoplankton, protozoans and primary production. Polar Biol. 35, 191–203. doi: 10.1007/s00300-011-1053-7
Hodder, K., Gilbert, R., and Desloges, J. R. (2007). Assessment of varved glaciolacustrine sedimentary records as hydroclimatic proxy. J. Paleolimnol. 38, 365–394. doi: 10.1007/s10933-006-9083-9
Hodson, A. J., Mumford, P. N., Kohler, J., and Wynn, P. M. (2005). The High Arctic glacial ecosystem: new insights from nutrient budgets. Biogeochemistry 72, 233–256. doi: 10.1007/s10533-004-0362-0
Holland, D. M., and Jenkins, A. (1999), Modeling thermodynamic ice-ocean interactions at the base of an ice shelf. J. Phys. Oceanogr. 29, 1787–1800. doi: 10.1175/1520-0485(1999)029<1787:MTIOIA>2.0.CO;2
Hop, H., Pearson, T. H., Hegset, E. N., Kovacs, K. M., Wiencke, C., Kwasniewski, S., et al. (2002). The marine ecosystem of Kongsfjorden, Svalbard. Polar Res. 21, 167–208. doi: 10.1111/j.1751-8369.2002.tb00073.x
Hop, H., Wold, A., Vihtakari, M., Daase, M., Kwasniewski, S., Gluchowska, M., et al. (2019). “Zooplankton in Kongsfjorden (1996-2016) in relation to climate change,” in The Ecosystem of Kongsfjorden, Svalbard, Advances in Polar Ecology 2, eds H. Hop and C. Wiencke (Cambridge: Springer), 229–302.
Hopwood, M. J., Carroll, D., Browning, T. J., Meire, L., Mortensen, J., Krisch, S., et al. (2018). Non-linear response of summertime marine productivity to increased meltwater discharge around Greenland. Nat. Commun. 9:3256. doi: 10.1038/s41467-018-05488-8
Hothorn, T., Bretz, F., and Westfall, P. (2008). Simultaneous inference in general parametric models. Biomet. J. 50, 346–363. doi: 10.1002/bimj.200810425
How, P., Benn, D. I., Hulton, N. R. J., Hubbard, B., Luckman, A., Sevestre, H., et al. (2017). Rapidly changing subglacial hydrological pathways at a tidewater glacier revealed through simultaneous observations of water pressure, supraglacial lakes, meltwater plumes and surface velocities. Cryosphere 11, 2691–2710. doi: 10.5194/tc-11-2691-2017
IPCC (2014). “Climate change 2014: synthesis report,” in Contribution of Working Groups I, II and III to the Fifth Assessment Report of the Intergovernmental Panel on Climate Change, eds Core Writing Team, R. K. Pachauri, and L. A. Meyer (Geneva: IPCC), 151.
Iversen, K. R., and Seuthe, L. (2011). Seasonal microbial processes in a high-latitude fjord (Kongsfjorden, Svalbard): I. Heterotrophic bacteria, picoplankton and nanoflagellates. Polar Biol. 34, 731–749. doi: 10.1007/s00300-010-0929-2
Johnsen, G., and Sakshaug, E. (2007). Biooptical characteristics of PSII and PSI in 33 species (13 pigment groups) of marine phytoplankton, and the relevance for pulseamplitude-modulated and fast-repetition-rate fluorometry. J. Phycol. 43, 1236–1251. doi: 10.1111/j.1529-8817.2007.00422.x
Juul-Pedersen, T., Arendt, K. E., Mortensen, J., Blicher, M. E., Søgaard, D. H., and Rysgaard, S. (2015). Seasonal and interannual phytoplankton production in a sub-Arctic tidewater outlet glacier fjord, SW Greenland. Mar. Ecol. Prog. Ser. 524, 27–38. doi: 10.3354/meps11174
Kanna, N., Sugiyama, S., Ohashi, Y., Sakakibara, D., Fukamachi, Y., and Nomura, D. (2018). Upwelling of macronutrients and dissolved inorganic carbon by a subglacial freshwater driven plume in bowdoin fjord, Northwestern Greenland. J. Geophys. Res. Biogeosci. 123, 1666–1682. doi: 10.1029/2017JG004248
Kelley, D., and Richards, C. (2018). Oce: Analysis of Oceanographic Data. R package version 1.0. Available online at: https://cran.r-project.Q19org/package=oce.
Kirk, J. T. O. (2011). Light and Photosynthesis in Aquatic Ecosystems, 3. Edn. Cambridge: Cambridge University Press.
Knap, A., Michaels, A., Close, A., Ducklow, H., and Dickson, A. (1996). Measurement of chlorophylla and phaeopigments by fluorometric analysis. JGOFS Rep. 19, 118–122.
Kohler, J., James, T. D., Murray, T., Nuth, C., Brandt, O., Barrand, N. E., et al. (2007). Acceleration in thinning rate on western Svalbard glaciers. Geophys. Res. Lett. 34, 1–5. doi: 10.1029/2007GL030681
Kumar, V., Tiwari, M., Nagoji, S., and Tripathi, S. (2016). Evidence of anomalously low δ13C of marine organic matter in an Arctic fjord. Sci. Rep. 6:36192. doi: 10.1038/srep36192
Lydersen, C., Assmy, P., Falk-Petersen, S., Kohler, J., Kovacs, K., Reigstad, M., et al. (2014). The importance of tidewater glaciers for marine mammals and seabirds in Svalbard, Norway. Appl. Ocean Res. 31, 90–100. doi: 10.1016/j.jmarsys.2013.09.006
Maksymowska-Brossard, D., and Piekarek-Jankowska, H. (2001). Seasonal variability of benthic ammonium release in the surface sediments of the gulf of Gdansk (southern Baltic Sea). Oceanologia 43, 113–136.
Mankoff, K. D., Straneo, F., Cenedese, C., Das, S. B., Richards, C. G., Singh, et al. (2016). Structure and dynamics of a subglacial discharge plume in a Greenlandic fjord. J. Geophys. Res. Ocean. 121, 8670–8688. doi: 10.1002/2016JC011764
Meire, L., Meire, P., Struyf, E., Krawczyk,1, D. W., Arendt,1, K. E., Yde, J. C., et al. (2016a). High export of dissolved silica from the Greenland Ice Sheet. Geophys. Res. Lett. 43, 9173–9182. doi: 10.1002/2016GL070191
Meire, L., Mortensen, J., Meire, P., Juul-Pedersen, T., Sejr, M. K., Rysgaard, S., et al. (2017). Marine-terminating glaciers sustain high productivity in Greenland fjords. Glob. Chang. Biol. 23, 5344–5357. doi: 10.1111/gcb.13801
Meire, L., Mortensen, J., Rysgaard, S., Bendtsen, J., Boone, W., Meire, P., et al. (2016b). Spring bloom dynamics in a subarctic fjord influenced by tidewater outlet glaciers (Godthåbsfjord, SW Greenland). J. Geophys. Res. Biogeosci. 121, 1581–1592. doi: 10.1002/2015JG003240
Meslard, F., Bourrin, F., Many, G., and Kerhervé, P. (2018). Suspended particle dynamics and fluxes in an Arctic fjord (Kongsfjorden, Svalbard). Estuar. Coast. Shelf Sci. 204, 212–224. doi: 10.1016/j.ecss.2018.02.020
Morel, A., Lazzara, L., and Gostan, J. (1987). Growth rate and quantum yield time response for a diatom to changing irradiances (energy and color). Limnol. Oceanogr. 32, 1066–1084. doi: 10.4319/lo.1987.32.5.1066
Morton, B. R., Taylor, G., and Turner, J. S. (1956). Turbulent gravitational convection from maintained and instantaneous sources. Proc. R. Soc. A Math. Phys. Eng. Sci. 234, 1–23. doi: 10.1098/rspa.1956.0011
Motyka, R. J., Hunter, L., Echelmeyer, K. A., and Connor, C. (2003). Submarine melting at the terminus of a temperate tidewater glacier, LeConte Glacier, Alaska, U.S.A. Ann. Glaciol. 36, 57–65. doi: 10.3189/172756403781816374
Nordli, Ø., Przybylak, R., Ogilvie, A. E. J., and Isaksen, K. (2014). Long-term temperature trends and variability on Spitsbergen: the extended Svalbard Airport temperature series, 1898-2012. Polar Res. 33, 21349:1–23. doi: 10.3402/polar.v33.21349
Nuth, C., Kohler, J., König, M., von Deschwanden, A., Hagen, J. O., Kääb, A., et al. (2013). Decadal changes from a multi-temporal glacier inventory of Svalbard. Cryosphere. 7, 1603–1621. doi: 10.5194/tc-7-1603-2013
Olli, K., Heiskanen, A. S., and Seppala, J. (1996). Development and fate of Eutreptiella gymnastica bloom in nutrient-enriched enclosures in the coastal Baltic Sea. J. Plankton Res. 18, 1587–1604. doi: 10.1093/plankt/18.9.1587
Østby, T. I., Vikhamar Schuler, T., Ove Hagen, J., Hock, R., Kohler, J., and Reijmer, C. H. (2017). Diagnosing the decline in climatic mass balance of glaciers in Svalbard over 1957-2014. Cryosphere 11, 191–215. doi: 10.5194/tc-11-191-2017
Pavlov, A. K., Leu, E., Hanelt, D., Bartsch, I., Karsten, U., Hudson, S. R., et al. (2019). “The underwater light climate in Kongsfjorden and its ecological implications,” in The Ecosystem of Kongsfjorden, Svalbard, Advances in Polar Ecology 2, eds H. Hop and C. Wiencke, (Cambridge: Springer), 137–172.
Pavlova, O., Gerland, S., and Hop, H. (2019). “Changes in sea-ice extent and thickness in Kongsfjorden, Svalbard,” in The Ecosystem of Kongsfjorden, Svalbard, Advances in Polar Ecology 2, eds H. Hop and C. Wiencke (Cambridge: Springer), 105–136.
Piquet, A. M.-T., Scheepens, J. F., Bolhuis, H., Wiencke, C., and Buma, A. G. J. (2010). Variability of protistan and bacterial communities in two Arctic fjords (Spitsbergen). Polar Biol. 33, 1521–1536. doi: 10.1007/s00300-010-0841-9
Piquet, A. M.-T., van de Poll, W. H., Visser, R. J. W., Wiencke, C., Bolhuis, H., and Buma, A. G. J. (2014). Springtime phytoplankton dynamics in Arctic Krossfjorden and Kongsfjorden (Spitsbergen) as a function of glacier proximity. Biogeosciences 11, 2263–2279. doi: 10.5194/bg-11-2263-2014
Piwosz, K., Walkusz, W., Hapter, R., Wieczorek, P., Hop, H., and Wiktor, J. (2009). Comparison of productivity and phytoplankton in a warm (Kongsfjorden) and a cold (Hornsund) Spitsbergen fjord in mid-summer 2002. Polar Biol. 32, 549–559. doi: 10.1007/s00300-008-0549-2
Pramanik, A., Van Pelt, W., Kohler, J., and Schuler, T. V. (2018). Simulating climatic mass balance, seasonal snow development and associated freshwater runoff in the Kongsfjord basin, Svalbard (1980–2016). J. Glaciol. 64, 943–956. doi: 10.1017/jog.2018.80
R Core Team (2019). R: A Language and Environment for Statistical Computing. Version 3.5. Vienna: R Foundation for Statistical Computing. Available online at: https://www.R-project.org/.
Raven, J. A., Wollenweber, B., and Handley, L. L. (1992). A comparison of ammonium and nitrate as nitrogen sources for photolithotrophs. N. Phytol. 121, 19–32. doi: 10.1111/j.1469-8137.1992.tb01088.x
Schauer, U., Fahrbach, E., Osterhus, S., and Rohardt, G. (2004). Arctic warming through the Fram Strait: oceanic heat transport from 3 years of measurements. J. Geophys. Res. 109, C06026:1–14. doi: 10.1029/2003JC001823
Schild, K. M., Renshaw, C. E., Benn, D. I., Luckman, A., Hawley, R. L., How, P., et al. (2018). Glacier calving rates due to subglacial discharge, fjord circulation, and free convection. J. Geophys. Res. 123, 2189–2204. doi: 10.1029/2017JF004520
Schulz, H. D., and Zabel, M. (2006). “Quantification of early diagenesis: dissolved constituents in pore water and signals in the solid phase,” in Marine Geochemistry, eds H. D. Schulz and M. Zabel (Berlin; Heidelberg: Springer Verlag), 75–124.
Seeberg-Elverfeldt, J., Schlüter, M., Feseker, T., and Kölling, M. (2005). Rhizon sampling of porewaters near the sediment-water interface of aquatic systems. Limnol. Oceanogr. Meth. 3, 361–371. doi: 10.4319/lom.2005.3.361
Sevilgen, D. S., De Beer, D., Al-Handal, A. Y., Brey, T., and Polerecky, L. (2014). Oxygen budgets in subtidal arctic (Kongsfjorden, Svalbard) and temperate (Helgoland, North Sea) microphytobenthic communities. Mar. Ecol. Prog. Ser. 504, 27–42. doi: 10.3354/meps10672
Slater, D., Nienow, P. W., Sole, A., Cowton, T. R., Mottram, R., Langen, P., et al. (2017). Spatially distributed runoff at the grounding line of a large Greenlandic tidewater glacier inferred from plume modelling. J. Glaciol. 63, 309–323. doi: 10.1017/jog.2016.139
Smith, N. D. (1978). Sedimentation processes and patterns in a glacier-fed lake with low sediment input. Can. J. Earth Sci. 15, 741–756. doi: 10.1139/e78-081
Solorzano, I. (1969). Determination of ammonia in natural seawater by the phenol-hypochlorite method. Limnol. Oceanogr. 14, 799–801. doi: 10.4319/lo.1969.14.5.0799
Straneo, F., Curry, R. G., Sutherland, D. A., Hamilton, G. S., Cenedese, C., Våge, K., et al. (2011). Impact of fjord dynamics and glacial runoff on the circulation near Helheim Glacier. Nat. Geosci. 4, 322–327. doi: 10.1038/ngeo1109
Sund, M., Eiken, T., and Rolstad Denby, C. (2011). Velocity structure, front position changes and calving of the tidewater glacier Kronebreen, Svalbard. Cryosph. Discuss. 5, 41–73. doi: 10.5194/tcd-5-41-2011
Sundfjord, A., Cottier, F., Nilsen, F., Asplin, L., Cottier, F., Nilsen, F. A. L., et al. (2017). Effects of glacier runoff and wind on surface layer dynamics and Atlantic Water exchange in Kongsfjorden, Svalbard; a model study. Estuar. Coast. Shelf Sci. 187, 260–272. doi: 10.1016/j.ecss.2017.01.015
Svendsen, H., Beszczynska-Møller, A., Hagen, J. O., Lefauconnier, B., Tverberg, V., Gerland, S., et al. (2002). The physical environment of Kongsfjorden – Krossfjorden, an Arctic fjord system in Svalbard. Polar Res. 21, 133–166. doi: 10.3402/polar.v21i1.6479
Syvitski, J. P. M. (1989). On the deposition of sediment within glacier-influenced fjords: Oceanographic controls. Mar. Geol. 85, 301–329. doi: 10.1016/0025-3227(89)90158-8
Syvitski, J. P. M., Burrell, D. C., and Skei, J. M. (1987). Fjords: Processes and Products. New York, NY: Springer Verlag. doi: 10.1007/978-1-4612-4632-9
Tamelander, T., Reigstad, M., Olli, K., Slagstad, D., and Wassmann, P. (2013). New production regulates export stoichiometry in the ocean. PLoS ONE 8:e54027. doi: 10.1371/journal.pone.0054027
Torsvik, T., Albretsen, J., Sundfjord, A., Kohler, J., Sandvik, A. D., Skarðhamar, J., et al. (2019). Impact of tidewater glacier retreat on the fjord system: modeling present and future circulation in Kongsfjorden, Svalbard. Estuar. Coast. Shelf Sci. 220, 152–165. doi: 10.1016/j.ecss.2019.02.005
Tsuji, T., and Yanagita, T. (1981). Improved fluorescent microscopy for measuring the standing stock of phytoplankton including fragile components. Mar. Biol. 64, 207–211. doi: 10.1007/BF00397110
Urbanski, J. A., Stempniewicz, L., Wesławski, J. M., Draganska-Deja, K., Wochna, A., Goc, M., et al. (2017). Subglacial discharges create fluctuating foraging hotspots for sea birds in tidewater glacier bays. Sci. Rep. 7:43999. doi: 10.1038/srep43999
van de Poll, W. H., Kulk, G., Rozema, P. D., Brussaard, C. P. D., Visser, J. W., and Buma, A. G. J. (2018). Contrasting glacial meltwater effects on post-bloom phytoplankton on temporal and spatial scales in Kongsfjorden, Spitsbergen. Elem. Sci. Anthr. 6:50. doi: 10.1525/elementa.307
van de Poll, W. H., Maat, D., Fischer, P., Rozema, P., Daly, O., Koppelle, S., et al. (2016). Atlantic Advection Driven Changes in Glacial Meltwater: Effects on Phytoplankton Chlorophyll-a and Taxonomic Composition in Kongsfjorden, Spitsbergen. Front. Mar. Sci. 3:200. doi: 10.3389/fmars.2016.00200
Walczowski, W., Beszczynska-Möller, A., Wieczorek, P., Merchel, M., and Grynczel, A. (2017). Oceanographic observations in the Nordic sea and fram strait in 2016 under the IO PAN long-term monitoring program AREX. Oceanologia 59, 187–194. doi: 10.1016/j.oceano.2016.12.003
Wynn, P. M., Hodson, A. J., Heaton, T. H. E., and Chenery, S. R. (2007). Nitrate production beneath a High Arctic glacier, Svalbard. Chem. Geol. 244, 88–102. doi: 10.1016/j.chemgeo.2007.06.008
Keywords: sediment, geology, light, ammonium, glacial meltwater, nutrients, Svalbard, Kongsfjorden
Citation: Halbach L, Vihtakari M, Duarte P, Everett A, Granskog MA, Hop H, Kauko HM, Kristiansen S, Myhre PI, Pavlov AK, Pramanik A, Tatarek A, Torsvik T, Wiktor JM, Wold A, Wulff A, Steen H and Assmy P (2019) Tidewater Glaciers and Bedrock Characteristics Control the Phytoplankton Growth Environment in a Fjord in the Arctic. Front. Mar. Sci. 6:254. doi: 10.3389/fmars.2019.00254
Received: 07 November 2018; Accepted: 29 April 2019;
Published: 31 May 2019.
Edited by:
Alberto Basset, University of Salento, ItalyReviewed by:
Raquel Vaquer-Sunyer, Instituto Mediterráneo de Estudios Avanzados, SpainSai Elangovan S, National Institute of Oceanography (CSIR), India
Copyright © 2019 Halbach, Vihtakari, Duarte, Everett, Granskog, Hop, Kauko, Kristiansen, Myhre, Pavlov, Pramanik, Tatarek, Torsvik, Wiktor, Wold, Wulff, Steen and Assmy. This is an open-access article distributed under the terms of the Creative Commons Attribution License (CC BY). The use, distribution or reproduction in other forums is permitted, provided the original author(s) and the copyright owner(s) are credited and that the original publication in this journal is cited, in accordance with accepted academic practice. No use, distribution or reproduction is permitted which does not comply with these terms.
*Correspondence: Philipp Assmy, philipp.assmy@npolar.no