Validation of the in vivo Iodo-Nitro-Tetrazolium (INT) Salt Reduction Method as a Proxy for Plankton Respiration
 E. Elena García-Martín1*
  María Aranguren-Gassis2
  David M. Karl3
  Sandra Martínez-García2
  Carol Robinson1
  Pablo Serret2,4
  Eva Teira2
- 1Centre for Ocean and Atmospheric Sciences, School of Environmental Science, University of East Anglia, Norwich, United Kingdom
- 2Departamento de Ecología y Biología Animal, Universidad de Vigo, Vigo, Spain
- 3School of Ocean and Earth Science and Technology, Department of Oceanography, University of University of Hawai‘i at Mānoa, Honolulu, HI, United States
- 4Estación de Ciencias Marinas de Toralla, Universidad de Vigo, Vigo, Spain
Knowledge of the magnitude and variability of plankton respiration is a crucial gap in our understanding of marine carbon cycling. In order to validate the INT reduction method as a proxy for plankton respiration, we have compiled and analyzed a dataset (n = 376) of concurrent measurements of dissolved oxygen consumption (CRO2) and in vivo reduction of 2-para (iodophenyl)-3(nitrophenyl)-5(phenyl) tetrazolium chloride tetrazolium salt (INT) spanning a wide range of oceanic regions and physicochemical conditions. Data were randomly divided into two independent subgroups: two thirds of the data were used to derive a regression conversion between dissolved oxygen consumption and INT reduction (“training” dataset) and one third of the data was used to validate the regression (“test” dataset). There was a significant relationship between the log-transformed dissolved oxygen consumption rates and the log-transformed INT reduction rates (INTT) with the “training” dataset (logCRO2 = 0.72logINTT + 0.44, R2 = 0.69, n = 249, p < 0.001). The estimated oxygen consumption rates obtained applying the former equation were compared to the measured dissolved oxygen consumption rates from the “test” dataset which spans over three orders of magnitude range of respiration rates. There was no significant difference between the measured and estimated dissolved oxygen consumption rates, indicating that the INT reduction method can be used as a proxy for respiration in natural plankton communities. Further analysis dividing the data by temperature and chlorophyll-a concentration, indicated that the predictive capacity of the empirical conversion equation is increased at temperatures >8∘C and chlorophyll-a concentrations >0.2 μg L-1 and reduced at lower temperatures and chlorophyll-a concentrations. The results of this study endorse the adequate performance and reliability of the INT method for natural plankton communities.
Introduction
Accurate quantification of plankton respiration is important for determining carbon budgets in marine systems (Jahnke and Craven, 1995; Robinson and Williams, 2005), to study the metabolic state of different plankton communities (Williams, 1998; del Giorgio and Duarte, 2002; Serret et al., 2015) and to enable more accurate predictions of the biogeochemical responses to future climate change (Padfield et al., 2016). Standard procedures to estimate plankton community respiration are based on the decrease in dissolved oxygen concentration in an enclosed sample over time (in vitro oxygen consumption rates) (Williams and Jenkinson, 1982; Robinson and Williams, 2005). This procedure has several limitations including the low sensitivity of the technique requiring long (<24 h) incubation times, a high number of replicates, the assumption of linear consumption of oxygen over time (Robinson and Williams, 2005), pre-incubation filtration for size-fractionated respiration rates, and the potential bias of the “bottle effect” (Pomeroy et al., 1994; Gattuso et al., 2002; Briand et al., 2004; Robinson and Williams, 2005; García-Martín et al., 2011). All these biases restrict the temporal and spatial coverage of the extant respiration dataset, and therefore knowledge of its variability (Serret et al., 2015). Alternative methods based on the reduction of a tetrazolium salt by the cellular electron transport system (in vitro ETS and in vivo ETS) have also been used to estimate respiration in natural and cultured plankton communities (Packard, 1971; Båmstedt, 2000; Martínez-García et al., 2009). Both methods are based on the reduction of the 2-para (iodophenyl)-3(nitrophenyl)-5(phenyl) tetrazolium chloride (INT) salt inside the plankton cells and the subsequent quantitative spectrophotometric analysis of the reduced salt (formazan). However, while the in vitro ETS quantifies the maximum INT reduction by the enzymes indicating the maximum potential respiration of the plankton cells (Packard, 1971); the in vivo ETS provides a more realistic estimate of the actual respiration of intact plankton cells (Martínez-García et al., 2009). The in vivo ETS method has several advantages over the determination of changes in dissolved O2 during an incubation. It requires a shorter incubation period (<1–4 h) (Martínez-García et al., 2009) compared to the dissolved oxygen technique and, therefore, it is determined over a similar time scale to other metabolic rates such as bacterial production. In addition, there is no disturbance of the plankton community structure when used to determine the respiration of a size-class of the plankton community (for example, the respiration of a <0.8 μm size class, considered to be predominantly bacteria) as it does not involve physical separation of the cells prior to incubation.
Despite its potential advantages, the method also has limitations based on the non-specificity of the reduction of INT by the electron transport system (Smith and McFeters, 1997; Maldonado et al., 2012) and the decline of the kinetic reduction with time due to the toxicity of the INT to the organisms (Hatzinger et al., 2003; Villegas-Mendoza et al., 2015). The INT salt can be intracellularly reduced in the ETS by succinate dehydrogenase (Nachlas et al., 1960; Smith and McFeters, 1997), by other non-ETS enzymes (Berridge et al., 2005) and by reducing agents such as cysteine and ascorbic acid which often occur within the cells (Maldonado et al., 2012). Consequently, Maldonado et al. (2012) suggested that the method should not be called an in vivo ETS method due to the lack of enzymatic specificity. The method was therefore re-named as the in vivo INT reduction method (García-Martín et al., 2014a, 2017; Martínez-García et al., 2015; Martínez-García and Karl, 2015).
Despite its limitations, the empirical validation of the INT reduction method as a proxy for respiration would allow the quantification of the amount of carbon cycled or stored in the ocean, and enable improved projections of ocean deoxygenation. There is no standard, unequivocal method available for plankton respiration, and all the existing methodologies have biases. Therefore, when validating the INT reduction method against the dissolved oxygen consumption method we have to assume that the latter provides the correct respiration rate, although in practice we know that this is not always the case (Aranguren-Gassis et al., 2012).
In this study we present an extensive comparative analysis of concurrent measurements of dissolved oxygen consumption rates and INT reduction rates of natural plankton communities spanning a wide range of oceanographic regions with different physicochemical conditions, provide an empirical conversion equation to derive O2 consumption rates from INT reduction rates and confirm the validity of the method as a proxy for plankton respiration measurements.
Materials and Procedures
The present study includes data from 9 oceanographic cruises and 11 microcosm experiments (Teira et al., 2010, 2012; Martínez-García et al., 2010, 2013; Martínez-García and Karl, 2015; García-Martín et al., 2014b, 2017, 2018). The regions sampled during the oceanographic cruises included the North, Norwegian and Greenland Seas, the Atlantic Ocean and the North Pacific Subtropical Gyre (see Table 1 for details of the locations and seasons). Water samples were collected pre-dawn in Niskin bottles from the epipelagic ocean (between the surface and the depth where incident photosynthetically active irradiance is reduced to 0.1%) and then transferred into 10 L carboys.
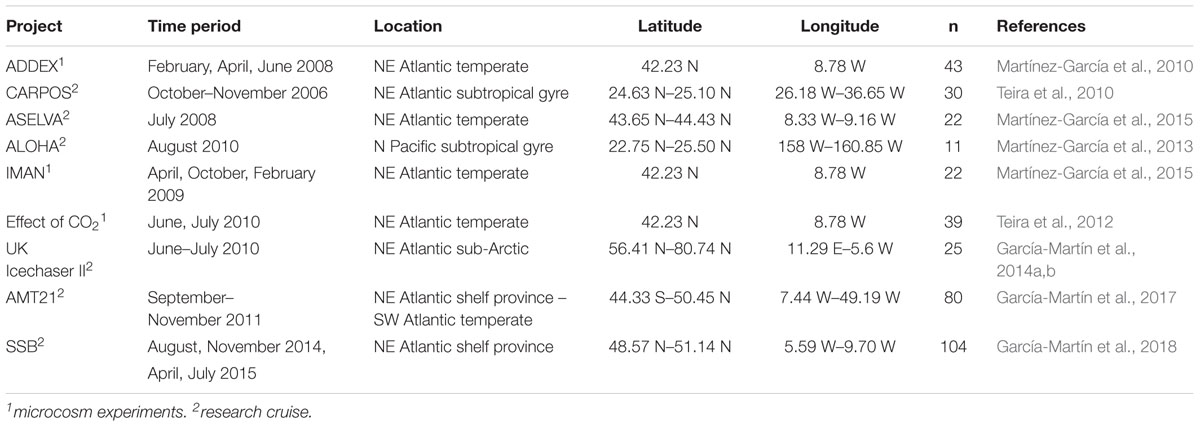
Table 1. Description of the project, time of the year, location, number of data points (n) and references of the different projects.
During the microcosm experiments, seawater was collected from coastal or shelf sea stations (see Table 1 for details of the locations and seasons) in Niskin bottles and transferred into 10–12 L acid-washed plastic carboys. Carboys were maintained in a temperature controlled room at in situ temperature ± 0.5°C, on rollers with a gentle rotation to prevent cell sedimentation, under a 10:14 or 12:12 light:dark period. Subsampling for the in vitro changes in dissolved O2 concentration and for the reduction of INT was completed before the start of the light period (simulating the pre-dawn conditions from the oceanographic cruises), during 3–4 consecutive days. Only the control treatments, carboys with natural sea water and without additions, are considered in this manuscript.
Sampling for in vitro changes in dissolved O2 concentration and by the reduction of 2-para (iodophenyl)-3(nitrophenyl)-5(phenyl) tetrazolium chloride tetrazolium salt (INT) occurred concurrently or immediately after each other. The incubation time started at the same time for both techniques (24 h for O2 consumption, <5 h for INT reduction). The same protocols were used for each technique between projects (see below). However, there were several adjustments between experiments, such as different types of bottles (plastic or glass for the INT method), sample volume (100–250 mL sample for INT and 60 or 125 mL bottles for O2 consumption) and incubation time (<0.5–5 h for INT).
We have only considered data for analysis where the average rate was greater than two-times the standard error of the mean (376 out of 434 data points).
Dissolved Oxygen Consumption
Plankton community respiration (referred to hereafter as CRO2) was measured by monitoring the decrease in oxygen concentration after a 24 h dark bottle incubation. Dissolved oxygen concentration was measured by automated Winkler titration performed with a Metrohm Titrino titrator, utilizing a potentiometric (Oudot et al., 1988) or optical end point detector (Carritt and Carpenter, 1966). Eight/ten gravimetrically calibrated 60 or 125 mL borosilicate glass bottles were carefully filled with water. Water was allowed to overflow during the filling, and special care was taken to prevent air bubble formation in the silicone tube. For the measurement of initial oxygen concentrations (tzero), four/five replicate bottles were fixed immediately with Winkler reagents [0.5 or 1 ml of 3 M MnSO4 and 0.5 or 1 ml of 8 M KOH + 4 M KI (or 8 M NaOH +4 M NaI) solutions]. The remaining four/five bottles were incubated for 24 h in darkened temperature controlled incubators located on deck or inside a temperature controlled room. Incubation temperatures were maintained at in situ values ±1°C by chilled water from a temperature-controlled water bath. After 24 h, the four/five dark bottles were fixed for the measurement of final oxygen concentrations (t24). CRO2 rates were calculated from the difference in oxygen concentration between the average of the replicate “tzero” measurements and the average of the replicate “t24” measurements, assuming a linear decrease over 24 h:
In vivo INT Reduction
Following Martínez-García et al. (2009), four or five 100–250 mL polypropylene or glass bottles were filled with seawater. One or two replicates were immediately fixed by adding formaldehyde (2% w/v final concentration) and used as control(s). Formaldehyde was filtered by 0.2 μm in those cases when precipitated crystals were observed in the formaldehyde stock. Twenty minutes later, the three samples + control(s) were inoculated with a sterile solution of 7.9 mM INT. The final concentration of the INT addition was 0.2 mM for all the samples. This final concentration was adopted following the results presented in Martínez-García et al. (2009) who observed no differences between samples incubated at three different INT concentrations (0.2, 0.4, and 0.8 mM). The lowest INT concentration was selected in order to minimize a possible effect of the INT at high concentrations. The solution was freshly prepared for each experiment using Milli-Q water. Samples + control(s) were incubated for 0.33–5 h in the same incubators as the dissolved oxygen samples. The incubation time was chosen based on the results of an incubation time series experiment as described in Martínez-García et al. (2009) (see below). At the end of the incubation, formaldehyde was added to the three replicate samples, as for the control(s). All samples [replicate + control(s)] were sequentially filtered through 0.8 and onto 0.2 μm pore size polycarbonate filters. The filters were then air-dried and stored frozen in 1.5 mL cryovials at –20°C until further processing. The reduced INT (formazan, INTf) retained on each filter was extracted with 1-propanol by means of sonication in an ultrasound bath for about 20 min at 30–40°C followed by thorough mixing with a vortex mixer. The propanol-formazan extract was then transferred to microcentrifuge vials and centrifuged at 13200 g for 10 min at 18°C. The INT formazan concentration in each size fraction (i.e., >0.8 μm and 0.2–0.8 μm) was derived from the absorbance at 485 nm determined using a spectrophotometer (either a Beckman model DU640, a Perkin Elmer Lambda 35, or an Shimadzu UltraViolet-2401 PC depending on the study). The absorbance of the control samples (assumed to be due to coloration not related to metabolism, and so termed non-metabolic absorbance) was deducted from the absorbance of the replicate live incubated samples:
The spectrophotometers were calibrated with serial dilutions of pure iodonitrotetrazolium violet formazan salt (Sigma) dissolved in 1-propanol. The coefficients of determination of the linear calibration equations were always greater than 0.995. The total INT reduction rate (INTT) in μmol INTf L-1 h-1 is calculated from the sum of the total INT reduction in the two size fractions (INT0.2-0.8 and INT>0.8) (Figure 1). The INT reduction rate in each size fraction is obtained by applying the following formulae:
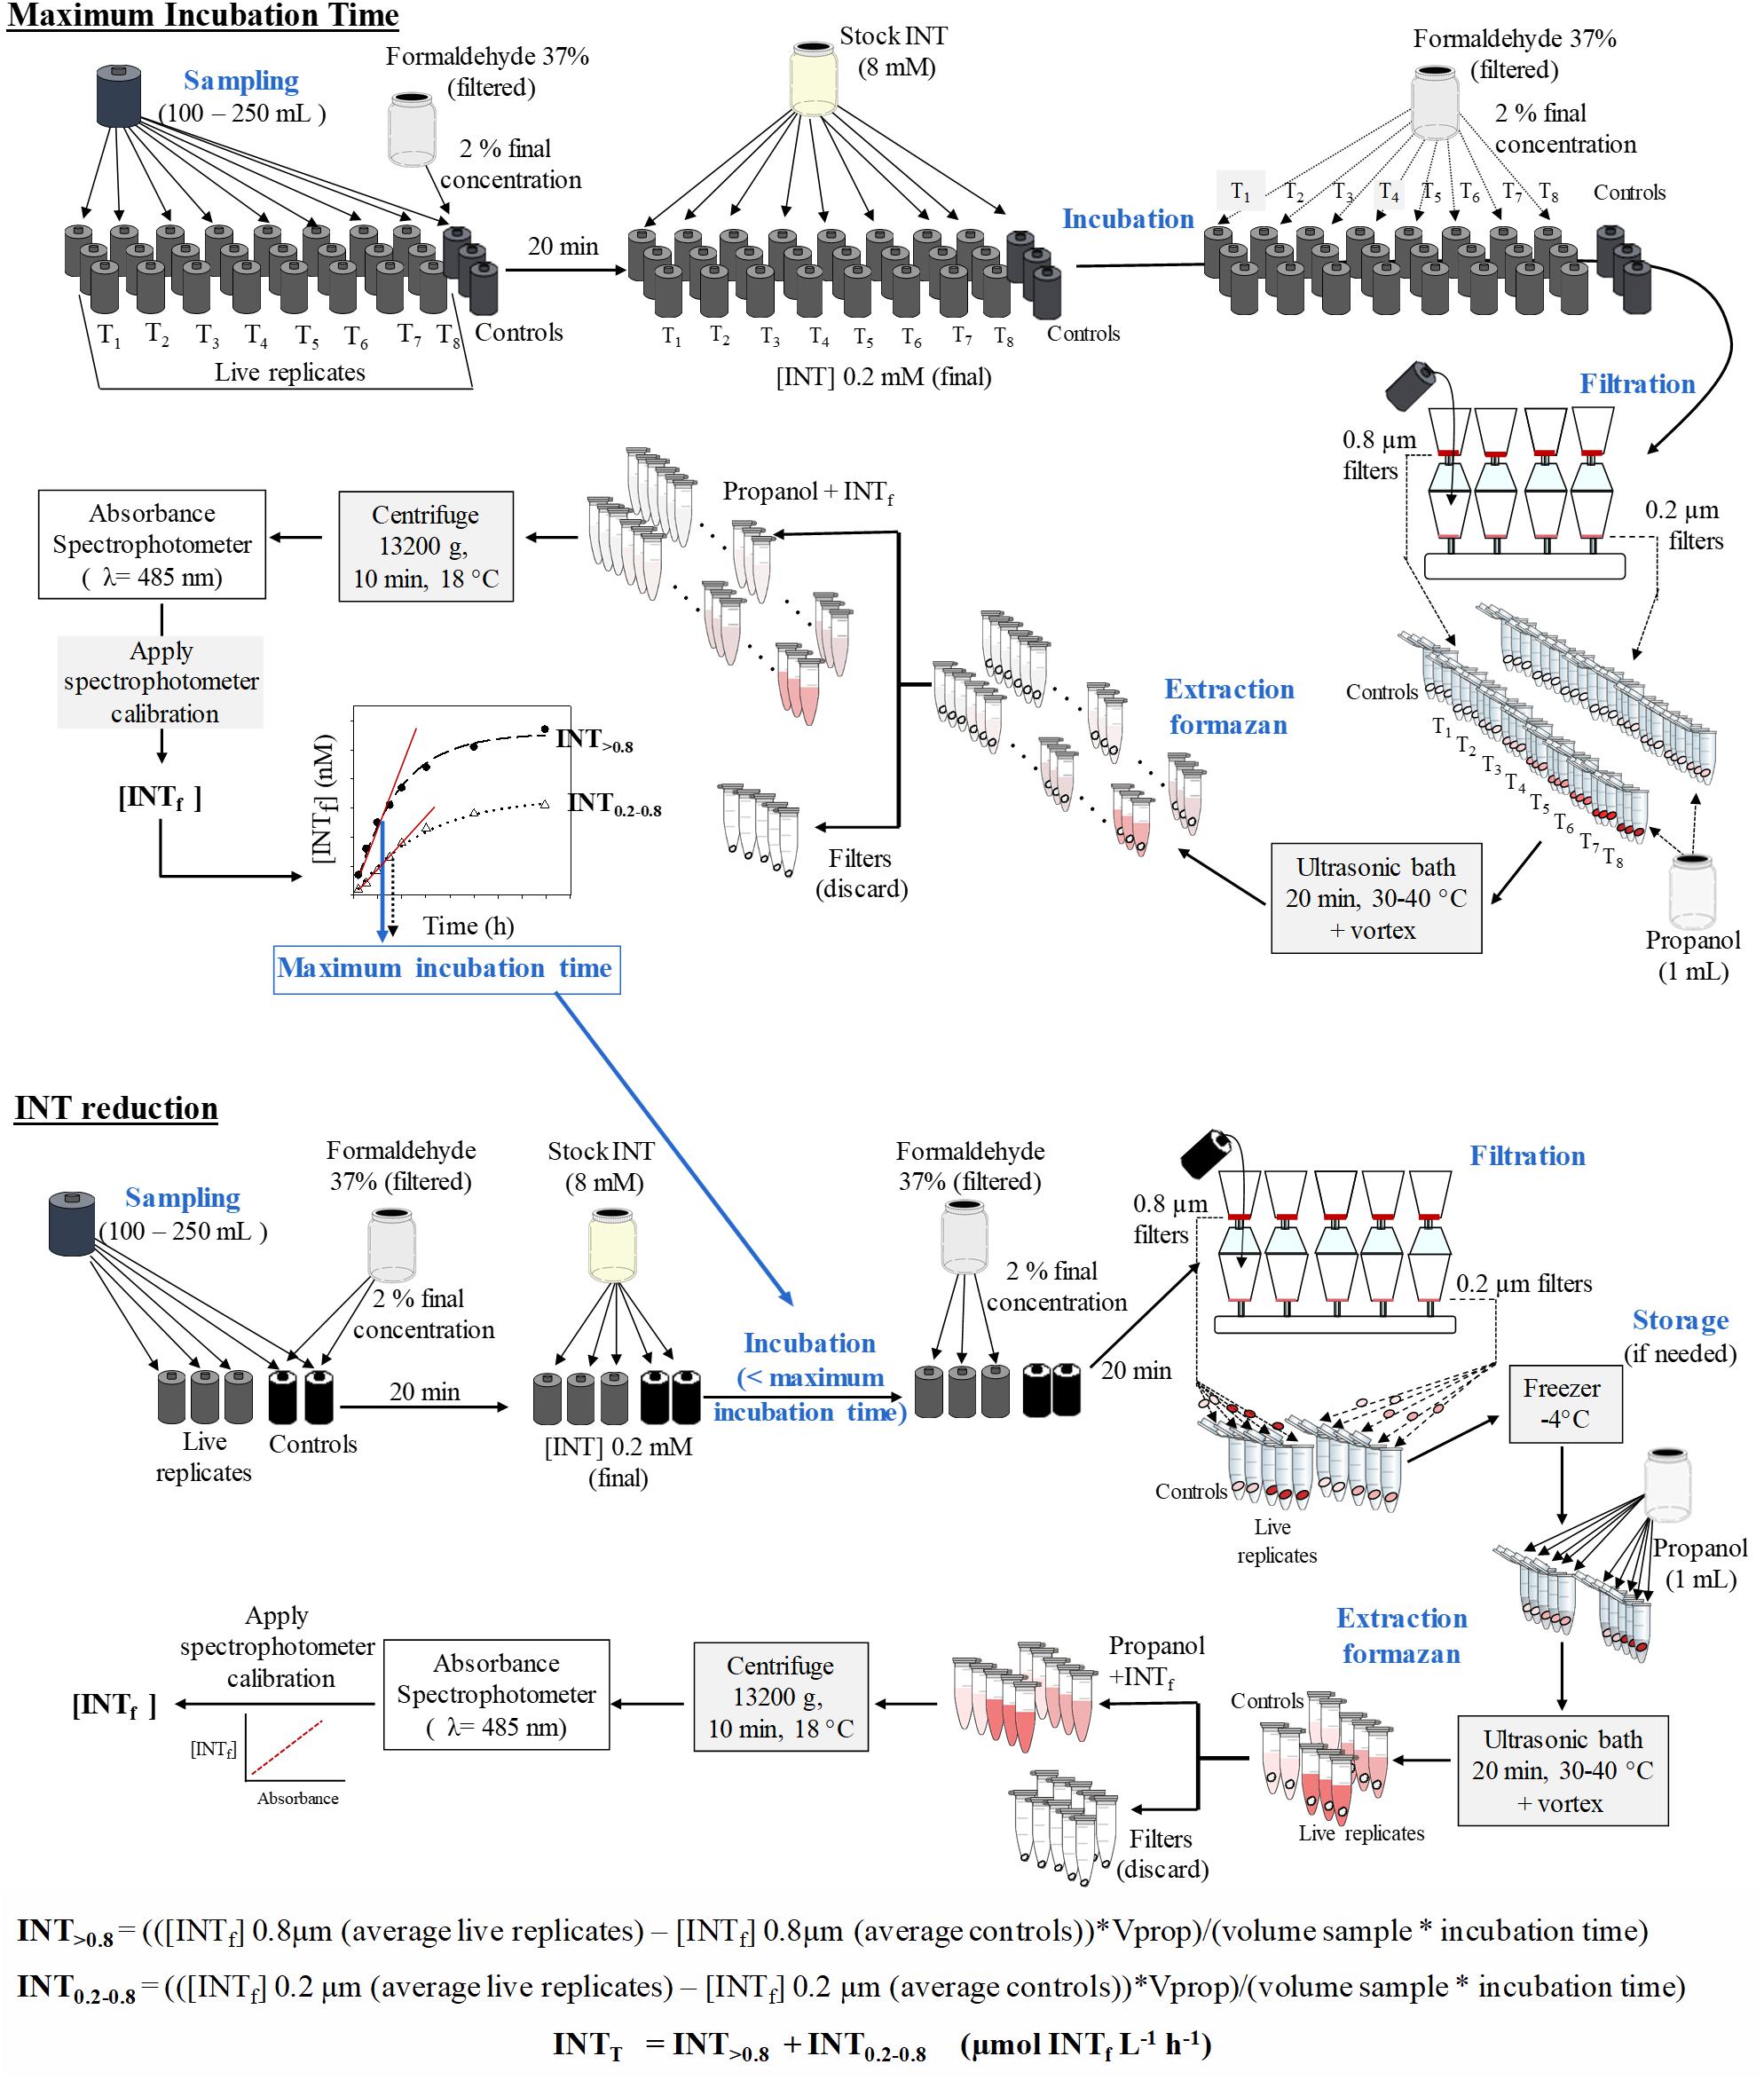
Figure 1. Schematic diagram for the INT reduction method. Upper panel: scheme for the calculation of maximum incubation time. Lower panel: scheme for the sampling, extraction and analysis of the reduction of INT. INTf, INT formazan; Vprop, volume of propanol.
Non-metabolic Reduction of the INT
The absorbance of the control could be due to the colorimetric properties of the sample (i.e., organic matter content, turbidity, etc.,) and by the reduction of INT by other chemical compounds present in the water. In order to calculate how much of the total absorbance could be attributable to the water color properties, additional 100–200 mL samples were collected and treated as the control without the addition of the INT (hereafter referred as to “blanks”) during the Shelf Sea Biogeochemistry (SSB) July experiments (Table 1). These filters were frozen and analyzed in the same way as the filters containing INT [control(s) and replicated samples]. The blank samples therefore give an indication of the absorbance which is not derived from INT. The difference between the absorbance of the controls (due to non-metabolic processes) and the absorbance of the blank provides an estimate of the maximum amount of INT reduced by chemical compounds present in the water and inside the cells, and the colorimetric properties derived from the INT chemical compound (defined as “a” in Eq. 5):
Combining equation (2) and equation (5) we obtain:
Maximum Incubation Time for the INT Reduction Rates
INT substitutes for O2 as the final electron acceptor in the electron transport chain, and once reduced, forms deposits of formazan (Hatzinger et al., 2003). The reduction of INT decreases the cell’s activity, decreasing the rate at which formazan is produced. Therefore, the incubation time needs to be less than the time when the rate of formazan formation begins to decrease.
Several experiments at different locations (N Fram Strait, N Atlantic Subtropical Gyre, SW Atlantic, and NE Atlantic Shelf Sea) were performed to calculate the maximum incubation time of the INT as described in Martínez-García et al. (2009). In each experiment, triplicate 100–200 mL samples of seawater were incubated in the dark with 0.2 mM INT additions (final concentration) for 0 (control), 0.5, 1, 1.5, 2, and >2 h at in situ temperature. The INT reduced at each time point was determined as in section 2.2. The maximum incubation time was determined in each of the two size fractions: 0.2–0.8 μm and >0.8 μm. The maximum incubation time was considered to be the time at which a decrease in the rate of formazan production was measurable. Up until this point, the relationship between formazan concentration and time remained linear.
Evaluation of the Relationship Between Dissolved Oxygen Consumption and INT Reduction
In order to determine the precision of the two methods, we calculated the coefficient of variation (CV) of each individual rate estimated by both methodologies in the different projects.
To evaluate the relationship between the rates of dissolved oxygen consumption and the rates of INT reduction and obtain a predictive regression model, we randomly divided the entire dataset into two subgroups: 2/3 of the data from each project were used to develop the predictive relationship between the two methodologies (“training” dataset) and 1/3 of the data from each project (“test” dataset) was used to validate this relationship. The random sampling was done applying the “sample function” in R for each project. Firstly, an ordinary least squares (Model type I, OLS) regression model was applied to the log-log transformed “training” data for predictive purposes (Smith, 1994, 2009). Secondly, using the “test” dataset, the moles of oxygen consumed were estimated from the moles of INT reduced applying the predictive regression model calculated from the “training” dataset. Thirdly, the slope of the regression line between the estimated O2 consumption rates (O2est) and the measured O2 consumption rates (O2meas) was compared to the equation of a line with slope 1 using a Clarke test (Clarke, 1980). No significant difference between the slope of the O2est -O2meas relationship and unity will indicate the validity of our CRO2-INTT empirical conversion equation.
Comparison of the CRO2-INTT Relationship With Previous Conversion Equations
The “test” data set was then used to compare the predictive capacity of the (i) regression model derived in section “Maximum Incubation Time for the INT Reduction Rates”; (ii) the Martínez-García et al. (2009) regression model derived from natural plankton communities (logCRO2 = 0.99log INT +1.23, R2 = 0.80, n = 72, hereafter referred to as MG-natural); and (iii) the 12.8 conversion factor obtained in Martínez-García et al. (2009) (hereafter referred to as MG-12.8) and used in previous studies (Martínez-García and Karl, 2015; Lønborg et al., 2016). The slope of the regression line between the estimated O2 consumption rates with the former regression lines and the measured O2 consumption rates were compared to the equation of a line with slope 1 using a Clarke test (Clarke, 1980). Uncertainties associated with each of the O2est-O2meas regressions were characterized by the 95% confidence interval estimated from the standard error of each regression.
Evaluation of the CRO2-INTT Relationship in Relation to Temperature and Chlorophyll-a
In order to determine any factors which lead to variability in the CRO2 – INTT relationship, we calculated the relationship between dissolved oxygen consumption and INT reduction at different in situ temperature ranges and at different levels of productivity. We used the chlorophyll-a (Chl-a) concentration as an indicator of productivity. The entire dataset was divided into three temperature ranges: <8°C indicative of (sub)polar waters, 8–18°C, indicative of temperate waters and >18°C, indicative of subtropical and tropical waters, and five chlorophyll-a concentrations: <0.1, 0.1–0.2, 0.2–0.5, 0.5–1, >1 μg L-1, spanning oligotrophic to eutrophic conditions.
Results
Non-metabolic Reduction of INT
The organic matter present in the samples influences the absorbance of the control(s) and live incubated replicates due to its optical properties. Although we lack data of organic matter concentration, its impact could be inferred from the absorbance observed in the blanks (natural seawater + formaldehyde without the addition of the INT salt) which represents the non-INT derived signal. Therefore, the difference in absorbance between that measured in the control samples (seawater samples fixed with formaldehyde before INT is added) and that measured in the blanks, would be associated with a combination of non-metabolic reduction of the INT salt (Eq. 2) and the colorimetric properties of the INT salt.
The absorbance of the blanks was on average 52.2 and 55.5% (>0.8 and 0.2–0.8 μm size fraction, respectively) of the absorbance of the controls (Supplementary Table S1). This indicates that ca. 46.1% of the absorbance in the control samples is due to the colorimetric properties of the INT plus some reduction from inorganic and organic compounds.
The absorbance of the controls was on average 59.6 and 53.0% (>0.8 and 0.2–0.8 μm size fraction, respectively) of the total absorbance measured in the incubated live replicates (Supplementary Table S1). Applying the former results to equation 2 and 5 we obtain that overall, the total absorbance of the sum of the two fractions = 0.44∗ Abs485liveincubated + 0.29∗Abs485blank + 0.27∗.
Maximum INT Incubation Times
In all cases we observed an initial linear production of formazan followed by a reduction in formazan production with time (Figure 2). The longest maximum incubation time was found in the N Fram Strait (5 h) (Figures 2A,B) which is characterized by an in situ temperature of 7.2°C and a plankton respiration rate of 1.6 μmol O2 L-1 d-1. The shortest maximum incubation time occurred in the NE Atlantic Shelf Sea in July (0.5 h) (Figures 2K,L) which is characterized by higher temperatures (16.1°C) and higher plankton respiration rates (2.3 μmol O2 L-1 d-1) (Supplementary Table S2).
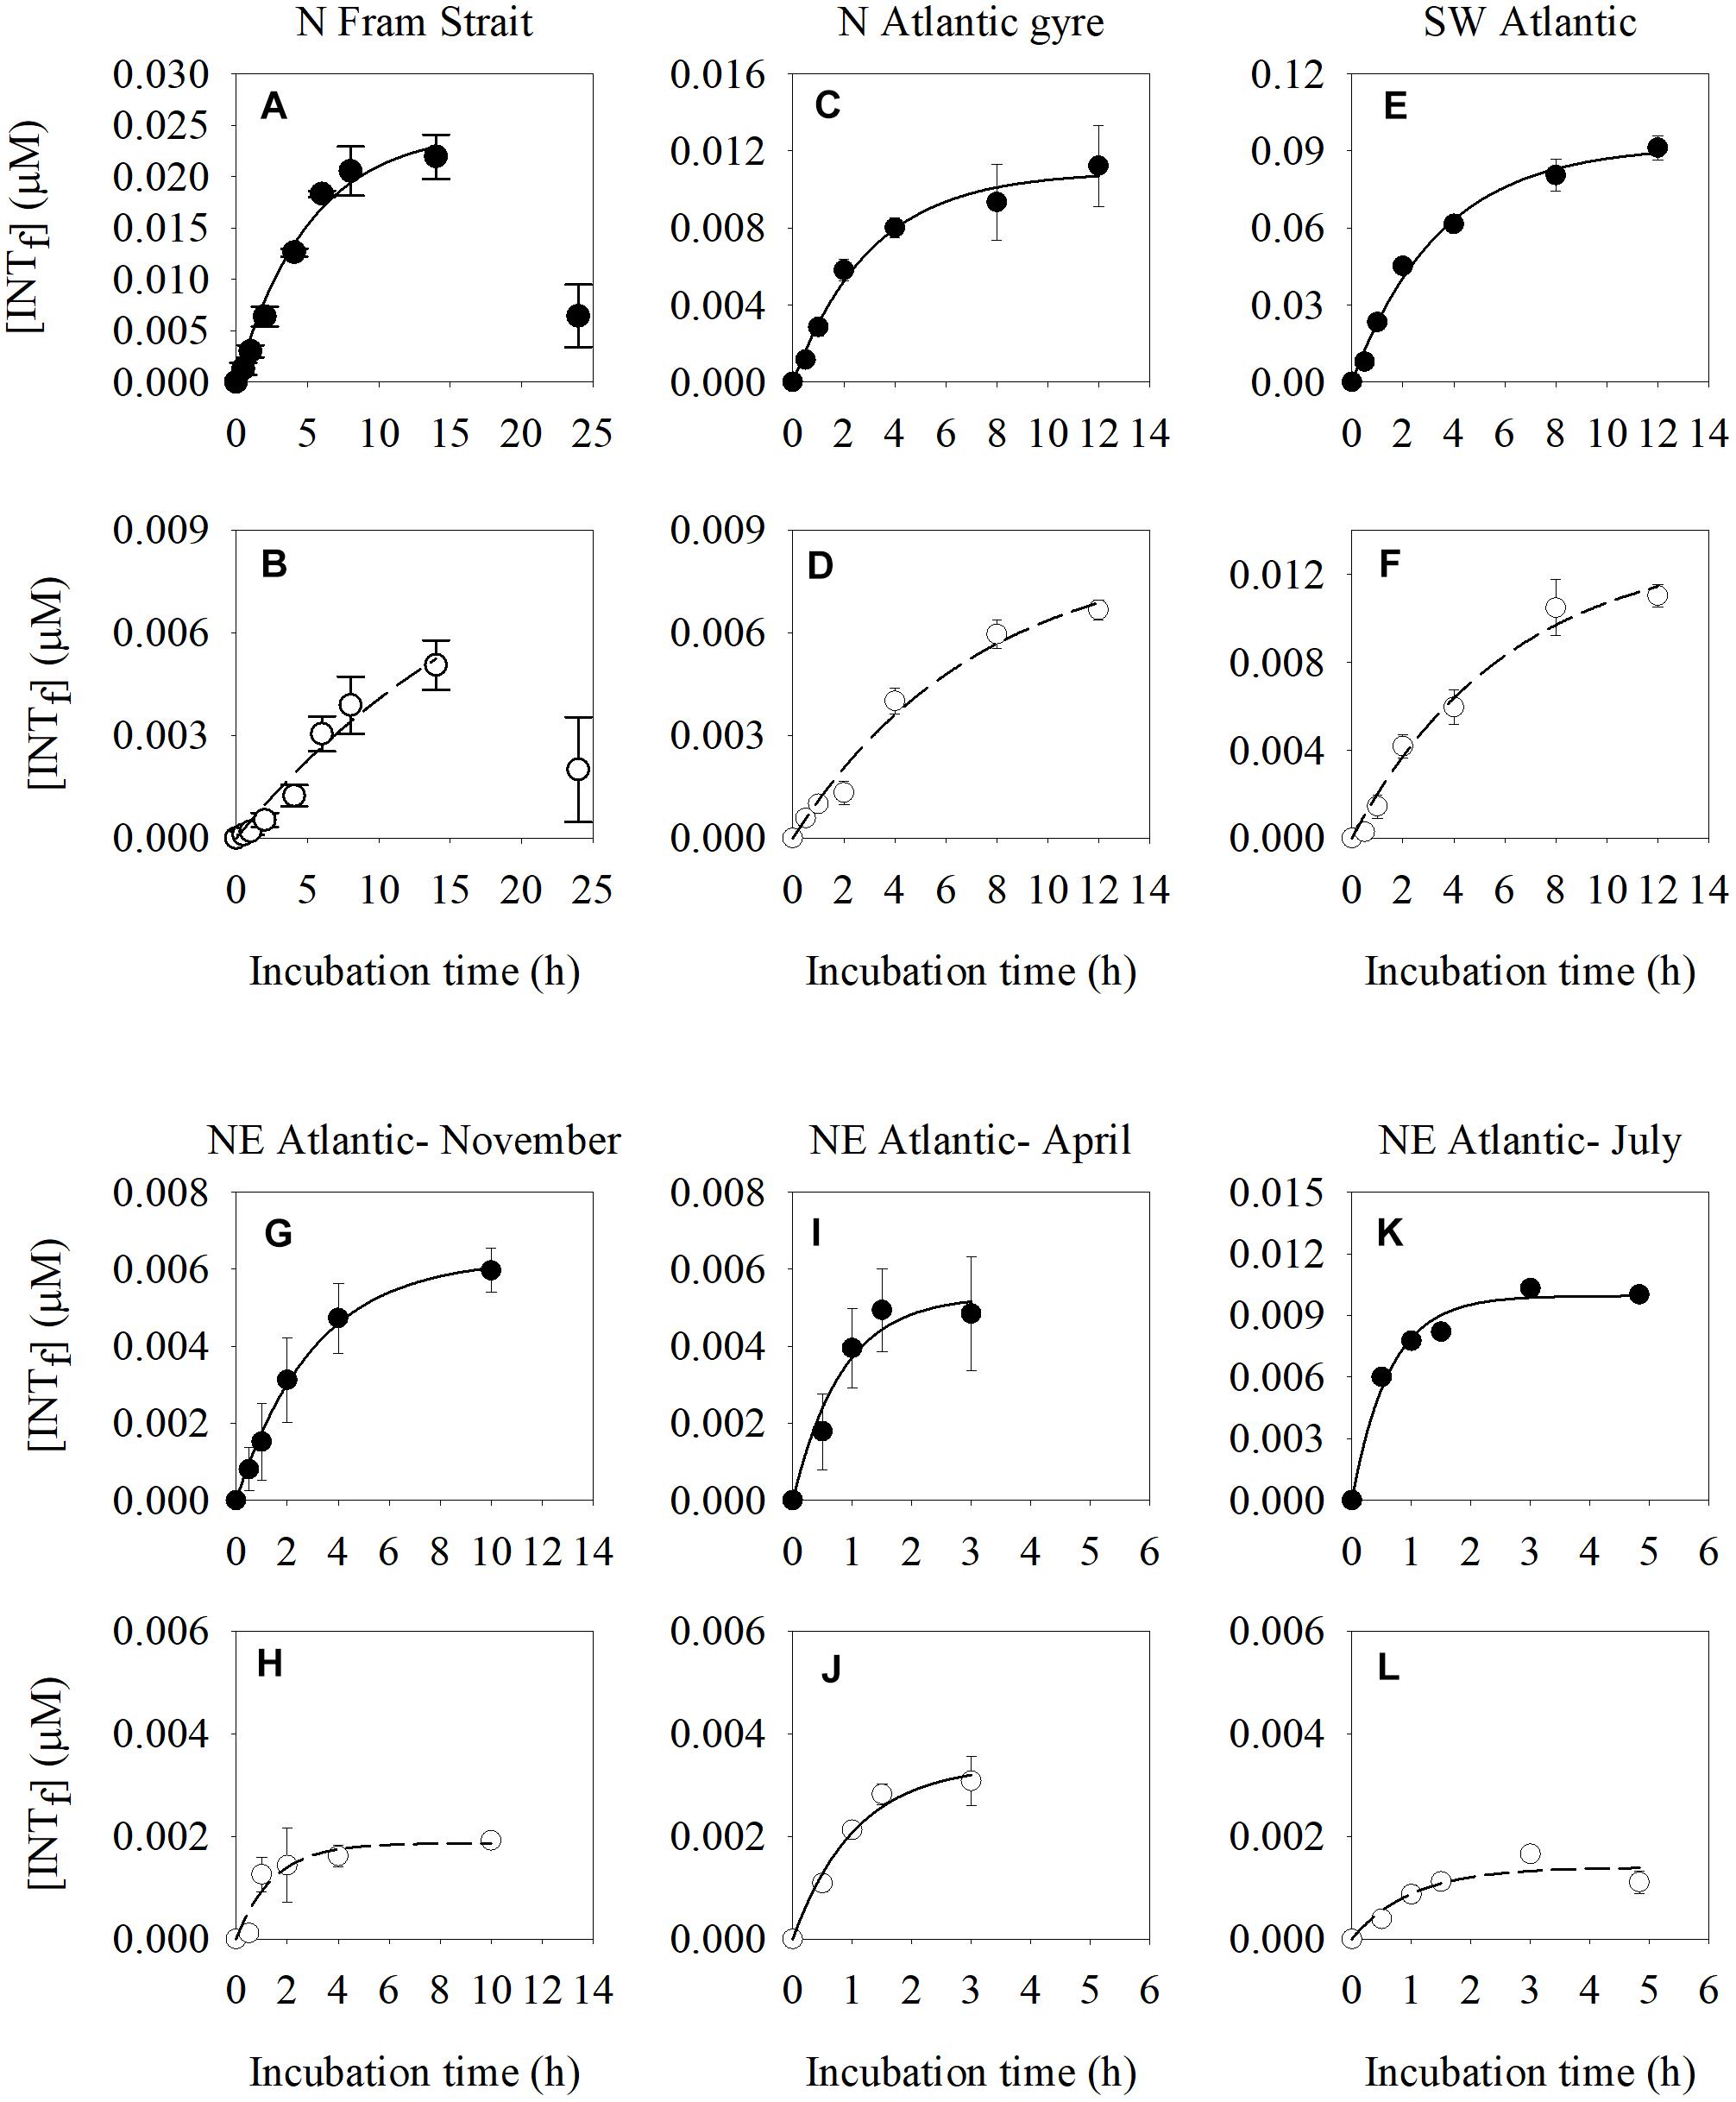
Figure 2. Time course changes of INT formazan (INTf) concentration (μM) produced by the reduction of INT of natural plankton communities estimated in two different size fractions: the >0.8 μm size-fraction (solid dots) (A,C,E,G,I,K) and 0.2–0.8 μm size fraction (white dots) (B,D,F,H,J,L) at different locations (North Fram Strait, N Atlantic subtropical gyre, SW Atlantic, NE Atlantic Shelf Sea in November, April, and July). The error bars represent the standard error of the formazan concentration. Final INT concentration in all time course experiments is 0.2 mM.
There were small differences in the maximum incubation time between the two fractions (Supplementary Table S2). The >0.8 μm size fraction had shorter maximum incubation times (by between 12 and 24 min), than the 0.2–0.8 μm size fraction. Rates of INT reduction derived from incubations which were shorter than the maximum incubation time, as are those presented here, are less likely to be affected by the toxic effect of the formazan.
Evaluation of the Dissolved O2 Consumption and INT Reduction Rates
The coefficient of variation (CV) was calculated for each data point from each method within each project (Table 2). The median of the coefficient of variations varied between projects, but overall the INT reduction method had a smaller (by about a factor of 2) CV than the oxygen consumption method. In addition, data from projects with low respiration rates (CARPOS, ALOHA), mainly corresponding to oligotrophic regions or conditions, had systematically higher CVs for the rates of oxygen consumption. This indicates a lower precision at low O2 consumption.
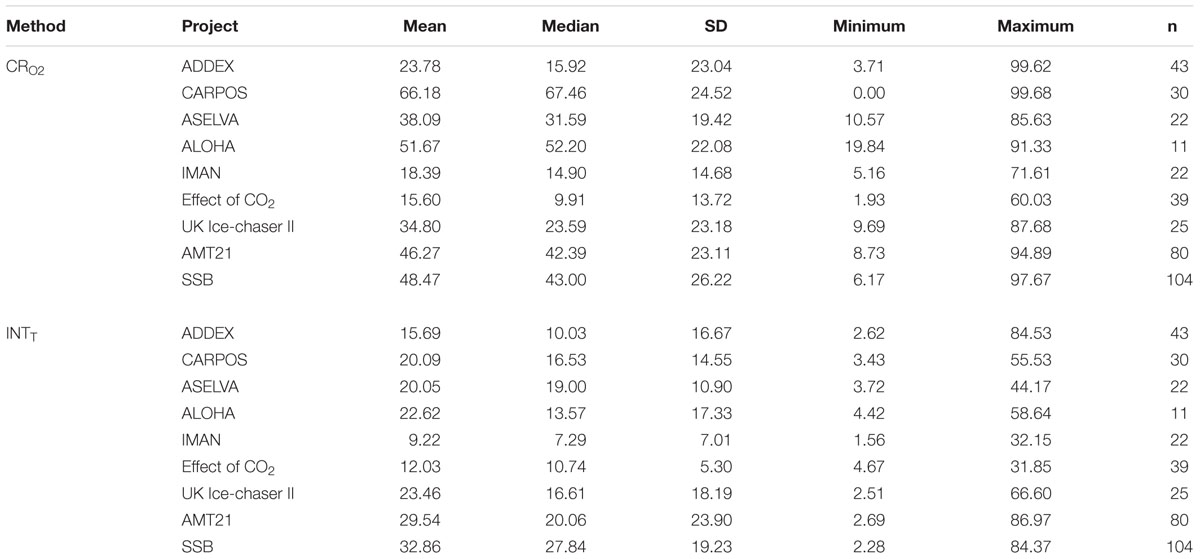
Table 2. Mean, median, standard deviation (SD), minimum and maximum values and number of data (n) for the average of the coefficient of variation for each data of the dissolved oxygen consumption (CRO2) and INT reduction (INTT) methods within each project.
Evaluation of the Relationship Between Dissolved O2 Consumption and INT Reduction
There was a significant relationship (p < 0.001) between oxygen consumption (μmol O2 L-1 h-1) and INT reduction (μmol INTf L-1 h-1) with a slope of 0.72 (standard error, 0.03) and a R2 of 0.69 using the “training” sub-dataset (Figure 3). The higher coefficient of variations observed at low O2 consumption and INT reduction rates are reflected in the greater variability in data at O2 consumption rates lower than 0.03 μmol O2 L-1 h-1 (Log CRO2 = -1.5) (a rate commonly measured in the oligotrophic gyres).
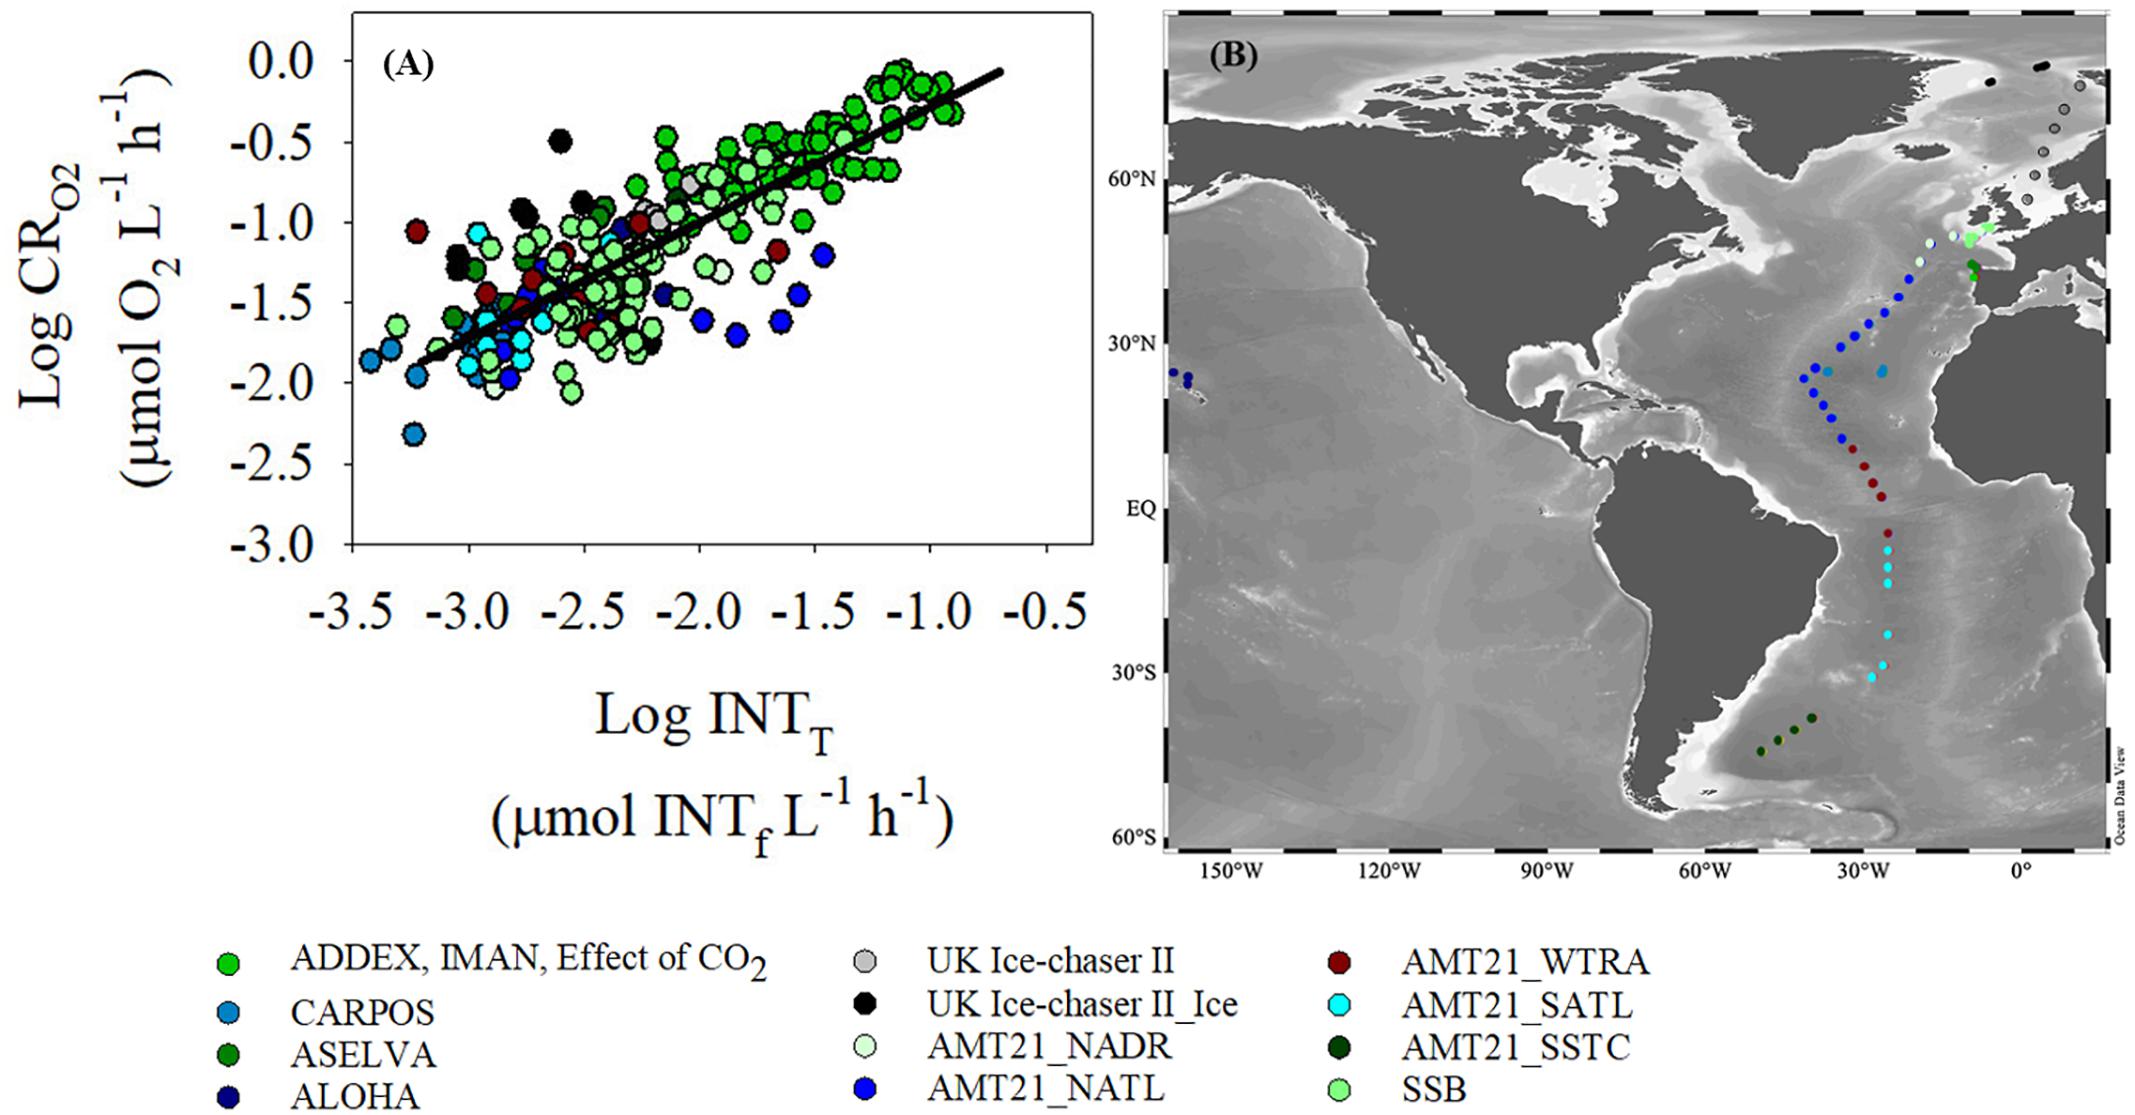
Figure 3. (A) Log-Log relationship between dissolved oxygen consumption (CRO2) and INT reduction (INTT) determined with the “training” dataset. Ordinary least square linear regression is logCRO2 = 0.72(±0.03)∗logINTT + 0.44( ± 0.07), R2 = 0.69, n = 249, p < 0.001 (black line). (B) Map of the sampling points. The colors of the two graphs represent different regions of the oceans where data were collected. The data from the UK Ice-Chaser II project are divided into two different subgroups: data from open water stations (grey) and data from ice stations (black). Similarly, data from AMT21 have been divided into five subgroups: North Atlantic Drift Province (NADR), North Atlantic Tropical Gyre (NATL), Western Tropical Atlantic (WTRA), South Atlantic Subtropical Gyre (SATL), and South Subtropical Convergence (SSTC).
To investigate the performance of the O2 – INT relationship we used the “test” dataset to compare the estimated oxygen consumption rates (O2est) derived from the INT relationship with the measured oxygen consumption rates (O2meas). Overall, there was a good agreement between the estimated and the measured rates and the slope of the regression was 0.99 (standard error, 0.05) (Figure 4A), not statistically different to unity (Clarke test, t = 0.09, df = 95, p = 0.93, Clarke, 1980). The root mean squared error (RMSE) of the comparison was 0.26 and the residuals were randomly distributed, indicating the suitability of applying a linear regression in our model.
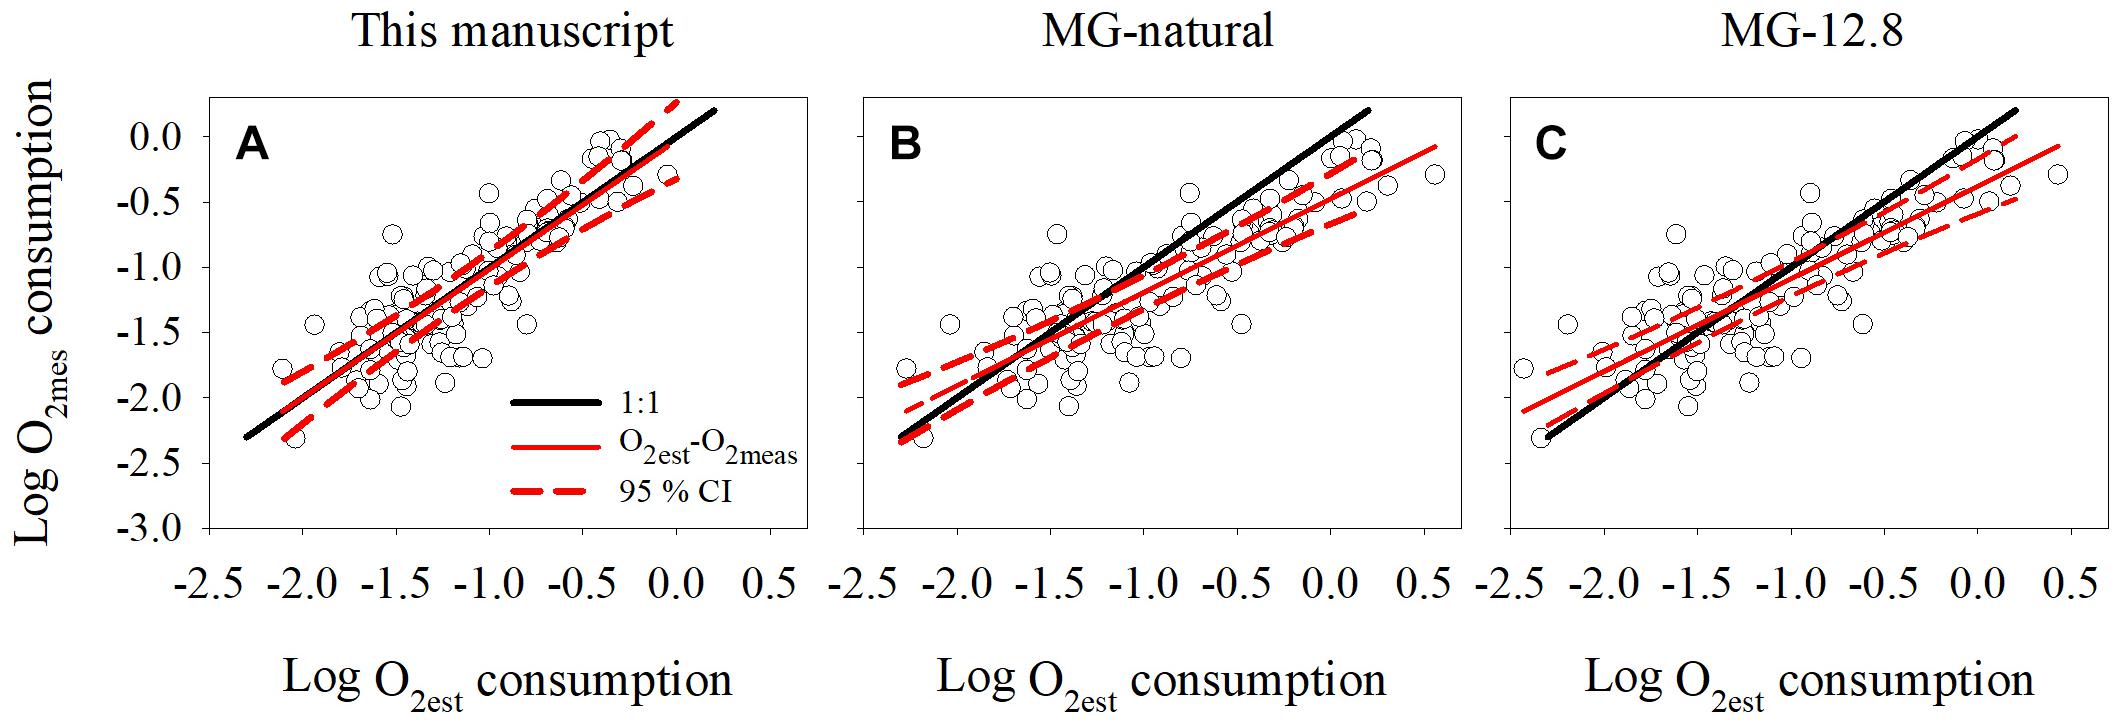
Figure 4. Comparison between dissolved oxygen consumption measured using Winkler titrations and estimated by (A) regression model derived in this manuscript, (B) regression model derived from natural populations (MG-natural) reported in Martínez-García et al. (2009), and (C) coefficient factor derived from cultures (MG-12.8) reported in Martínez-García et al. (2009). The black line represents the 1:1 line and the red line the linear regression obtained between the measured (O2meas) and estimated (O2est) oxygen consumption. The red dotted lines indicate the maximum and minimum 95 % confidence interval for the O2est-O2meas regression equation.
Once we confirmed that oxygen consumption could be derived from moles of INT reduced, we compared our linear regression (logCRO2 = 0.72logINTT + 0.44), with the linear regression (MG-natural) and the 12.8 coefficient factor (MG-12.8) published by Martínez-García et al. (2009). This coefficient factor is applied to rates without log-transformation, but could be expressed logarithmically as logCRO2 = logINTT + 1.11.
There was no significant difference between the estimated-measured regression line derived from this study and the ideal regression line of slope 1 (Clarke test, t = 0.09, df = 95, p = 0.93, Figure 4A). However, the slope of the linear regression between the O2est and O2meas rates derived from the MG-natural and MG-12.8 models differed from the ideal regression line of slope 1 (Clarke test, t = 3.0, df = 95, p = 0.003 and t = 3.2, df = 95, p = 0.002, respectively, Clarke, 1980; Figures 4B,C). The MG-natural regression model had the highest root mean squared error (RMSE = 0.37), compared to the MG-12.8 (RMSE = 0.32) and the one from this database (RMSE = 0.26). In addition, MG-natural and MG-12.8 tended to underestimate the oxygen consumption at Log (O2meas) >-1 and Log (O2meas) >-0.7, respectively, as the ideal regression line of slope 1 was greater than the 95% maximum confidence interval of the MG-natural and MG-12.8 linear regressions (Figures 4B,C).
Factors Influencing the CRO2-INTT Relationship
Despite having shown that INT reduction rates can be used as a proxy of oxygen consumption and therefore, plankton respiration, there is a large spread in the data at low respiration rates. In order to test whether this variability could be due to environmental factors, we investigated the relationship based on the two variables that we consistently measured alongside the respiration rates: in situ temperature and in situ chlorophyll-a. Respiration rates measured in waters at temperatures <8°C had the lowest precision and highest variability of the three temperature subsets (Figures 5A–C and Supplementary Table S3). There was no significant regression in the <8°C subset. The >18°C subset presents a linear regression significantly different from the general linear regression calculated in the previous section (Clarke test t = 9.37, df = 149, p < 0.001, Clarke, 1980). It must be noted, however, that the linear regression of this subset is biased due to 8 out of 95 data points with Log INTT >-2 μmol INTf L-1 h-1 which affect the slope of the regression.
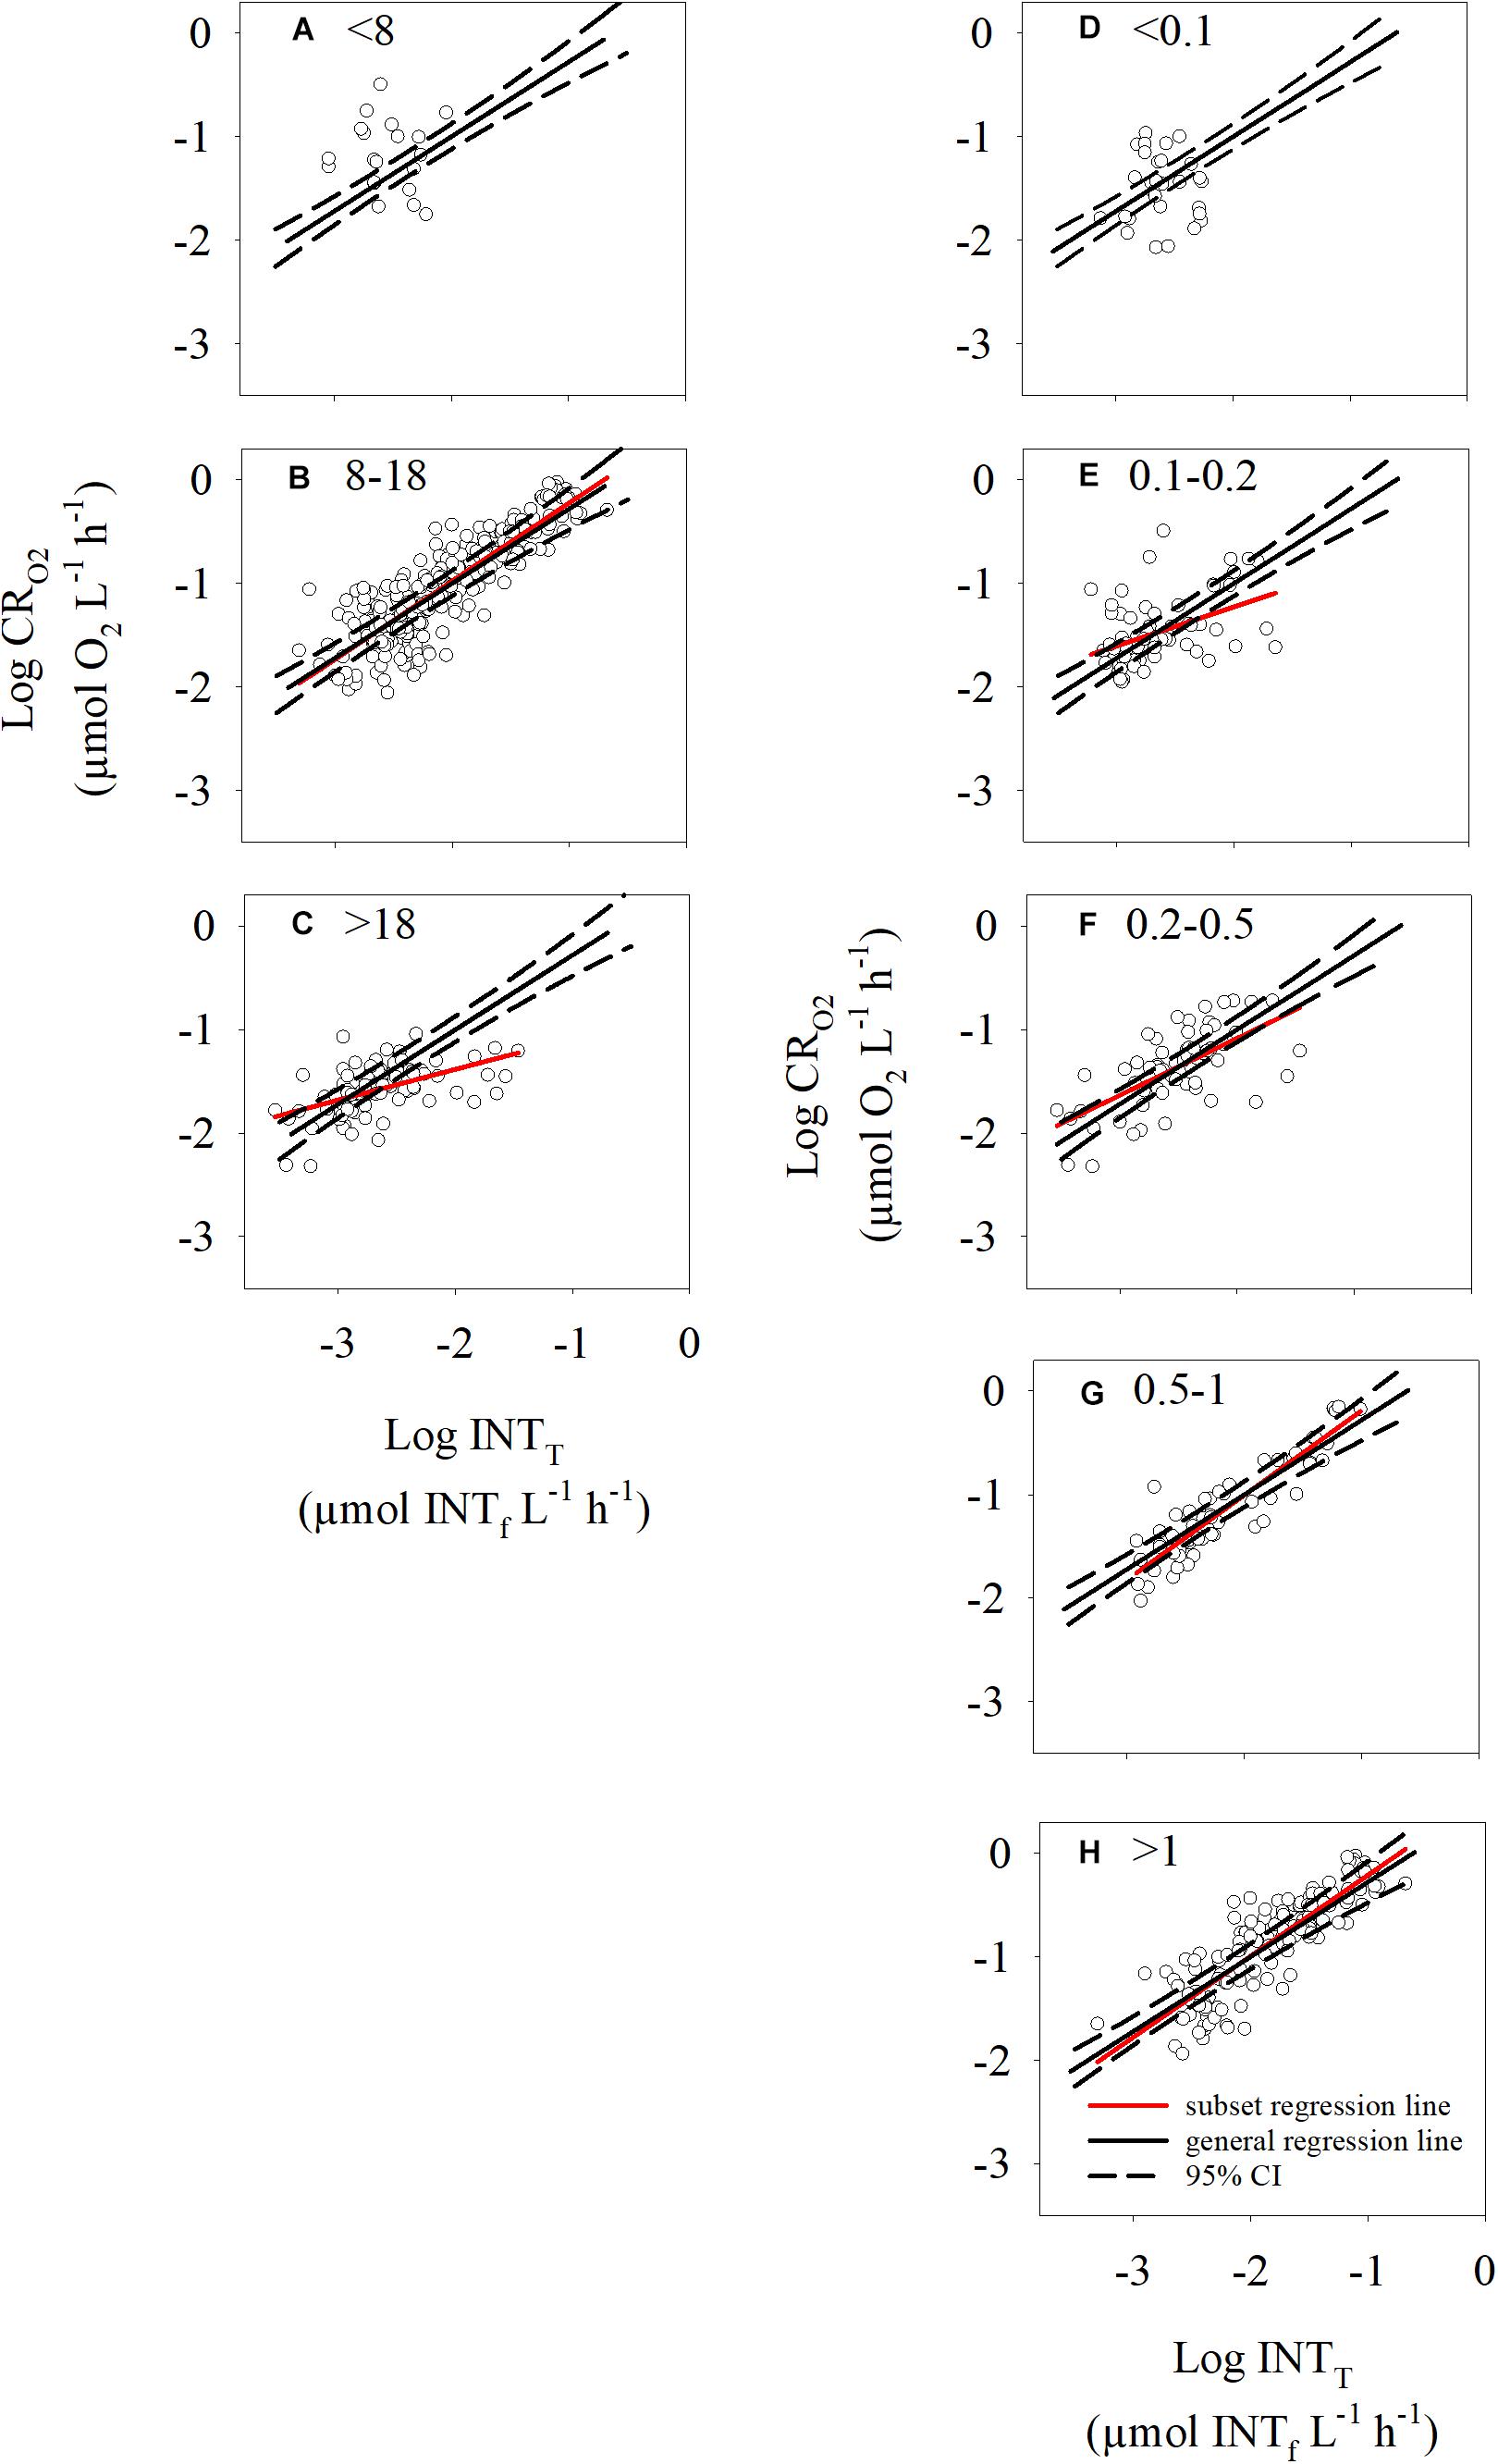
Figure 5. Scatterplots of the log-transformed oxygen consumption and INT reduction rates for the temperature subsets (<8, 8–18, >18°C) (A–C) and the chlorophyll-a subsets (<0.1, 0.1–0.2, 0.2–0.5, 0.5–1, >1 μg L-1) (D–H). The solid line is the overall regression equation obtained in this manuscript (logCRO2 = 0.72logINTT + 0.44) and the black dotted lines indicate the maximum and minimum 95% confidence interval. The red lines are the regression lines obtained for each individual subset of data. Regression lines in panel (A,D) were not plotted, as they were not significant.
The division of the data by Chl-a concentration (Figures 5D–H) showed that the data associated with Chl-a concentrations <0.1 μg L-1 had the highest variability and lowest coefficient of determination (Figure 5D and Supplementary Table S3), while the data from waters with Chl-a concentrations >0.2 μg L-1 had a higher precision (Figures 5F–H and Supplementary Table S3). The slope of the regression lines from subsets with Chl-a concentrations ≥0.5 μg L-1 are not significantly different from the general regression line calculated in the previous section (Supplementary Table S3). Importantly, 55% of the data within the <8°C subset also have Chl-a concentrations <0.1 μg L-1. Therefore, it is difficult to infer whether the high variability in the <8°C subset is related to temperature or to Chl-a concentration. Overall, the O2 – INT linear relationship predicts the respiration rates best in environments where the temperature is >8°C and Chl-a concentration is greater than 0.2 μg L-1.
Discussion
Quantification of ocean carbon cycling and future predictions of deoxygenation, ocean carbon storage, ocean-atmosphere carbon dioxide exchange and therefore climate mediation, require a substantial improvement in the spatial and temporal coverage of the global database of plankton respiration measurements (Falkowski et al., 2011; Serret et al., 2015). The significant relationship between oxygen consumption and INT reduction rates, previously observed by Martínez-García et al. (2009) and confirmed here using a much larger dataset, clearly demonstrate that the INT method provides a good proxy for plankton community respiration, and so more widespread use could provide this global coverage. However, as with any method, its applicability, precision and accuracy need to be assessed. In the following section, we evaluate and constrain the known limitations of the method.
Oligotrophic systems tend to have low respiration rates and this creates a challenge for the determination of respiration, particularly for the dissolved oxygen concentration technique. Respiration rates are close to the limit of detection of the dissolved oxygen method in these areas, which is reflected in the higher coefficient of variation of the respiration rates measured by changes in the dissolved oxygen concentration, compared to more eutrophic regions. However, the lower limit of detection of the INT reduction method meant that even in these areas with low respiration rates, the coefficient of variation was small.
One problem inherent to the INT reduction method relates to the toxicity of the INT to the living cells (Hatzinger et al., 2003; Martínez-García et al., 2009; Villegas-Mendoza et al., 2015). INT is an artificial electron acceptor which interferes with the cell activity (i.e., oxygen reduction and ATP formation), ultimately resulting in death. However, this toxicity occurs only after a certain length of time after the addition of INT and production of formazan. Therefore, by using incubation times shorter than the time at which the toxicity occurs (the maximum incubation time), the validity of the method is maintained. Surpassing this maximum incubation time can lead to an underestimation of the reduction rates (Smith and McFeters, 1997; Martínez-García et al., 2009) and, therefore, underestimation of the respiration rates. Results from the present study showed a narrow range of the observed maximum incubation time from 0.5 to 5 h with the longest incubation time in a situation with low dissolved oxygen consumption rate and low temperature. Similar maximum incubation times were observed between the two size fractions (0.2–0.8 μm and >0.8 μm) in 4 out of 6 experiments reported. However, in the North and South Atlantic gyre the >0.8 μm sized organisms exhibited a toxic response slightly earlier than the 0.2–0.8 μm size-class. We expected that if there were to be differences between size-classes, the >0.8 μm fraction, which is composed mainly of eukaryotes, would have a longer maximum incubation time than the 0.2–0.8 μm fraction. INT in eukaryotes needs to penetrate the cell wall and reach the mitochondria, while in prokaryotes the reduction occurs in the plasma membrane. However, our results showed the opposite trend. Nevertheless, our maximum incubation times are in agreement with previous studies on marine planktonic communities (Martínez-García et al., 2009; Martínez-García and Karl, 2015), in other aquatic environments (Dufour and Colon, 1992; Rodriguez et al., 1992; Ullrich et al., 1996; Villegas-Mendoza et al., 2015) and in soil bacteria (Trevors et al., 1982; Mosher et al., 2003). Villegas-Mendoza et al. (2015) performed time course experiments with cultures of Isochrysis galbana and Vibrio harveyi with and without INT additions. In their experiments, several of the cultures showed a higher decrease in respiration rate in those treatments with INT after 1 h of incubation compared to the control treatments without INT. However, the toxic effect from INT was not noticeable during the first 50 min. The higher decrease in the respiration rates after 50 min could be related to the high oxygen consumption rates of their cultures. In their experiments, the respiration rates of the cultures without INT were between 10 and 60 μmol O2 L-1 h-1, which are about 100-fold higher than respiration rates normally found in natural environments. The former study also reported that INT concentration is another factor which might have an effect on the toxicity of the INT. A single concentration was adopted (0.2 mM, or 0.01% w/v) in this study, in order to standardize our data and minimize the possible toxic effect on the INT reduction rates. A concentration of 0.2 mM was selected based on the results reported previously by Martínez-García et al. (2009), who showed no differences in the formazan production at concentrations of 0.2, 04, and 0.8 mmol INT per liter. In addition, the concentration adopted in this manuscript is in the lower range of previous INT concentration used in marine waters (Villegas-Mendoza et al., 2015) and lower than the concentrations used in other systems (Dufour and Colon, 1992; Thorm et al., 1993; Hatzinger et al., 2003). The data in Villegas-Mendoza et al. (2015), along with those presented in this study and previous studies (Martínez-García et al., 2009), corroborate the importance of performing maximum incubation time experiments, at specific INT concentrations, before using the INT in different ecosystems and with plankton communities exhibiting different respiration rates.
Another limitation of the method is the possible reduction of INT not associated with cellular respiration (Berridge et al., 1996; Smith and McFeters, 1997; Bhupathiraju et al., 1999; Maldonado et al., 2012). This non-respiratory reduction of the INT is taken into account in the method and corrected with the subtraction of the controls (samples fixed with formaldehyde prior to the addition of INT) from the live replicate samples. Therefore, it should not be affecting the INT reduction rates presented here. However, we were interested to quantify the maximum potential reduction of INT related to this potential bias. The absorbance in the control samples is produced by the colorimetric properties of the natural waters (absorbance of the blanks), the colorimetric properties of the INT compound and the formazan reduced by any inorganic and organic compound present in the sample. The colorimetric properties of the sample represented on average 50% of the absorbance measured in the control. At the same time, the absorbance of the control represented an average 56% of the absorbance in the live incubated samples. If we applied Equation 5, we find that 44% of the absorbance of the live incubated samples is produced by respiratory reduction and 27% of the absorbance of the live incubated samples is produced by the colorimetric properties of the INT itself and some reduction of the INT by inorganic and organic compounds. This supports previous findings that INT could be reduced by other compounds present in the cell without being related to respiratory processes (Berridge et al., 1996; Smith and McFeters, 1997; Bhupathiraju et al., 1999; Maldonado et al., 2012). However, as mentioned, when calculating the INT reduction rates, we subtract the absorbance of the control from the absorbance of the live incubated samples, so the final INT reduction rate is free from this bias.
The CRO2-INTT conversion equation derived in this study was successfully validated with an independent data set, whereby the dissolved oxygen consumption derived from INT reduction and the conversion equation was not significantly different from the concurrently measured dissolved oxygen consumption. This analysis also indicated that this new CRO2-INTT conversion equation was a better predictor of dissolved oxygen consumption than the two previously published regression equations (Martínez-García et al., 2009; MG-natural and MG-12.8) for natural plankton communities. The higher RMSE, and therefore lower predictive capacity, of the MG-12.8 coefficient conversion, could be related to the INT and O2 incubation times used in its derivation. The MG-12.8 was derived from INT and O2 incubations of cultures which were the same length of time (Martínez-García et al., 2009). By contrast, the conversion equation derived in the present study was derived from comparison of the decrease in dissolved oxygen over 24 h and the rate of INT reduction over <0.5–5 h. An appropriate incubation time for each methodology, INT reduction and dissolved oxygen consumption, is a better approach than having the same incubation time for the two methods. For example, short incubation times would benefit the INT reduction technique as the INT becomes toxic at longer incubation times, but it may mean that the incubation time is too short to measure a decrease in dissolved oxygen. We recommend the use of the new conversion equation to estimate respiration rates of natural pelagic populations as it accurately reproduced the respiratory decrease in dissolved oxygen over a three orders of magnitude range of respiration rates. However, the regression equation fails to predict respiratory oxygen consumption when temperatures are <8°C and chlorophyll-a concentrations are <0.2 μg L-1 as shown by the significant differences between the slope of the regression lines on these subsets of data and the overall regression equation (Supplementary Table S3). The lower precision of the conversion equation at chlorophyll a concentrations <0.2 μg L-1 (and therefore low oxygen consumption rates) may be related to biases in the two methods. On one hand, the lower precision of the conversion equation is likely affected to some extent by the lower precision of the measurements of dissolved oxygen consumption rates (see comment about the high CV). On the other hand, the conversion equation may be affected by the capacity of different cells to incorporate INT. We hypothesize that (i) changes in the cell membrane, and/or (ii) species-specific differences in the ability of organisms to incorporate INT also contribute to the reduction of precision at low temperatures and low productivity. Seventy percent of the data within the <8°C sub-group was collected in the Arctic Ocean where in situ temperatures ranged from -1.7 to 3°C. Planktonic organisms which thrive at low temperatures have adapted to the cold environment by incorporating proteins with anti-freezing properties (Janech et al., 2006) and modifying their membrane lipid composition (Farkas et al., 1988; Thompson, 1989), which in turn affects the permeability of the membrane (Raven and Geider, 1988; Thompson, 1989). This difference in lipid composition, and permeability, may influence the take up and reduction of INT and therefore the CRO2-INTT relationship. One of the assumptions of the method is that all plankton cells can take up and reduce INT equally well. However, different plankton cells have different cell membrane and wall structures and there has not been a systematic study that has tested whether a diatom with a silicate cell wall can take up and reduce INT to the same extent as a coccolithophore with calcium carbonate liths or a bacterium that reduces INT in the cell wall. The majority of the samples with chlorophyll-a concentrations <0.2 μg L-1 were collected from (sub-)tropical regions or from depths experiencing a light field equivalent to ∼0.1% of the surface incident irradiance. In these subtropical areas or at sub-euphotic zone depths (considered as the depth of the 0.1% surface incident irradiance), the plankton is dominated by microbes, mainly bacteria, in the 0.2–0.8 μm size-class (Zubkov et al., 1998) while in temperate and coastal areas, organisms >0.8 μm predominate (Zubkov et al., 1998; Tarran et al., 2006) the plankton community. Species-specific studies are therefore required to check whether the CRO2-INTT conversion equation is the same for all plankton communities or if it varies with plankton community structure.
As with all methods used to determine plankton metabolic rates (e.g., 14CO2 fixation, leucine incorporation, nitrate assimilation, O2 consumption) the INTT method has potential limitations which, although not preventing its use, must be taken into account within the method protocol. When applying the INTT method in low temperature and/or low productivity areas (i.e., Antarctic waters, Mediterranean Sea, or mesopelagic and bathypelagic areas), we encourage researchers to: (1) adapt the protocol in terms of sampling volume and incubation time; and (2) estimate plankton respiration from dissolved oxygen consumption, as well as with INT reduction. Increasing the sample volume will increase the INT reduction signal that, in conjunction with an appropriate incubation time, should overcome the limits of detection of the INTT method. The concurrent determination of plankton respiration from dissolved oxygen consumption will confirm the validity of our CRO2-INTT conversion equation in all regions, or support a suggestion for different CRO2-INTT conversion equations for different biogeochemical regions. Oxygen sensors (optodes) are increasingly being used to successfully measure plankton respiration (Tengberg et al., 2006; Wikner et al., 2013) with advantages over Winkler titrations in terms of a reduction in requirement for equipment and hazardous chemicals. However, the precision of commercially available optodes is currently similar to the Winkler technique (Wikner et al., 2013), implying similarly long incubation times in areas characterized by low oxygen consumption. Therefore, particularly in oligotrophic regions, replacing Winkler titrations with optode measurements does not overcome the limitation of low precision when measuring oxygen consumption. However, for many applications, optodes could be used alongside INT reduction to extend the validation of the INTT technique to other biogeochemical regions (Wikner et al., 2013; Bittig et al., 2018). Overall, the analysis presented in this study indicates that estimates of INT reduction rates can extend the plankton respiration database, and would contribute to important debates about the metabolic state and response of the ocean to global change.
Plankton respiration can also be estimated by applying empirical relationships between respiration and other variables. Some authors have reported relationships with chlorophyll-a (Iriarte et al., 1991). This relationship was valid at high chlorophyll-a concentrations, when phytoplankton dominated the community, but it was not significant at low chlorophyll concentrations (Iriarte et al., 1991). In our study, we found a weak relationship between CRO2 and chlorophyll-a, and INTT and chlorophyll -a (Supplementary Figure S1), which supports the idea that chlorophyll-a is not always a good predictor for plankton respiration (Robinson and Williams, 2005). Other authors have reported relationships between community respiration and gross primary production (Duarte and Agusti, 1998; Robinson and Williams, 2005; Regaudie de Gioux and Duarte, 2013). The latest meta-analysis performed by Regaudie de Gioux and Duarte (2013), indicated that community respiration scaled to the ¾ power of gross primary production. Their relationship, although significant, has a coefficient of determination of 0.30, lower than the coefficient of determination between CRO2 and INTT presented in this study (0.69), and therefore deriving plankton respiration from primary production presents a higher uncertainty than deriving it from INT reduction. The regression equation between CRO2 and INTT in our study has a similar coefficient of determination to the ones reported for the regression equation between community plankton respiration and ETS in natural populations collected from different regions (Arístegui and Montero, 1995) and higher than the coefficient of determinations of CRO2 and ETS reported in a recent study from natural samples collected in the North East Atlantic Ocean (Filella et al., 2018).
There are some questions related to the reduction of INT which require further investigation (i.e., species-specific differences in the ability of organisms to incorporate INT into their cells, effects of temperature, and extracellular reduction of the INT). Acknowledging the limitations of the CRO2 -INTT relationship at low temperatures (<8°C) and low chlorophyll-a concentrations (<0.2 μg L-1), the significant relationship between INT reduction and oxygen consumption presented in this study (logCRO2 = 0.72logINTT + 0.44), which includes data from a range of biomes and seasons, indicates that the reduction of INT can be used as a proxy for respiration in natural plankton communities, in a similar way as chlorophyll-a concentration is widely used as an indicator of algal biomass, uptake of radioactive carbon (14C-bicarbonate) is used as an indicator of phytoplankton primary productivity or leucine incorporation is used to estimate bacterial biomass production.
Data Availability
All data are available in the Supplementary Data S1. Data from UK Icechaser II, AMT21 and SSB projects are publicly available under the NERC Open Government Licence: http://www.bodc.ac.uk.
Author Contributions
All authors measured and collected dissolved oxygen consumption rates and/or INT reduction rates and provided valuable comments on the versions of the manuscript. EG-M designed the idea of the study, organized the data, performed all the numerical analysis, drafted the tables and figures, and prepared the manuscript. ET, PS, DK, and CR obtained funding for the different projects.
Funding
This study was supported by CARPOS (MEC grant, REN2003-09532-C03-03), ADDEX (Xunta de Galicia grant, PGIDIT06PXIB312222PR), A Selva (Xunta de Galicia grant), IMAN (Xunta de Galicia grant, 07MMA002402PR), CO2 effect (Xunta de Galicia grant 07MMA013103PR), AMT21 grant (MICINN, CTM2009-0S069-E/MAR), NSPG (Gordon and Betty Moore Foundation award # 3749, and the National Science Foundation OCE 08-50827 and EF 0424599), SCALAR (MICINN, CTM2011-29616), DIFUNCAR (MICINN, CTM2008-03790), UK ICE-Chaser (MEC grant CTM2009-08616-E/ANT), and Shelf Sea Biogeochemistry SSB (NERC, NE/K00168X/1). The Atlantic Meridional Transect is funded by the UK Natural Environment Research Council through its National Capability Long-term Single Centre Science Programme, Climate Linked Atlantic Sector Science (Grant No. NE/R015953/1). This study contributes to the international IMBeR project and is contribution number 333 of the AMT programme. EG-M was funded by a FPU-MEC fellowship, NERC grant NE/K00168X/1, and by a research grant from The Leverhulme Trust (RPG-2017-089 awarded to University of East Anglia) during the writing of this paper. MA-G was funded by FPI-MCYT and SM-G was funded by a Marie Curie fellowship.
Conflict of Interest Statement
The authors declare that the research was conducted in the absence of any commercial or financial relationships that could be construed as a potential conflict of interest.
Acknowledgments
We thank the captain and crews of RRS Discovery, RRS James Clark Ross, RV Bio Hesperides and B/O Sarmiento de Gamboa. We are grateful to all the principal scientists of the projects as well as all the personnel who helped with the preparation and sampling of the cruise and laboratory experiments. We also thank Estación de Ciencias MAriñas de Toralla (ECIMAT) for technical support during the projects organized there.
Supplementary Material
The Supplementary Material for this article can be found online at: https://www.frontiersin.org/articles/10.3389/fmars.2019.00220/full#supplementary-material
References
Aranguren-Gassis, M., Teira, E., Serret, P., Martínez-García, S., and Fernández, E. (2012). Potential overestimation of bacterial respiration rates in oligotrophic plankton communities. Mar. Ecol. Prog. Ser. 453, 1–10. doi: 10.3354/meps09707
Arístegui, J. and Montero, M. F. (1995). The relationship between community respiration and ETS activity in the ocean. J. Plankton Res. 17, 1563–1571.
Båmstedt, U. (2000). A new method to estimate respiration rate of biological material based on the reduction of tetrazolium violet. J. Exp. Mar. Biol. Ecol. 251, 239–263. doi: 10.1016/s0022-0981(00)00217-3
Berridge, M. V., Herst, P. M., and Tan, A. S. (2005). Tetrazolium dyes as tools in cell biology: new insights into their cellular reduction. Biotechnol. Annu. Rev. 11, 127–152. doi: 10.1016/s1387-2656(05)11004-7
Berridge, M. V., Tan, A. S., McCoy, K. D., and Wang, R. (1996). The biochemical and cellular basis of cell proliferation assays that use tetrazolium salts. Biochemica 4, 14–19.
Bhupathiraju, V. K., Hernandez, M., Landfear, D., and Alvarez-Cohen, L. (1999). Application of a tetrazolium dye as an indicator of viability in anaerobic bacteria. J. Microbiol. Methods 37, 231–243. doi: 10.1016/s0167-7012(99)00069-x
Bittig, H. C., Körtzinger, A., Neill, C., van Ooijen, E., Plant, J. N., Hahn, J., et al. (2018). Oxygen optode sensors: principle, characterization, calibration, and application in the ocean. Front. Mar. Sci. 4:429. doi: 10.3389/fmars.2017.00429
Briand, E., Pringault, O., Jacquet, S., and Pascal, J. (2004). The use of oxygen microprobes to measure bacterial respiration for determining bacterioplankton growth efficiency. Limnol. Oceanogr. Methods 2, 406–416. doi: 10.4319/lom.2004.2.406
Carritt, D. E., and Carpenter, J. H. (1966). Comparison and evaluation of currently employed modifications of the winkler method for determining dissolved oxygen in seawater; a NASCO Report. J. Mar. Res. 24, 286–319.
Clarke, M. R. B. (1980). The reduced major axis of a bivariate sample. Biometrika 67, 441–446. doi: 10.1093/biomet/67.2.441
del Giorgio, P. A., and Duarte, C. M. (2002). Respiration in the open ocean. Nature 420, 379–384. doi: 10.1038/nature01165
Duarte, C., and Agusti, S. (1998). The CO2 balance of unproductive aquatic ecosystems. Science 281, 234–236.
Dufour, P., and Colon, M. (1992). The tetrazolium reduction method for assessing the viability of individual bacterial cells in aquatic environments: improvements, performance and applications. Hydrobiologia 232, 211–218. doi: 10.1007/bf00013706
Falkowski, P. G., Algeo, T., Codispoti, L., Deutsch, C., Emerson, S., Hales, B., et al. (2011). Ocean deoxygenation: past, present, and future. EOS Trans. Am. Geophys. Union 92, 409–410.
Farkas, T., Storebakken, T., and Bhosle, N. B. (1988). Composition and physical state of phospholipids in calanoid copepods from India and Norway. Lipids 23, 619–622. doi: 10.1007/bf02535608
Filella, A., Baños, I., Montero, M. F., Hernández-Hernández, N., Rodríguez-Santos, A., Ludwig, A., et al. (2018). Plankton community respiration and ETS activity under variable CO2 and nutrient fertilization during a mesocosm study in the Subtropical North Atlantic. Front. Mar. Sci. 5:310. doi: 10.3389/fmars.2018.00310
García-Martín, E. E., Aranguren-Gassis, M., Hartmann, M., Zubkov, M. V., and Serret, P. (2017). Contribution of bacterial respiration to plankton respiration from 50°N to 44°S in the Atlantic Ocean. Prog. Oceanogr. 158, 99–108. doi: 10.1016/j.pocean.2016.11.006
García-Martín, E. E., Daniels, C. J., Davidson, K., Davis, C. E., Mahaffey, C., Mayers, K. M. J., et al. (2018). Seasonal changes in plankton respiration and bacterial metabolism in a temperate shelf sea. Prog. Oceanogr. (in press). doi: 10.1016/j.pocean.2017.12.002
García-Martín, E. E., McNeill, S., Serret, P., and Leakey, R. J. G. (2014a). Plankton metabolism and bacterial growth efficiency in offshore waters along a latitudinal transect between the UK and Svalbard. Deep Sea Res. Part I Oceanogr. Res. Pap. 92, 141–151. doi: 10.1016/j.dsr.2014.06.004
García-Martín, E. E., Serret, P., and Leakey, R. J. G. (2014b). Plankton community and bacterial metabolism in Arctic sea ice leads during summer 2010. Deep Sea Res. Part I Oceanogr. Res. Pap. 92, 152–161. doi: 10.1016/j.dsr.2014.06.007
García-Martín, E. E., Serret, P., and Pérez-Lorenzo, M. (2011). Testing potential bias in marine plankton respiration rates by dark bottle incubations in the NW Iberian shelf: incubation time and bottle volume. Cont. Shelf Res. 31, 496–506. doi: 10.1016/j.csr.2010.07.006
Gattuso, J. P., Peduzzi, S., Pizay, M. D., and Tonolla, M. (2002). Changes in freshwater bacterial community composition during measurements of microbial and community respiration. J. Plankton Res. 24, 1197–1206. doi: 10.1093/plankt/24.11.1197
Hatzinger, P. B., Palmer, P., Smith, R. L., Peñarrieta, C. T., and Yoshinari, T. (2003). Applicability of tetrazolium salts for the measurement of respiratory activity and viability of groundwater bacteria. J. Microbiol. Methods 52, 47–58. doi: 10.1016/s0167-7012(02)00132-x
Iriarte, A., Daneri, G., Garcia, V. M. T., Purdie, D. A., and Crawford, D. W. (1991). Plankton community respiration and its relationship to chlorophyll a concentration in marine coastal waters. Oceanologica Acta 14, 379–388.
Jahnke, R. A., and Craven, D. B. (1995). Quantifying the role of heterotrophic bacteria in the carbon cycle: a need for respiration rate measurements. Limnol. Oceanogr. 40, 436–441. doi: 10.4319/lo.1995.40.2.0436
Janech, M. G., Krell, A., Mock, T., Kang, J.-S., and Raymond, J. A. (2006). Ice binding proteins from sea ice diatoms (Bacillariophyceae). J. Phycol. 42, 410–416. doi: 10.1016/j.cryobiol.2011.08.005
Lønborg, C., Nieto-Cid, M., Hernando-Morales, V., Hernández-Ruiz, M., Teira, E., and Álvarez-Salgado, X. A. (2016). Photochemical alteration of dissolved organic matter and the subsequent effects on bacterial carbon cycling and diversity. FEMS Microb. Ecol. 92:fiw048. doi: 10.1093/femsec/fiw048
Maldonado, F., Packard, T., and Gómez, M. (2012). Understanding tetrazolium reduction and the importance of substrates in measuring respiratory electron transport activity. J. Exp. Mar. Biol. Ecol. 434, 110–118. doi: 10.1016/j.jembe.2012.08.010
Martínez-García, S., Arbones, B., García-Martín, E. E., Teixeira, I. G., Serret, P., Fernández, E., et al. (2015). Impact of atmospheric deposition on the metabolism of coastal microbial communities. Estuar. Coast. Shelf Sci. 153, 18–28. doi: 10.1016/j.ecss.2014.11.025
Martínez-García, S., Fernández, E., Álvarez-Salgado X.-A., González, J., Lønborg, C., Marañón, E., et al. (2010). Differential responses of phytoplankton and heterotrophic bacteria to organic and inorganic nutrient additions in coastal waters off the NW Iberian Peninsula. Mar. Ecol. Prog. Ser. 416, 17–33. doi: 10.3354/meps08776
Martínez-García, S., Fernández, E., Aranguren-Gassis, M., and Teira, E. (2009). In vivo electron transport system activity: a method to estimate respiration in natural marine microbial planktonic communities. Limnol. Oceanogr. Methods 7, 459–469. doi: 10.4319/lom.2009.7.459
Martínez-García, S., Fernández, E., del Valle, D. A., Karl, D. M., and Teira, E. (2013). Experimental assessment of marine bacterial respiration. Aquat. Microb. Ecol. 70, 189–205. doi: 10.3354/ame01644
Martínez-García, S., and Karl, D. M. (2015). Microbial respiration in the euphotic zone at Station ALOHA. Limnol. Oceanogr. 60, 1039–1050. doi: 10.1002/lno.10072
Mosher, J. J., Levison, B. S., and Johnston, C. G. (2003). A simplified dehydrogenase enzyme assay in contaminated sediment using 2-(p-iodophenyl)-3 (p-nitrophenyl)-5-phenyl tetrazolium chloride. J. Microbiol. Methods 53, 411–415. doi: 10.1016/s0167-7012(02)00251-8
Nachlas, M. M., Margulies, S. I., and Seligman, A. M. (1960). Sites of electron transfer to tetrazolium salts in the succinoxidase system. J. Biol. Chem. 235, 2737–2743.
Oudot, C., Gerard, R., Morin, P., and Gningue, I. (1988). Precise shipboard determination of dissolved oxygen (Winkler procedure) for productivity studies with a commercial system. Limnol. Oceanogr. 33, 146–150. doi: 10.4319/lo.1988.33.1.0146
Packard, T. T. (1971). The measurement of respiratory electron transport activity in marine phytoplankton. J. Mar. Res. 29, 235–244.
Padfield, D., Yvon-Durocher, G., Buckling, A., Jennings, S., Yvon-Durocher, G., and Hillebrand, H. (2016). Rapid evolution of metabolic traits explains thermal adaptation in phytoplankton. Ecol. Lett. 19, 133–142. doi: 10.1111/ele.12545
Pomeroy, L. R., Sheldon, J. E., and Sheldon, W. M. (1994). Changes in bacterial numbers and leucine assimilation during estimations of microbial respiratory rates in seawater by the precision Winkler method. Appl. Environ. Microbiol. 60, 328–332.
Regaudie de Gioux, A. and Duarte, C. M. (2013). Global patterns in oceanic planktonic metabolism. Limnol. Oceanogr. 58, 977–983. doi: 10.4319/lo.2013.58.3.0977
Robinson, C., and Williams, P. (2005). “Respiration and its measurements in surface marine waters,” in Respiration in Aquatic Ecosystems, eds P. Del Giorgio and P. J. L. B. Williams (Oxford: Oxford University Press), 147–180. doi: 10.1093/acprof:oso/9780198527084.003.0009
Rodriguez, G. G., Phipps, D., Ishiguro, K., and Ridgway, H. F. (1992). Use of a fluorescent redox probe for direct visualization of actively respiring bacteria. Appl. Environ. Microbiol. 58, 1801–1808.
Serret, P., Robinson, C., Aranguren-Gassis, M., Garcia-Martin, E. E., Gist, N., Kitidis, V., et al. (2015). Both respiration and photosynthesis determine the scaling of plankton metabolism in the oligotrophic ocean. Nat. Commun. 6:6961. doi: 10.1038/ncomms7961
Smith, J., and McFeters, G. (1997). Mechanism of INT (2-(4-iodophenyl)-3-(4-nitrophenyl)-5-phenyl tetrazolium chloride), and CTC (5-cyano-2,3-ditolyl tetrazolium chloride) reduction in Escherichia coli K-12. J. Microbiol. Methods 29, 161–175. doi: 10.1016/s0167-7012(97)00036-5
Smith, R. J. (1994). Regression models for prediction equations. J. Hum. Evol. 26, 239–244. doi: 10.1006/jhev.1994.1013
Smith, R. J. (2009). Use and misuse of the reduced major axis for line-fitting. Am. J. Phys. Anthropol. 140, 476–486. doi: 10.1002/ajpa.21090
Tarran, G. A., Heywood, J. L., and Zubkov, M. V. (2006). Latitudinal changes in the standing stocks of nano- and picoeukaryotic phytoplankton in the Atlantic Ocean. Deep Sea Res. Part II Top. Stud. Oceanogr. 53, 1516–1529. doi: 10.1016/j.dsr2.2006.05.004
Teira, E., Fernández, A., Álvarez-Salgado, X. A., García-Martín, E. E., Serret, P., and Sobrino, C. (2012). Response of two marine bacterial isolates to high CO2 concentration. Mar. Ecol. Prog. Ser. 453, 27–36. doi: 10.3354/meps09644
Teira, E., Martínez-García, S., Fernández, E., Calvo-Díaz, A., and Morán, X. A. G. (2010). Lagrangian study of microbial plankton respiration in the subtropical North Atlantic Ocean: bacterial contribution and short-term temporal variability. Aquat. Microb. Ecol. 61, 31–43. doi: 10.3354/ame01438
Tengberg, A., Hovdenes, J., Andersson, H., Brocandel, O., Diaz, R., Hebert, D., et al. (2006). Evaluation of a lifetime-based optode to measure oxygen in aquatic systems. Limnol. Oceanogr. Methods 4, 7–17. doi: 10.4319/lom.2006.4.7
Thompson, G. A. (1989). Membrane acclimation by unicellular organisms in response to temperature change. J. Bioenerg. Biomembr. 21, 43–60. doi: 10.1007/bf00762211
Thorm, S. M., Horobin, R. W., Seidler, E., and Barer, M. R. (1993). Factors affecting the selection and use of tetrazolium salts as cytochemical indicators of microbial variability and activity. J. Appl. Bacteriol. 74, 433–443.
Trevors, J. T., Mayfield, C. I., and Inniss, W. E. (1982). Measurement of electron transport system (ETS) activity in soil. Microb. Ecol. 8, 163–168. doi: 10.1007/BF02010449
Ullrich, S., Karrasch, B., Hoppe, H., Jeskulke, K., and Mehrens, M. (1996). Toxic effects on bacterial metabolism of the redox dye 5-cyano-2, 3-ditolyl tetrazolium chloride. Appl. Environ. Microbiol. 62, 4587–4593.
Villegas-Mendoza, J., Cajal-Medrano, R., and Maske, H. (2015). INT (2-(4-iodophenyl)-3-(4-nitrophenyl)-5-(phenyl) tetrazolium chloride) is toxic to prokaryote cells precluding its use with whole cells as a proxy for in vivo respiration. Microb. Ecol. 70, 1004–1011. doi: 10.1007/s00248-015-0626-3
Wikner, J., Panigrahi, S., Nydahl, A., Lundberg, E., Båmstedt, U., and Tengberg, A. (2013). Precise continuous measurements of pelagic respiration in coastal waters with oxygen optodes. Limnol. Oceanogr. Methods 11, 1–15. doi: 10.4319/lom.2013.11.1
Williams, P. (1998). The balance of plankton respiration and photosynthesis in the open ocean. Nature 394, 55–57. doi: 10.1038/27878
Williams, P., and Jenkinson, N. (1982). A transportable microprocessor-controlled precise Winkler titration suitable for field station and shipboard use. Limnol. Oceanogr. 27, 576–584. doi: 10.4319/lo.1982.27.3.0576
Keywords: plankton respiration, INT reduction, dissolved oxygen consumption, empirical conversion model, chlorophyll-a, temperature
Citation: García-Martín EE, Aranguren-Gassis M, Karl DM, Martínez-García S, Robinson C, Serret P and Teira E (2019) Validation of the in vivo Iodo-Nitro-Tetrazolium (INT) Salt Reduction Method as a Proxy for Plankton Respiration. Front. Mar. Sci. 6:220. doi: 10.3389/fmars.2019.00220
Received: 06 July 2018; Accepted: 09 April 2019;
Published: 03 May 2019.
Edited by:
Gordon T. Taylor, Stony Brook University, United StatesReviewed by:
Josue Villegas-mendoza, Universidad Autónoma de Baja California, MexicoFrancesca Malfatti, Istituto Nazionale di Oceanografia e di Geofisica Sperimentale (OGS), Italy
Copyright © 2019 García-Martín, Aranguren-Gassis, Karl, Martínez-García, Robinson, Serret and Teira. This is an open-access article distributed under the terms of the Creative Commons Attribution License (CC BY). The use, distribution or reproduction in other forums is permitted, provided the original author(s) and the copyright owner(s) are credited and that the original publication in this journal is cited, in accordance with accepted academic practice. No use, distribution or reproduction is permitted which does not comply with these terms.
*Correspondence: E. Elena García-Martín, Enma.Garcia-Martin@uea.ac.uk