Phosphorus Dynamics and Availability in the Nearshore of Eastern Lake Erie: Insights From Oxygen Isotope Ratios of Phosphate
 David C. Depew
 Geoffrey Koehler2
 - 1Watershed Hydrology and Ecology Research Division, Environment and Climate Change Canada, Burlington, ON, Canada
- 2Watershed Hydrology and Ecology Research Division, Environment and Climate Change Canada, Saskatoon, SK, Canada
Blooms of filamentous benthic algae that plagued Lake Erie in the 1950s through 1970s were largely reduced through reductions of phosphorus (P) loading from point sources. Since the mid-1990s, these blooms have returned despite a period of relatively stable external P inputs. While increased loadings of dissolved P have been causally linked to cyanobacterial blooms in some parts of the lake, the impacts of ecosystem changes such as the effect of invasive species on nutrient cycling and availability have not been fully elucidated, leading to uncertainty as to the effectiveness of additional non-point P management actions. Here we use the oxygen isotope ratios (δ18OP) of phosphate in concert with measures of water quality along the northern shore of the east basin of Lake Erie to identify sources and pathways of P cycling and infer potential importance in relation to annual blooms of Cladophora that foul the shorelines of eastern Lake Erie. δ18OP data indicate that potential external source signatures are rapidly overprinted by biological cycling of P by the plankton community and that much of the available phosphate in the nearshore waters is derived from hydrolysis of dissolved organic P compounds. Near the dreissenid-colonized lake bed, δ18OP was persistently and significantly enriched in 18O relative to δ18OP measured in surface waters and was similar to δ18OP of phosphate excreted by dreissenid mussels in incubations. These results implicate dreissenid mussels as key agents in nearshore P cycling and highlight the importance of considering ecosystem changes in the development of nutrient management strategies designed to ameliorate symptoms of eutrophication.
Introduction
In the North American Laurentian Great Lakes, blooms of filamentous green algae (mostly Cladophora sp.) were one of the most visible signs of cultural eutrophication in the early 1950s through to the late 1970s, particularly in Lake Erie (Shear and Konasewich, 1975; Higgins et al., 2008). Phosphorus (P) abatement programs under the Great Lakes Water Quality Agreement (GLWQA) resulted in rapid and substantial reductions in external P inputs, that while primarily aimed at reducing extensive phytoplankton blooms, hypoxia, and fish kills, also appeared to reduce Cladophora blooms although confirmational data are limited (Painter and McCabe, 1987). Despite these apparent improvements, reports of expansive blooms of Cladophora increased in frequency in eastern Lake Erie in the mid to late 1990s (Higgins et al., 2005) following P load reductions but also colonization of Lake Erie by exotic zebra (Dreissena polymorpha) and quagga (D. rostriformis bugensis) mussels (Griffiths et al., 1991; Roe and MacIsaac, 1997). It was postulated that the recurrence of these blooms during a period of stable or declining P loads (Dolan and Chapra, 2012) was in part related to structural and functional changes to the ecosystem mediated by large populations of filter feeding dreissenid mussels (Hecky et al., 2004) that increased water clarity (Howell et al., 1996), expanded areas of hard substrate for algal attachment (Haltuch et al., 2000), and enriched the benthic environment through the excretion of metabolic wastes and undigested algae (Arnott and Vanni, 1996; Conroy et al., 2005). At the same time, changing agricultural practices, precipitation patterns, and weather conditions have increased soluble P loadings to western Lake Erie, resulting in a recurrence of cyanobacterial blooms (Michalak et al., 2013). While there is general agreement reductions in P availability are the most practical means with which to reduce the extent and severity of Cladophora blooms (Auer et al., 2010), uncertainty remains as to the relative importance of direct P inputs, P circulating within the lake, and P potentially recycled in the benthic environment by dreissenid mussels (Bootsma et al., 2015). These uncertainties have confounded efforts to develop revised P loading targets for the east basin of Lake Erie to address Cladophora blooms (GLWQA, 2015).
Several recent studies have indicated that the relative abundance of oxygen stable isotopes in phosphate (δ18OP) carries information regarding the sources and biological cycling of phosphate (PO4, hereafter Pi) in aquatic environments (Colman et al., 2005; McLaughlin et al., 2006b, 2013; Elsbury et al., 2009; Joshi et al., 2015; Li et al., 2017). The strong bond between oxygen and phosphorus atoms in phosphate are resistant to oxygen exchange under most environmentally relevant conditions (Paytan and McLaughlin, 2012). While isotopic fractionation effects of abiotic processes such as sorption and desorption appear to be relatively minor (Jaisi et al., 2010, 2011), fractionation during biologically mediated enzymatic reactions can be large and at times, substrate and enzyme dependent (Blake, 2005; Liang and Blake, 2006, 2009). The uptake and internal cycling of Pi by intracellular pyrophosphatases (EC 3.6.1.1) results in complete exchange of all oxygen atoms from Pi with oxygen atoms from water, leading to a rapid temperature-dependent equilibrium between oxygen in Pi and intracellular water (Longinelli and Nuti, 1973; Blake, 2005), which is expected to be equal to that of ambient water (δ18OW) (but see Li et al., 2016b). This isotopic equilibration has been observed in many environments to be an indicator of Pi turnover (McLaughlin et al., 2006b, 2013). Hydrolysis of organic phosphorus (OP) by various extra- and intracellular phosphatases and phosphohydrolases (for example, alkaline phosphatase; EC 3.1.3.1, 5' nucleotidase; EC 3.1.3.5, phosphodiesterase EC 3.1.4.1) impart a negative fractionation at the P-O bond site, shifting the δ18OP of the product (Pi) further away from equilibrium (Liang and Blake, 2006, 2009). Consequently, knowledge of these reactions and pathways may provide a means to identify sources of P or the importance of specific P cycling pathways governing Pi availability in aquatic ecosystems (Elsbury et al., 2009; McLaughlin et al., 2013; Joshi et al., 2015; Granger et al., 2017b; Li et al., 2017).
Initial application of this approach in central and western Lake Erie indicated the presence of two distinct sources of Pi; riverine inputs (~+12‰) and a second, isotopically heavier source (~+17‰) of unknown origin (Elsbury et al., 2009). Subsequent investigations have suggested that this Pi is derived primarily by redox mediated release from anoxic sediments in the central basin (Paytan et al., 2017). Given the apparent success at identifying different Pi sources in central and western Lake Erie and the residual uncertainty regarding the relevance of external vs. internal sources of Pi associated with Cladophora blooms, we sought to apply this approach to (1) examine the influence of the Grand River on nearshore phosphorus concentrations (2) investigate the utility of stable isotopes of oxygen in phosphate for differentiating Pi sources in the nearshore of the eastern basin and (3) to improve our understanding of P dynamics in a dynamic coastal environment. Our results presented here add to the expanding library of freshwater δ18OP data, particularly at the oligotrophic end of the spectrum. In addition, we provide data from a eutrophic river and to our knowledge, the first measurements of δ18OP generated by filter feeding bivalves. An improved understanding of the sources of Pi and the manner in which it is processed and recycled within the nearshore are of critical importance to establishing effective nutrient management strategies to ameliorate Cladophora blooms as required by the amended (GLWQA, 2012).
Materials and Methods
Study Region
The eastern basin of Lake Erie is the deepest of the three basins (64 m maximum depth) and is considered oligotrophic based on long term monitoring of phosphorus concentrations (mean spring TP ~0.32 μM; Dove and Chapra, 2015). The eastern basin receives ~40% of its total P load from the Grand River (Figure 1) while the remainder comes via exchange with the central basin and other smaller tributaries around the north and south shores of the basin (Maccoux et al., 2016). With prevailing winds from the southwest direction, the north shore littoral region is subjected to a large fetch and this highly exposed shoreline is dominated by limestone bedrock with smaller regions of glacial till and sand (Rukavina and St. Jacques, 1971). Dreissenid mussels have colonized most of the hard substrate along this shore and remain a dominant feature of the benthos (Patterson et al., 2005; Chomicki et al., 2016).
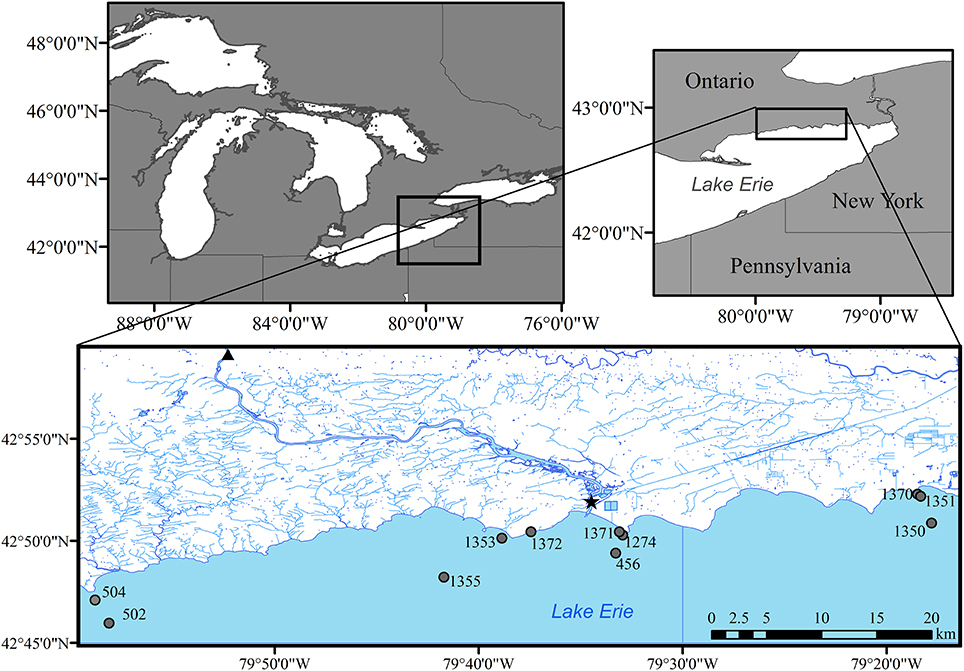
Figure 1. Sampling sites in eastern Lake Erie during 2014, including lake stations (circles), river mouth (star), and long term nutrient loading station (triangle) for the Grand River at York, Ontario.
Water Sample Collection and Nutrient Analysis
Water samples were collected on four to five occasions in 2013 and 2014 between the months of April and September at 12 sites along the northern shore of the east basin of Lake Erie (Figure 1). Vertical profiles of temperature, specific conductivity, pH, dissolved oxygen, the physical structure of the water column were collected at each site with a YSI-6600 or EXO-2 water quality sonde prior to initiation of sampling. All water samples were collected using a submersible pump and stored in acid-cleaned 4 L HDPE jugs, placed on ice in coolers until processing for total phosphorus (TP), total dissolved phosphorus (TDP), soluble reactive phosphorus (SRP), ammonia (NH3), nitrate/nitrite (NO3/NO2), total chlorophyll a (CHLA), particulate carbon (PC), and particulate nitrogen (PN). Water samples were processed for the above parameters following (Dove et al., 2009) and analyzed at the National Laboratory for Environmental Testing, Burlington ON. Particulate P (PP) was calculated as TP—TDP and dissolved organic P (DOP) was calculated as TDP-SRP.
For isotopic analyses of water and Pi, additional samples were collected with a target volume of ~200 L (to attain a minimum of 10 μM Pi) from selected depths using a submersible pump mounted on a tripod (Table 1): surface (S; 1.0 m depth) and ~0.1 m above the lake bottom (LB). To minimize boundary layer disturbance, the pump flow rates were set to ~50–60 mL min−1, resulting in collection times of ~1 h. Pumped water was passed under low pressure first through a 1 μm polypropylene depth cartridge filter (Hytrex®) and then through a 0.2 μm pleated polypropylene filter (Flotrex®; FPN921BGS) to remove particles and colloidal material and collected in 10 20 L acid cleaned carboys. To each carboy, ~50 g of MgCl2 (Fisher Scientific, ACS grade) was added and dissolved followed by an addition of 100 mL of 1M NaOH (Fisher Scientific, ACS grade) to achieve a loading of ~0.3% v:v to induce precipitation of brucite (MgOH2) (Karl and Tien, 1992; Thomson-Bulldis and Karl, 1998). Fixed sample bottles were kept darkened and cool until further processing upon return to shore (see below).
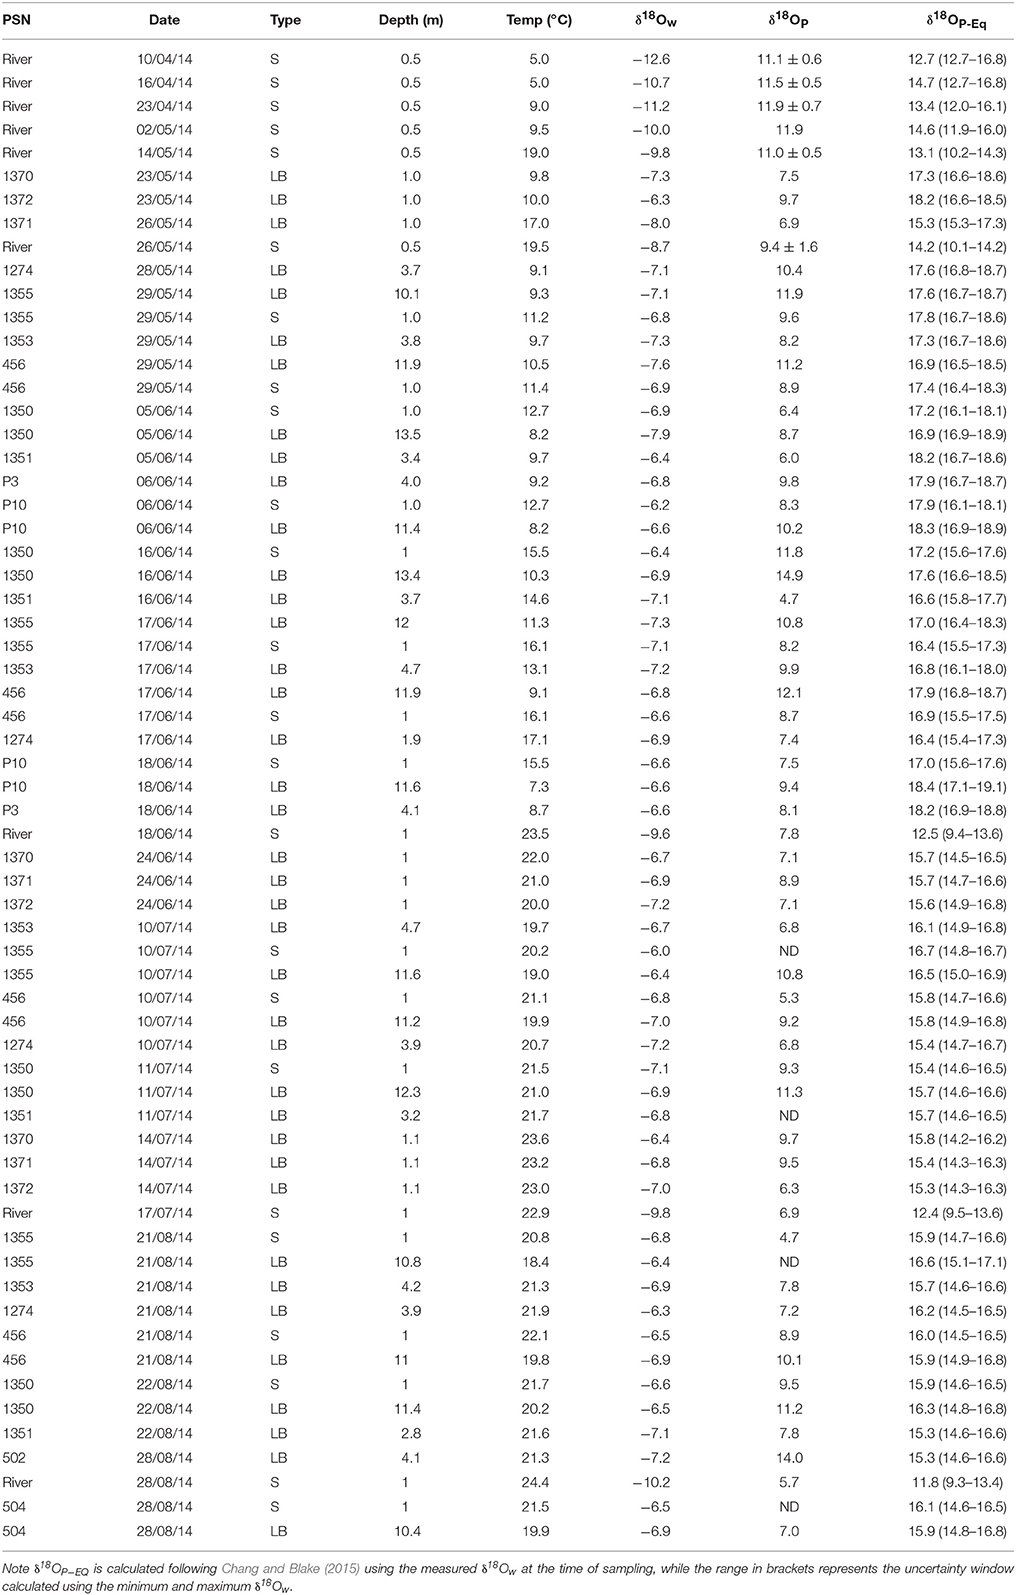
Table 1. Oxygen isotopic compositions of water (δ18Ow), phosphate (δ18OP), and calculated equilibrium phosphate oxygen isotopic compositions (δ18OP−EQ) for different sites, dates, and depths in eastern Lake Erie and the lower Grand River.
Phosphate and Water Oxygen Isotope Analysis
To analyze δ18OP in Pi, the brucite floc from each set of carboys was allowed to settle before siphoning supernatant water away. Samples were combined into a smaller number of carboys and this process was repeated until ~10 L of brucite floc remained. Sufficient 1M HNO3 (ACS grade) was added to dissolve the brucite floc, but keep the pH of the sample between 5 and 7. 1M NaOH was then added to re-precipitate brucite and reduce the overall sample volume. At least three cycles were required to reduce sample volumes from 200 L to ~50 mL. At each stage, SRP and TDP concentrations in both the sample and supernatant were measured after reagent addition to ensure >99% recovery of SRP (i.e., SRP in supernatant was not detectable). Recovery of SRP was always >99% while recovery of TDP varied between 5 and 53%, depending on the sample and amount of 1M NaOH required.
Initially, we sought to precipitate silver phosphate (Ag3PO4) following the protocol of McLaughlin et al. (2004). However, we were unable to generate Ag3PO4 that was sufficiently clean of contaminant oxygen using this approach. Consequently samples collected in 2013 were deemed contaminated and are not presented herein. For samples collected in 2014, we adapted the approach of Colman et al. (2005) to remove organic matter prior to undergoing sequential precipitation and crystallization steps. Briefly, concentrated samples (~50 mL) were run through Oasis HLB resin columns (1 mL min−1 flow rate) to remove organic matter. Pi in the now cleaned sample was first precipitated as ammonium phosphomolybdate (APM) and then magnesium ammonium phosphate (MAP) (Kolodny et al., 1983; Tamburini et al., 2010) to separate Pi from remaining impurities. Following dissolution of the MAP precipitate, cations were removed with BioRad AGx50 cation resin, and samples were evaporated to a total volume of ~1.0 mL prior to precipitation of Ag3PO4. Ag3PO4 crystals were cleaned with H2O2 (15%; Tamburini et al., 2010), washed copiously with distilled water, dried at 60°C and stored in a dessicator prior to analysis. When possible, samples were processed in duplicate with 18O enriched reagents (±59.7‰) to assess potential for hydrolysis of organic P compounds. For the limited number of samples with sufficient phosphate recovered that we could process with enriched reagents (n = 9), the difference between spiked and un-spiked samples was on average < 1.5‰, thus we conclude that minimal hydrolysis occurred during processing and purification.
Between 0.25 and 0.35 mg of sample and nickelized carbon were added to silver capsules (pre-baked @ 500 C, 4 h) and shipped to the National Hydrology Research Centre in Saskatoon, SK. Samples were run in duplicate or triplicate if sufficient Ag3PO4 was recovered, but the majority of samples only had sufficient Ag3PO4 for a single analysis. Oxygen stable isotope analyses were accomplished by thermal conversion of Ag3PO4 to CO by reaction with glassy carbon at 1450°C in a Thermo Finnigan TC/EA device. Reaction gasses were separated by gas chromatography and the resultant CO introduced to a Thermo Finnigan Delta V Isotope Ratio Mass Spectrometer (IRMS). We used crimped silver capillaries (Longinelli and Nuti, 1973) containing amount equivalent aliquots of USGS UC03 (δ18O = +29.8‰) and IAEA VSMOW (δ18O = 0.0‰) to normalize raw δ18O values from the mass spectrometer to the SMOW scale. An internal laboratory standard (0.3 μM; K2HPO4; Fisher, ACS Grade) was prepared in 10 L of filtered (< 0.2 μm) Lake Erie water that had been previously stripped of Pi using brucite flocculation as above. Internal standards were run as samples and averaged +9.6 ± 0.3‰ (un-spiked reagents) and + 9.9 ± 0.1‰ (spiked reagents). Certified reference material B2207 (Isomass Scientific) measured 22.1 ± 0.5‰. Analytical precision averaged 0.6‰. All values are reported using standard delta notation relative to Vienna Standard Mean Ocean Water (VSMOW).
Samples for water δ18OW were collected whenever samples were taken for δ18OP by filtering ~2 mL of lake water through a 0.45 μm cellulose acetate syringe filter into 2 mL glass vials. Vials were stored on ice and refrigerated until analysis by Off-Axis Integrated Output Spectroscopy (OA-ICOS) on a Los Gatos Research DLT-100 Liquid Water Isotope Analyser. We used two internal references waters, ROD3 and INV1 (δ18O = −1.1 and −28.3‰, respectively), to calibrate the raw values to the SMOW scale. The analytical precision of δ18OW values was determined by duplicate analyses of samples and internal references and is ± 0.2‰.
Dreissenid Mussel and Cladophora Sampling
Benthic surveys to collected dreissenid mussels and Cladophora were conducted at similar intervals in 2013 and 2014 at a larger number of stations in the study area as part of a targeted monitoring effort, however we only report data relevant to the stations identified in this study for 2014 as these surveys were conducted within 1 to 4 days of sampling for water chemistry and isotopes. Briefly, mussels and algae were harvested from three 0.15 m2 quadrats at each station (with the exception of 1 m depth stations where a 0.125 m2 quadrat was used). Mussels were removed by hand or by scraping while applying an airlift device to collect samples in a mesh bag. Samples were stored cool on ice until return to the laboratory in Burlington, ON and subsequently cleaned of debris and frozen prior to analysis. After lyophilization, mussels were counted, weighed, measured, and soft tissue removed to estimate densities of live individuals and biomass (as shell free dry mass, SFDM m−2). For sites with algae collected concurrently, algal filaments were first cleaned in the field by washing with lake water. Upon return to the laboratory, algal filaments were cleaned under DI water and subsequently frozen. Algal biomass was determined after lyophilization and expressed as dry mass (g DM m−2).
Dreissenid Incubations
Live dreissenid mussels were collected in July of 2013 and May of 2014 to aid in characterizing the δ18OP of Pi excreted by mussels (δ18OP_DM). Divers harvested intact mussels by hand into a fine mesh bag. Mussels were placed in ziplock bags with damp paper towel and stored on ice for transport to the laboratory in Burlington, ON. Upon arrival, mussels were gently separated from rocks, shell material and other debris, brushed clean with a toothbrush under running DI water. Between 75 and 150 individual mussels (10–30 mm valve length) were placed into acid washed 4 L polypropylene jars filled with filtered (< 0.2 μm) Lake Erie water. Jars were aerated with air stones, and mussels were allowed to defecate and excrete for 12–36 h under a 16:8 L:D cycle at ± 2°C of lake temperature. SRP concentrations were monitored in the chambers until sufficient P had accumulated for analysis (~10 μmol). Lakewater was gently decanted and siphoned from the jar, filtered through a 0.45 μm cellulose acetate filter, and processed as described above for δ18OP.
Calculation of Isotopic Equilibrium Values for Phosphate
The theoretical isotopic equilibrium values for Pi (δ18OP_EQ) can be calculated using Pi water fractionation equations derived by Chang and Blake (2015) using Equation (1);
δ18OP_EQ values were calculated for each sample using the measured δ18Ow and temperature from the water column profiles. To assess uncertainty, we calculated δ18OP_EQ using the minimum and maximum δ18Ow for the entire study period for lake and river sites respectively.
Fraction of River Water and Expected Nutrient Concentrations
To estimate the relative influence of the river on nutrient conditions at the study sites, we used a linear mixing model to estimate the fractional contribution of river water (FRW) at lake sites using the measured values of δ18Ow
where δ18Ows is the water δ18Ow value at each site, δ18Owr is the water δ18Ow value at the river mouth and δ18Owl is the highest water δ18Ow value observed at the open lake sites. We elected to use the highest δ18Ow value for each survey period as there was some spatial and temporal variation in δ18Ow, possibly due to larger scale circulation features. For each site (i), we calculated the expected concentration of PP, TDP, and SRP assuming conservative mixing between the open lake and river;
Where CP(i) is the expected concentration of P (PP, TDP, or SRP) at each site, CP(l) is the concentration of P for the open lake end member, and CP(r) is the concentration of P at the river mouth. We used the average concentrations for sites with FRW < 0.1 to derive the open lake end member values for each survey, and CP(r) is represented by the phosphorus concentration at the river mouth.
Results
Influence of the Grand River and Patterns of Nutrient Variation in the Nearshore
δ18Ow values ranged from −12.6 to −8.6‰ at the river mouth but were more constrained at the lake sites, ranging from −7.9 to −6.0‰ (Table 1). The calculated fraction of river water (FRW) was variable over all surveys but was highest in late May—early June, reaching up to 0.8 at shallow stations ~2 km due east of the river mouth (Figure 2). While FRW was highest after the spring runoff period, values ranged from near 0 to ~0.35 between June and August surveys, particularly at stations east of the river mouth (Figure 2). FRW tended to increase with increasing river discharge (Figure 2) although the correlation was weak (r = 0.23, p < 0.1).
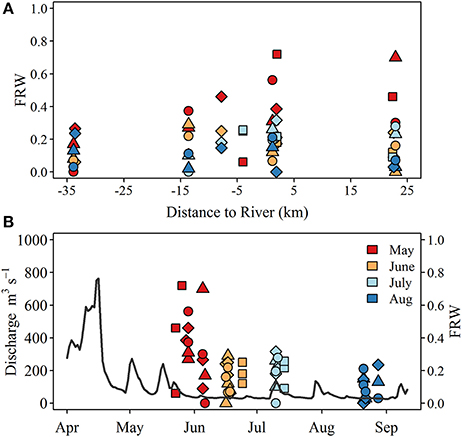
Figure 2. (A) Spatial and (B) temporal pattern of the estimated fraction of river water (FRW) observed at lake sites. Symbols indicate sample type including surface (S; circle), lakebed 10 m (LB10; triangle), lakebed 3 m (LB3; diamond), and lakebed 1 m (LB1; squares). Gray line in (B) represents Grand River discharge measured at the monitoring station located at York (see Figure 1). Note the x-axis in (A) denotes the west (negative) and east (positive) distances of each sampling site from the mouth of the Grand River.
Nutrient concentrations were often higher and more variable in proximity to the Grand River mixing area. Total phosphorus, total dissolved phosphorus and soluble reactive phosphorus (TP, TDP, and SRP) were negatively correlated with distance from the river mouth (r = −0.42, r = −0.39, r = −0.34, p < 0.001, p < 0.001, p < 0.01, respectively). Nitrate (NO3) and dissolved organic carbon (DOC) concentrations were also strongly negatively related to distance from the Grand River mouth (r = −0.48, r = −0.48, p < 0.001, respectively). Ammonia (NH3) was the only nutrient parameter measured that did not display any spatial gradient in relation to the Grand River (r = −0.17, p > 0.2).
Despite apparently elevated phosphorus concentrations at sites close to the river, deviation from expected concentrations based on a simple two member mixing model indicated strongly non-conservative behavior for both particulate and dissolved fractions in late May—early June. Notably, the deviations were strongest as FRW increased suggesting rapid consumption/settling or uptake processes were active (Figure 3A). From mid-June to August, the same general trend was apparent for particulate P, but was somewhat attenuated for TDP and SRP, largely because the concentration difference of TDP and SRP between river mouth station and open lake sites was small (Figures 3B–D). Some positive excursions for particulate P were evident at 1 m depth sites (Figures 3B,C) suggesting possible resuspension of sediment or sloughed periphyton. During mid-June, July and August surveys, TDP and SRP were generally lower than predicted for LB samples from shallow water (1 and 3 m depth) sites, with the exception of PSN 1371 and 1274 in July (Figure 3C). TDP and SRP in LB samples at 10 m sites were often (but not always) elevated relative to expected concentrations predicted from mixing alone (Figure 3).
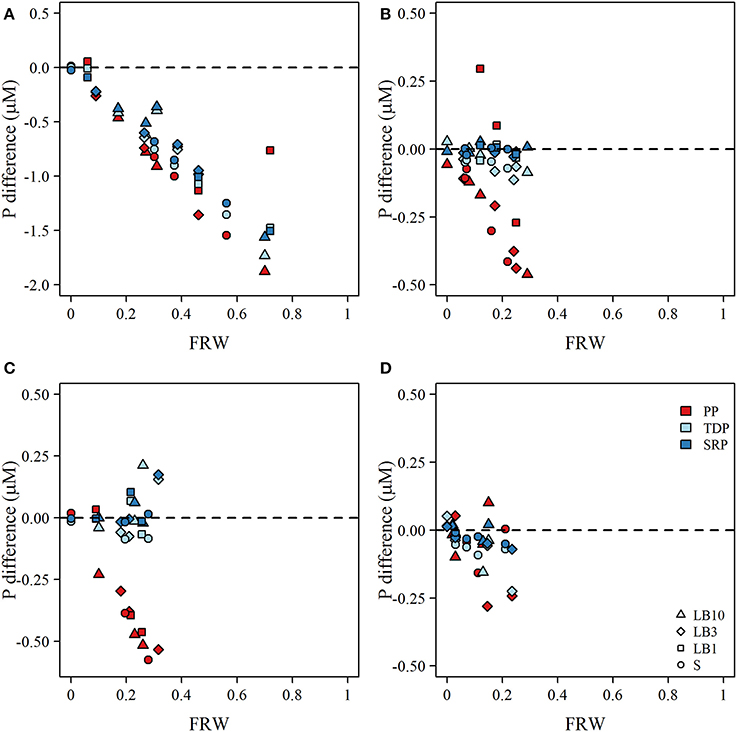
Figure 3. Plot the calculated difference between observed and expected concentrations of particulate P (PP), total dissolved P (TDP), and soluble reactive P (SRP) as a function of the fraction of river water (FRW) at each site for (A) late-May to early-June, (B) June, (C) July, and (D) August. Symbols correspond to surface (S; circles), lakebed 10 m (LB10; triangle), lakebed 3 m (LB3; diamond), and lakebed 1 m (LB1; squares). Dashed line in each panel indicates the difference in concentration that would occur if mixing PP, TDP, and SRP of river and lake water were conservative assuming a two—member mixing model.Expected concentrations were calculated collowing Equation (3).
Dreissenid Mussel and Cladophora Distribution
Plots of Cladophora and dreissenid mussel abundance and biomass (SFDM m−2) are shown in Figure 4. Cladophora biomass ranged from 0 to 189 g DM m−2, reaching maximum values at 1 m depth in June and July (Figure 4). Cladophora biomass at 3 m depth sites did not exceed 25 g DM m−2 and at 10 m sites did not exceed 2 g DM m−2 (Figure 4). Dreissenid abundance and biomass varied widely between surveys and locations (6–2131 m−2 and 0.2–65 g SFDM m−2 respectively). Dreissenid abundance and biomass was clearly higher at 10 m depth sites than 3 m sites. No strong spatial patterns in dreissenid abundance or biomass were observed, and although Cladophora biomass was high at the 1 m sites close to the Grand River, we do not have data for similar depths at greater distances to the west side of the river, which obscures the lack of spatial patterns observed in other years (D.Depew, unpubl.data).
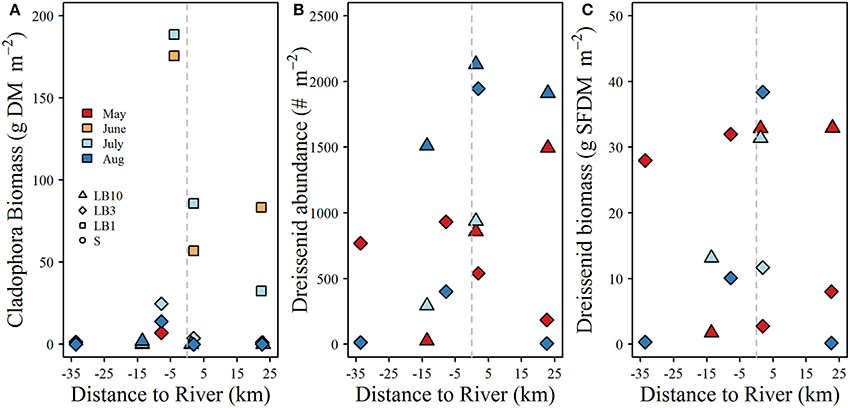
Figure 4. (A) Cladophora biomass, (B) dreissenid mussel abundance, and (C) dreissenid biomass as a function of distance from the Grand River at study sites where isotope samples were collected. Note the x-axis in each panel denotes the west (negative) and east (positive) distances of each sampling site from the mouth of the Grand River. All benthic samples were collected within the same week as water quality and stable isotope samples.
Oxygen Isotopic Composition of River and Lake Samples
δ18OP and calculated δ18OP_EQ values for all stations and dates are shown in Table 1; and their spatial/seasonal and depth distributions in Figure 5 through Figure 7. δ18OP_EQ values at the river mouth were isotopically lighter compared to lake sites (Table 1). The seasonal dynamics of δ18OP at the river mouth are displayed in Figure 5. During freshet period (April-late May), despite large variation in river discharge, δ18OP varied relatively little, ranging between +11.1 ± 0.6 and +11.9 ± 0.7‰ and overlapped the δ18OP_EQ window at times (Figure 5). From mid-May to late August, δ18OP declined steadily (δ18OP in the river was significantly correlated with day of year; r = −0.95, p < 0.001) through the season reaching a low of +5.7‰ in late August (Figure 5).
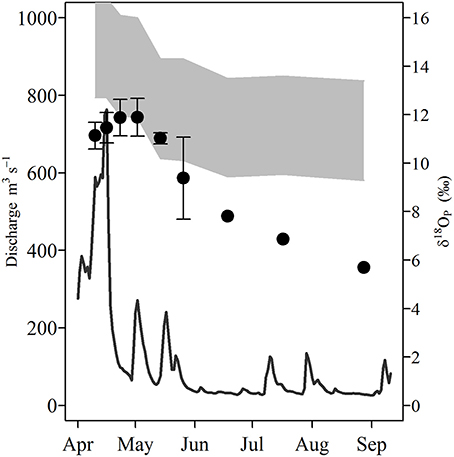
Figure 5. Temporal variation of Grand River discharge (m−3 s−1; solid line) and δ18OP measured at the river mouth during the study period (circles, error bars represent 1 SD of multiple measurements). Shaded gray area represents the equilibrium window (δ18OP_EQ) based on the minimum and maximum measured water δ18Ow at the river site using the equation of Chang and Blake (2015).
The spatial and temporal variation of δ18OP at lake sites are shown in Figure 6. δ18OP at lake sites ranged from +4.7 to +14.9‰ and did not show strong relationships with FRW or with distance from the Grand River (Figure 6). Within-transect variation (i.e., variation across different depths) in δ18OP was often greater than differences from west to east (Figure 6). No obvious differences were observed for samples collected near the lake bed at 1 and 3 m sites and surface samples at 10 m sites, but samples collected near the lake bed at 10 m sites (LB10) were consistently isotopically heavier than companion surface samples (paired t-test, t = 11.1, n = 12, p < 0.001) and frequently overlapped the range of δ18OP_DM (Figure 7). Notably, all but one lake sample are below the calculated theoretical equilibrium based on water temperature and δ18OW (Figure 6, Table 1).
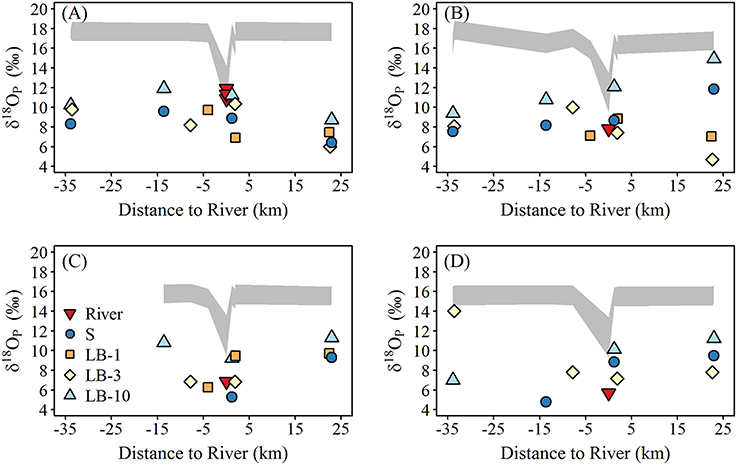
Figure 6. Spatial variation of δ18Op (‰; symbols) and the calculated equilibrium window (δ18OP_EQ) at lake sites during (A) late May—early June, (B) mid-June, (C) mid-July, and (D) late August. The equilibrium window (δ18OP_EQ) was calculated using the minimum and maximum measured water δ18Ow over the study period using the equation of Chang and Blake (2015).
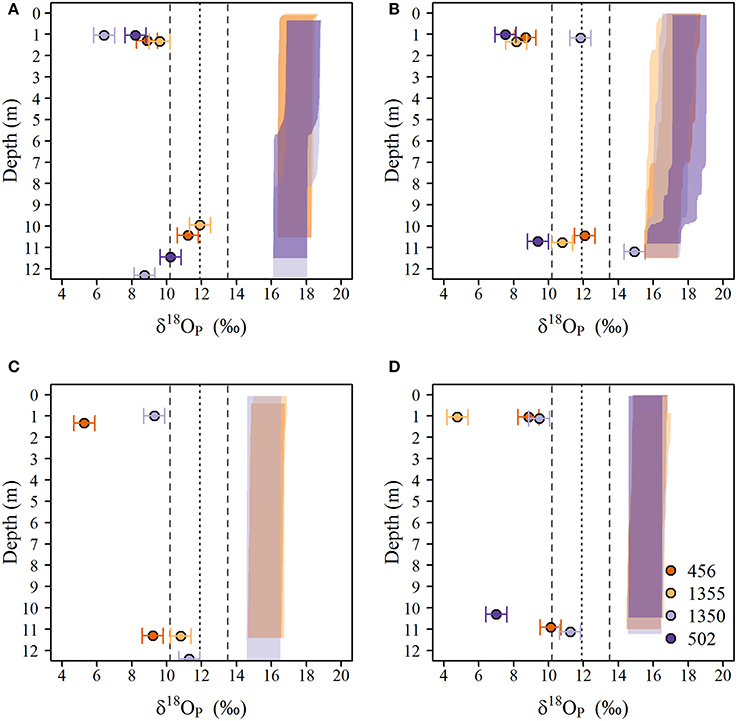
Figure 7. Vertical distribution of δ18OP(circles) and calculated equilibrium δ18OP_EQ) (shaded polygons) in the water column at the 10 m depth sites in eastern lake Erie during (A) late-May to early June, (B) June, (C) July, and (D) August of 2014. The equilibrium window was determined by interpolating δ18Ow as function of depth and calculating the range of δ18OP_EQ using the temperatures derived from vertical profiles and the equation Chang and Blake (2015) for the minimum and maximum δ18Ow observed over the study period. The dotted (dashed) vertical line(s) represent the average (range) δ18OP_DM measured in laboratory experiments.
The degree of isotopic offset of δ18OP from the calculated δ18OP_EQ was strongly correlated to SRP concentration and negatively correlated to the seston N:P ratio, suggesting larger negative excursions for samples associated with low P availability (Figure 8). Such patterns are expected if the hydrolysis of DOP is an important mechanism of Pi regeneration. Indeed, we observed low δ18OP values and larger negative excursions from the δ18OP_EQ values as the TDP pool became increasingly dominated by DOP (Figure 8). The only samples that appeared to not follow this pattern were those collected at the lakebed at 10 m depth sites.
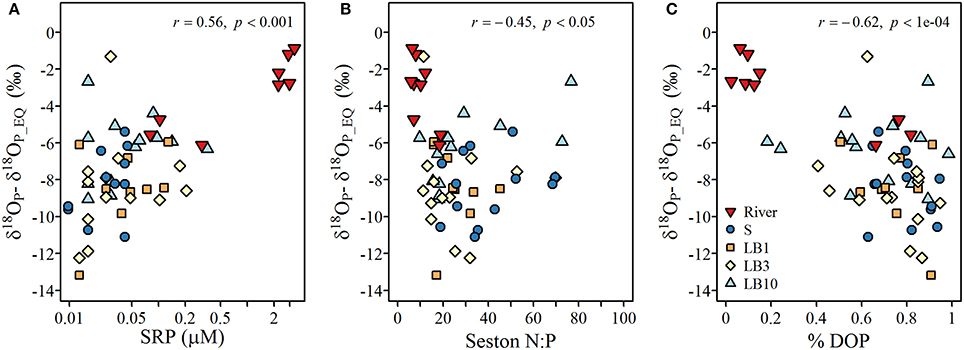
Figure 8. Relationships between (A) the offset of measured δ18Op (‰; symbols) from theoretical δ18OP_EQ and soluble reactive P concentrations, (B) offset of measured δ18Op (‰; symbols) from δ18OP_EQ and seston N:P ratios, and (C) offset of measured δ18Op (‰; symbols) from δ18OP_EQ and % DOP (calculated as (TDP-SRP)/TDP).
Oxygen Isotopic Composition of Phosphorus Excreted by Dreissenid Mussels
Oxygen isotopic compositions of phosphate collected during dreissenid excretion experiments (δ18OP_DM) ranged from +10.2 to +13.5‰ and averaged +11.9 ± 1.1‰ (Table 2). δ18OP at LB10 and LB3 sites were positively related to dreissenid abundance and shell free biomass (Figure 9).
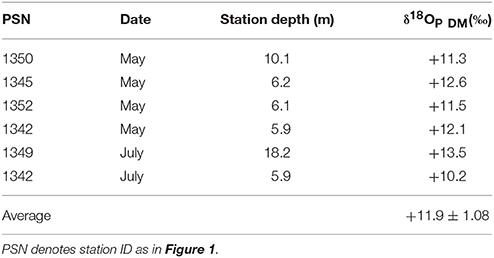
Table 2. Oxygen isotopic composition of phosphate collected δ18OP in incubations with dreissenid mussels (δ18OP_DM) harvested from eastern Lake Erie in 2013 and 2014.
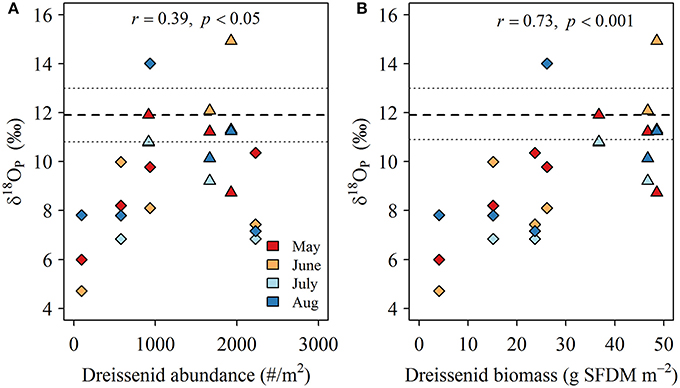
Figure 9. (A) Relationship between the offset of δ18Op in LB samples from δ18OP_DM (‰; symbols) and dreissenid abundance (# m−2) and (B) shell free dreissenid biomass (g SFDM m−2). Long (short) dashed lines represents the mean (range) of experimentally determined δ18Op_DM.
Discussion
Variation in water quality and nutrient conditions along the north shore of the eastern basin are shaped to a large degree by the discharge of nutrient rich water from the Grand River (Chomicki et al., 2016) as well as interaction with hydrodynamic features. Wind forcing (He et al., 2006) and large scale circulation features (Rao and Schwab, 2007) often trap river inputs alongshore, creating a band of enriched water that extends to approximately the 5 m depth contour (Chomicki et al., 2016). Estimates of FRW at our study sites are in general agreement with prior studies and existing knowledge and observations of nearshore circulation and river plume dynamics. For example, we observed FRW estimates approaching 80% at sites to the east of the river mouth, with larger values typically encountered at 1 and 3 m depth sites which are < 1 km from the shoreline. It is unclear if the high FRW observed ~20 km to the east represents input from the Grand River as there are a number of smaller tributaries that discharge along the shore between the Grand River and the eastern-most study sites. Previous estimates of river influence extent range from 8 to 10 km (Nicholls et al., 1983; Howell and Hobson, 2003) although these are generally based on seasonal data and use other semi-conservative tracers. Discharge from the Grand River in April and May of 2014 exceeded the long term (1913–2016) 75th percentile of ~300 m3 s−1 by nearly a factor 2−3 (https://wateroffice.ec.gc.ca/report/historical_e.html?mode=Graph&type=h2oArc&stn=02GB001&dataType=Daily¶meterType=Flow&year=2014&y1Max=1&y1Upper=1&scale=normal), and given that river water temperatures at this time were approximately double those encountered in the lake (~19.5°C compared to 11–12°C), the river plume would have likely been thermally buoyant, spreading thinly over large distances before mixing completely. The FRW was less variable during low flow periods ranging from 0 to ~20%. FRW was generally higher at shallow stations (i.e., the 1 and 3 m depth sites), consistent with the alongshore entrapment of the plume.
Although nutrient concentrations were generally elevated closer to the river mouth and the river water clearly influenced our study sites, we observed strong non-conservative behavior of all forms of phosphorus across the river mouth—lake mixing area. During late May—early June, when concentrations of PP, TDP, and SRP were highest at the river mouth, the measured concentrations in the lake were considerably lower than would be expected based on simple dilution, even at sites in close proximity (< 2 km) with FRW approaching 80% (Figure 3). In fact, losses of PP, TDP, and SRP appeared to be strongest at the sites closest to the river mouth, suggesting rapid sedimentation, consumption, and/or uptake (Figure 3A). Losses of particulate P could reflect the settling of large and coarser organic P particles owing to reductions in flow velocity and turbulence, or perhaps consumption of organic P by dreissenid mussels (Chomicki et al., 2016). Smaller particles such as non-apatite inorganic P (~4–7 μm diameter; Chomicki et al., 2016) would likely remain in suspension for a greater duration and be subjected to more widespread mixing and dispersion. Declines in SRP and to an extent TDP may reflect uptake by phytoplankton as chlorophyll a concentrations increased from ~0.5 μg L−1 at open lake sites (e.g., 502 and 1350) to a maximum of 15.3 μg L−1 at PSN 1371, 2 km east of the river mouth. Similar results have been observed across the Milwaukee River mixing zone in Lake Michigan, where biological processes have been implicated in removal of SRP in close proximity to the point of discharge (Lin and Guo, 2016).
Over the late June to August surveys, losses of particulate P remained consistently strong in close proximity to the river mouth although there were instances of resuspension elevating PP concentrations, particularly at 1 m depth sites (Figure 3B). The responses of TDP and SRP were generally consistent, although the magnitude of difference between observed and expected concentrations was small owing to the relatively small difference between TDP and SRP concentrations at the river mouth and lake sites. At times, TDP and SRP concentrations were larger than expected based on the mixing model calculations. Elevated concentrations of SRP were often observed for LB samples at 10 m sites (Figures 3B–D), but were also observed at 1 m and 3 m sites in July (Figure 3C). The proximate cause of these elevated concentrations could be due to leakage of nutrient rich groundwater (e.g., Robinson, 2015) or perhaps due to the decomposition of Cladophora that had accumulated at the adjacent shoreline as decomposing Cladophora is known to lose phosphorus slowly over a period of several weeks in situ (Paalme et al., 2002).
Oxygen Isotope Ratios of Phosphate Indicate Extensive Phosphorus Cycling
Compared to marine systems (Colman et al., 2005; McLaughlin et al., 2006a,b, 2013; Goldhammer et al., 2011; Jaisi et al., 2011; Joshi et al., 2015; Li et al., 2017) and soils (Zohar et al., 2010; Angert et al., 2012; Tamburini et al., 2012; Granger et al., 2017a), freshwater environments are poorly characterized with respect to δ18OP [but see (Elsbury et al., 2009; Granger et al., 2017b; Pistocchi et al., 2017)]. The δ18OP we measured in the Grand River during April and early May (+9.4 ± 1.7 to +11.9 ± 0.7‰) are similar to values reported for Lake Erie tributaries in the central and western basins over summer and fall (Elsbury et al., 2009), but lower than those reported for the River Taw, UK (Granger et al., 2017b). δ18OP at the river mouth site was near or overlapped δ18OP_EQ in late April and early May, but declined steadily from +9.4 ± 1.7‰ to a minimum of +5.7‰ through August, with the departure from δ18OP_EQ increasing to the end of August(Figure 5). Similarly, δ18OP at lake sites are considerably lower than those reported by (Elsbury et al., 2009) for the west and central basin of Lake Erie (~+11 to +17‰), and all but one LB sample were below the calculated δ18OP_EQ based on δ18OW and water temperature.
It is important to keep in mind that δ18OP measured at a given site at a given time represents a snapshot of a variety of processes occurring along a continuum of P cycling. For example, the Pi pool may be affected to varying degrees by the intensity of (1) Pi that has been equilibrated internally and released by microbes and/or phytoplankton (Blake et al., 1997; Paytan et al., 2002), (2) Pi excreted by zooplankton (Taylor and Lean, 1981), (3) remineralization of DOP excreted by phytoplankton (Bentzen et al., 1992) or liberated via zooplankton grazing and/or viral lysis (Taylor and Lean, 1981), and (4) mixing with an external Pi source with a distinct δ18OP (Paytan et al., 2017). The strong negative deviations from theoretical equilibrium values observed here are anticipated in systems where ambient levels of P are limiting and arise due to the large inheritance effects associated with isotopic fractionation during the incorporation of water oxygen into the Pi ion during enzymatic hydrolysis (Liang and Blake, 2006, 2009). Forms of DOP commonly found in aquatic ecosystems include phosphomonoesters, phosphodiesters, and phospholipids produced by organisms in situ (Baldwin, 2013) but may also include phosphomonesters, phosphodiesters and inositol phosphates exported from the surrounding catchment (Monbet et al., 2009). Monoesters are generally considered bioavailable due to the presence of enzymes such alkaline phosphatase (EC 3.1.3.1) (Bentzen et al., 1992), but phosphodiesterases and phytases may make diesters and inotisol phosphates potentially bioavailable (Cheng and Lim, 2006). Although we do not have detailed information on the nature and composition of DOP or enzyme activity in eastern Lake Erie (but see North et al., 2012), if we assume that organic P contained within organisms in the lake is at or near equilibrium (e.g., Paytan et al., 2002, based on known fractionation factors for various DOP compounds, the δ18OP of released Pi recycled from the DOP pool is expected to be < ~+14‰, and even lower < +11‰ if substrates such as phytate is not a major component of the bioavailable DOP pool (Table 3). While these are generalizations, they illustrate the relative magnitude expected if regeneration of Pi from DOP is an important P recycling pathway. This is further supported by the significant relationships we observed between δ18OP and other proxies of P availability such as %DOP, SRP concentration and seston N:P ratios (Figure 8), and we infer that the recycling of DOP by the plankton community is a major determinant of the isotopic composition of the available Pi pool in eastern Lake Erie.
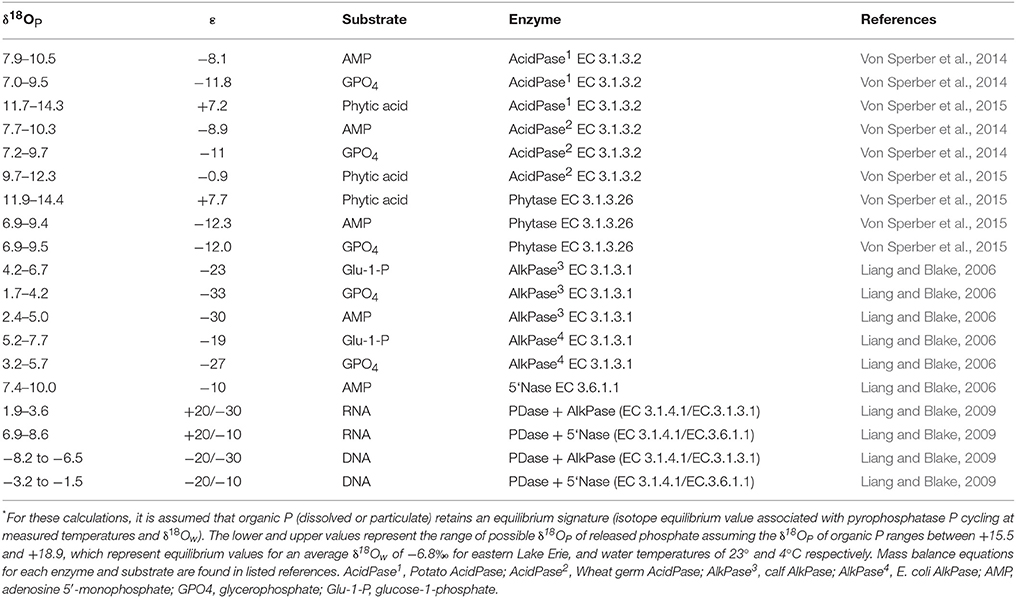
Table 3. Examples of mass balance calculations* for the oxygen isotopic composition of phosphate (δ18OP; ‰) released by enzymatic hydrolysis for different enzymes and substrates using literature values for isotopic fractionation (ε).
Oxygen Isotope Ratios Cannot Be Used to Track Riverine Input to Eastern Erie
Concentrations of SRP at the river mouth site were high (up to 6.9 μM) between April and early June. Despite large variation in river discharge volume, δ18OP was relatively invariant (Figure 5). This is somewhat surprising given that land use in the Grand River watershed is a mixture of intensive agricultural and urban use (Holeton, 2013). Although we do not have a detailed inventory of δ18OP of different sources within the Grand River watershed, based on existing data it seems likely that δ18OP might vary according to the relative inputs of Pi from different sources (e.g., Young et al., 2009). In addition,the short residence time of the river (~3 d, Rosamond, 2013) and low temperatures (< 10°C) should have acted to minimize any uptake and cycling of Pi in the river at this time. While it is possible that δ18OP within the watershed might not vary across different sources, or perhaps simply reflected thorough mixing of source inputs, we note that our SRP concentrations measured at the river mouth site were up to 2 to 6-fold higher compared to concentrations measured the same day at a nutrient monitoring station ~40 km upstream (Supplemental Information Figure S1), indicating a significant input of Pi below the monitoring station. While further work will be required to identify the proximate source of this Pi, we note that this section of the river is characterized by extensive wetland complexes, some of which at times can have very high TDP concentrations (6–190 μM; (Gilbert and Ryan, 2007), and may explain lack of variation in δ18OP during this period.
Despite high concentrations of SRP, a relatively constant δ18OP and high discharge during the April to early June we did not observe any evidence of mixing between riverine δ18OP and lake δ18OP at any of our sites. During the cooler spring months, P uptake by phytoplankton is generally reduced relative to summer months (Lean et al., 1983), yet at sites closest to the river mouth (i.e., those with high FRW), δ18OP was no different than lake sites far removed from the river mixing zone. Only LB samples from 10 m depth sites had δ18OP that was reasonably close to riverine δ18OP, but these samples had low FRW and are likely affected by recycling of P by dreissenid mussels (see below).
Between June and August, δ18OP at the river mouth site declined steadily, departing further from δ18OP_EQ (Figure 7). Such observations are not uncommon in P–rich systems (Paytan and McLaughlin, 2012), however, δ18OP moved further away from δ18OP_EQ as SRP concentrations declined from 6.9 μM in late May to a low of 0.08 μM in July, which is counter to expectation (McLaughlin et al., 2006b; Granger et al., 2017b). On one hand, this could indicate an input of an isotopically light source of Pi such as waste water treatment plant (WWTP) effluent (Young et al., 2009) or Pi liberated via the degradation of glyphosate (Li et al., 2016a). During summer base flow periods, WWTP inputs become a larger component of the total P mass load to the river (Holeton, 2013), however, δ18OP of treated WWTP effluent from plants within the Grand River watershed are reported to be higher than values we measured [+11.4 to +22.8‰ (Morrison, 2014)] and P uptake studies downstream of WWTP discharges indicate relatively short uptake lengths (< 5500 m; Barlow-Busch et al., 2006). Similarly, while glyphosate is a common herbicide in southern Ontario, concentrations typically peak during rain events (Struger et al., 2015) and since we observed low δ18OP at near base flow conditions, this is unlikely to explain the values measured here. Rather, we speculate that Pi is extensively processed within the lower river by the attendant phytoplankton community. Previous studies of the lower Grand have indicated that an appreciable portion of dissolved P is converted into phytoplankton biomass prior to entering Lake Erie (Kuntz, 2008). Despite the overall eutrophic conditions, the increasing disequilibrium from δ18OP_EQ at the river mouth during the summer in combination with high chlorophyll a concentrations (25–48 μg L−1) is not inconsistent with a highly productive river estuary where even the use of DOP can be important (Larson et al., 2016; Yuan et al., 2017). Further study of phosphorus sources to the lower river and speciation would be required to confirm such pathways, particularly in order to trace back to specific input sources of P. Nonetheless, even though riverine δ18OP appears to be altered prior to discharge into the lake, when our δ18OP data are considered together with evidence of strongly non-conservative mixing behavior of SRP, we infer that most of the Pi discharged by the river is quickly assimilated into phytoplankton and rapidly overprinted via DOP recycling.
Isotopic Enrichment at the Lake Bottom Indicates Benthic P Recycling
Samples collected near the lake bed at 10 m depth sites were persistently isotopically heavier than paired surface samples at all sites on all dates, and most samples overlapped the δ18OP measured in our excretion experiments (δ18OP_DM) (Figure 7). In some cases, differences between lakebed and surface SRP concentrations were large (up to 10-fold) indicating enrichment of the near bottom waters while in others, the differences were smaller. Overall, SRP was significantly higher in LB samples compared to surface samples (paired t-test, t = 2.24, p < 0.05) and chlorophyll a concentrations were lower (paired t-test, t = 2.89, p < 0.05) consistent with known impacts of dreissenid grazing of phytoplankton and excretion of soluble P (Ackerman et al., 2001; Conroy et al., 2005; Ozersky et al., 2009). Differences in TDP displayed similar patterns but were not significant (paired t-test, t = 1.69, p < 0.1) and differences in NH4, NO3 and PC, PN or PP were not different (data not shown).
The experimentally determined δ18OP_DM was constrained relative to δ18OP collected at lake sites, regardless of where or when dreissenid mussels were collected for incubations. Dreissenid mussels excrete Pi directly (Arnott and Vanni, 1996), DOP (Mosley and Bootsma, 2015), and deposit a larger quantity of nutrients (including P) as partially digested pseudofaeces and feces on the surrounding sediments/lakebed (Nalepa et al., 1991). The smaller range of δ18OP_DM compared to δ18OP_from LB samples might be due to differences in the quantities of Pi derived from direct excretion vs mineralization of pseudofecal and fecal material, as our incubation time required to generate sufficient Pi for recovery (~10 μM; 12–36 h) were of sufficient duration to permit accumulation of feces and psuedofaeces, and although we did not measure microbial activity, decomposition of fecal and pseudofecal material generally occurs over a longer time frame than employed here (Roditi et al., 1997). In contrast, our LB samples could contain Pi excreted directly by dreissenids, or derived from the re-mineralization of pseudofaeces and/or feces. Pi excreted directly by dreissenids is likely liberated through the action of acid phosphatases (EC 3.1.3.2) in the acidic gut (Sauey et al., 2016), and based on examples in Table 3, released Pi could range between +7.0 and +14‰. Many of our δ18OP_DM fall within this range, as do δ18OP from LB samples at 10 m sites. The generally consistent overlap between δ18OP_DM from incubations and δ18OP from LB sites is further supported by positive relationships observed between the degree of offset of δ18OP from our experimentally determined δ18OP_DM and dreissenid abundance and shell free biomass (Figure 9) and support the role of dreissenid mussels as active recyclers of P in the benthic environment.
Alternative explanations for isotopic enrichment of δ18OP near the lake bed could include possible desorption of Pi from clays or iron minerals, or injection of isotopically heavier Pi from the hypolimnion. Chomicki et al. (2016) suggested that ~50% of the particulate P leaving the Grand River is non-apatite inorganic P (NAIP), of which iron oxides are a dominant component (Mayer and Manning, 1989). While much of this material likely settles out within a short distance of the river mouth, it is nonetheless subject to resuspension and subsequent dispersal by wind and waves (Chomicki et al., 2016). The structurally complex and rough surfaces created by abundant dreissenid mussels may retain settled material in interstitial spaces and enhanced O2 demand from fecal material and respiratory activity of mussels (Turner, 2010) could promote release of Pi from redox sensitive P bearing sediments. While we did not directly measure the δ18OP of redox sensitive NAIP, we consider this to be an unlikely explanation for the persistently heavy δ18OP near the lake bed. Jaisi et al. (2010) have shown that Pi adsorbed to mineral surfaces are constantly exchanged with Pi in the surrounding water such that fractionation associated with adsorption/desorption is negligible over a matter of hours. Since NAIP particles near the Grand River are small (4–7 μm; Chomicki et al., 2016) and likely to stay in suspension for several days (DePinto et al., 1981), we would expect Pi retained on NAIP particles that eventually settles within mussel beds to be equilibrated with δ18OP in the water column. If Pi is released via redox mediated dissolution, we infer that such Pi would retain δ18OP closer to that of lake water, and would be unlikely to explain the higher δ18OP values observed near the lake bed.
Entrainment of cooler water from the hypolimnion could theoretically account for near bed enrichment via (1) remineralization of sinking P by bacteria or (2) release of Pi from anoxic sediments. In the open ocean, δ18OP shifts toward the theoretical equilibrium with increasing depth as sinking organic matter is re-mineralized and microbes become carbon limited (Colman et al., 2005). Demand for Pi by phytoplankton and activity of hydrolytic enzymes should also be reduced in the cooler and darker hypolimnion compared to the illuminated surface layers (Pick, 1987). Cooler temperatures would favor an isotopically heavier δ18OP_EQ. Upwelling has been identified as a potentially significant transport mechanism for hypolimnetic SRP in some years (Valipour et al., 2016) which could affect our measures of δ18OP. Wind speed and direction data from buoy #C45142, prior to and during our sampling trips did not indicate the presence of conditions favorable for upwelling (Supplemental Figure S2), nor did we observe any deviations in water temperature profiles during surveys associated with hypolimnetic intrusions (data not shown), thus we infer that upwelling cannot explain the heavier δ18OP observed near the lake bed. Similarly, Paytan et al. (2017) have linked release of isotopically heavier δ18OP in the central basinto sediment release during hypoxic events. However, hypolimnetic oxygen concentrations in the much less productive eastern basin rarely fall below 0.3 mM during the stratified period (Carrick, 2004). Consequently, high rates of sediment P release from internal loading is unlikely to explain the δ18OP measured at our 10 m sites.
The lack of a similar degree of isotopic enrichment in the LB samples at 1 and 3 m sites is not easily explained. On one hand, the relationship between δ18OP and dreissenid biomass might suggest that dreissenid biomass at these shallow depths was insufficient to generate a strong isotope signal. Rapid uptake of released Pi by Cladophora might also attenuate an isotopic signal, however, Cladophora biomass in 2014 was relatively low, in large part because water clarity in 2014 was poor owing to high inputs of suspended solids from the Grand River (Valipour et al., 2016). It is also possible that the length of time required (~1 h) to collect sufficient sample volume (~200 L) whilst minimizing the disturbance near the lake bed may have compromised our samples to varying degrees if vertical mixing was sufficient to mix surface waters (containing lighter δ18OP) with bottom waters (containing heavier δ18OP). We evaluated this possibility by calculating the characteristic time scale for diffusive mixing of the water column following Boegman et al. (2008)
where N is the buoyant frequency (calculated as , H is the water column depth (m), and u* is the surface shear velocity (calculated as ; where τw can be estimated from ; with CD = 1.3 × 10⁻³, ρ0 = 1,000 kg m−3, ρA = 1.2 kg m−3, and U10 is the average daily wind speed (m s−1) adjusted to a height of 10 m above surface recorded at buoy #C45142). Note since τw was evaluated at surface, the exponential term is neglected (Boegman et al., 2008). For many samples, it is clear that the time to completely mix the water column was shorter than our sample collection time (Figure 10)—thus we cannot exclude the possibility that our samples may have been compromised by mixing of lower δ18OP from surface waters. Furthermore, the degree of δ18OP offset from δ18OP_DM appeared to be reduced as increased for samples collected in May and June when density gradients were greatest (Figure 10). Although the low sample size likely precludes statistical significance, these calculations are consistent with our hypothesis.
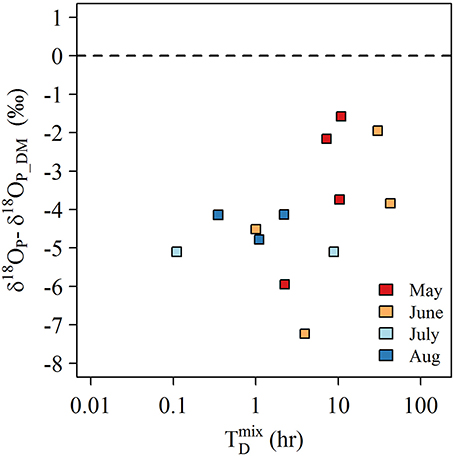
Figure 10. Plot of the offset of δ18OP in LB samples from the average experimentally determined δ18OP_DM (11.9 ± 1.1‰) against the estimated time to completely mix the water column () for samples collected 0.1 m above bottom at stationsof 3 m depth.
Conclusions
One of our original objectives was to assess the utility of δ18OP to delineate the impact of riverine Pi in the nearshore and determine any potential association with Cladophora blooms. This proved to be challenging as the δ18OP of riverine Pi appeared to be rapidly altered by in-river and in-lake processes. Based on the nature and magnitude of deviations from δ18OP_EQ, δ18OP, we infer that internal recycling of DOP by the plankton community is a dominant pathway determining the overall δ18OP of the available Pi pool in eastern Lake Erie. In addition, our data provide compelling evidence for the release of Pi at the lake bed, facilitated by dreissenid mussels. Management actions aimed at reducing the extent and severity of Cladophora blooms in Lake Erie will likely require consideration of linking the magnitude of external P inputs to the in-lake growth response in a more complex framework than prior to the advent of dreissenid populations. The ability of dreissenid mussels to function as a P trap in the nearshore as proposed by Hecky et al. (2004) poses distinct challenges. Dreissenid mussels in eastern Lake Erie are highly reliant on phytoplankton (Campbell et al., 2009), and the open waters represents a large reservoir of P that would have been previously unavailable to Cladophora. At the same time, local inputs of Pi from tributaries may be rapidly incorporated into phytoplankton, which while formerly unavailable to Cladophora, must now pass through the littoral zone which is dominated by expansive mussel populations and such P may ultimately be trapped and made available in the nearshore through the feeding activity of mussels. While it is clear that reductions in P inputs are the appropriate management tool, further work will be required to better quantify if reductions in Cladophora growth are achievable and whether these changes will require more stringent P controls than already proposed for Lake Erie.
Author Contributions
DD and VH-B designed the study. DD carried out the study. GK conducted isotope analysis. DD wrote manuscript.
Funding
This study was funded by Environment Canada through the Great Lakes Nutrient Initiative.
Conflict of Interest Statement
The authors declare that the research was conducted in the absence of any commercial or financial relationships that could be construed as a potential conflict of interest.
Acknowledgments
The authors thank the Technical Operations Services at Environment and Climate Change Canada for field and laboratory support. Greg Boulton, Karina Tsang, Danielle Bruyns, and Jacqui Milne provided tireless assistance in the field. Alice Dove provided nutrient data collected at York, ON, and data on dreissenid abundance and biomass Sandra Cooke (Grand River Conservation Authority) provided valuable input on the Grand River ecology. Comments and advice regarding purification protocols from Federica Tamburini, Adina Paytan, and Deb Jaisi are appreciated and were essential for improving sample processing.
Supplementary Material
The Supplementary Material for this article can be found online at: https://www.frontiersin.org/articles/10.3389/fmars.2018.00215/full#supplementary-material
References
Ackerman, J. D., Loewen, M. R., and Hamblin, P. F. (2001). Benthic-Pelagic coupling over a zebra mussel reef in western Lake Erie. Limnol. Oceanogr. 46, 892–904. doi: 10.4319/lo.2001.46.4.0892
Angert, A., Weiner, T., Mazeh, S., and Sternberg, M. (2012). Soil phosphate stable oxygen isotopes across rainfall and bedrock gradients. Environ. Sci. Technol. 46, 2156–2162. doi: 10.1021/es203551s
Arnott, D. L., and Vanni, M. J. (1996). Nitrogen and phosphorus recycling by the zebra mussel (Dreissena polymorpha) in the western basin of Lake Erie. Can. J. Fish. Aquat. Sci. 53, 646–659. doi: 10.1139/f95-214
Auer, M. T., Tomlinson, L. M., Higgins, S. N., Malkin, S. Y., Howell, E. T., and Bootsma, H. A. (2010). Great lakes Cladophora in the 21st century: same algae—different ecosystem. J. Gt. Lakes Res. 36, 248–255. doi: 10.1016/j.jglr.2010.03.001
Baldwin, D. S. (2013). Organic phosphorus in the aquatic environment. Environ. Chem. 10, 439–454. doi: 10.1071/EN13151
Barlow-Busch, L., Baulch, H. M., and Taylor, W. D. (2006). Phosphate uptake by seston and epilithon in the Grand River, southern Ontario. Aquat. Sci. 68, 181–192. doi: 10.1007/s00027-006-0806-9
Bentzen, E., Taylor, W. D., and Millard, E. S. (1992). The importance of dissolved organic phosphorus to phosphorus uptake by limnetic plankton. Limnol. Oceanogr. 37, 217–231. doi: 10.4319/lo.1992.37.2.0217
Blake, R. E. (2005). Biogeochemical cycling of phosphorus: insights from oxygen isotope effects of phosphoenzymes. Am. J. Sci. 305, 596–620. doi: 10.2475/ajs.305.6-8.596
Blake, R. E., O'neil, J. R., and Garcia, G. A. (1997). Oxygen isotope systematics of biologically mediated reactions of phosphate: I. Microbial degradation of organophosphorus compounds. Geochim. Cosmochim. Acta 61, 4411–4422. doi: 10.1016/S0016-7037(97)00272-X
Boegman, L., Loewen, M. R., Hamblin, P. F., and Culver, D. A. (2008). Vertical mixing and weak stratification over zebra mussel colonies in western Lake Erie. Limnol. Oceanogr. 53, 1093–1110. doi: 10.4319/lo.2008.53.3.1093
Bootsma, H. A., Rowe, M. D., Brooks, C. N., and Vanderploeg, H. A. (2015). Commentary: the need for model development related to Cladophora and nutrient management in Lake Michigan. J. Gt. Lakes Res. 41, 7–15. doi: 10.1016/j.jglr.2015.03.023
Campbell, L. M., Thacker, R., Barton, D., Muir, D. C. G., Greenwood, D., and Hecky, R. E. (2009). Re-engineering the eastern Lake Erie littoral food web: the trophic function of non-indigenous Ponto-Caspian species. J. Gt. Lakes Res. 35, 224–231. doi: 10.1016/j.jglr.2009.02.002
Carrick, H. J. (2004). Algal distribution patterns in Lake Erie: implications for oxygen balances in the Eastern Basin. J. Gt. Lakes Res. 30, 133–147. doi: 10.1016/S0380-1330(04)70336-6
Chang, S. J., and Blake, R. E. (2015). Precise calibration of equilibrium oxygen isotope fractionations between dissolved phosphate and water from 3 to 37°C. Geochim. Cosmochim. Acta 150, 314–329. doi: 10.1016/j.gca.2014.10.030
Cheng, C., and Lim, B. L. (2006). Beta-propeller phytases in the aquatic environment. Arch. Microbiol. 185, 1–13. doi: 10.1007/s00203-005-0080-6
Chomicki, K. M., Howell, E. T., Defield, E., Dumas, A., and Taylor, W. D. (2016). Factors influencing the phosphorus distribution near the mouth of the Grand River, Ontario, Lake Erie. J. Gt. Lakes Res. 42, 549–564. doi: 10.1016/j.jglr.2016.03.014
Colman, A. S., Blake, R. E., Karl, D. M., Fogel, M. L., and Turekian, K. K. (2005). Marine phosphate oxygen isotopes and organic matter remineralization in the oceans. Proc. Natl. Acad. Sci. U.S.A. 102, 13023–13028. doi: 10.1073/pnas.0506455102
Conroy, J. D., Edwards, W. J., Pontius, R. A., Kane, D. D., Zhang, H., Shea, J. F., et al. (2005). Soluble nitrogen and phosphorus excretion of exotic freshwater mussels (Dreissena spp.): potential impacts for nutrient remineralisation in western Lake Erie. Freshw. Biol. 50, 1146–1162. doi: 10.1111/j.1365-2427.2005.01392.x
DePinto, J. V., Young, T. C., and Martin, S. C. (1981). Algal-available phosphorus in suspended sediments from lower great lakes tributaries. J. Gt. Lakes Res. 7, 311–325. doi: 10.1016/S0380-1330(81)72059-8
Dolan, D. M., and Chapra, S. C. (2012). Great Lakes total phosphorus revisited: 1. Loading analysis and update (1994–2008). J. Gt. Lakes Res. 38, 730–740. doi: 10.1016/j.jglr.2012.10.001
Dove, A., and Chapra, S. C. (2015). Long-term trends of nutrients and trophic response variables for the great lakes: great lakes nutrient trends. Limnol. Oceanogr. 60, 696–721. doi: 10.1002/lno.10055
Dove, A., L'Italien, S., and Gilroy, D. (2009). Great Lakes Surveillance Program Field Methods Manual. Burlington, ON: Environment Canada.
Elsbury, K. E., Paytan, A., Ostrom, N. E., Kendall, C., Young, M. B., McLaughlin, K., et al. (2009). Using oxygen isotopes of phosphate to trace phosphorus sources and cycling in Lake Erie. Environ. Sci. Technol. 43, 3108–3114. doi: 10.1021/es8034126
Gilbert, J. M., and Ryan, P. A. (2007). Southern Grand River Wetland Report. Port Dover, ON: Lake Erie Management Unit, Ontario Ministry of Natural Resources.
GLWQA (2012). The 2012 Great Lakes Water Quality Agreement - Annex 4. Available online at: https:tinyurl.com/gt92hrh
GLWQA (2015). Recommended Phosphorus Loading Targets for Lake Erie - Annex 4 Objectives and Targets Task Team Final Report to the Nutrients Annex Subcommittee.
Goldhammer, T., Brunner, B., Bernasconi, S. M., Ferdelman, T. G., and Zabel, M. (2011). Phosphate oxygen isotopes: insights into sedimentary phosphorus cycling from the Benguela upwelling system. Geochim. Cosmochim. Acta 75, 3741–3756. doi: 10.1016/j.gca.2011.04.006
Granger, S. J., Harris, P., Peukert, S., Guo, R., Tamburini, F., Blackwell, M. S., et al. (2017a). Phosphate stable oxygen isotope variability within a temperate agricultural soil. Geoderma 285, 64–75. doi: 10.1016/j.geoderma.2016.09.020
Granger, S. J., Heaton, T. H. E., Pfahler, V., Blackwell, M. S. A., Yuan, H., and Collins, A. L. (2017b). The oxygen isotopic composition of phosphate in river water and its potential sources in the Upper River Taw catchment, UK. Sci. Tot. Environ. 574, 680–690. doi: 10.1016/j.scitotenv.2016.09.007
Griffiths, R. W., Schloesser, D. W., Leach, J. H., and Kovalak, W. P. (1991). Distribution and dispersal of the zebra mussel (Dreissena polymorpha) in the Great Lakes Region. Can. J. Fish. Aquat. Sci. 48, 1381–1388. doi: 10.1139/f91-165
Haltuch, M. A., Berkman, P. A., and Garton, D. W. (2000). Geographic information system (GIS) analysis of ecosystem invasion: exotic mussels in Lake Erie. Limnol. Oceanogr. 45, 1778–1787. doi: 10.4319/lo.2000.45.8.1778
He, C., Rao, Y. R., Skafel, M. G., and Howell, T. (2006). Numerical modelling of the Grand River plume in Lake Erie during unstratified period. Water Qual. Res. J. Can. 41, 16–23. doi: 10.2166/wqrj.2006.002
Hecky, R. E., Smith, R. E., Barton, D. R., Guildford, S. J., Taylor, W. D., Charlton, M. N., et al. (2004). The nearshore phosphorus shunt: a consequence of ecosystem engineering by dreissenids in the Laurentian Great Lakes. Can. J. Fish. Aquat. Sci. 61, 1285–1293. doi: 10.1139/f04-065
Higgins, S. N., Howell, E. T., Hecky, R. E., Guildford, S. J., and Smith, R. E. (2005). The wall of green: the status of Cladophora glomerata on the Northern shores of Lake Erie's Eastern Basin, 1995–2002. J. Gt. Lakes Res. 31, 547–563. doi: 10.1016/S0380-1330(05)70283-5
Higgins, S. N., Malkin, S. Y., Todd Howell, E., Guildford, S. J., Campbell, L., Hiriart-Baer, V., et al. (2008). An ecological review of Cladophora glomerata (CHLOROPHYTA) in the Laurentian Great Lakes 1. J. Phycol. 44, 839–854. doi: 10.1111/j.1529-8817.2008.00538.x
Holeton, C. (2013). Sources of Nutrients and Sediments in the Grand River Watershed. Cambridge, ON: Grand River Conservation Authority.
Howell, E. T., and Hobson, G. (2003). Water Quality on the Lake Erie Shores of Wainfleet Township in 2002. Toronto, ON: Environmental Monitoring and Reporting Branch, Ontario Ministry of Environment.
Howell, E. T., Marvin, C. H., Bilyea, R. W., Kauss, P. B., and Somers, K. (1996). Changes in environmental conditions during Dreissena colonization of a monitoring station in Eastern Lake Erie. J. Gt. Lakes Res. 22, 744–756. doi: 10.1016/S0380-1330(96)70993-0
Jaisi, D. P., Blake, R. E., and Kukkadapu, R. K. (2010). Fractionation of oxygen isotopes in phosphate during its interactions with iron oxides. Geochim. Cosmochim. Acta 74, 1309–1319. doi: 10.1016/j.gca.2009.11.010
Jaisi, D. P., Kukkadapu, R. K., Stout, L. M., Varga, T., and Blake, R. E. (2011). Biotic and abiotic pathways of phosphorus cycling in minerals and sediments: insights from oxygen isotope ratios in phosphate. Environ. Sci. Technol. 45, 6254–6261. doi: 10.1021/es200456e
Joshi, S. R., Kukkadapu, R. K., Burdige, D. J., Bowden, M. E., Sparks, D. L., and Jaisi, D. P. (2015). Organic matter remineralization predominates phosphorus cycling in the mid-bay sediments in the Chesapeake Bay. Environ. Sci. Technol. 49, 5887–5896. doi: 10.1021/es5059617
Karl, D. M., and Tien, G. (1992). MAGIC: a sensitive and precise method for measuring dissolved phosphorus in aquatic environments. Limnol. Oceanogr. 37, 105–116. doi: 10.4319/lo.1992.37.1.0105
Kolodny, Y., Luz, B., and Navon, O. (1983). Oxygen isotope variations in phosphate of biogenic apatites, I. Fish bone apatite—rechecking the rules of the game. Earth Planet. Sci. Lett. 64, 398–404. doi: 10.1016/0012-821X(83)90100-0
Larson, J. H., Frost, P. C., Vallazza, J. M., Nelson, J. C., and Richardson, W. B. (2016). Do rivermouths alter nutrient and seston delivery to the nearshore? Freshw. Biol. 61, 1935–1949. doi: 10.1111/fwb.12827
Lean, D. R. S., Abbott, A. P., Charlton, M. N., and Rao, S. S. (1983). Seasonal phosphate demand for Lake Erie Plankton. J. Gt. Lakes Res. 9, 83–91. doi: 10.1016/S0380-1330(83)71875-7
Li, H., Joshi, S. R., and Jaisi, D. P. (2016a). Degradation and isotope source tracking of glyphosate and aminomethylphosphonic acid. J. Agric. Food Chem. 64, 529–538. doi: 10.1021/acs.jafc.5b04838
Li, H., Yu, C., Wang, F., Chang, S. J., Yao, J., and Blake, R. E. (2016b). Probing the metabolic water contribution to intracellular water using oxygen isotope ratios of PO4. Proc. Natl. Acad. Sci.U.S.A. 113, 5862–5867. doi: 10.1073/pnas.1521038113
Li, J., Bai, Y., Bear, K., Joshi, S., and Jaisi, D. (2017). Phosphorus availability and turnover in the Chesapeake Bay: insights from nutrient stoichiometry and phosphate oxygen isotope ratios. J. Geophys. Res. Biogeosci. 122, 811–824. doi: 10.1002/2016JG003589
Liang, Y., and Blake, R. E. (2006). Oxygen isotope signature of Pi regeneration from organic compounds by phosphomonoesterases and photooxidation. Geochim. Cosmochim. Acta 70, 3957–3969. doi: 10.1016/j.gca.2006.04.036
Liang, Y., and Blake, R. E. (2009). Compound- and enzyme-specific phosphodiester hydrolysis mechanisms revealed by δ18O of dissolved inorganic phosphate: implications for marine P cycling. Geochim. Cosmochim. Acta 73, 3782–3794. doi: 10.1016/j.gca.2009.01.038
Lin, P., and Guo, L. (2016). Dynamic changes in the abundance and chemical speciation of dissolved and particulate phosphorus across the river-lake interface in southwest Lake Michigan. Limnol. Oceanogr. 61, 771–789. doi: 10.1002/lno.10254
Longinelli, A., and Nuti, S. (1973). Revised phosphate-water isotopic temperature scale. Earth Planet. Sci. Lett. 19, 373–376. doi: 10.1016/0012-821X(73)90088-5
Maccoux, M. J., Dove, A., Backus, S. M., and Dolan, D. M. (2016). Total and soluble reactive phosphorus loadings to Lake Erie. J. Gt. Lakes Res. 42, 1151–1165. doi: 10.1016/j.jglr.2016.08.005
Mayer, T., and Manning, P. G. (1989). Variability of phosphorus forms in suspended solids at the Lake Erie-Grand River Confluence. J. Gt. Lakes Res. 15, 687–699. doi: 10.1016/S0380-1330(89)71521-5
McLaughlin, K., Cade-Menun, B. J., and Paytan, A. (2006a). The oxygen isotopic composition of phosphate in Elkhorn Slough, California: a tracer for phosphate sources. Estuar. Coast. Shelf Sci. 70, 499–506. doi: 10.1016/j.ecss.2006.06.030
McLaughlin, K., Kendall, C., Silva, S. R., Young, M., and Paytan, A. (2006b). Phosphate oxygen isotope ratios as a tracer for sources and cycling of phosphate in North San Francisco Bay, California. J. Geophys. Res. 111. doi: 10.1029/2005JG000079
McLaughlin, K., Silva, S., Kendall, C., Stuart-Williams, H., and Paytan, A. (2004). A precise method for the analysis of δ 18 O of dissolved inorganic phosphate in seawater: method for oxygen isotopic analysis of DIP. Limnol. Oceanogr. Methods 2, 202–212. doi: 10.4319/lom.2004.2.202
McLaughlin, K., Sohm, J. A., Cutter, G. A., Lomas, M. W., and Paytan, A. (2013). Phosphorus cycling in the Sargasso Sea: investigation using the oxygen isotopic composition of phosphate, enzyme-labeled fluorescence, and turnover times: sargasso sea phosphorus cycling. Glob. Biogeochem. Cycles 27, 375–387. doi: 10.1002/gbc.20037
Michalak, A. M., Anderson, E. J., Beletsky, D., Boland, S., Bosch, N. S., Bridgeman, T. B., et al. (2013). Record-setting algal bloom in Lake Erie caused by agricultural and meteorological trends consistent with expected future conditions. Proc. Natl. Acad. Sci. U.S.A. 110, 6448–6452. doi: 10.1073/pnas.1216006110
Monbet, P., McKelvie, I. D., and Worsfold, P. J. (2009). Dissolved organic phosphorus speciation in the waters of the Tamar estuary (SW England). Geochim. Cosmochim. Acta 73, 1027–1038. doi: 10.1016/j.gca.2008.11.024
Morrison, A. (2014). Assessing the Use of 18O-PO4 Analysis for Tracing Source Inputs and the Cycling of Phosphorus. Application to the Grand River.
Mosley, C., and Bootsma, H. (2015). Phosphorus recycling by profunda quagga mussels (Dreissena rostriformis bugensis) in Lake Michigan. J. Gt. Lakes Res. 41, 38–48. doi: 10.1016/j.jglr.2015.07.007
Nalepa, T. F., Gardner, W. S., and Malczyk, J. M. (1991). Phosphorus cycling by mussels (Unionidae: Bivalvia) in Lake St. Clair. Hydrobiologia 219, 239–250. doi: 10.1007/BF00024758
Nicholls, K. H., Taylor, R., and Hamdy, Y. S. (1983). The influence of the Grand River on phytoplankton near the northeastern shore of Lake Erie during 1979. Arch. Hydrobiol. 98, 146–172.
North, R. L., Smith, R. E. H., Hecky, R. E., Depew, D. C., León, L. F., Charlton, M. N., et al. (2012). Distribution of seston and nutrient concentrations in the eastern basin of Lake Erie pre- and post-dreissenid mussel invasion. J. Gt. Lakes Res. 38, 463–476. doi: 10.1016/j.jglr.2012.06.012
Ozersky, T., Malkin, S. Y., Barton, D. R., and Hecky, R. E. (2009). Dreissenid phosphorus excretion can sustain C. glomerata growth along a portion of Lake Ontario shoreline. J. Gt. Lakes Res. 35, 321–328. doi: 10.1016/j.jglr.2009.05.001
Paalme, T., Kukk, H., Kotta, J., and Orav, H. (2002). “‘In vitro' and ‘in situ' decomposition of nuisance macroalgae Cladophora glomerata and Pilayella littoralis,” in Nutrients and Eutrophication in Estuaries and Coastal Waters Developments in Hydrobiology, eds E. Orive, M. Elliott, and V. N. de Jonge (Dordrecht: Springer), 469–476.
Painter, D. S., and McCabe, K. J. (1987). The Influence of the Grand River on Eastern Lake Erie Cladophora. Burlington, ON: National Water Research Institute.
Patterson, M. W. R., Ciborowski, J. J. H., and Barton, D. R. (2005). The distribution and abundance of Dreissena species (Dreissenidae) in Lake Erie, 2002. J. Gt. Lakes Res. 31, 223–237. doi: 10.1016/S0380-1330(05)70316-6
Paytan, A., Kolodny, Y., Neori, A., and Luz, B. (2002). Rapid biologically mediated oxygen isotope exchange between water and phosphate: oxygen isotopes in phosphate. Glob. Biogeochem. Cycles 16, 13.1–13.8. doi: 10.1029/2001GB001430
Paytan, A., and McLaughlin, K. (2012). “Tracing the sources and biogeochemical cycling of phosphorus in aquatic systems using isotopes of oxygen in phosphate,” in Handbook of Environmental Isotope Geochemistry, ed M. Baskaran (Berlin; Heidelberg: Springer Berlin Heidelberg), 419–436.
Paytan, A., Roberts, K., Watson, S., Peek, S., Chuang, P. C., Defforey, D., et al. (2017). Internal loading of phosphate in Lake Erie Central Basin. Sci. Tot. Environ. 579, 1356–1365. doi: 10.1016/j.scitotenv.2016.11.133
Pick, F. R. (1987). Interpretations of alkaline phosphatase activity in Lake Ontario. Can. J. Fish. Aquat. Sci. 44, 2087–2094. doi: 10.1139/f87-258
Pistocchi, C., Tamburini, F., Gruau, G., Ferhi, A., Trevisan, D., and Dorioz, J. M. (2017). Tracing the sources and cycling of phosphorus in river sediments using oxygen isotopes: methodological adaptations and first results from a case study in France. Water Res. 111, 346–356. doi: 10.1016/j.watres.2016.12.038
Rao, Y. R., and Schwab, D. J. (2007). Transport and mixing between the coastal and offshore waters in the great lakes: a review. J. Gt. Lakes Res. 33, 202–218. doi: 10.3394/0380-1330(2007)33[202:TAMBTC]2.0.CO;2
Robinson, C. (2015). Review on groundwater as a source of nutrients to the great lakes and their tributaries. J. Great Lakes Res. 41, 941–950.doi: 10.1016/.j.jglr.205.08.001
Roditi, H. A., Strayer, D. L., and Findlay, S. E. G. (1997). Characteristics of zebra mussel (Dreissena polymorpha) biodeposits in a tidal freshwater estuary. Arch. Hydrobiol. 140, 207–219. doi: 10.1127/archiv-hydrobiol/140/1997/207
Roe, S. L., and MacIsaac, H. J. (1997). Deepwater population structure and reproductive state of quagga mussels (Dreissena bugensis) in Lake Erie. Can. J. Fish. Aquat. Sci. 54, 2428–2433. doi: 10.1139/f97-151
Rosamond, M. (2013). Nitrous Oxide and Nitrate in the Grand River, Ontario: Sources, Production Pathways and Predictability. Waterloo, ON.
Rukavina, N. A., and St. Jacques, D. A. (1971). “Lake Erie nearshore sediments Fort Erie to Mohawk Pt, Ontario,” in Proc. 14th Conf Great Lakes Res. (International Association for Great Lakes Research), 387–393.
Sauey, B. W., Amberg, J. J., Cooper, S. T., Grunwald, S. K., Haro, R. J., and Gaikowski, M. P. (2016). Digestive physiology comparisons of aquatic invertebrates in the Upper Mississippi River Basin. J. Freshw. Ecol. 31, 303–314. doi: 10.1080/02705060.2015.1132485
Shear, H., and Konasewich, D. (1975). Cladophora in the Great Lakes. Windsor, ON: International Joint Commission.
Struger, J., van Stempvoort, D. R., and Brown, S. J. (2015). Sources of aminomethylphosphonic acid (AMPA) in urban and rural catchments in Ontario, Canada: glyphosate or phosphonates in wastewater? Environ. Pollut. 204, 289–297. doi: 10.1016/j.envpol.2015.03.038
Tamburini, F., Bernasconi, S. M., Angert, A., Weiner, T., and Frossard, E. (2010). A method for the analysis of the δ18O of inorganic phosphate extracted from soils with HCl. Eur. J. Soil Sci. 61, 1025–1032. doi: 10.1111/j.1365-2389.2010.01290.x
Tamburini, F., Pfahler, V., Bünemann, E. K., Guelland, K., Bernasconi, S. M., and Frossard, E. (2012). Oxygen isotopes unravel the role of microorganisms in phosphate cycling in soils. Environ. Sci. Technol. 46, 5956–5962. doi: 10.1021/es300311h
Taylor, W. D., and Lean, D. R. S. (1981). Radiotracer experiments on phosphorus uptake and release by limnetic microzooplankton. Can. J. Fish. Aquat. Sci. 38, 1316–1321. doi: 10.1139/f81-177
Thomson-Bulldis, A., and Karl, D. (1998). Application of a novel method for phosphorus determinations in the oligotrophic North Pacific Ocean. Limnol. Oceanogr. 43, 1565–1577. doi: 10.4319/lo.1998.43.7.1565
Turner, C. B. (2010). Influence of zebra (Dreissena polymorpha) and quagga (Dreissena rostriformis) mussel invasions on benthic nutrient and oxygen dynamics. Can. J. Fish. Aquat. Sci. 67, 1899–1908. doi: 10.1139/F10-107
Valipour, R., León, L. F., Depew, D., Dove, A., and Rao, Y. R. (2016). High-resolution modeling for development of nearshore ecosystem objectives in eastern Lake Erie. J. Gt. Lakes Res. 42, 1241–1251. doi: 10.1016/j.jglr.2016.08.011
Von Sperber, C., Kries, H., Tamburini, F, Bernasconi, S.M., and Frossard, E. (2014). The effect of phosphomonoesterases on the oxygen isotope composition of phosphate. Geochim. Cosmochim. Acta 125, 519–527. doi: 10.1016/j.gca.2013.10.010
Von Sperber, C., Tamburini, F., Brunner, B., Bernasconi, S.M., and Frossard, E. (2015). The oxygen isotope composition of phosphate released from phytic acid by the activity of wheat and Aspergillus niger phytase. BioGeosciences, 12, 4175–4184. doi: 10.5194/bg-12-4175-2015
Young, M. B., McLaughlin, K., Kendall, C., Stringfellow, W., Rollog, M., Elsbury, K., et al. (2009). Characterizing the oxygen isotopic composition of phosphate sources to aquatic ecosystems. Environ. Sci. Technol. 43, 5190–5196. doi: 10.1021/es900337q
Yuan, Y., Bi, Y., and Hu, Z. (2017). Phytoplankton communities determine the spatio-temporal heterogeneity of alkaline phosphatase activity: evidence from a tributary of the Three Gorges Reservoir. Sci. Rep. 7:16404. doi: 10.1038/s41598-017-16740-4
Keywords: Lake Erie, phosphorus, Cladophora, oxygen isotopes, dreissenids
Citation: Depew DC, Koehler G and Hiriart-Baer V (2018) Phosphorus Dynamics and Availability in the Nearshore of Eastern Lake Erie: Insights From Oxygen Isotope Ratios of Phosphate. Front. Mar. Sci. 5:215. doi: 10.3389/fmars.2018.00215
Received: 28 February 2018; Accepted: 30 May 2018;
Published: 19 June 2018.
Edited by:
Christian Lønborg, Australian Institute of Marine Science, AustraliaReviewed by:
Michael R. Twiss, Clarkson University, United StatesFederica Tamburini, ETH Zürich, Switzerland
Copyright © 2018 Depew, Koehler and Hiriart-Baer. This is an open-access article distributed under the terms of the Creative Commons Attribution License (CC BY). The use, distribution or reproduction in other forums is permitted, provided the original author(s) and the copyright owner are credited and that the original publication in this journal is cited, in accordance with accepted academic practice. No use, distribution or reproduction is permitted which does not comply with these terms.
*Correspondence: David C. Depew, david.depew@canada.ca