The Influence of Basaltic Islands on the Oceanic REE Distribution: A Case Study From the Tropical South Pacific
 Mario Molina-Kescher1*
  Ed C. Hathorne1
  Anne H. Osborne1
  Melanie K. Behrens2
  Martin Kölling3†
  Katharina Pahnke2
  Martin Frank1
- 1GEOMAR Helmholtz Centre for Ocean Research Kiel, Kiel, Germany
- 2Max Planck Research Group for Marine Isotope Geochemistry, Institute for Chemistry and Biology of the Marine Environment, University of Oldenburg, Oldenburg, Germany
- 3Zentrum für Marine Umweltwissenschaften, Universität Bremen, Bremen, Germany
The Rare Earth Elements (REEs) have been widely used to investigate marine biogeochemical processes as well as the sources and mixing of water masses. However, there are still important uncertainties about the global aqueous REE cycle with respect to the contributions of highly reactive basaltic minerals originating from volcanic islands and the role of Submarine Groundwater Discharge (SGD). Here we present dissolved REE concentrations obtained from waters at the island-ocean interface (including SGD, river, lagoon and coastal waters) from the island of Tahiti and from three detailed open ocean profiles on the Manihiki Plateau (including neodymium (Nd) isotope compositions), which are located in ocean currents downstream of Tahiti. Tahitian fresh waters have highly variable REE concentrations that likely result from variable water–rock interaction and removal by secondary minerals. In contrast to studies on other islands, the SGD samples do not exhibit elevated REE concentrations but have distinctive REE distributions and Y/Ho ratios. The basaltic Tahitian rocks impart a REE pattern to the waters characterized by a middle REE enrichment, with a peak at europium similar to groundwaters and coastal waters of other volcanic islands in the Pacific. However, the basaltic island REE characteristics (with the exception of elevated Y/Ho ratios) are lost during transport to the Manihiki Plateau within surface waters that also exhibit highly radiogenic Nd isotope signatures. Our new data demonstrate that REE concentrations are enriched in Tahitian coastal water, but without multidimensional sampling, basaltic island Nd flux estimates range over orders of magnitude from relatively small to globally significant. Antarctic Intermediate Water (AAIW) loses its characteristic Nd isotopic signature (−6 to −9) around the Manihiki Plateau as a consequence of mixing with South Equatorial Pacific Intermediate Water (SEqPIW), which shows more positive values (−1 to −2). However, an additional Nd input/exchange along the pathway of AAIW, eventually originating from the volcanic Society, Tuamotu and Tubuai Islands (including Tahiti), is indicated by an offset from the mixing array of AAIW and SEqPIW to more radiogenic Nd isotope compositions.
Key Points
• REE concentrations in Tahitian coastal waters show a clear basaltic island input.
• Tahitian Submarine Groundwater Discharge has relatively low REE concentrations but high Y/Ho.
• Basaltic influence on S Pacific surface waters mostly lost during transit to Manihiki Plateau region.
• Manihiki surface waters have high Y/Ho and radiogenic Nd isotope compositions.
Introduction
The distribution of the Rare Earth Elements (REE) in seawater reflects the subtle but systematic differences in their chemical properties (e.g., Elderfield and Greaves, 1982). The relative abundance of the free trivalent REE ions (except Ce) in seawater produces coherent patterns as a function of the decreasing ionic radii across the group (lanthanide contraction). These patterns can be used to track processes such as the biogeochemical behavior (e.g., Elderfield, 1988; Schijf et al., 2015), oceanic water mass advection (e.g., Nozaki, 2001; Osborne et al., 2015), or sourcing of water masses and continental weathering inputs (e.g., Byrne and Sholkovitz, 1996; Molina-Kescher et al., 2014). The REEs are subdivided into light REE (LREE), from La to Sm; middle REE (MREE), from Eu to Dy; and heavy REE (HREE), from Ho to Lu (Nozaki, 2001). As marine waters acquire their REE compositions through weathering of continental rocks, normalization of their seawater REE concentrations to a typical upper continental source, such as the Post-Archean Australian Shale (PAAS) (Taylor and McLennan, 1985) removes the zig-zag pattern in natural abundance that was caused by nucleosynthetic processes, exposing deviations in composition that can reveal the source of the REE or the processes that have changed their relative abundances. For example, rivers are generally enriched in MREE, most likely caused by the weathering of phosphate minerals (Hannigan and Sholkovitz, 2001), although some rivers can have almost seawater-like patterns like the Mississippi (e.g., Sholkovitz, 1995) or the truly dissolved load of the Amazon (Merschel et al., 2017). Typical open ocean PAAS normalized patterns present a continuous increase in abundance from LREE to HREE, caused by the preferential removal of LREE from solution by adsorption processes (Byrne and Kim, 1990; Schijf et al., 2015), and a strong Ce depletion caused by its oxidation to Ce(IV), which is highly insoluble (Moffett, 1990). The “Ce anomaly” (Ce/Ce* = 3*[Ce]/2*[Nd]+[La]) (e.g., Nozaki, 2001) is termed “negative” (Ce/Ce* < 1) when Ce is depleted with respect to its neighbor elements and “strong” when it is closest to 0. Eu also presents anomalies (Eu/Eu* = 3*[Eu]/2*[Sm]+[Tb]) with respect to its neighboring elements Sm and Tb (Gd is omitted from this calculation as it is prone to anthropogenic contamination, Bau and Dulski, 1996), which originate from weathering of basalts and hydrothermal activity (Byrne and Sholkovitz, 1996). However, to allow interpretation of Eu anomalies, careful separation of Ba from the sample solution or correction for oxide formation during REE analysis is required because of isobaric interferences on Eu (Aries et al., 2000).
Even more information can be obtained with the radiogenic isotope composition of the LREE neodymium (Nd) as this tracks large-scale oceanic circulation in the present day ocean (e.g., Piepgras and Wasserburg, 1982, 1987; Bertram and Elderfield, 1993; Singh et al., 2012; Osborne et al., 2014; Basak et al., 2015; Stichel et al., 2015), and has been applied to reconstruct past circulation (e.g., Wilson et al., 2015; Howe et al., 2016; Hu et al., 2016; Molina-Kescher et al., 2016; Wei et al., 2016). Water masses acquire characteristic Nd isotope compositions (143Nd/144Nd, expressed in the εNd notation: εNd = [(143Nd/144Ndsample/143Nd/144NdCHUR)-1]*10,000; CHUR = Chondritic Uniform Reservoir, with 143Nd/144Nd = 0.512638, Jacobsen and Wasserburg, 1980) in their formation regions via continental weathering inputs from rivers, dust, and/or submarine groundwater discharge (e.g., Goldstein and Jacobsen, 1987; Frank, 2002; Goldstein and Hemming, 2003; Johannesson and Burdige, 2007), and also through sediment particulate exchange processes at the continent/ocean interface, broadly defined as “boundary exchange” (e.g., Lacan and Jeandel, 2005; Du et al., 2016). Near the ocean margins, processes such as a benthic flux of REE from pore waters (Elderfield and Sholkovitz, 1987; Abbott et al., 2015), release from river particles (Goldstein and Jacobsen, 1987; Rousseau et al., 2015), and interaction with sinking particles in the water column (Bertram and Elderfield, 1993; Siddall et al., 2008; Grasse et al., 2012, 2017; Chen et al., 2013; Jeandel and Oelkers, 2015) influence the εNd signature of seawater. In the open ocean, the εNd signatures of different intermediate and deep-water masses are quasi-conservative and primarily altered through mixing because the oceanic residence time of Nd (300–2,000 years) is similar to the global oceanic mixing time (e.g., Tachikawa et al., 2003; Arsouze et al., 2009; Rempfer et al., 2011).
Two open questions key to our understanding of global aqueous REE cycling are the significance of inputs from highly reactive basaltic minerals associated with the weathering of volcanic island rocks (Allègre et al., 2010; Kim and Kim, 2011; Pearce et al., 2013; Fröllje et al., 2016), and the importance of Submarine Groundwater Discharge (SGD) (e.g., Duncan and Shaw, 2003; Johannesson and Burdige, 2007; Johannesson et al., 2011, 2017). SGD is defined as the total flux of underground water that is introduced from continental margins, of which less than 10% corresponds to waters of terrestrial and meteoric origin. The remaining 90% consists of seawater that is recirculated through the sediments by a variety of processes, such as hydraulic gradients, tidal pumping, or wave set-up, resulting in biogeochemical reactions that significantly modify its geochemistry (including that of REEs; Moore, 1996, 2003; Burnett et al., 2003; Johannesson and Burdige, 2007; Kim and Kim, 2011). Geochemical weathering through SGD is particularly pronounced at the margins of young and highly reactive volcanic islands (Schopka and Derry, 2012; Kwon et al., 2014). SGD includes fresh, brackish and fully marine waters and has been estimated to be on the same order as the global riverine discharge to the oceans (Johannesson and Burdige, 2007; Moore et al., 2008; Kwon et al., 2014) and is likely an important contributor to the global REE budget (Johannesson and Burdige, 2007) especially in the Pacific Ocean (Kwon et al., 2014). Two recent studies of REEs in groundwater and near costal seawater of the basaltic Hawaiian islands found strongly contrasting concentrations with coastal waters around Oahu showing little or no enrichment compared to open ocean waters (Fröllje et al., 2016) while one sample of surface seawater from near Kona on the Big Island Hawai'i exhibited concentrations >30 times higher for the LREE and >10 times higher for HREE compared to offshore seawater (Johannesson et al., 2017). Although the concentrations indicated little input, the Nd isotopes and REE patterns around Oahu clearly reveal the influence of basaltic REEs on the seawater (Fröllje et al., 2016) suggesting an exchange type process (e.g., Lacan and Jeandel, 2005). Near Kona on the other hand, the high REE concentrations and patterns are similar to those found in groundwaters suggesting a significant input of REEs through SGD with little modification during mixing with seawater (Johannesson et al., 2017). Similarly, another Pacific volcanic island, Jeju (Korea), shows SGD REE fluxes to the ocean comparable to that of major rivers (i.e., Mississippi River) (Kim and Kim, 2011).
In order to assess the importance of exchange with basaltic islands in the oceanic REE cycle, to identify associated REE patterns, and to expand the database for the as yet poorly studied South Pacific, we present REE concentrations obtained from a variety of waters sampled at the land-ocean interface, including river mouths, lagoons, and coastal seawater from a SGD spring in the reef along the margin of the volcanic island of Tahiti (Figure 1A). We also present REE concentrations and εNd signatures obtained from three detailed open ocean profiles above the Manihiki Plateau (between ~3°S, and ~13°S, ~162°W, and ~166°W; Figure 1B), located to the NW of Tahiti and thus downstream of the main oceanic circulation pathways that pass the Tuamotu, Tubuai, and Society Islands (to which Tahiti belongs). Oceanographically, this region represents the transition between the formation region of Southern Ocean derived water masses, such as the climatically highly relevant Antarctic Intermediate Water (AAIW) (e.g., Pahnke et al., 2008; Tapia et al., 2015) or Upper Circumpolar Deep Water (UCDW), and the western equatorial Pacific. The latter is a key region for global climate (Hu et al., 2015) (see section “General hydrography”), and the site of important geochemical modifications, including REE and Nd isotopes (Lacan and Jeandel, 2001; Grenier et al., 2013, 2014). Both AAIW and UCDW pass Tahiti and the Manihiki Plateau and are prone to be modified in terms of their REE and Nd isotope compositions as they encounter the first volcanic islands on their NW pathway, even before reaching the western equatorial Pacific. These data allow the evaluation of REE changes in surface, intermediate, and deep waters potentially produced by volcanic islands.
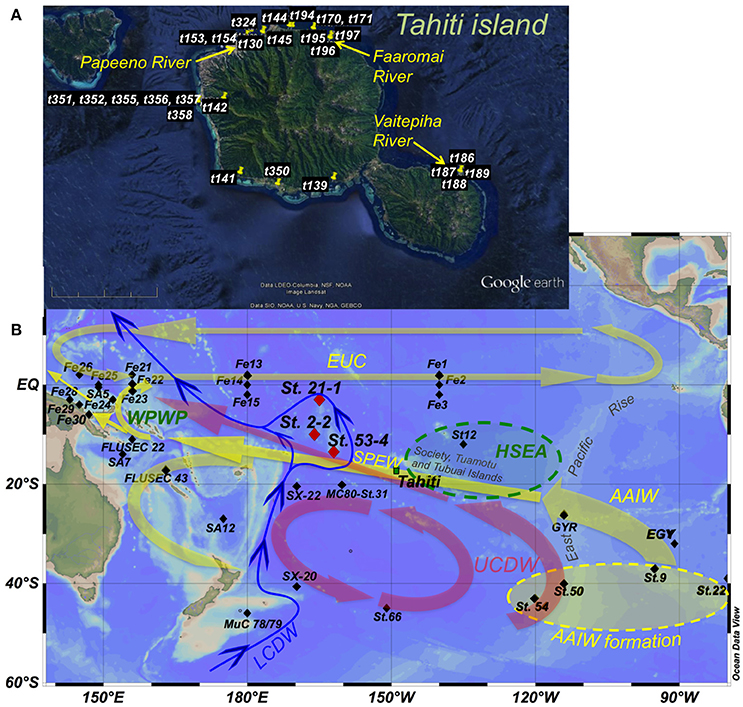
Figure 1. Maps of Tahiti (17° 40′S/149° 25′W) (A) and the central/ South Pacific (B) showing the sampling sites of this and published studies and the main oceanographic features. Red diamonds in (B) indicate seawater stations 21-1 (3°3.0′S/165° 3.5′W), 2-2 (9° 59.8′S/166° 12.0′W), and 53-4 (13° 30.6′S/162° 7.6′W), the last two are located above the Manihiki Plateau. The island of Tahiti is marked by a green square. Black diamonds indicate sites presented in Grenier et al. (2013 and 2014): Fe 1 to Fe 30 plus FLUSEC 22 and 23; Zhang and Nozaki (1996): SA5, SA7, and SA12; Lacan and Jeandel (2001): St12; Jeandel et al. (2013): GYR and EGY; Amakawa et al. (2013): SX-20 and SX-22; Piepgras and Jacobsen (1988): MC80-St.31; and Molina-Kescher et al. (2014): St.22, St.9, St.50, St.54, St.66, and MuC 78/79. Main circulation patterns and directions (according to Kawabe and Fujio, 2010) are indicated with yellow arrows (1,000–1,500 m water depth), red arrows (1,500–3,000 m water depth), and blue arrows (bottom water). Green oval represents the High Surface Evaporation Area (HSEA) and yellow oval indicates AAIW formation region. WPWP stands for West Pacific Warm Pool. Water mass: AAIW, Antarctic Intermediate Water; UCDW, Upper Circumpolar Deep Water; LCDW, Lower Circumpolar Deep Water; SPEW, South Pacific Equatorial Water; EUC, Equatorial Undercurrent. Topographic features mentioned in the text are also presented. A more detailed hydrography of the subsurface (50 m water depth) and intermediate (1,000 m water depth) water column is provided in Figure S1.
General Hydrography
The circulation in the tropical South Pacific generally follows a SE to NW direction at all depths (Figure 1B) and represents the northern limb of the wind-driven geostrophic anticyclonic gyre that affects the entire water column of the South Pacific (Reid, 1997).
The surface hydrography of the westernmost equatorial Pacific is dominated by the West Pacific Warm Pool (WPWP) (Figure 1B), the largest oceanic warm-pool on Earth that plays a key role in the heat transfer between ocean and atmosphere in the tropics and in particular for the dynamics of the El Niño Southern Oscillation (ENSO) (Hu et al., 2015). The WPWP is connected to the central Pacific circulation system via the Equatorial Undercurrent (EUC), which crosses the entire equatorial Pacific from West to East and acts as the counterpart of the equatorial westward surface currents that push warm waters toward the WPWP (Tsuchiya et al., 1989; Tomczak and Godfrey, 2003). Another important feature of the surface waters of the tropical central Pacific is the High Surface Evaporation Area (HSEA) centered at ~15°S/130°W (see Figure 1B and Figure S1), where South Pacific Equatorial Water (SPEW) forms as a consequence of strong evaporation. This water mass is subsequently subducted and carries its high salinity and high oxygen signal to the NW into the WPWP (Tomczak and Hao, 1989; Tsuchiya et al., 1989; Qu and Lindstrom, 2002; Tomczak and Godfrey, 2003). Antarctic Intermediate Water (AAIW) is the major intermediate water mass prevailing between 600 and 1,300 m in the entire South Pacific (Hartin et al., 2011) and is characterized by low salinities (34.3–34.5), low temperatures (3.5–10°C), and high oxygen content (4.5–5.5 ml/l) (Bostock et al., 2010). AAIW forms mainly in the southeastern Pacific as a consequence of cooling of Subantarctic Mode Water (SAMW) (Sloyan and Rintoul, 2001) and flows in a NW direction following the subtropical gyre circulation (Tomczak and Godfrey, 1994) (Figure 1B). Equatorial Pacific Intermediate Water (EqPIW) (Bostock et al., 2010) dominates in the tropical region (~15°N to ~15°S) and is a mixture of AAIW and Pacific Deep Water (PDW). It carries distinct non-conservative tracer signatures such as very low oxygen concentrations (below 2 ml/l) originating from high biological activity and subsequent demineralization of organic material at the equator as a consequence of the upwelling of nutrient rich waters. EqPIW can be further subdivided into South EqPIW (SEqPIW) and North EqPIW (NEqPIW), separated by the equator and characterized by higher biological activity to the north of the equator (NEqPIW) (Bostock et al., 2010) (see Figure S1). The main mixing zone between pure AAIW and SEqPIW at the longitude of our seawater profiles (~165°W) is located between ~13°S and ~17°S. The locations of the stations of our study at 13°S (53-4), 9°S (2-2), and 3°S (21-1) allow investigation of the consequences of the mixing of these water masses for REE concentrations and Nd isotope compositions (see Figure S1). Below the intermediate water layer Upper Circumpolar Deep Water (UCDW) prevails, which detaches from the Antarctic Circumpolar Current (ACC) in the South Pacific near 120°W and first flows northward and then northwestward (similar to AAIW) toward the equatorial western Pacific (Figure 1B; Reid, 1997; Kawabe and Fujio, 2010). Along its pathway through the Pacific Ocean, this initially cold, salty and oxygen rich water mass loses its properties through mixing with PDW that carries a significantly lower oxygen content and dominates the mid-depth water column of the South Pacific (e.g., Molina-Kescher et al., 2014). As a result, the dissolved oxygen maximum of UCDW essentially vanishes north of 15°S in the Samoa/New Guinea region (Reid, 1997; Kawabe and Fujio, 2010). Lower Circumpolar Deep Water (LCDW) is the bottom water mass responsible for the ventilation of the entire deep Pacific given that no deep water is formed in the North Pacific. This water mass enters the Pacific basin southeast of New Zealand as a Deep Western Boundary Current and flows northward embracing the Manihiki Plateau (Kawabe and Fujio, 2010; Figure 1B).
Methods
Sampling at Tahiti and Above the Manihiki Plateau
A total of 27 water samples collected at different locations in Tahiti during two sampling campaigns in 2007 and 2009 were measured for REE concentrations. These include coastal and lagoon waters, stream/river waters, and the mixing of these with seawater as well as some samples from an active SGD spring “La source” (Table 1). These samples were filtered directly after collection through 0.2 μm 25 mm Sartorius Minisart syringe filters with a CA membrane into acid cleaned PE bottles. The samples were acidified within 24 h of collection with trace metal grade HNO3 to a pH of ≤2.
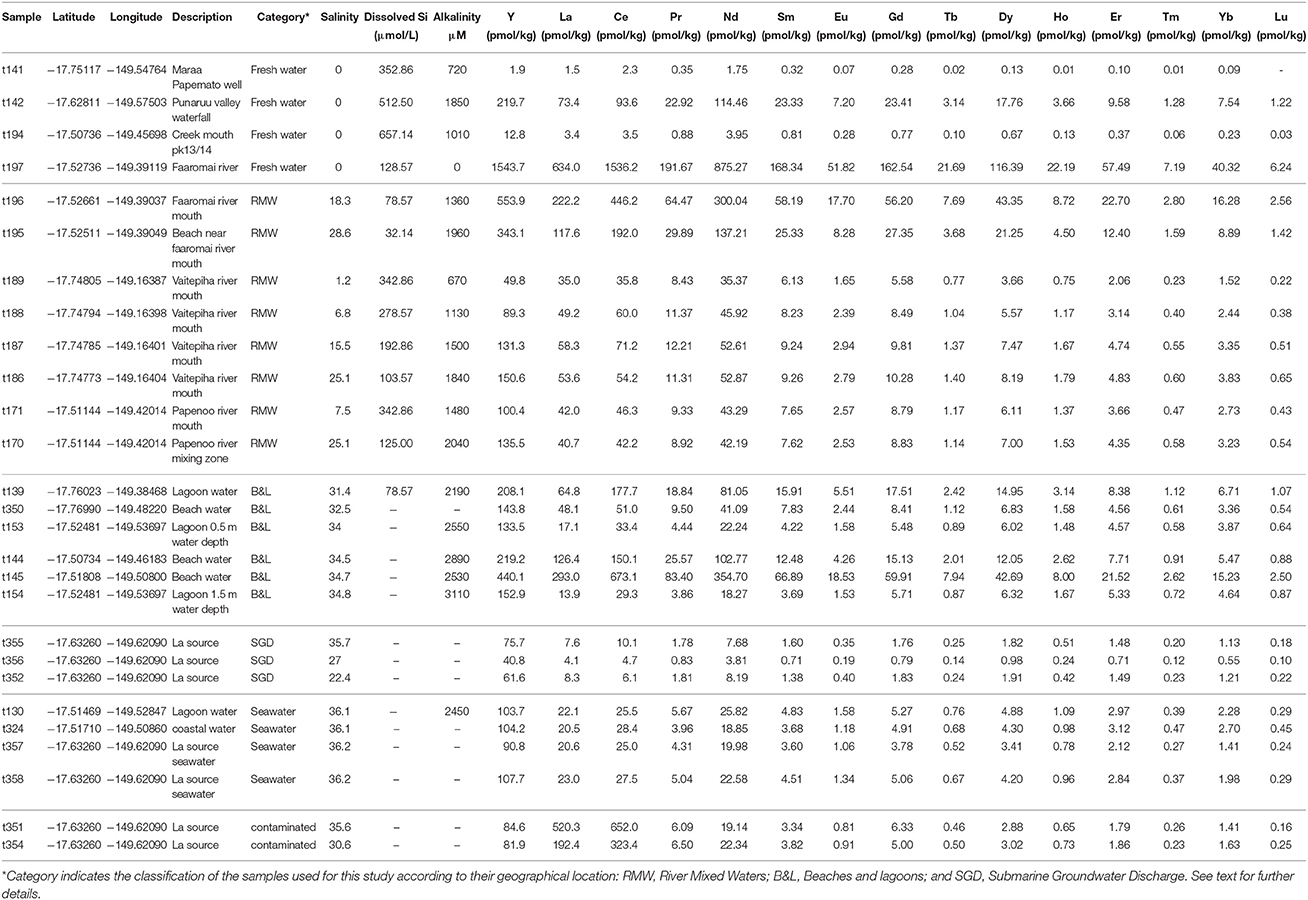
Table 1. Location, description, hydrological properties, REE concentrations and different REE relationships for Tahitian waters.
The open ocean seawater samples of this study were obtained during RV Sonne cruise SO-225 from three profiles above the Manihiki Plateau in December 2012 (Figure 1, Tables 2, 3) using a CTD rosette equipped with 24 × 12 L standard Niskin bottles (Ocean Test Equipment Inc.). All samples were filtered directly from the Niskin bottles using AcroPak500 filter cartridges with 0.8/0.2 μm pore size into acid-cleaned PE bottles and cubitainers, 125 ml for REE analysis and 10 L for Nd isotope compositions, respectively. All samples were acidified to pH 2 onboard using distilled 6 N HCl and were stored at 4°C. REE concentrations for profile 21-1 (except for 5,172 m) and sample 53-4-3088 m were previously published in Osborne et al. (2017).
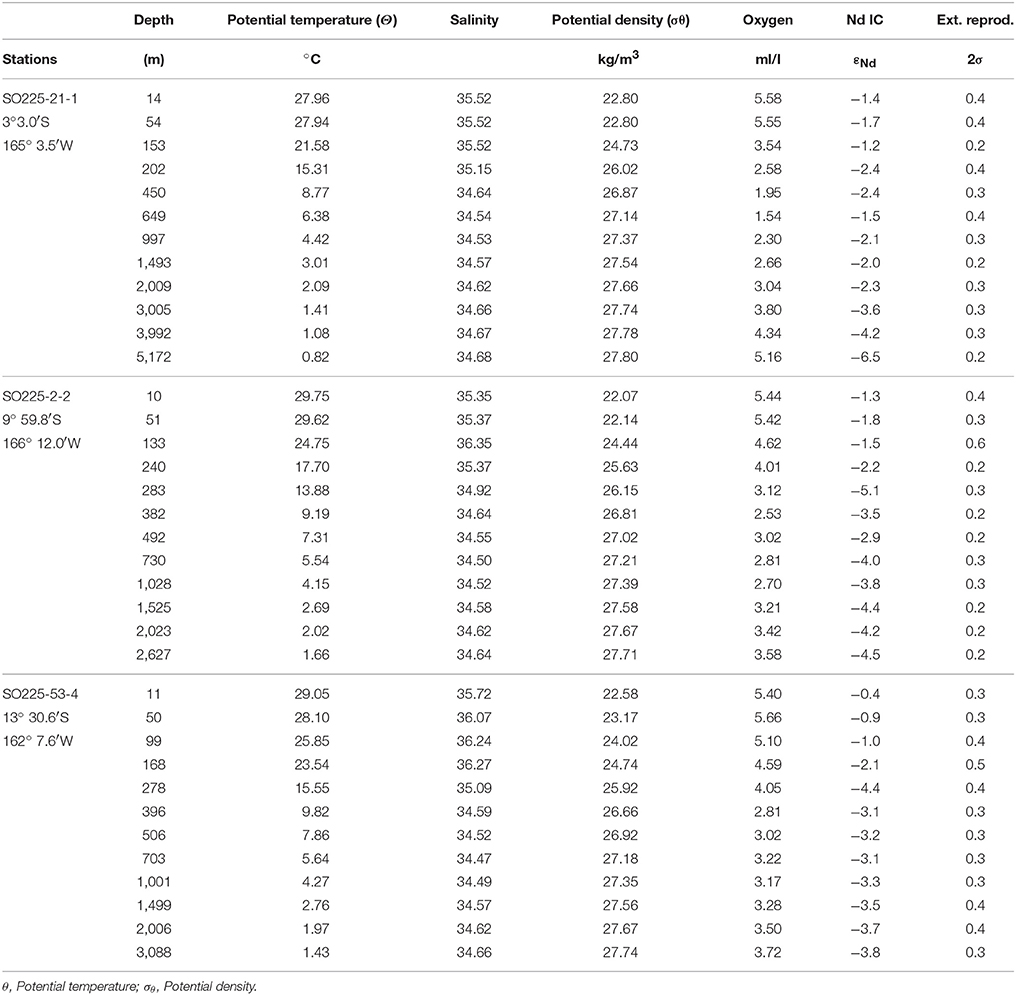
Table 2. Hydrological characteristics and neodymium (Nd) isotopic compositions (IC) with external reproducibilities (2σ) for open ocean seawater obtained at the Manihiki Plateau presented from north to south.
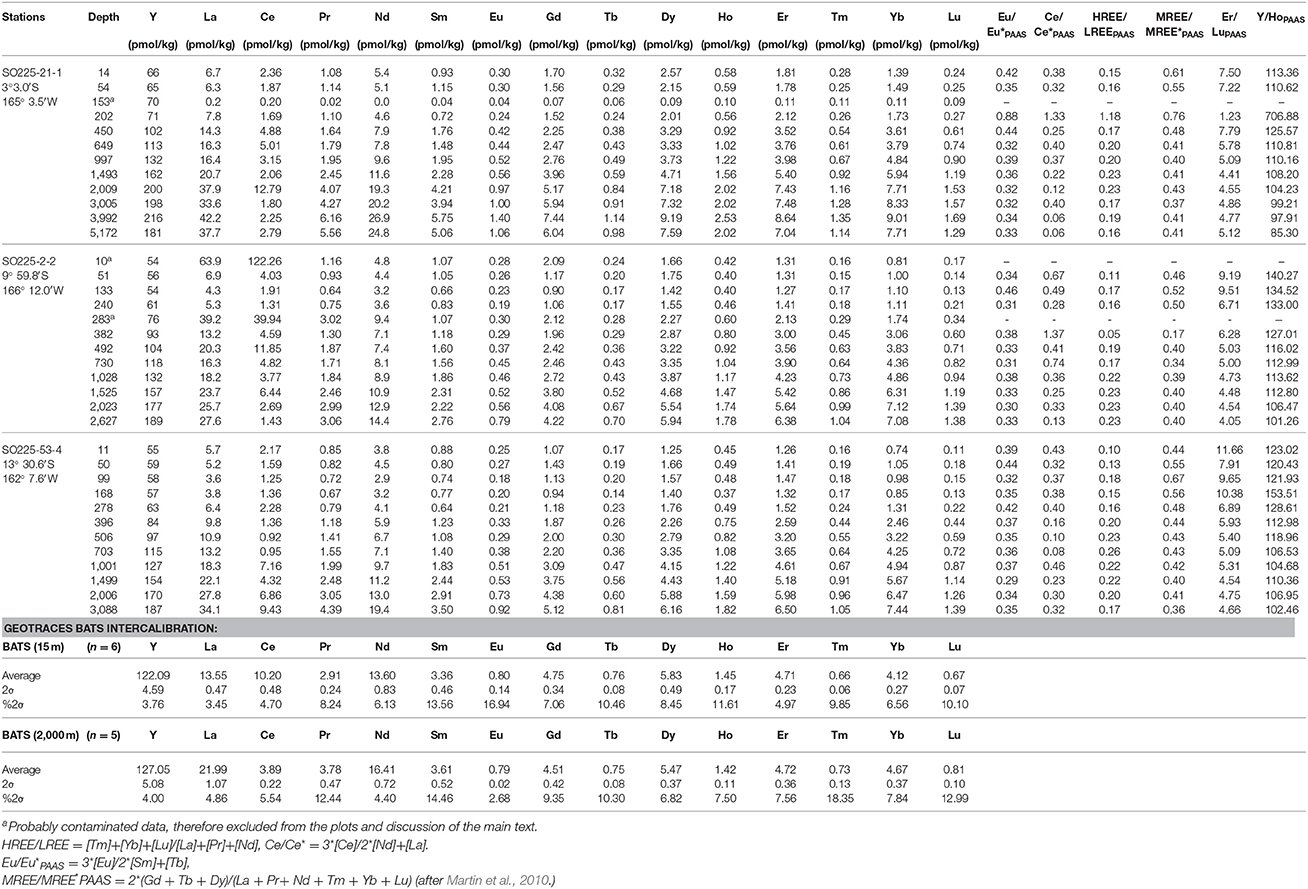
Table 3. Rare Earth element data for open ocean seawater obtained at the Manihiki Plateau and GEOTRACES intercalibration measurements (BATS) for this study presented from north to south.
Measurement of YREE Concentrations
Yttrium and REE concentrations were measured at GEOMAR using a seaFAST online pre-concentration system (Elemental Scientific Inc., Nebraska, USA) directly connected to an Agilent 7500ce ICP-MS (Hathorne et al., 2012, 2015; Osborne et al., 2015). This method was part of the GEOTRACES intercalibration for REE concentrations (van de Flierdt et al., 2012). Tahitian samples were measured with a 4 mL loop as in Hathorne et al. (2012), while Manihikian samples were measured with an 8 mL sample loop. Calibration standards were prepared with a mixed YREE solution of a seawater-like composition in a natural seawater matrix, and the Manihikian samples were measured by time resolved analysis (Osborne et al., 2015). As the seaFAST column quantitatively removes the matrix (e.g., Hathorne et al., 2012) the same calibration standards were used for all samples regardless of their salinity. Total procedural blanks for the Tahitian samples, including filtering pure water in the field and storage in sample bottles, before being run through the preconcentration system just like samples, were < 0.1 ppt for all REE and < 0.2 ppt for Y. These were below the detection limits for most YREE and negligible except for the fresh water samples with very low conductivity. Although no procedural blanks were taken during the Manihiki campaign, comparable shipboard blanks from the GEOMAR lab obtained during other cruises using essentially the same methods were < 0.1 ppt for La and Ce and below the detection limit for the other REEs. Repeated analyses of GEOTRACES BATS reference seawater samples (van de Flierdt et al., 2012) were used to assess the accuracy and precision of the analyses (Table 3).
Measurement of Radiogenic Nd Isotope Compositions
For details on the laboratory procedure see Behrens et al. (2018). Briefly, Nd was preconcentrated from 10 L of seawater using C18 SepPak® cartridges (modified after Shabani et al., 1992; Jeandel et al., 1998). Neodymium isotope ratios were measured on a Thermo Neptune Plus multicollector-inductively coupled plasma-mass spectrometer (MC-ICP-MS) at the ICBM, University of Oldenburg. The measured 143Nd/144Nd ratios were corrected for instrumental mass fractionation to a 146Nd/144Nd ratio of 0.7219 (O'Nions et al., 1977) using an exponential law. The mass bias-corrected 143Nd/144Nd ratios were normalized to 0.512115, the accepted value for the JNdi-1 standard (Tanaka et al., 2000), which was measured at the beginning and end of a session and after every third sample together with an in-house Nd standard. External reproducibility, checked with multiple JNdi-1 analyses during each session, was typically better than ± 0.3 εNd units (2σ, n = 11–19 per session). For individual samples, the 2σ propagated error derived from the internal error and external error (mean values of JNdi measurements of the respective session) is provided (Table 2). Standards and samples were run at the same concentrations. The accuracy of our measurements was checked using total procedural duplicates of seawater samples from two water depths of the GEOTRACES intercalibration station BATS (Bermuda Atlantic Time-Series Station) and one sample from the SAFe intercalibration (Sampling and Analysis of Iron) (Pahnke et al., 2012; van de Flierdt et al., 2012). Our measured average εNd values of seawater at BATS (15 and 2,000 m) and SAFe (3,000 m) are identical within analytical uncertainties to the measurements of the average εNd values reported by van de Flierdt et al. (2012) (see Behrens et al., 2018). Column chemistry blanks were <1.5 pg Nd (n = 6).
Results
All the results presented in this study are available in the database of PANGAEA (https://doi.org/10.1594/PANGAEA.884775).
REE Compositions of Tahitian Waters
The Tahitian water samples show large differences in their absolute REE concentrations, with the largest range found for the freshwaters, ranging from 1.7 pmol Nd/kg (t141; a well water with very low conductivity) and 875 pmol Nd/kg (t197 river water), but at the same time exhibiting similarities in their PAAS normalized patterns, mostly resembling Tahitian basaltic rocks (Figures 2A–C). The REE concentrations and pattern indices (e.g., HREE/LREE, MREE enrichment, Ce and Eu anomalies), of the Tahitian water samples do not correlate with properties such as salinity, alkalinity or dissolved silicate (Figure S2). However, the classification of the samples according to salinity (Table 1) reveals systematic variations based on different REE pattern indices (Figure S3) as discussed in section “Basaltic influence on Tahitian coastal waters.”
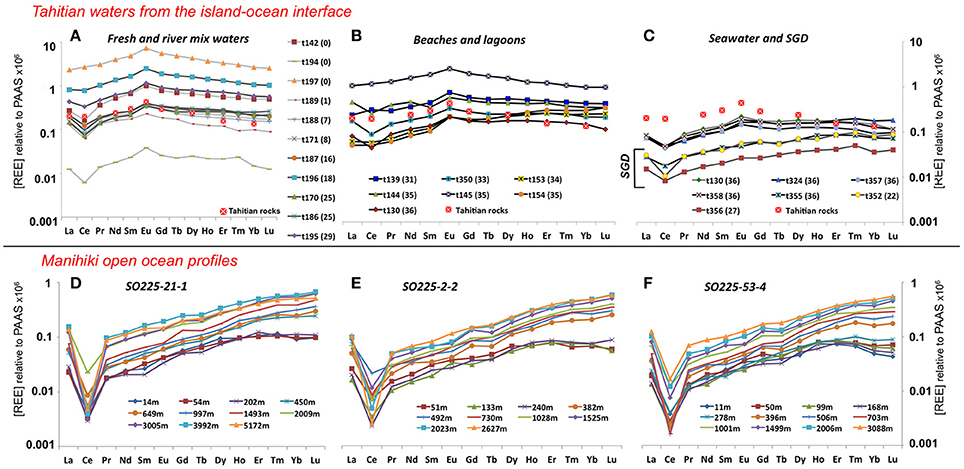
Figure 2. PAAS normalized REE patterns for Tahitian water samples (A–C) coded by salinity: fresh waters (0–10) in light gray, brackish waters (10–30) in dark gray and salty waters (≥30) in black. Salinities are indicated in brackets for each sample. PAAS normalized REE pattern of coarse-grained igneous rocks of Tahiti (Cordier et al., 2005) is also presented in (A–C) (see legend). PAAS normalized REE patterns for open ocean profiles obtained on the Manihiki Plateau are presented in panels: (D) for Station SO225-21-1; (E) for Station SO225-2-2; and (F) for Station SO225-53-4 with water depth (m) indicated in the legend. Note the different scale between the samples from Tahiti and Manihiki.
Two seawater samples (t354 and t351) (Table 1) have clearly anomalous enrichments of La (520 and 192 pmol/kg) and Ce (652 and 323 pmol/kg) indicative of contamination by petroleum products (Olmez et al., 1991) and are not discussed further.
Seawater Profiles From the Manihiki Plateau
Water Mass Identification
It is difficult to distinguish intermediate and deep water masses in the Pacific Ocean on the basis of temperature and salinity characteristics and thus information from additional tracers such as oxygen concentrations is required (Figure 3). The data for all three stations above the Manihiki Plateau show similar patterns, with southernmost station 53-4 being characterized by the highest [O2] values (5.7 ml/l at ~50 m water depth, representing SPEW) while northernmost station 21-1 close to the equator shows the lowest oxygen concentrations (1.4 ml/l at ~ 650 m water depth, representing pure SEqPIW), reflecting the progressive northward dilution of Southern Ocean-derived, oxygen-rich waters toward the equator. All three stations exhibit a reduction of oxygen concentration with water depth with a [O2] minimum between 26.4 and 27.4 σθ (corresponding to a water depth between 220/330 m (St. 21-1/St.2-2 and St. 53-4) and ~ 1,100 m), with the increased presence of PDW. A steady increase in [O2] from ~1,100 m depth to the bottom marks the presence of UCDW. The deepest samples of station 21-1, at 3,992 and 5,172 m water depth correspond to LCDW, which is even more enriched in oxygen than UCDW (Callahan, 1972), given that the latter contains a higher proportion of oxygen depleted PDW that dominates mid-depths (Kawabe and Fujio, 2010; Molina-Kescher et al., 2014). Another distinct feature observed in Figure 3 is the presence of diluted AAIW at a potential density of ~27, which can be distinguished by a small oxygen enrichment at all three stations that is most pronounced at the southernmost station 53-4 and weaker near the equator (St. 21-1). This shows that AAIW in the study area is considerably diluted (maximum [O2]AAIW = 3.5 ml/l for St. 53-4) compared to its source region in the Southeast Pacific ([O2]AAIW = 5.5 ml/l for St. 9, Molina-Kescher et al., 2014) (Figure 3 and Figure S1). The presence and progressive northward disappearance of near surface SPEW can be also identified in Figure 3 by a reduction in oxygen concentrations at a potential density of ~23.2 σθ from southernmost station 53-4 to the northernmost station 21-1.
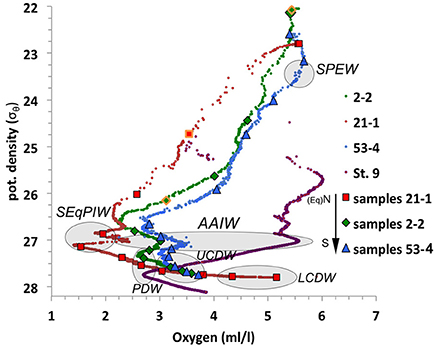
Figure 3. Potential density vs. oxygen concentrations for the three open ocean profiles from the Manihiki Plateau: 21-1 (red), 2-2 (green), and 53-4 (blue), with their relative location indicated on the legend: N, North; Eq, Equator, and S, South. Symbols represent sampled depths for REE and Nd isotope analysis (symbols outlined in orange indicate anomalous REE data). St. 9 (purple) from the SE Pacific (Molina-Kescher et al., 2014) is also shown for comparison. Gray ovals indicate the properties of the most important water masses of the region. Water mass: SPEW, South Pacific Equatorial Water; SEqPIW, South Equatorial Pacific Intermediate Water; AAIW, Antarctic Intermediate Water; PDW, Pacific Deep Water; UCDW, Upper Circumpolar Deep Water; LCDW, Lower Circumpolar Deep Water.
REE Concentrations
Both LREE (Nd) and HREE (Er) concentrations (Figures 4A,B) generally increase with depth as expected for open ocean waters (Nozaki, 2001). Equatorial station 21-1 has slightly higher Nd and Er concentrations in the uppermost 200 m water depth than stations 53-4 and 2-2 and the difference in concentration is more pronounced below 1,500 m depth. All three stations have their lowest Nd concentrations at ~100 to ~300 m water depth while HREE/LREE ratios (Figure 4C) reach a maximum (up to 8) at intermediate depths (400–1,500 m water depth) at all stations.
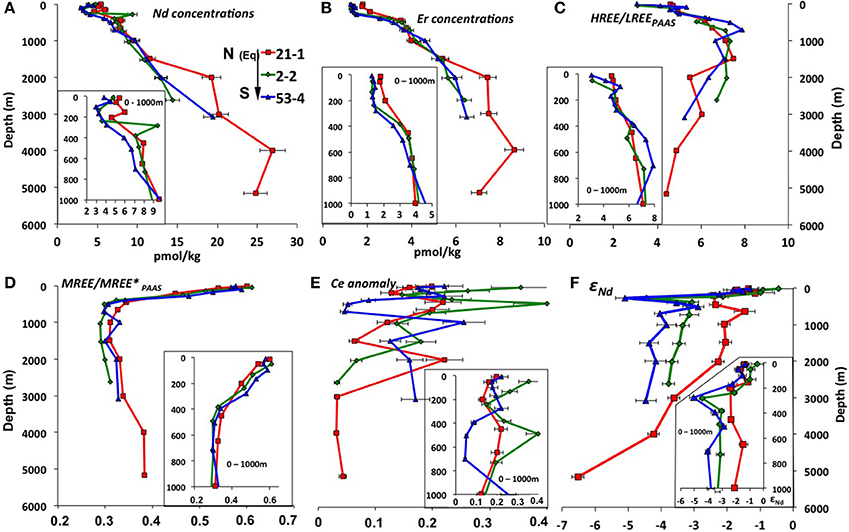
Figure 4. REE concentrations, Nd isotope compositions and other REE relationships plotted against water depth for open ocean stations 21-1 (red), 2-2 (green), and 53-4 (blue), with their relative location indicated on the legend: N, North; Eq, Equator, and S, South. Detail of the first 1,000 m water depth is shown in the bottom of each panel. (A) Nd concentrations (pmol/kg); (B) Er concentrations (pmol/kg); (C) HREE/LREE = [Tm]+[Yb]+[Lu]/[La]+[Pr]+[Nd]; (D) PAAS normalized MREE enrichment [MREE/MREE*PAAS = [2 * (Gd + Tb + Dy)PAAS/(La + Pr+ Nd + Tm + Yb + Lu) PAAS]; Martin et al. (2010)]; (E) PAAS normalized Ce anomalies (Ce/Ce* = 2*[Ce]/[Pr]+[Nd]); (F) Nd isotope compositions. Note that samples 2-2-10m, 2-2-283m, and 21-1-153m are not presented here due to anomalous results (see section REE concentrations). The error bars are the combined 2sigma errors for the elements used (from BATS in Table 3) (in the Ce*/Ce calculations: Ce, Pr and Nd).
All samples of the three stations (except for the anomalous results of samples 2-2-10m, 2-2-283m, and 21-1-153m (Table 1), which will therefore not be further discussed) show typical seawater PAAS normalized patterns (Figures 2D–F) with negative Ce anomalies ranging between 0.03 and 0.34 (Figure 4E) and increasing PAAS normalized HREE enrichments with depth. The shallowest samples (above ~300 m) of all three profiles show the highest MREE enrichments (Figure 4D) of the entire water column, with values [ = [2 * (Gd + Tb + Dy)PAAS/(La + Pr+ Nd + Tm + Yb + Lu) PAAS]; Martin et al. (2010)] ranging from 0.5 to 0.6, whereas intermediate to deep waters show values around 0.3. Near surface samples are also characterized by a depletion of the heaviest REEs Tm, Yb and Lu, resulting in flat or even decreasing PAAS normalized patterns from Er to Lu (Figures 2D–F).
Nd Isotope Compositions
The open ocean seawater εNd signatures at the Manihiki Plateau range from −0.4 ± 0.4 (2σ) to −6.5 ± 0.2 (2σ) (Figure 4F). The most radiogenic values at all three stations are consistently found (between −0.4 and −1.8) in the uppermost ~250 m of the water column. At ~280 m water depth, an excursion to less radiogenic values of −4.4 (±0.2) and −5.1 (±0.3) is observed at southern stations 2-2 and 53-4, respectively, indicating the influence of Antarctic derived Nd isotope compositions, perhaps corresponding to remains of SAMW. In the intermediate depth water column (~650 to ~2,000 m), the three profiles show essentially constant εNd signatures that become progressively more radiogenic from S to N, consistent with the decreasing influence of unradiogenic (around −8, Molina-Kescher et al., 2014) Antarctic derived waters (εNd values ranging from: −4.2 (±0.3) to −3.8 (±0.3) for station 53-4; −3.7 (±0.2) to −3.1 (±0.3) for station 2-2; and −2.3 (±0.2) to −1.5 (±0.3) for station 21-1). The latter value (the most radiogenic apart from the surface samples) corresponds to 649 m depth at equatorial station 21-1, which coincides with the lowest oxygen concentrations measured for all open ocean samples of this study and thus the core of SEqPIW. Stations 2-2 and 53-4 have similar εNd values of ~-4 between ~2,000 m water depth and the bottom of the profiles at 2,627 m and 3,088 m depth, respectively. Equatorial station 21-1 reaches a depth of 5,172 m and displays a progressive decrease in εNd signatures toward the bottom with a minimum value of −6.5 (±0.2) for LCDW. The Nd isotope compositions clearly reflect water mass mixing below 240 m as indicated by the high correlation coefficient (R2 = 0.77) between εNd signatures and oxygen concentrations (Figure S4).
Discussion
Basaltic Influence on Tahitian Coastal Waters
Despite the warm and wet conditions favorable for the chemical weathering of the fresh basaltic minerals, the Tahitian waters have relatively low total dissolved solids due to extremely high precipitation rates (up to 8,000 mm/a), which dilutes the solute concentrations, and short groundwater residence times in the sediments (<50 a) (Hildenbrand et al., 2005) that limit the exposure time of solids to the solutions. For comparison, relative to the size of the river catchment area, the discharge of Tahitian rivers from all parts of the island is similar to that of the biggest rivers on Earth (Table S1).
The large range of REE concentrations found for the Tahitian waters and the fact that there are no significant correlations between REE concentrations or pattern indices with salinity, alkalinity or dissolved silicate (section REE compositions of Tahitian waters, Figure S2) suggests a reversible absorption-desorption based exchange process, likely involving precipitation-dissolution of secondary minerals, where recirculating seawater via SGD (e.g., Duncan and Shaw, 2003) through the basaltic and coral reef sedimentary rocks plays an important role. This is supported by both well-developed negative Ce anomalies (≤0.5) (seawater derived signal) and high Eu anomalies (≥1.5) (basaltic weathering signal) found in many of the samples regardless of their origin (Figures 2A–C). A multitude of systematic variations in the REE patterns and concentrations (Figure 5 and Figure S3) reveals the consistent offset of SGD influenced waters from the other seawater, freshwater and mixture samples. A clear example of this can be seen in the plot of Nd concentrations against Y/Ho where the SGD samples exhibit the most fractionated values (Figure 5). Y and Ho have very similar speciation in seawater so such a strong fractionation is likely to be the result of the preferential removal of Ho by secondary precipitates such as Fe-Mn oxides (Bau et al., 1997). Y/Ho fractionation during carbonate mineral precipitation is also well documented (e.g., Tanaka et al., 2008) and the high Y/Ho ratios of the SGD may also reflect secondary precipitation within the reef carbonate rocks. Given the affinity of REEs for carbonate complexes in seawater (e.g., Cantrell and Byrne, 1987; Schijf et al., 2015) it should be expected that reef carbonate rocks surrounding the tropical basaltic islands play an important role in SGD recirculation process. This is the case for the Faaromai river mouth, which exhibits the highest Nd concentrations that decrease exponentially with increasing salinity (t197 < t196 < t195). This river is located on the northern coast of Tahiti where an edifice collapse caused two giant landslides (Hildenbrand et al., 2006), which most likely occurred around 870 ka, and coral reefs have not yet grown back. Extrapolation to seawater salinity of 36.2 using the exponential fit (Figure 6) gives a Nd concentration of 89 pmol/kg, which is the largest flux of REEs from the studied rivers. In contrast, the two other salinity gradients sampled at river mouths exhibit a more typical estuarine REE behavior with removal during initial mixing and subsequent release as salinity increases (e.g., Elderfield, 1988; Sholkovitz, 1995) producing concentrations around 40–50 pmol/kg in the saltiest samples.
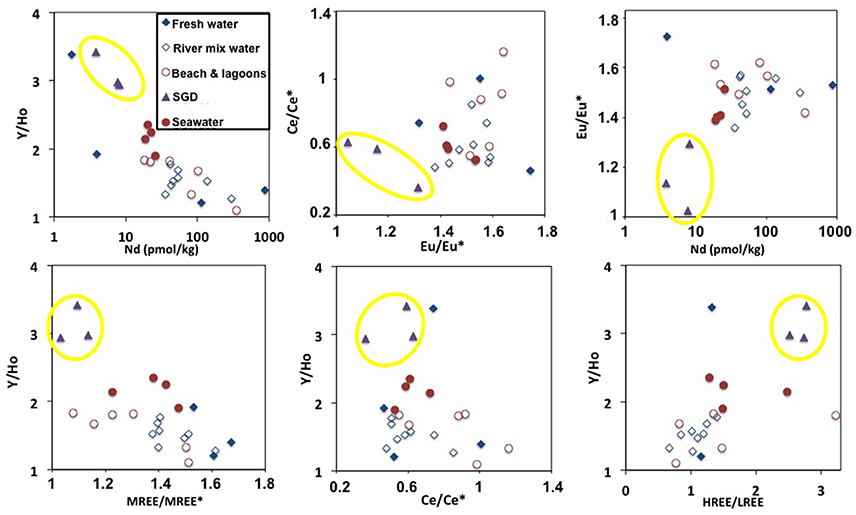
Figure 5. Selection of the most representative Tahitian “REE space plots” that combine different REE indices in order to find systematic variations of submarine groundwater discharge (SGD) samples (indicated by yellow circles) with respect to other environments (see legend). Definition of REE indices is provided in Figure S3.
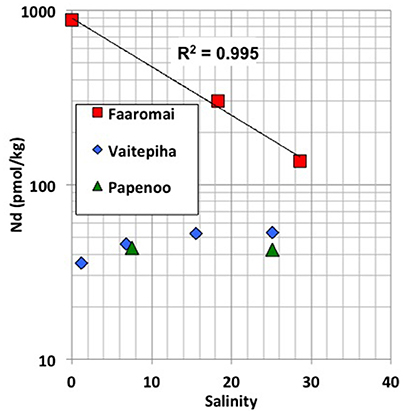
Figure 6. Salinity vs. Nd concentrations (in logarithmic scale) for the three rivers studied on Tahiti (see Legend). R2 coefficient shown for the Faaromai river.
The highly variable REE concentrations of freshwater and SGD observed on Tahiti make the selection of an endmember value for traditional flux calculations (e.g., Kim and Kim, 2011) beyond the feasibility of such spatially and temporally coarse sampling. What is remarkably consistent in the Tahitian data are the REE concentrations of the high salinity (~36) water samples (Table 1), from both lagoon and beyond the reef break “open ocean” settings (Figure 1). With an average Nd concentration of 21.8 ± 3.1 pmol/kg (1 SD), Tahitian coastal waters have Nd concentrations at least 4 times that of South Pacific surface waters (<5 pmol/kg, Amakawa et al. (2013); Jeandel et al. (2013); this study). The MREE enrichment and Eu/Eu* found in these Tahitian coastal seawaters, both 1.4 ± 0.1 (1 SD), is clearly derived from the basaltic rocks present on the island (Figures 2C, 7), with a very similar REE pattern like those found on other central Pacific islands [see compilation by Grenier et al. (2013) in their Figure 12] and in groundwaters from the basaltic islands of Jeju (Korea) (Kim and Kim, 2011) and Hawai'i (Johannesson et al., 2017) (Figure 7), thus suggesting a typical REE signal for land-sourced waters supplied from Pacific volcanic islands. Estuarine REE patterns from Papua-New Guinea (Sepik and Fly rivers), although showing common characteristics (such as the Eu peak) to the basaltic island PAAS normalized distributions described above, also present some differences resembling the brackish Amazon estuarine water samples (Figure 7; Rousseau et al., 2015). This suggests that the presence of suspended particulate matter carried by relatively larger rivers (such as these found in Papua-New Guinea) exerts a considerable influence on the coastal seawater REE patterns which differ from those of small islands that lack high volumes of channeled water, like Tahiti, Jeju, or Hawaii. Johannesson et al. (2017) suggested the aridity of the Kona area (in the rain shadow of both Mauna Loa and Mauna Kea) may play a role in the lack of modification of SGD REEs upon mixing with seawater.
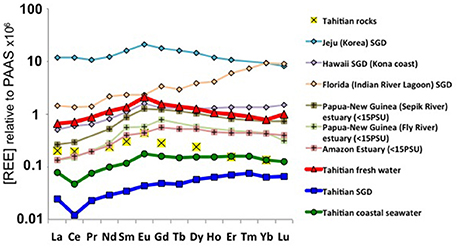
Figure 7. Averages of PAAS normalized water samples obtained on the land-ocean interphase from Tahiti (this study), Jeju Island (Korea) (Kim and Kim, 2011), Hawaii (Johannesson et al., 2017), Sepik and Fly river estuaries (Papua New Guinea) (Sholkovitz and Szymczak, 2000), Florida (Johannesson et al., 2011) and the Amazon estuary (Rousseau et al., 2015).
The similar PAAS normalized pattern observed between Tahiti, Jeju, and Hawaii (Figure 7) clearly indicates a common signature of basaltic rock REE sources in the Pacific Ocean.
Imprint of Volcanic Islands on Surface and Subsurface Waters (0–300 m Water Depth, <26 σθ) of the Open Central Pacific
Similar to other locations such as offshore Hawaii (Fröllje et al., 2016), the markedly radiogenic εNd signatures of shallow Pacific waters strongly suggest the influence of basaltic island weathering (Figure 8). This observation is consistent with previous studies (e.g., Sholkovitz et al., 1999; Lacan and Jeandel, 2001; Amakawa et al., 2004; Hongo et al., 2006; Allègre et al., 2010; Fröllje et al., 2016), which proposed island weathering as a prominent source of REE to the surface ocean, in particular taking into account the high solubility of basaltic rocks in weathering solutions and seawater (Pearce et al., 2013). However, about 2,000 km downstream from Tahiti, Manihiki surface waters have evolved different REE patterns compared to Tahitian coastal waters (Figure 9). Despite transiting the South Pacific gyre, presumably one of the most particle poor regions of the oceans, REE concentrations decrease (e.g., Nd 4-fold), Ce anomalies strengthen, and Eu anomalies disappear. Interestingly, Y/Ho ratios remain elevated and perhaps even strengthen slightly between Tahiti and Manihiki, producing values similar to those found in surface waters of the SW Pacific (Zhang and Nozaki, 1996). Unfortunately, most studies, including recent works (e.g., Grenier et al., 2013; Jeandel et al., 2013; Fröllje et al., 2016; Johannesson et al., 2017), don't include Y data, therefore limiting the extent of this comparison. However, given the results here and the fact that Y/Ho fractionation most likely requires interaction with particles (e.g., Bau et al., 1997), future studies should include Y in their measurement routines. A volcanic island imprint on the open ocean surface waters cannot be unambiguously attributed but remains the most likely explanation for the radiogenic Nd isotope signatures observed. Hopefully, Nd isotope compositions of Tahitian waters will be obtained in the frame of future investigations but these will likely be very radiogenic, similar to the groundwater and surface water data from Oahu Island (Fröllje et al., 2016), clarifying the impact of basaltic island weathering on the tropical South Pacific Nd budget. To make a first order calculation of the potential Tahitian REE flux to seawater, we have chosen to assume that the consistently measured coastal seawater Nd concentrations of ~20 pmol/kg are found only in the upper layers and close to the coastline. Future work should test this assumption with transects perpendicular to the shoreline sampling the entire water column and measurements of current velocities near the coast. With such conservative assumptions in mind, water transport in the South Equatorial Current south of 9°S (between 150° and 160°W) around 13.4*106 m3/s and a mean speed (ú) of 4.9 cm/s (4234 m/d) near Tahiti (Wyrtki and Kilonsky, 1984) and a general 15 pmol/kg Nd enrichment around the entire 193 km of the Tahitian coast with respect to superficial open ocean values (<5 pmol/kg, Amakawa et al. (2013); Jeandel et al. (2013); this study), requires a Nd flux of between 126 and 0.016 mol/d depending on the area used for the transport calculation (Table 4). The largest flux estimate is remarkably similar to the estimated SGD Nd flux of 120 ± 60 mol/d from the similar sized Jeju island (Kim and Kim, 2011) but this is unlikely as it would require all waters transiting the Tahitian coastline to have open ocean Nd concentrations, a scenario which is unrealistic as waters moving along the coast would likely already have elevated Nd concentrations. The smaller estimates are similar in size to estimates of the SGD Nd flux from the Kona coast (Tahiti is approximately 1/10 the size of Hawai'i). In order to tentatively assess the effect of volcanic islands such as Tahiti in the global REE budget, we take our conservative estimates from an island of 1,045 km2 and extrapolate that using the global “island volcanic rock surface area” of 2.02 x 10⁶ km2 estimated by Allègre et al. (2010) to obtain estimates ranging from 1.1 × 10⁴ mol Nd year−1 to 8.87 × 10⁷ mol Nd year−1 (Table 4). A second way to estimate the flux is to ignore the large variability in freshwater and SGD Nd concentrations measured on Tahiti, and follow the approach of Allègre et al. (2010) for Sr, use the averaged rainfall minus evapotranspiration on the total cumulative surface area of volcanic islands globally with an average Tahitian freshwater Nd concentration (249 pmol/kg) to obtain a flux of 3.17 × 10⁵ mol Nd year−1 (assuming 70% removal on mixing with seawater; e.g., Rousseau et al., 2015). These first order extrapolations produce a global Nd flux from volcanic island weathering that is probably at least two orders of magnitude lower than the global sediment pore water flux estimated to be >18 × 106 mol Nd year−1 (Abbott et al., 2015). However, that estimate is also extrapolated from a single location where a reactive radiogenic phase (possibly basalt minerals) enhance fluxes (Abbott et al., 2016). If the basaltic island SGD fluxes from Jeju island are more representative, basaltic island weathering could easily fulfill the model budget requirements for the missing Nd source to the ocean (Tachikawa et al., 2003; Arsouze et al., 2009). Knowing which basaltic island fluxes are most representative will require many more studies from other basaltic islands but we have identified factors such as groundwater residence time, the presence of coral reefs or carbonate sediments and landslides spreading more of the volcanic material into contact with seawater, that should all be studied further. Although surface water REE distributions can be clearly altered by volcanic islands there may also potentially be an influence on intermediate depth water masses.
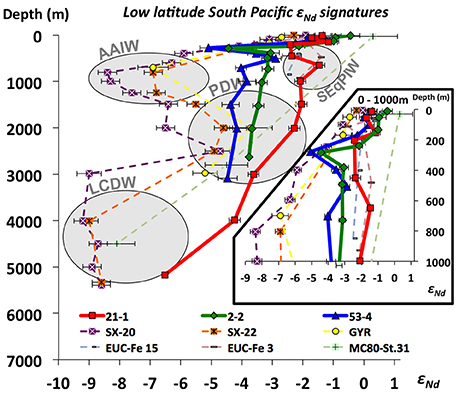
Figure 8. Nd isotope compositions of open ocean waters of the tropical to subtropical central South Pacific (Eq. to ~30°S) compiled from different studies: SX-20 and SX-22 (Amakawa et al., 2013); GYR (Jeandel et al., 2013); EUC-Fe 15 and EUC-Fe 3 (Grenier et al., 2013); MC80-St.31 (Piepgras and Jacobsen, 1988); 21-1, 2-2, and 53-4 (this study). See locations on Figure 1. Gray circles indicate the dominant water masses in each depth according to dissolved Nd isotope compositions. Water mas AAIW, Antarctic intermediate Water; SEqPIW, South Equatorial Pacific Intermediate Water; PDW, Pacific Deep Water; LCDW, Lower Circumpolar Deep Water.
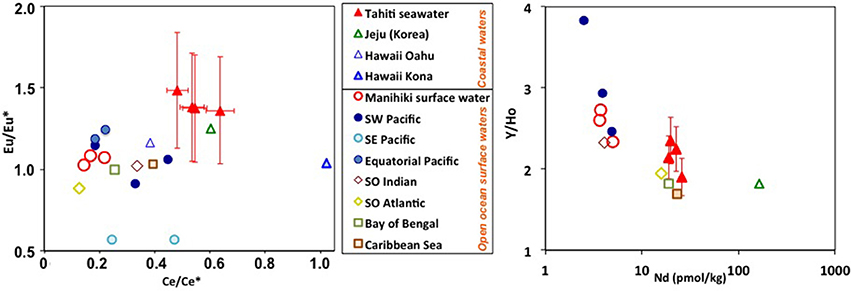
Figure 9. Comparison of different REE indices (see axes) between coastal waters from Pacific islands (Tahiti, Jeju, and Hawaii) and open ocean surface waters from the Pacific and other ocean basins. The error bars are the combined 2sigma errors for the elements used (from BATS in Table 3) (in the Eu*/Eu calculations: Sm, Eu, and Tb). Open ocean data corresponds to averages from the top 50 m water depth, except for the Atlantic Southern Ocean (top 100 m). Data from this study (Tahiti and Manihiki); (Kim and Kim, 2011) (Jeju, Korea); (Fröllje et al., 2016) (Oahu, Hawaii); (Johannesson et al., 2017) (Kona, Hawaii); (Zhang and Nozaki, 1996) (stations SA-5, SA-7, and SA-12, SW Pacific); (Grenier et al., 2013) (stations Fe1+Fe2+Fe3 and Fe13+Fe14+Fe15, Equatorial Pacific); (Nozaki and Alibo, 2003b) (stations PA-9-Bay of Bengal); (Nozaki and Alibo, 2003a) (station PA-4, Indian Southern Ocean); (Hathorne et al., 2015) (all stations, Atlantic Southern Ocean); and (Osborne et al., 2015) (all stations, Caribbean Sea).
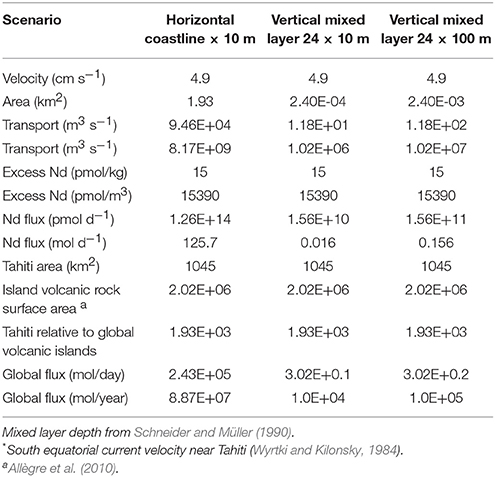
Table 4. Tahitian Nd flux estimates and global extrapolation.
Mixing of Southern Ocean Derived Water Masses Along the Southern Pacific
On AAIW's pathway from its source region in the SE Pacific sector of the Southern Ocean until it loses its geochemical identity in the volcanic WPWP region (Lacan and Jeandel, 2001; Grenier et al., 2013, 2014), AAIW characteristics are modified by mixing with other water masses, and by potential input/exchange from basaltic islands of the South Pacific. At the Manihiki Plateau, AAIW corresponds to a potential density of around 27 σθ between ~400 and ~1,300 m (see section “General Hydrography”), and is considerably diluted as observed in Figure 3 and Figure S1, displaying εNd signatures ranging between −3.1 and −4.0, similar to deeper PDW (Figure 4F). This indicates that the original Nd isotope composition of AAIW (−8 to −9 εNd, Molina-Kescher et al., 2014) vanishes in this area, which is evident when compared to other stations south of our studied stations (Figure 8). Particularly remarkable is the comparison of stations 53-4 and SX-22 (Figure 8), which are located close to each other (see locations on Figure 1 and Figure S1) but present a marked offset of about 3 epsilon units in the depth range of AAIW. This change corresponds to the progressive mixing of AAIW and SEqPIW in this area (Figure 3 and Figure S1; Bostock et al., 2010), which is most evident in [O2] (Figure 10). Purer SEqPIW sampled at equatorial station 21-1 (649 m water depth) is even more radiogenic at εNd value of −1.5 (Figure 8), which is accompanied by an oxygen minimum of 1.5 ml/l, with both, εNd and [O2] changing toward more negative εNd and higher [O2] values above and below that depth. Plotting the Manihiki intermediate waters on the AAIW – SEqPIW mixing array (Figure 10) clearly reveals an offset toward more radiogenic signatures suggesting an additional Nd input/exchange along route which may derive from volcanic Society, Tuamotu and Tubuai Islands (including Tahiti). This observation supports the suggestions of Amakawa et al. (2013), who estimated a large Nd supply from these islands to AAIW of 2.08 ± 1.53 × 10⁵ mol Nd year−1, within error of the estimate provided in section “Imprint of volcanic islands on surface and subsurface waters (0–300 m water depth, <26σθ) of the open central Pacific.”
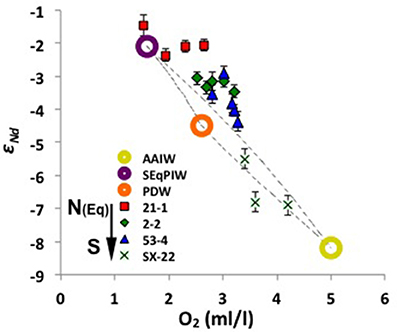
Figure 10. Mixing arrays of oxygen concentrations vs. Nd isotope compositions between pure compositions of the most prominent intermediate to mid-depth water masses of the central S Pacific (circles, see legend). Presented are also samples above the Manihiki Plateau between ~400 and ~1,500 m water depth (red squares, green diamonds, and blue triangles), which show increasing influence of SEqPIW toward the north (see legend) whereas SX-22 samples (~800 to ~1,500 m water depth) (crosses) (Amakawa et al., 2013; Amakawa, personal communication) fall in the mixing array of PDW and AAIW. See exact locations on Figure 1 and Figure S1. The values of the endmembers are from: sample EUC-Fe3-928m (Grenier et al., 2013) for SEqPIW; sample MC80-St.31-2800m (Piepgras and Jacobsen, 1988) for PDW; and averaged value of samples between 350 and 800 m water depth from stations 9, 22, 50, and 54 (Molina-Kescher et al., 2014) for AAIW. Water mas: AAIW, Antarctic intermediate Water; SEqPIW, South Equatorial Pacific Intermediate Water; PDW, Pacific Deep Water.
In order to determine changes in the REE composition of AAIW we normalized the available REE data along its pathway to averaged REE concentrations in the formation region and depth of this water mass. This is shown in Figure 11, which includes averaged data in the depth range (370–~1,000 m) of AAIW from the EGY and GYR stations (unfiltered samples) in the SE Pacific near the formation region of AAIW (Jeandel et al., 2013); stations 53-4 and 2-2 (this study) located downstream of the first encounter of AAIW with volcanic islands; and FLUSEC 22 in the WPWP (Grenier et al., 2013). Station 21-1 (this study) is also shown in order to evaluate differences with respect to SEqPIW, which dominates the intermediate water at this location. In general, all samples have lower LREE concentrations compared with original AAIW, which is expected as the more readily scavenged LREEs are preferentially removed from the water column as the water masses age (e.g., Osborne et al., 2017). The fact that the source AAIW normalized REEs are < 1, especially for the LREEs, clearly indicates the importance of removal by particles during transit through the gyre, despite relatively low productivity. Station GYR shows a LREE pattern more similar to Manihiki stations than the much more proximally located EGY station (Figure 1). However, the GYR station is located in ocean current downstream (only ~500 km to the East) of another volcanic island, Easter Island (Rapa Nui) including three inactive volcanoes. Given the similarity between REE patterns of basaltic islands separated by such large distances in the Pacific (section “Basaltic influence on Tahitian coastal waters”), the similar REE signals of the GYR and Manihki stations posisibly originate from volcanic REE inputs into intermediate waters. Nevertheless, the interpretation of the GYR and EGY data needs to be considered with caution given that these samples were not filtered prior to analysis, which potentially explains the apparent HREE enrichment with respect to original AAIW observed at these stations. SEqPIW (station 21-1) reflects characteristics similar to neighboring stations 2-2 and 53-4, indicating similar geochemical characteristics of SEqPIW and AAIW in terms of REE concentrations.
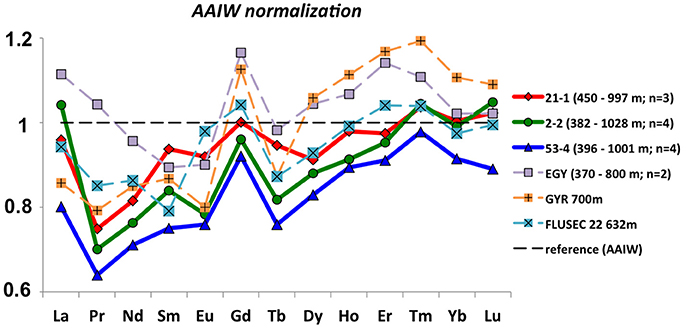
Figure 11. Averages of open ocean seawater samples from this and other studies (dashed lines) normalized to AAIW. The reference REE compositions were obtained from the formation region of AAIW in the Southeast Pacific (see Figure 1), using the averaged value of samples between 350 and 800 m water depth from stations 9, 22, 50, and 54 (Molina-Kescher et al., 2014). The data presented in these figures is located on the pathways (see Figure 1) and water depths (350–1,000 m) of AAIW, and correspond to: Jeandel et al. (2013) (GYR and EGY), Grenier et al. (2013) (FLUSEC 22), and stations 21-1, 2-2, and 53-4 from this study.
Conclusions
The large range of REE concentrations found for the Tahitian freshwaters analyzed suggests that a dynamic absorption-desorption process, likely involving precipitation-dissolution of secondary minerals, controls the release of REEs to freshwaters and the lack of correlations between the variation of REE concentrations or pattern indices with salinity, alkalinity or dissolved silicate in the brackish Tahitian samples suggests a variable mixture between freshwaters and seawater caused by SGD. The PAAS normalized REE pattern of Tahitian coastal waters is characterized by a MREE enrichment with an Eu peak, which is almost identical to that observed in groundwater and coastal waters of other volcanic islands of the Pacific, such as Jeju (Korea) (Kim and Kim, 2011) and Hawaii (Fröllje et al., 2016; Johannesson et al., 2017). These patterns are also in accordance with the REE compositions of Tahitian rocks (Cordier et al., 2005) and central Pacific sediments and rocks (Grenier et al., 2013), providing strong evidence for the important role of weathered volcanic island basalts in the Pacific REE budget, although with the currently available data estimates of the volcanic island REE flux range over 4 orders of magnitude. However, these basaltic weathering REE characteristics (with the possible exception of elevated Y/Ho ratios) are lost in surface and subsurface water masses such as SPEW, which exhibit highly radiogenic Nd isotope compositions in the area of the Manihiki Plateau. At intermediate water depths, AAIW loses its characteristic unradiogenic signature (−6 to−9) in the area of the Manihiki plateau, where it mixes with oxygen depleted SEqPIW, which show more radiogenic signatures (εNd = −1.5). An offset of the observed data from the mixing array of AAIW and SEqPIW to more radiogenic Nd isotope compositions documents an additional Nd input/exchange along AAIW's pathway, presumably originating from volcanic particles of the Society, Tuamotu and Tubuai Islands (including Tahiti), thus suggesting the Nd isotope composition of AAIW may be elevated by volcanic islands in this region of the Pacific Ocean.
Author Contributions
EH and MK collected the Tahiti samples; AO and MB conducted the shipboard sampling; EH, AO, and MB carried out the sample preparation and analyses; MF and KP supervised the project. EH and MM-K developed the theoretical framework. MM-K wrote the manuscript and designed the figures with subsequent contributions from all co-authors.
Conflict of Interest Statement
The authors declare that the research was conducted in the absence of any commercial or financial relationships that could be construed as a potential conflict of interest.
Acknowledgments
The RV Sonne Cruise SO225 was funded by the German Ministry of Education and Research (BMBF, Bundesministerium für Bildung und Forschung) as part of Manihiki II (03G0225B), a joint project of the GEOMAR Helmholtz Centre for Ocean Research Kiel and the Alfred Wegener Institute Helmholtz Centre for Polar and Marine Research (AWI). AO was funded by DFG grants FR1198/8-1 and OS499/2-1; MK and KP were funded by DFG grant PA2411/1-1. We thank Jan Hoffmann for collecting and measuring Tahitian samples of the 2009 campaign. We appreciate the editorial handling by Prof. Sunil Singh and the constructive comments of Dr. Hiroshi Amakawa and Dr. Vineet Goswami that improved the quality of the manuscript.
Supplementary Material
The Supplementary Material for this article can be found online at: https://www.frontiersin.org/articles/10.3389/fmars.2018.00050/full#supplementary-material
Figure S1. (a) Oxygen concentrations (ml/l) and salinity at 50 m water depth for the South Pacific. HSEA stands for High Surface Evaporation Area, characterized by high salinities and high oxygen concentrations, which is the formation region of South Pacific Equatorial Water (SPEW), a subsurface water mass that flows west toward the Western Equatorial Pacific. (b) Oxygen concentrations (ml/l) and salinity at 1,000 m water depth of the South Pacific, corresponding to the domains of Antarctic Intermediate Water (AAIW), characterized by high oxygen and low salinity contents; South Equatorial Pacific Intermediate Water (SEqPIW), characterized by intermediate oxygen and high salinity contents; and North Equatorial Pacific Intermediate Water (NEqPIW), characterized by low oxygen and high salinity contents.
Figure S2. Cross-plots of Nd concentration, Cerium anomaly (Ce/Ce* = 2*[Ce]/[La]+[Pr]), Europium anomaly (Eu/Eu* = 3*[Eu]/2*[Sm]+[Tb]), heavy vs. light REE enrichment (HREE/LREE = ([Tm]+[Yb]+[Lu]) PAAS /([La]+[Pr]+[Nd]) PAAS) and middle REE enrichment ( = [2 * (Gd + Tb + Dy)PAAS/(La + Pr+ Nd + Tm + Yb + Lu) PAAS]; Martin et al. (2010)) vs. salinity, dissolved silicon and alkalinity with R2 correlations. PAAS normalized REE data was used.
Figure S3. “REE space plots” for Tahitian samples show all possible paired combinations of different REE indices in order to find systematic variations of samples from different environments (see legend). A selection of the most representative ones is provided in Figure 6. REE indices are as follows: heavy vs. light REE enrichment (HREE/LREE PAAS = ([Tm]+[Yb]+[Lu]) PAAS /([La]+[Pr]+[Nd]) PAAS); middle REE enrichment ( = [2 * (Gd + Tb + Dy)PAAS/(La + Pr+ Nd + Tm + Yb + Lu) PAAS]; Martin et al. (2010)); Cerium anomaly (Ce/Ce* PAAS = 2*[Ce]/[La]+[Pr]); Europium anomaly (Eu/Eu* PAAS = 3*[Eu]/2*[Sm]+[Tb]); Erbium vs. lutetium (Er/Lu PAAS); Yttrium vs. holmium (Y/Ho PAAS) and neodymium (Nd) concentrations expressed in pmol/kg.
Figure S4. Oxygen concentrations (ml/l) vs. Nd isotope compositions (εNd) for the open ocean samples of this study (see legend). Data with yellow rim correspond to samples in the top 240 m of the water column, which were not used for the calculation of the R2 correlation presented in the figure. Nd isotope compositions below 240 m water depth present a clear correlation with oxygen concentrations, indicating a clear conservative behavior of Nd isotope compositions in terms of water mass mixing in the intermediate to deep water column.
Table S1. Nine of the most voluminous rivers on Earth compared to the three largest rivers on Tahiti (Laffourge, 1993; Gupta, 2007).
References
Abbott, A. N., Haley, B. A., and McManus, J. (2016). The impact of sedimentary coatings on the diagenetic Nd flux. Earth Planet. Sci. Lett. 449, 217–272. doi: 10.1016/j.epsl.2016.06.001
Abbott, A. N., Haley, B. A., McManus, J., and Reimers, C. E. (2015). The sedimentary flux of dissolved rare earth elements to the ocean. Geochim. Cosmochim. Acta, 154, 186–200. doi: 10.1016/j.gca.2015.01.010
Allègre, C. J., Louvat, P., Gaillardet, J., Meynadier, L., Rad, S., and Capmas, F. (2010). The fundamental role of island arc weathering in the oceanic Sr budget. Earth Planet. Sci. Lett. 292, 51–56. doi: 10.1016/j.epsl.2010.01.019
Amakawa, H., Nozaki, Y., Alibo, D. S., Zhang, J., Fukukawa, K., and Nagai, H. (2004). Neodymium isotopic variations in Northwest Pacific waters. Geochim. Cosmochim. Acta, 68, 715–727. doi: 10.1016/S0016-7037(03)00501-5
Amakawa, H., Tazoe, H., Obata, H., Gamo, T., Sano, Y., and Chuan-Chou, S. (2013). Neodymium isotopic composition and concentration in the Southwest Pacific Ocean. Geochem. J. 47, 409–422. doi: 10.2343/geochemj.2.0260
Aries, S., Valladon, M., Plové, M., and Dupr,é, B. (2000). A routine method for oxide and hydroxide interference correcxtions in ICP-MS chemical analysis of environmental and geological samples. Geostandards Newslett.24, 19–31. doi: 10.1111/j.1751-908X.2000.tb00583.x
Arsouze, T., Dutay, J. C., Lacan, F., and Jeandel, C. (2009). Reconstructing the Nd oceanic cycle using a coupled dynamical–biogeochemical model. Biogeosciences 6, 2829–2846. doi: 10.5194/bg-6-2829-2009
Basak, C., Pahnke, K., Frank, M., Lamy, F., and Gersonde, R. (2015). Neodymium isotopic characterization of Ross Sea Bottom Water and its advection through the southern South Pacific. Earth Planet. Sci. Lett. 419, 211–221. doi: 10.1016/j.epsl.2015.03.011
Bau, M., and Dulski, P. (1996). Anthropogenic origin of positive gadolinium anomalies in river waters. Earth Planet. Sci. Lett. 143, 245–255. doi: 10.1016/0012-821X(96)00127-6
Bau, M., Möller, P., and Dulski, P. (1997). Yttrium and lanthanides in eastern Mediterranean seawater and their fractionation during redox-cycling. Mar. Chem. 56, 123–131. doi: 10.1016/S0304-4203(96)00091-6
Behrens, M. K., Pahnke, K., Schnetger, B., and Brumsack, H.-J. (2018). Sources and processes affecting the distribution of dissolved Nd isotopes and concentrations in the West Pacific. Geochim. Cosmochim. Acta 222, 508–534. doi: 10.1016/j.gca.2017.11.008
Bertram, C. J., and Elderfield, H. (1993). The geochemical balance of the rare earth elements and Nd isotopes in the oceans, Geochim. Cosmochim. Acta, 57, 1957–1986. doi: 10.1016/0016-7037(93)90087-D
Bostock, H. C., Opdyke, B. N., and Williams, M. J. M. (2010). Characterising the intermediate depth waters of the Pacific Ocean using 13C and other geochemical tracers. Deep Sea Res. I 57, 847–859. doi: 10.1016/j.dsr.2010.04.005
Burnett, W. C., Bokuniewicz, H., Huettel, M., Moore, W. S., and Taniguchi, M. (2003). Groundwater and pore water inputs to the coastal zone, Biogeochemistry 66, 3–33. doi: 10.1023/B:BIOG.0000006066.21240.53
Byrne, R. H., and Kim, K.-H. (1990). Rare earth element scavenging in seawater. Geochim. Cosmochim. Acta 54, 2645–2656.
Byrne, R. H., and Sholkovitz, E. R. (1996). “Marine chemistry and geochemistry of the lanthanides,” in Handbook on the Physics and Chemistry of Rare Earths, Vol. 23, eds. K. A. Gschneidner Jr and L. Eyring (North Holland: Elsevier), 498–593.
Callahan, J. E. (1972). The structure and circulation of deep water in the Antarctic. Deep Sea Res. 19, 563–575.
Cantrell, K. J., and Byrne, R. H. (1987). Rare earth element complexation by carbonate and oxalate ions. Geochim. Cosmochim. Acta 51, 597–605. doi: 10.1016/0016-7037(87)90072-X
Chen, T.-Y., Rempfer, J., Frank, M., Stumpf, R., and Molina-Kescher, M. (2013). Upper ocean vertical supply: a neglected primary factor controlling the distribution of neodymium concentrations of open ocean surface waters? J. Geophys. Res. Oceans 118, 3887–3894. doi: 10.1002/jgrc.20288
Cordier, C., Clément, J.-P., Caroff, M., Hémond, C., Blais, S., Cotton, J., et al. (2005). Petrogenesis of Coarse-grained Intrusives from Tahiti Nui and Raiatea (Society Islands, French Polynesia). J. Petrol. 46, 2281–2312. doi: 10.1093/petrology/egi055
Du, J., Haley, B. A., and Mix, A. C. (2016). Neodymium isotopes in authigenic phases, bottom waters and detrital sediments in the Gulf of Alaska and their implications for paleo-circulation reconstruction. Geochim. Cosmochim. Acta 193, 14–35. doi: 10.1016/j.gca.2016.08.005
Duncan, T., and Shaw, T. (2003). The mobility of rare earth elements and redox sensitive elements in the groundwater/seawater mixing zone of a shallow coastal aquifer. Aquat. Geochem. 9, 233–255 doi: 10.1023/B:AQUA.0000022956.20338.26
Elderfield, H. (1988). The oceanic chemistry of the rare-earth elements. Philos. Trans. Roy. Soc. Lond. A 325, 105–126. doi: 10.1098/rsta.1988.0046
Elderfield, H., and Sholkovitz, E. R. (1987). Rare earth elements in the pore waters of reducing nearshore sediments. Earth Planet. Sci. Lett. 82, 280–288
Frank, M. (2002). Radiogenic isotopes: tracers of past ocean circulation and erosional input. Rev. Geophys. 40:1001, doi: 10.1029/2000RG000094
Fröllje, H., Pahnke, K., Schnetger, B., Brumsack, H.-J., Dulai, H., and Fitzsimmons, J. N. (2016). Hawaiian imprint on dissolved Nd and Ra isotopes and rare earth elements in the central North Pacific: local survey and seasonal variability. Geochim. Cosmochim. Acta 189, 110–131. doi: 10.1016/j.gca.2016.06.001
Goldstein, S. J., and Jacobsen, S. B. (1987). The Nd and Sr isotopic systematics of river-water dissolved material: implications for the sources and Nd and Sr in seawater. Chem. Geol. 66, 245–272.
Goldstein, S. L., and Hemming, S. R. (2003). “Long-lived isotopic tracers in oceanography, paleoceanography and ice sheet dynamics,” in The Oceans and Marine Geochemistry, ed H. Elderfield (Oxford: Elsevier-Pergamon), 453–489.
Grasse, P., Bosse, L., Hathorne, E. C., Böning, P., Pahnke, K., and Frank, M. (2017). Short-term variability of dissolved rare earth elements and neodymium isotopes in the entire water column of the Panama Basin. Earth Planet. Sci. Lett. 475, 242–253. doi: 10.1016/j.epsl.2017.07.022
Grasse, P., Stichel, T., Stumpf, R., Stramma, L., and Frank, M. (2012). The distribution of neodymium isotopes and concentrations in the Eastern Equatorial Pacific: water mass advection versus particle exchange. Earth Planet. Sci. Lett. 353–354, 198–207. doi: 10.1016/j.epsl.2012.07.044
Grenier, M., Jeandel, C., and Cravatte, S. (2014). From the subtropics to the equator in the Southwest Pacific: continental material fluxes quantified using neodymium data along modelled thermocline water pathways. J. Geophys. Res. Oceans 119, 3948–3966. doi: 10.1002/2013JC009670
Grenier, M., Jeandel, C., Lacan, F., Vance, D., Venchiarutti, C., Cros, A., et al. (2013). From the subtropics to the central equatorial Pacific Ocean: neodymium isotopic composition and rare earth element concentration variations. J. Geophys. Res, Oceans 118, 592–618. doi: 10.1029/2012JC008239
Hannigan, R. E., and Sholkovitz, E. R. (2001). The development of middle rare earth element enrichments in freshwaters: weathering of phosphate minerals. Chem. Geol. 175, 495–508. doi: 10.1016/S0009-2541(00)00355-7
Hartin, C. A. A., Fine, R., Sloyan, B. M., Talley, L. D., Chereskin, T. K., and Happell, J. (2011). Formation rates of Subantarctic mode water and Antarctic intermediate water within the South Pacific. Deep Sea Res. I 58, 524–534. doi: 10.1016/j.dsr.2011.02.010
Hathorne, E. C., Haley, B., Stichel, T., Grasse, P., Zieringer, M., and Frank, M. (2012). Online preconcentration ICP-MS analysis of rare earth elements in seawater. Geochem. Geophys. Geosy. 13:Q01020. doi: 10.1029/2011GC003907
Hathorne, E. C., Stichel, T., Brück, B., and Frank, M. (2015). Rare earth element distribution in the Atlantic sector of the Southern Ocean: the balance between particle scavenging and vertical supply. Marine Chem. 177, 157–171. doi: 10.1016/j.marchem.2015.03.011
Hildenbrand, A., Gillot, P.-Y., and Bonneville, A. (2006). Offshore evidence for a huge landslide of the northern flank of Tahiti-Nui (French Polynesia). Geochem. Geophys. Geosys. 7:Q03006. doi: 10.1029/2005GC001003
Hildenbrand, A., Marlin, C., Conroy, A., Gillot, P.-Y., Filly, A., and Massault, M. (2005). Isotopic approach of rainfall and groundwater circulation in the volcanic structure of Tahiti-Nui (French Polynesia). J. Hydrol. 302, 87–208. doi: 10.1016/j.jhydrol.2004.07.006
Hongo, Y., Obata, H., Alibo, D. S., and Nozaki, Y. (2006). Spatial variations of rare earth elements in North Pacific surface water. J. Oceanogr. 62, 441–455. doi: 10.1007/s10872-006-0067-1
Howe, J. N. W., Piotrowski, A. M., Noble, T. L., Mulitza, S., Chiessi, C. M., and Bayon, G. (2016). North Atlantic Deep Water Production during the Last Glacial Maximum. Nat. Communic. 7:11765. doi: 10.1038/ncomms11765
Hu, D., Wu, L., Cai, W., Gupta, A. S., Ganachaud, A., Qiu, B., et al. (2015). Pacific western boundary currents and their roles in climate. Nature 522, 299–308. doi: 10.1038/nature14504
Hu, R., Noble, T. L., Piotrowski, A. M., McCave, I. N., Bostock, H. C., and Neil, H. L. (2016). Neodymium isotopic evidence for linked changes in Southeast Atlantic and Southwest Pacific circulation over the last 200 kyr. Earth Planet. Sci. Lett. 455, 106–114. doi: 10.1016/j.epsl.2016.09.027
Jacobsen, S. B., and Wasserburg, G. J. (1980). Sm-Nd isotopic composition of chondrites. Earth Planet. Sci. Lett. 50, 139–155.
Jeandel, C., and Oelkers, E. H. (2015). The influence of terrigenous particulate material dissolution on ocean chemistry and global element cycles. Chem. Geol. 395, 50–66. doi: 10.1016/j.chemgeo.2014.12.001
Jeandel, C., Delattre, H., Grenier, M., Pradoux, C., and Lacan, F. (2013). Rare earth element concentrations and Nd isotopes in the Southeast Pacific Ocean. Geochem. Geophys. Geosyst. 14, 328–341. doi: 10.1029/2012GC004309
Jeandel, C., Thouron, D., and Fieux, M. (1998). Concentrations and isotopic compositions of neodymium in the eastern Indian Ocean and Indonesian straits. Geochim. Cosmochim. Acta 62, 2597–2607.
Johannesson, K. H., and Burdige, D. J. (2007). Balancing the global oceanic neodymium budget: evaluating the role of groundwater. Earth Planet. Sci. Lett. 253, 129–142. doi: 10.1016/j.epsl.2006.10.021
Johannesson, K. H., Chevis, D. A., Burdige, D. J., Cable, J. E., Martin, J. B., and Roy, M. (2011). Submarine groundwater discharge is an important net source of light and middle REEs to coastal waters of the Indian River Lagoon, Florida, USA. Geochim. Cosmochim. Acta 75, 825–843. doi: 10.1016/j.gca.2010.11.005
Johannesson, K. H., Palmore, C. D., Fackrell, J., Prouty, N. G., Swarzenski, P. W., Chevis, D. A., et al. (2017). Rare earth element behavior during groundwater– seawater mixing along the Kona Coast of Hawaii. Geochim. Cosmochim. Acta 198, 229–258. doi: 10.1016/j.gca.2016.11.009
Kawabe, M., and Fujio, S. (2010). Pacific Ocean circulation based on observation. J. Oceanogr. 66, 389–403. doi: 10.1007/s10872-010-0034-8
Kim, I., and Kim, G. (2011). Large fluxes of rare earth elements through submarine groundwater discharge (SGD) from a volcanic island, Jeju, Korea. Marine Chem. 127, 12–19. doi: 10.1016/j.marchem.2011.07.006
Kwon, E. Y., Kim, G., Primeau, F., Moore, W. S., Cho, H.-M., DeVries, T., et al. (2014). Global estimate of submarine groundwater discharge based on an observationally constrained radium isotope model. Geophys. Res. Lett. 41, 8438–8444. doi: 10.1002/2014GL061574
Lacan, F., and Jeandel, C. (2001). Tracing Papua New Guinea imprint on the central Equatorial Pacific Ocean using neodymium isotopic compositions and Rare Earth Element patterns. Earth Planet. Sci. Lett. 186, 497–512. doi: 10.1016/S0012-821X(01)00263-1
Lacan, F., and Jeandel, C. (2005). Neodymium isotopes as a new tool for quantifying exchange fluxes at the continent-ocean interface. Earth Planet. Sci. Lett. 232, 245–257. doi: 10.1016/j.epsl.2005.01.004
Laffourge, A. (1993). “L'hydrologie,” in Atlas de la Polynésie Française, ed Orstom (Paris: Edition de L'ORSTOM), 250.
Martin, E. E., Blair, S. W., Kamenov, G. D., Scher, H. D., Bourbon, E., Basak, C., et al. (2010). Extraction of Nd isotopes from bulk deep sea sediments for paleoceanographic studies on Cenozoic time scales. Chem. Geol. 269, 414–431. doi: 10.1016/j.chemgeo.2009.10.016
Merschel, G., Bau, M., and Dantas, E. L. (2017). Contrasting impact of organic and inorganic nanoparticles and colloids on the behavior of particle-reactive elements in tropical estuaries: an experimental study. Geochim. Cosmochim. Acta 197, 1–13. doi: 10.1016/j.gca.2016.09.041
Moffett, J. M. (1990). Microbially mediated cerium oxidation in sea water. Nature 345, 421–423. doi: 10.1038/345421a0
Molina-Kescher, M., Frank, M., and Hathorne, E. (2014). South Pacific dissolved Nd isotope compositions and rare earth element distributions: water mass mixing versus biogeochemical cycling. Geochim. Cosmochim. Acta 127, 171–189. doi: 10.1016/j.gca.2013.11.038
Molina-Kescher, M., Frank, M., Tapia, R., Ronge, T. A., Nürnberg, D., and Tiedemann, R. (2016). Reduced admixture of North Atlantic Deep Water to the deep central South Pacific during the last two glacial periods. Paleoceanography 31, 651–668. doi: 10.1002/2015PA002863
Moore, W. S. (1996). Large groundwater inputs to coastal waters revealed by 226Ra enrichments. Nature 380, 612–614.
Moore, W. S. (2003). Sources and fluxes of submarine groundwater discharge delineated by radium isotopes. Biogeochemistry 66, 75–93. doi: 10.1023/B:BIOG.0000006065.77764.a0
Moore, W. S., Sarmiento, J. L., and Key, R. M. (2008). Submarine groundwater discharge revealed by 228Ra distribution in the upper Atlantic Ocean. Nat. Geosci. 1, 309–311. doi: 10.1038/ngeo183
Nozaki, Y. (2001). “Rare earth elements and their isotopes in the ocean,” in Encyclopedia of Ocean Sciences, ed H. S. John (Oxford: Academic Press), 2354–2366.
Nozaki, Y., and Alibo, D. S. (2003a). Dissolved rare earth elements in the Southern Ocean, southwest of Australia: unique patterns compared to the South Atlantic data. Geochem. J. 37, 47–62. doi: 10.2343/geochemj.37.47
Nozaki, Y., and Alibo, D. S. (2003b). Importance of vertical geochemical processes in controlling the oceanic profiles of dissolved rare earth elements inferred from the study in the northeastern Indian Ocean. Earth Planet. Sci. Lett. 205, 155–172. doi: 10.1016/S0012-821X(02)01027-0
Olmez, I., Sholkovitz, E. R., Hermann, D., and Eganhouse, R. P. (1991). Rare-earth elements in sediments off Southern California — a new anthropogenic indicator. Environ. Sci. Technol. 25, 310–316. doi: 10.1021/es00014a015
O'Nions, K., Hamilton, P. J., and Evensen, N. M. (1977). Variations in 143Nd/144Nd and 87Sr/86Sr ratios in oceanic basalts. Earth Planet. Sci. Lett. 34, 13–22.
Osborne, A. H., Haley, B. A., Hathorne, E. C., Plancherel, Y., and Frank, M. (2015). Rare earth element distribution in Caribbean seawater: continental inputs versus lateral transport of distinct REE compositions in subsurface water masses. Marine Chem. 177, 172–183. doi: 10.1016/j.marchem.2015.03.013
Osborne, A. H., Haley, B., Hathorne, E. C., Flögel, S., and Frank, M. (2014). Neodymium isotopes and concentrations in Caribbean seawater: tracing water mass mixing and continental input in a semi-enclosed ocean basin. Earth Planet. Sci. Lett. 406, 174–186. doi: 10.1016/j.epsl.2014.09.011
Osborne, A. H., Hathorne, E. C., Schijf, J., Plancherel, Y., Böning, P., and Frank, M. (2017). The potential of sedimentary foraminiferal rare earth element patterns to trace water masses in the past. Geochem. Geophys. Geosystems 18, 1550–1568. doi: 10.1002/2016GC006782
Pahnke, K., Goldstein, S. L., and Hemming, S. R. (2008). Abrupt changes in Antarctic Inter-mediate Water circulation over the past 25,000 years. Nat. Geosci. 1, 870–874. doi: 10.1038/ngeo360
Pahnke, K., van de Flierdt, T., Jones, K. M., Lambelet, M., Hemming, S. R., and Goldstein, S. L. (2012). GEOTRACES intercalibration of neodymium isotopes and rare earth element concentrations in seawater and suspended particles. Part 2: Systematic tests and baseline profiles. Limnol. Oceanogr. Methods 10, 252–269. doi: 10.4319/lom.2012.10.252
Pearce, C. R., Jones, M. T., Oelkers, E. H., Pradoux, C., and Jeandel, C. (2013). The effect of particulate dissolution on the neodymium (Nd) isotope and rare earth element (REE) composition of seawater. Earth Planet. Sci. Lett. 369–370, 138–147. doi: 10.1016/j.epsl.2013.03.023
Piepgras, D. J., and Wasserburg, G. J. (1982). Isotopic composition of neodymium in waters from the Drake Passage. Science 217, 207–214.
Piepgras, D. J., and Wasserburg, G. J. (1987). Rare earth element transport in the western North Atlantic inferred from Nd isotopic observations. Geochim. Cosmochim. Acta 51, 1257–1271. doi: 10.1016/0016-7037(87)90217-1
Piepgras, D. J., and Jacobsen, S. B. (1988). The isotopic composition of neodymium in the North Pacific. Geochim. Cosmochim. Acta 52, 1373–1381. doi: 10.1016/0016-7037(88)90208-6
Qu, T., and Lindstrom, E. J. (2002). A climatological interpretation of the circulation in the Western South Pacific. J. Phys. Oceanogr. 32, 2492–2508. doi: 10.1175/1520-0485-32.9.2492
Reid, J. L. (1997). On the total geostrophic circulation of the Pacific Ocean: flow patterns, tracers and transports. Prog. Oceanog. 39, 263–352.
Rempfer, J., Stocker, T. F., Joos, F., Dutay, J. C., and Siddall, M. (2011). Modelling Nd-isotopes with a coarse resolution ocean circulation model: sensitivities to model parameters and source/sink distributions. Geochim. Cosmochim. Acta 75, 5927–5950. doi: 10.1016/j.gca.2011.07.044
Rousseau, T. C. C., Sonke, J. E., Chmeleff, J., van Beek, P., Souhaut, M., Boaventura, G., et al. (2015). Rapid neodymium release to marine waters from lithogenic sediments in the Amazon estuary. Nat. Commun. 6:7592. doi: 10.1038/ncomms8592
Schijf, J., Christenson, E. A., and Byrne, R. H. (2015). YREE scavenging in seawater: a new look at an old model. Mar. Chem. 177, 460–471. doi: 10.1016/j.marchem.2015.06.010
Schneider, N., and Müller, P. (1990). The meridional and seasonal structures of the mixed-layer depth and its diurnal amplitude observed during the Hawaii-to-Tahiti Shuttle experiment. J. Phys. Oceanogr. 20, 1395–1404.
Schopka, H. H., and Derry, L. A. (2012). Chemical weathering fluxes from volcanic islands and the importance of groundwater: the Hawaiian example. Earth Planet. Sci. Lett. 339–340, 67–78. doi: 10.1016/j.epsl.2012.05.028
Shabani, M. B., Akagi, T., and Masuda, A. (1992). Preconcentration of trace rare-earth elements in seawater by complexation with bis(2-ethylhexyl) hydrogen phosphate and 2-ethylhexyl dihydrogen phosphate adsorbed on a C18 cartridge and determination by inductively coupled plasma mass-spectrometry. Anal. Chem. 64, 737–743.
Sholkovitz, E. R. (1995). The aquatic chemistry of rare earth elements in rivers and estuaries. Aquat. Chem. 1, 1–34. doi: 10.1007/BF01025229
Sholkovitz, E. R., and Szymczak, R. (2000). The estuarine chemistry of rare earth elements: comparison of the Amazon, Fly, Sepik and the Gulf of Papua systems. Earth Planet. Sci. Lett. 179, 299–309. doi: 10.1016/S0012-821X(00)00112-6
Sholkovitz, E. R., Elderfield, H., Szymczak, R., and Casey, K. (1999). Island weathering: river sources of rare earth elements to the Western Pacific Ocean. Mar. Chem. 68, 39–57.
Siddall, M., Khatiwala, S., van de Flierdt, T., Jones, K., Goldstein, S. L., Hemming, S., et al. (2008). Towards explaining the Nd paradox using reversible scavenging in an ocean general circulation model. Earth Planet. Sci. Lett. 274, 448–461. doi: 10.1016/j.epsl.2008.07.044
Singh, S. P., Singh, S. K., Goswami, V., Bhushan, R., and Rai, V. K. (2012). Spatial distribution of dissolved neodymium and εNd in the Bay of Bengal: role of particulate matter and mixing of water masses. Geochim. Cosmochim. Acta 94, 38–56. doi: 10.1016/j.gca.2012.07.017
Sloyan, B. M., and Rintoul, S. R. (2001). Circulation, renewal, and modification of Antarctic mode and intermediate water. J. Phys. Oceanogr. 31, 1005–1030. doi: 10.1175/1520-0485(2001)031<1005:CRAMOA>2.0.CO;2
Stichel, T., Hartman, A. E., Dugan, B., Goldstein, S. L., Scher, H., and Pahnke, K. (2015). Separating biogeochemical cycling of neodymium from water mass mixing in the Eastern North Atlantic. Earth Planet. Sci. Lett. 412, 245–260. doi: 10.1016/j.epsl.2014.12.008
Tachikawa, K., Athias, V., and Jeandel, C. (2003). Neodymium budget in the modern ocean and paleo-oceanographic implications. J. Geophys. Res. 108:3254. doi: 10.1029/1999JC000285
Tanaka, K., Takahashi, Y., and Shimizu, H. (2008). Local structure of Y and Ho in calcite and its relevance to Y fractionation from Ho in partitioning between calcite and aqueous solution. Chem. Geol. 248, 104–113. doi: 10.1016/j.chemgeo.2007.11.003
Tanaka, T., Togashi, S., Kamioka, H., Amakawa, H., Kagami, H., Hamamoto, T., et al. (2000). JNdi-1: a neodymium isotopic reference in consistency with LaJolla neodymium. Chem. Geol. 168, 279–281. doi: 10.1016/S0009-2541(00)00198-4
Tapia, R., Nürnberg, D., Ronge, T., and Tiedemann, R. (2015). Disparities in glacial advection of Southern Ocean Intermediate Water to the South Pacific Gyre. Earth Planet. Sci. Lett. 410, 152–164. doi: 10.1016/j.epsl.2014.11.031
Taylor, S. R., and McLennan, S. M. (1985). The Continental Crust: Its Composition and Evolution, An Examination of the Geochemical Record Preserved in Sedimentary Rocks. Oxford: Blackwell.
Tomczak, M., and Godfrey, J. S. (1994). Regional Oceanography: An Introduction. New York, NY: Pergamon Press.
Tomczak, M., and Godfrey, J. S. (2003). “Hydrology of the Pacific Ocean,” in Regional Oceanography: An Introduction, 2nd Edn. (New Delhi: Daya Publishing House), 137–156.
Tomczak, M., and Hao, D. (1989). Water masses in the thermocline of the Coral Sea. Deep Sea Res. 36, 1503–1514.
Tsuchiya, M., Lukas, R., Fine, R., Firing, E., and Lindstrom, E. (1989). Source waters of the Pacific Equatorial Undercurrent. Prog. Oceanogr. 23, 101–147.
van de Flierdt, T., Pahnke, K., Amakawa, H., Andersson, P., Basak, C., Coles, B., et al. (2012). GEOTRACES intercalibration of neodymium isotopes and rare earth element concentrations in seawater and suspended particles. Part 1: reproducibility of results for the international intercomparison. Limnol. Oceanogr. Methods 10, 234–251. doi: 10.4319/lom.2012.10.234
Wei, R., Abouchami, W., Zahn, R., and Masque, P. (2016). Deep circulation changes in the South Atlantic since the Last Glacial Maximum from Nd isotope and multi-proxy records. Earth Planet. Sci. Lett. 434, 18–29. doi: 10.1016/j.epsl.2015.11.001
Wilson, D. J., Piotrowski, A. M., Galy, A., and Banakar, V. K. (2015). Interhemispheric controls on deep ocean circulation and carbon chemistry during the last two glacial cycles. Paleoceanography 30, 621–641. doi: 10.1002/2014PA002707
Wyrtki, K., and Kilonsky, B. (1984). Mean water and currents structure during Hawaii-to-Tahiti shuttle experiment. J. Phys. Oceanogr. 14, 242–254. doi: 10.1175/1520-0485(1984)014<0242:MWACSD>2.0.CO;2
Keywords: Rare Earth Elements, Nd isotope compositions, Tahiti, tropical South Pacific, Submarine Groundwater Discharge (SGD), Antarctic Intermediate Water (AAIW)
Citation: Molina-Kescher M, Hathorne EC, Osborne AH, Behrens MK, Kölling M, Pahnke K and Frank M (2018) The Influence of Basaltic Islands on the Oceanic REE Distribution: A Case Study From the Tropical South Pacific. Front. Mar. Sci. 5:50. doi: 10.3389/fmars.2018.00050
Received: 17 October 2017; Accepted: 02 February 2018;
Published: 02 March 2018.
Edited by:
Sunil Kumar Singh, Physical Research Laboratory, IndiaReviewed by:
Hiroshi Amakawa, Japan Agency for Marine-Earth Science and Technology, JapanVineet Goswami, Colorado State University, United States
Copyright © 2018 Molina-Kescher, Hathorne, Osborne, Behrens, Kölling, Pahnke and Frank. This is an open-access article distributed under the terms of the Creative Commons Attribution License (CC BY). The use, distribution or reproduction in other forums is permitted, provided the original author(s) and the copyright owner are credited and that the original publication in this journal is cited, in accordance with accepted academic practice. No use, distribution or reproduction is permitted which does not comply with these terms.
*Correspondence: Mario Molina-Kescher, mariomolinakescher@hotmail.com
†Martin Kölling orcid.org/0000-0003-2720-2211