A Novel Modeling Approach to Quantify the Influence of Nitrogen Inputs on the Oxygen Dynamics of the North Sea
 Fabian Große
 Markus Kreus3,4
  Hermann-Josef Lenhart
- 1Scientific Computing Group, Department of Informatics, Universität Hamburg, Hamburg, Germany
- 2Marine Environmental Modelling Group, Department of Oceanography, Dalhousie University, Halifax, NS, Canada
- 3Institute of Oceanography, Universität Hamburg, Hamburg, Germany
- 4Federal Waterways Engineering and Research Institute, Hamburg, Germany
Oxygen (O2) deficiency, i.e., dissolved O2 concentrations below 6 mg O2 L−1, is a common feature in the southern North Sea. Its evolution is governed mainly by the presence of seasonal stratification and production of organic matter, which is subsequently degraded under O2 consumption. The latter is strongly influenced by riverine nutrient loads, i.e., nitrogen (N) and phosphorus (P). As riverine P loads have been reduced significantly over the past decades, this study aims for the quantification of the influence of riverine and non-riverine N inputs on the O2 dynamics in the southern North Sea. For this purpose, we present an approach to expand a nutrient-tagging technique for physical-biogeochemical models — often referred to as ‘trans-boundary nutrient transports’ (TBNT) — by introducing a direct link to the O2 dynamics. We apply the expanded TBNT to the physical-biogeochemical model system HAMSOM-ECOHAM and focus our analysis on N-related O2 consumption in the southern North Sea during 2000–2014. The analysis reveals that near-bottom O2 consumption in the southern North Sea is strongly influenced by the N supply from the North Atlantic across the northern shelf edge. However, riverine N sources — especially the Dutch, German and British rivers — as well as the atmosphere also play an important role. In the region with lowest simulated O2 concentrations (around 56 °N, 6.5 °E), riverine N on average contributes 39% to overall near-bottom O2 consumption during seasonal stratification. Here, the German and the large Dutch rivers constitute the highest riverine contributions (11% and 10%, respectively). At a site in the Oyster Grounds (around 54.5 °N, 4 °E), the average riverine contribution adds up to 41%, even exceeding that of the North Atlantic. Here, highest riverine contributions can be attributed to the Dutch and British rivers adding up to almost 28% on average. The atmospheric contribution results in 13%. Our results emphasize the importance of anthropogenic N inputs and seasonal stratification for the O2 conditions in the southern North Sea. They further suggest that reductions in the riverine and atmospheric N inputs may have a relevant positive effect on the O2 levels in this region.
1. Introduction
The availability of dissolved oxygen (O2) in marine waters is crucial for the metabolism of many marine species (e.g., Rosenberg et al., 1991; Díaz and Rosenberg, 1995). Hypoxic conditions, i.e., dissolved O2 concentration < 2 mg O2 L−1 (e.g., Tyson and Pearson, 1991; Rabalais et al., 2002), constitute a major stressor to marine species and can have a severe impact on an ecosystem's biodiversity (Gray et al., 2002; Vaquer-Sunyer and Duarte, 2008; Topcu et al., 2009; Friedrich et al., 2014).
In the North Sea — a northwestern European shelf sea — hypoxic conditions occurred in the summers of the 1980s (Rachor and Albrecht, 1983; von Westernhagen and Dethlefsen, 1983; Brockmann and Eberlein, 1986; Peeters et al., 1995), causing death of benthic and demersal species (von Westernhagen and Dethlefsen, 1983). Different studies showed that these occurrences of low O2 conditions evolved during seasonal stratification (von Westernhagen and Dethlefsen, 1983; Peeters et al., 1995), driven by eutrophication due to excess riverine nutrient loads (Brockmann and Eberlein, 1986; Brockmann et al., 1988; Peeters et al., 1995). In consequence, the 2nd International Conference on the Protection of the North Sea declared to “aim to achieve a substantial reduction (of the order of 50%) in inputs of phosphorus (P) and nitrogen (N) to these areas between 1985 and 1995” (ICNS-2, 1988), in order to mitigate the effects of eutrophication in the North Sea.
Despite significant reductions in riverine nutrients, especially for P but not for N (Artioli et al., 2008; Claussen et al., 2009; OSPAR, 2013), seasonal O2 deficiency (i.e., dissolved O2 concentration < 6 mg O2 L−1; OSPAR, 2003) still occurs regularly in the southeastern North Sea (Topcu and Brockmann, 2015). Ongoing O2 monitoring even suggests recurrent (close-to-)hypoxic conditions (Weigelt-Krenz, pers. comm.), though, scientific publications on such events are sparse (Weston et al., 2008). Thus, O2 deficiency remains a persistent problem in the North Sea and the investigation of its causes is essential for the ecological management.
Große et al. (2016) applied a physical-biogeochemical model to the North Sea analyzing the physico-biochemical interactions that make the southeastern North Sea most susceptible to O2 deficiency. They found that the occurrence of distinct seasonal thermal stratification, resulting in a thin sub-thermocline layer in this region of intermediate depth, and high local near-surface net primary production (NPP) constitute the key factors. Consequently, near-bottom O2 concentrations can become especially low during years of very high NPP. High NPP enhances (pelagic and benthic) bacterial re-mineralization of organic matter, consistently accounting for more than 80% of near-bottom O2 consumption in the region of lowest bottom O2 concentrations (about 55.5–56.0 °N, 6–7 °E).
In contrast to near-shore eutrophication problem areas affected by high river loads entering the coastal areas, the off-shore areas affected by O2 deficiency are exposed to a wider variety of nutrient sources. Thus, the key question is which nutrient inputs drive NPP and O2 consumption finally, resulting in O2 deficiency in these North Sea regions?
Past studies suggested that nutrient inputs from adjacent North Sea regions may have contributed to the evolution of hypoxia in the 1980s (Brockmann and Eberlein, 1986; Brockmann et al., 1988). More recent publications also pointed on nutrient inputs from adjacent seas, especially the Northeast Atlantic (Artioli et al., 2008; Gröger et al., 2013). In addition, the model study by Troost et al. (2013) highlighted the influence of atmospheric N deposition on NPP in the southeastern North Sea and on near-bottom O2 concentrations. Quantifying the contributions of these different nutrient sources in the regions susceptible to O2 deficiency is vital for the development of potential management strategies for these regions. This demand is in line with the “integrated target-oriented and source-oriented” management approach by OSPAR (1999).
A nutrient tagging method applicable to biogeochemical models — often referred to as “trans-boundary nutrient transports” (TBNT; e.g., Blauw et al., 2006; OSPAR, 2010) — facilitates the tracing of elements (e.g., N) from individual sources throughout the entire biochemical cycle and the entire ecosystem (Ménesguen et al., 2006). By this, the TBNT method enables the quantification of the influence of these individual nutrient sources on biochemical quantities (e.g., total nitrogen; TN) and processes (e.g., NPP) in different regions of an ecosystem.
This method has been applied to various European marine ecosystems, including the Baltic Sea (e.g., Neumann, 2007; Radtke et al., 2012) and the North Sea (e.g., Blauw et al., 2006; Lacroix et al., 2007; Painting et al., 2013; Troost et al., 2013). Troost et al. (2013) demonstrated the importance of atmospheric N deposition for the off-shore regions of the southern North Sea, where it contributed 10–20% to overall TN and even 20–30% to NPP in 2002. Other studies (OSPAR, 2010; Painting et al., 2013) showed that N inputs from the large Dutch and German rivers are the major contributors to TN in the coastal southern and southeastern North Sea, respectively, while those from the rivers at the British North Sea coast extend far east into the off-shore southern North Sea. This, together with the findings by Große et al. (2016), suggests that these N sources have a strong influence on the O2 dynamics in the southern and southeastern North Sea.
Up to now, the TBNT method was limited to the tracing of elements brought into the system by the selected sources, not allowing for the consideration of O2. Thus, quantitative analyses of the influence of different nutrient sources on the O2 dynamics required additional model scenarios within which individual nutrient sources were removed (e.g., Troost et al., 2013) or nutrient loads were reduced (e.g., Lenhart et al., 2010). This implies an individual scenario was required for each individual nutrient source in order to assess its impact on the O2 conditions which is time-consuming and causes high computational costs.
Therefore, this study presents a new approach for expanding the TBNT method by a direct link of the O2 dynamics to the nutrient inputs from individual sources. We focus on the relative importance of riverine vs. non-riverine sources of N, and their influence on the O2 dynamics in the regions most susceptible to O2 deficiency.
We first describe the applied HAMSOM-ECOHAM model and provide the relevant information on the theory and the implementation of TBNT. Große et al. (2016) showed that the model system captures the main features of observed O2 concentrations in the North Sea. Therefore, only the simulated volume transports are validated and spatial distributions of TN from selected sources are presented and compared to earlier TBNT studies. Finally, the results of the expanded TBNT method are presented with special focus on two regions regularly affected by O2 deficiency — the southeastern North Sea (Topcu and Brockmann, 2015) and the Oyster Grounds (e.g., Greenwood et al., 2010).
2. Materials and Methods
2.1. The HAMSOM-ECOHAM Model
We use a three-dimensional (3D) model consisting of the physical model HAMSOM (HAMburg Shelf Ocean Model; Backhaus, 1985; Pohlmann, 1991, 1996) and the biogeochemical model ECOHAM (ECOsystem model, HAMburg; Pätsch and Kühn, 2008; Kühn et al., 2010; Lorkowski et al., 2012; Große et al., 2016). HAMSOM is a baroclinic, primitive equation model using the hydrostatic and Boussinesq approximations (Pohlmann, 1991). The current velocities are calculated using the component-upstream scheme. The horizontal is discretized on a staggered Arakawa C-grid (Arakawa and Lamb, 1977) and z-coordinates are applied to the vertical. A detailed description of HAMSOM is provided by Pohlmann (1991, 1996, 2006). HAMSOM applications can be found, e.g., in Backhaus and Hainbucher (1987), Chen et al. (2013), Pohlmann (1996), and Mathis and Pohlmann (2014). The 3D fields of temperature (T), salinity (S), advective flow and vertical turbulent mixing coefficients calculated by HAMSOM are used as forcing for ECOHAM.
The ECOHAM model represents all parameter groups of a so-called NPZD-type model (nutrients-phytoplankton-zooplankton-detritus) to represent the lower trophic level dynamics. It describes two phytoplankton groups (diatoms, flagellates) and two zooplankton groups (micro- and mesozooplankton). In addition, the “microbial loop” (Azam et al., 1983) is represented. ECOHAM simulates the cycles of carbon (C), N, P, silicon (Si) and O2 (Pätsch and Kühn, 2008; Lorkowski et al., 2012). The present version of ECOHAM is identical to that used by Große et al. (2016). Lorkowski et al. (2012) provide a full description of the ECOHAM model equations and parameter settings. Here, we will only summarize the relevant features of the O2 cycle.
Figure 1 illustrates the O2 cycle implemented to ECOHAM (Müller, 2008; Pätsch and Kühn, 2008), including the links to the cycles of C, N and P. The arrows indicate the loss or gain of a substance, e.g., is released during benthic re-mineralization and utilized during pelagic nitrification. The air-sea flux of O2 is parametrized according to Wanninkhof (1992). In the interior water column, NPP according to Liebig (1841) and Steele (1962) constitutes a source process for O2 and links O2 to the cycles of N, P, and C. All other biochemical processes, namely respiration by zooplankton (Sterner and Elser, 2002) and aerobic bacteria, and nitrification, represent O2-consuming processes. While the former processes constitute links of O2 to the cycles of C, N, and P, nitrification is only linked to N. Pelagic denitrification is implemented to ECOHAM, but is negligible as it only takes place under anaerobic conditions, not occurring in the North Sea. Pelagic anaerobic oxidation (anammox) is not implemented for the same reason (Große et al., 2016). NPP is T-dependent and pelagic nitrification is light-limited in the applied model setup.
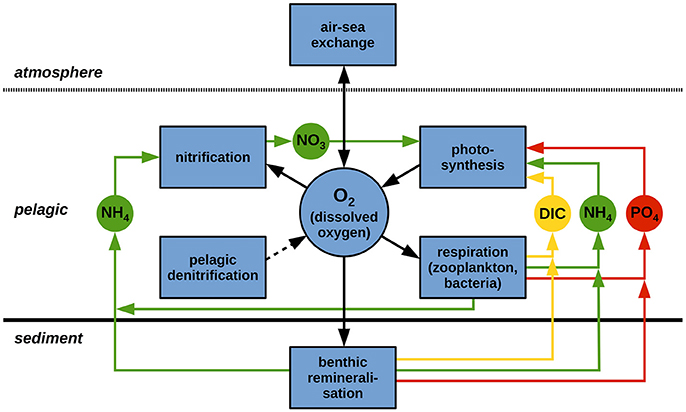
Figure 1. Schematic view of the O2 cycle as implemented to ECOHAM (black framed boxes and black arrows), including the links to the C, N, and P cycles (yellow, green and red, respectively). Linking state variables are: dissolved inorganic C (DIC), , , and . Adapted from Müller (2008).
The sediment is described by a simple zero-dimensional module (Pätsch and Kühn, 2008). Benthic re-mineralization follows a first-order approach inhibiting year-to-year accumulation of matter (Große et al., 2016). Benthic denitrification is linked to benthic O2 consumption according to Seitzinger and Giblin (1996), reducing the O2 concentration in the deepest pelagic layer (Fennel et al., 2006). Explicit benthic nitrification and benthic anammox are not implemented (Pätsch and Kühn, 2008).
In relation to the re-mineralization processes it has to be mentioned that the C:N:P ratios of particulate (POM) and dissolved organic matter (DOM) can evolve freely with time. POM is represented by two detritus species (small/large). Model DOM and POM only represent the reactive fractions (Kühn et al., 2010). Carbon oxidation occurs with a molar ratio of C/O2 = 1 (Neumann, 2000; Paulmier et al., 2009). Therefore, the O2 consumption due to respiratory processes can be described by the corresponding net C release, except for nitrification for which the molar ratio between uptake and O2 consumption is 2. The model equations and parameters of the biochemical processes affecting O2 are given in Appendix A (Supplementary Material).
2.2. The TBNT Method
The basic concept of TBNT is that any property (e.g., input source) of an element (e.g., N) can be traced throughout the entire elemental cycle represented by a biogeochemical model. This is done by introducing additional model state variables and processes for each property. This concept dates back to the work by Ménesguen and Hoch (1997), who introduced the age as a property, and later on has been applied to various models and ecosystems (e.g., Wijsman et al., 2004; Blauw et al., 2006; Ménesguen et al., 2006; Lacroix et al., 2007; Neumann, 2007; Timmermann et al., 2010; Radtke et al., 2012; Painting et al., 2013; Troost et al., 2013; Perrot et al., 2014; Radtke and Maar, 2016).
According to Ménesguen and Hoch (1997), any property p (e.g., origin/source etc.) can be attached to any state variable X, and can be traced within a biogeochemical model by solving an additional differential equation for the product X · p instead of the bulk state variable X. The product X · p then represents that subset of the state variable X with the defined property p. Technically, the product X · p is introduced into the model as a new fraction state variable Xp = X · p and the related processes are introduced according to the differential equation describing the changes in the corresponding bulk state variable X. Each combination of state variables X and properties pi (e.g., different input sources), , requires an additional differential equation to be solved by the model. For easier readability, is hereafter denoted as Xi.
Compared to existing TBNT studies, we apply a slightly different approach which allows for the diagnostic calculation of the temporal evolution and spatial dispersal of Xi. In the following, the theory for this element tracing approach is briefly described. In this context, the terms “bulk” and “fraction” are used to refer to the overall state variables and processes, and their labeled counterparts, respectively. Thereafter, the approach for linking the biochemical processes affecting O2 to the cycle of a traced element is presented.
2.2.1. Tracing Elements from Individual Sources
The convection-diffusion equation describes the change in concentration of a selected bulk state variable with time due to different physical and biochemical processes. This equation represents the differential equation solved by physical-biogeochemical models. A detailed derivation of the convection-diffusion equation for a fraction variable starting from that for a bulk state variable is provided by Radtke (2012). The source-specific convection-diffusion equation for a constant volume V as used in this study reads as follows:
Here, and CX represent the concentrations of the fraction of state variable X originating from the i-th input source and that of the corresponding bulk state variable, respectively. The diffusive transport is calculated according to Fick's first law, with the second order diffusion tensor (or diffusivity) . In the convective/advective transport term, represents the three-dimensional velocity vector. RCX represents the change in concentration of X due to the sources and sinks (i.e., biochemical processes, input from external sources). The index Xin in the fraction of this term indicates that the relative contribution of the state variable, that is consumed by a biochemical process, is used.
For n individually labeled input sources (i.e., i = 1, 2, …, n – 1, n), the concentration of each bulk state variable X at a specific location and point in time equals the sum of its contributing fraction state variables:
According to Equation (1) all physical (diffusion and transport) and biochemical processes (sources/sinks) affecting are calculated as the product of the process based on CX and the relative contribution of the fraction variable, . Thus, the major assumption of Equation (1) is that there is no preference for any fraction variable Xi by any (physical or biochemical) process, which relates to the fact that all fraction variables Xi are chemically and physically identical.
Compared to previous TBNT studies (e.g., Ménesguen et al., 2006; Radtke et al., 2012) this implies a different treatment of the diffusive transport. In our study its calculation bases on the spatial gradients of the bulk variable concentration. In earlier studies the concentration gradients of the fraction variable were used. In fact, it is difficult to state which approach is more correct than the other as the diffusive transport according to Fick's first law is a net transport, i.e., the actual gross transports are not known. However, it has to be noted that the diffusive transports of the individual fraction variables Xi according to Ménesguen et al. (2006) and Radtke et al. (2012) can be opposed, while those following Equation (1) are unidirectional. Despite this different treatment the resulting differences in the fraction variable distributions are expected to be generally small and noticeable differences may only occur in the case of large differences between the spatial gradients of the fraction and bulk variables. The diffusive transport of the bulk variable will be the same in both cases.
The advantage of the calculation based on Equation (1) is that the element tracing can be conducted by means of a post-processing software utilizing the standard output of the applied model. It only requires the provision of the 3D output fields of all processes and state variables involved in the selected elemental cycle.
2.2.2. Linking Oxygen-Affecting Processes to Labeled Nutrients
In order to allow for the quantification of the influence of (organic and inorganic) nutrients from individual sources on the O2 dynamics the establishment of a link between the two is required. This implies that only the local biochemical processes affecting O2 can be linked to labeled nutrients, while physical processes (i.e., lateral effects) that only depend on O2 itself cannot be considered explicitly.
According to Equation (1) biochemical processes on fraction variables (e.g., uptake of containing N from the Elbe by diatoms) can be calculated using the bulk process and the relative contribution of the fraction variable to the bulk variable:
Similarly, Equation (3) can be used for linking the O2-affecting processes to labeled nutrients. In case of ECOHAM, the O2 dynamics are linked to the cycles of C, N, and P by different processes (see Figure 1). In case of O2-affecting processes whose formulation is based on a state variable containing the labeled element, this state variable can be used for the link to the O2 cycle. For instance, O2 consumption due to nitrification is based on containing the labeled element in case of N labeling.
For processes whose formulation is based on a different element than the labeled one (e.g., NPP with ‘currency’ C instead of N), a different approach is required. In ECOHAM, the formulation of the change in O2 due to these processes is based on quantities that contain the currency and the labeled element, e.g., diatoms containing C, N, and P. Assuming that the concentration of the currency of the process is proportional to the currency of the labeled element these model quantities can be described as “mediators,” XM. These mediators can be used for establishing the link between the labeled element and the O2 cycle. For O2-affecting processes linked to these labeled mediator variables Equation (3) then reads as:
with the O2-affecting, biochemical bulk process RCO2, and and CXM representing the concentrations of the mediator fraction and bulk variable, respectively.
Using Equation (4), the following mediator variables are used for the O2-affecting processes shown in Figure 1: diatoms and flagellates for NPP, micro- and mesozooplankton for zooplankton respiration. For pelagic re-mineralization (i.e., bacterial respiration), the bacteria are used while for benthic re-mineralization the amount of detrital matter in the sediment is used. In case of N labeling in ECOHAM, the mediator state variables are: diatom-N and flagellate-N for NPP, micro- and mesozooplankton-N for zooplankton respiration, bacteria-N for pelagic re-mineralization and sediment-N for benthic re-mineralization. In case of P labeling, which is not part of this study, the corresponding model state variables can be used as mediator.
The use of the mediator implies that the concentration of the C-based mediator variable (e.g., diatom-C) is proportional to the corresponding concentration of the N-based mediator variable (e.g., diatom-N), according to the applied stoichiometry. Conceptually, their use can be interpreted such that the biomasses (containing C, N, and P) of the different organisms (phyto-/zooplankton, bacteria) and that of benthic detrital matter are controlled by N from the individual input sources.
Our study focuses on the influence of N on near-bottom O2 in the off-shore regions of the North Sea, where NPP is negligible due to light limitation (Große et al., 2016). Therefore, we use gross O2 consumption (GOC), i.e., the sum of all biochemical O2-consuming processes as the key quantity in our analysis. In ECOHAM, these processes are: pelagic and benthic re-mineralization, zooplankton respiration and nitrification. The here used GOC is comparable to the often used “apparent oxygen utilization (AOU)”.
2.3. Model Setup and TBNT Calculation
2.3.1. Model Setup
The model setup used for this study is identical to that described in Große et al. (2016). Both, HAMSOM and ECOHAM, are applied to the same model domain and grid, comprising the entire North Sea, large parts of the northwest European continental shelf and parts of the adjacent Northeast Atlantic Ocean (see Figure 2). The domain extends from 15.250 °W to 14.083 °E and from 47.583 °N to 63.983 °N. The horizontal resolution is 1/5 ° (1/3 °) with 82 (88) grid points in latitudinal (longitudinal) direction. The vertical dimension is resolved by 31 z-layers with a surface layer of 10 m average thickness. Below the surface layer, layer thicknesses increase from 5 m to 1,000 m in the deepest layers.
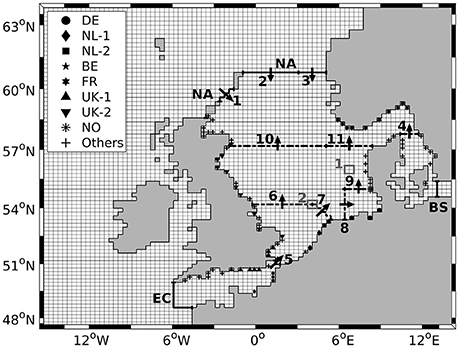
Figure 2. Model domain with sub-domain used for TBNT analysis, defined by three boundaries (solid black): North Atlantic (NA), English Channel (EC) and Baltic Sea (BS). Different markers indicate river input locations for German (DE), Dutch (NL-1/NL-2), Belgian (BE), French (FR), British (UK-1/UK-2), Norwegian (NO) and other rivers (see Table 1). Dash-dotted lines mark sections 1 to 11 used for the validation of the volume transports simulated by HAMSOM, with arrows indicating the direction of positive net flow. Ticks mark start/end points of sections. Boxes 1 and 2 indicate regions used for time series analyses in Section 3.2.
HAMSOM uses monthly, climatological distributions of T and S based on the World Ocean Atlas 2001 (Conkright et al., 2002) for initialization and open boundaries. The open boundary treatment for advective flow as well as T and S is described in Chen et al. (2013). The meteorological forcing is derived from NCEP/NCAR reanalysis data (Kalnay et al., 1996; Kistler et al., 2001) and provides 6-hourly information on air temperature, cloud coverage, relative humidity and wind velocity components.
For ECOHAM, short-wave radiation is calculated from astronomical radiation and cloud coverage applying a correction factor of 0.9 to account for underestimated cloud coverage in the NCEP data in temperate zones. For the biogeochemical state variables a climatology of depth-dependent monthly averages was prescribed at the boundaries and annually varying data was provided for dissolved inorganic carbon (DIC; Lorkowski et al., 2012). A daily climatology of suspended particulate matter was derived from results of Pohlmann and Puls (1994) to include its effect on the light climate.
Daily freshwater run-off and nutrient load data for 254 rivers were provided by Sonja van Leeuwen (pers. comm.) and constitute an updated dataset of that used by Lenhart et al. (2010) covering the period 1977–2014. River inputs of particulate organic N (PON) were calculated as TN minus and , which are all available in the original data. Dissolved organic N is considered to be zero. The same approach was applied for organic P loads. Particulate organic C loads were derived from the PON loads using a C:N ratio of 106:16 (Redfield, 1934). A detailed description of the nutrient load calculation for the German and Dutch rivers is given in Pätsch et al. (2016).
The atmospheric N deposition was derived following Große et al. (2016), using annual data from the EMEP (Cooperative program for monitoring and evaluation of the long-range transmissions of air pollutants in Europe) model covering the period 1995–2012 and long-term trends (Schöpp et al., 2003). Atmospheric deposition is implemented as inputs of and .
Both model compartments ran over the period 1977–2014. A time step of 10 minutes was applied for the HAMSOM simulation and daily fields of T, S, advective flow and the vertical turbulent diffusion coefficient were stored as output. This daily output was used as physical forcing for ECOHAM, which ran off-line applying a time step of 30 minutes. Daily ECOHAM output was stored for the entire N cycle and the biochemical processes affecting O2.
2.3.2. TBNT Setup
For the TBNT calculation, a sub-domain within the model domain was defined, comprising the North Sea, the English Channel and the Kattegat/Belts. The outer boundaries of this sub-domain (hereafter “North Sea domain”) are: North Atlantic (NA) in the North, English Channel (EC) in the Southwest and Baltic Sea (BS) in the East (see Figure 2). An individual input source was defined for each of these outer boundaries and matter entering the North Sea across these boundaries is labeled accordingly. One atmospheric source for the entire North Sea domain was defined to include atmospheric N deposition. The individual rivers inside the North Sea domain were grouped to 8 river groups according to OSPAR (ICG-EMO, 2009; OSPAR, 2010; Los et al., 2014). One additional river group was defined collecting all rivers not attributed to one of the OSPAR groups (hereafter “other rivers/others”). The input locations of the rivers of the individual groups are indicated in Figure 2 (see different markers). Table 1 provides a complete list of all source groups.
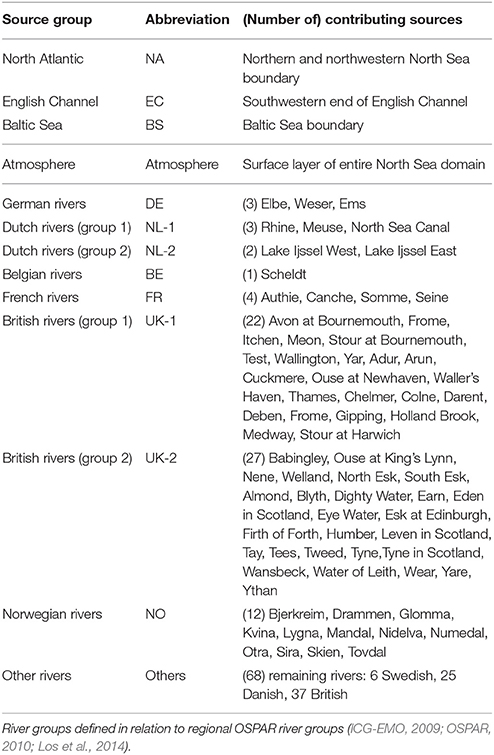
Table 1. List of source groups defined for the TBNT analysis, including abbreviations (used in Figure 2 and in-text) and list of individual group members.
The TBNT analysis was conducted for the period 2000–2014 using the daily ECOHAM output. A sensitivity study with an ECOHAM output time step of two hours showed that the effect of the output time step on the TBNT results is negligible (not shown). All labeled variables (except for the other rivers) are initialized with a relative contribution of 0% to the corresponding model state variables. The other rivers are initialized with a relative contribution of 100% within the entire North Sea domain. This implies that the matter initially present inside the domain is fully attributed to the other rivers, while the matter originating from the specifically defined sources has to enter the system successively.
Starting from the initial distribution, the year 1999 was re-run seven times with the final distribution of the relative contributions of each labeled state variable used as initialization for the subsequent one. This implies a minor shift in the actual masses of individual labeled state variables between the end and the beginning of two subsequent spin-up years. After the seventh re-run a quasi-steady state was reached. This gives confidence (1) that realistic distributions of the fraction variables are reached and (2) that the matter attributed to the other rivers actually relates to these rivers and not to the initial mass. The advantage of this procedure is that the TBNT analysis can be applied to a comparably short model simulation requiring only one additional year prior to the analysis period. A comparison of a spin-up over a sequence of seven years showed negligible differences (not shown) justifying this procedure.
The TBNT calculation utilizes a base time step of one day (in relation to the daily model output) which is halved recursively during the calculation in case of fraction variables becoming negative.
2.3.3. Atmospheric and Riverine N Input
The applied atmospheric and riverine TN inputs are crucial for the results of the TBNT analysis. Therefore, Figures 3A,B show time series of the annual atmospheric and riverine TN input into the North Sea domain, respectively. In both panels, the left y axes refer to the absolute TN input (in kt N a−1). The right y axis in Figure 3A refers to the contributions of the atmospheric input into different subregions of the North Sea domain, relative to the total input into the domain: southern North Sea (▴; area of 1.7·105 km2), northern North Sea (▾; 3.8·105 km2), English Channel (◂; 0.9·105 km2) and Kattegat/Belts (▸; 0.5·105 km2). The southern North Sea represents the North Sea region south of 56 °N until transport section 5 in the Strait of Dover (see Figure 2). The northern North Sea represents the part of the TBNT domain north of 56 °N, including the Skagerrak north of section 4. The English Channel is the region between the EC boundary and section 5, while the Kattegat/Belts region is limited by the BS boundary and section 4. The total area of the North Sea domain is 6.9·105 km2.
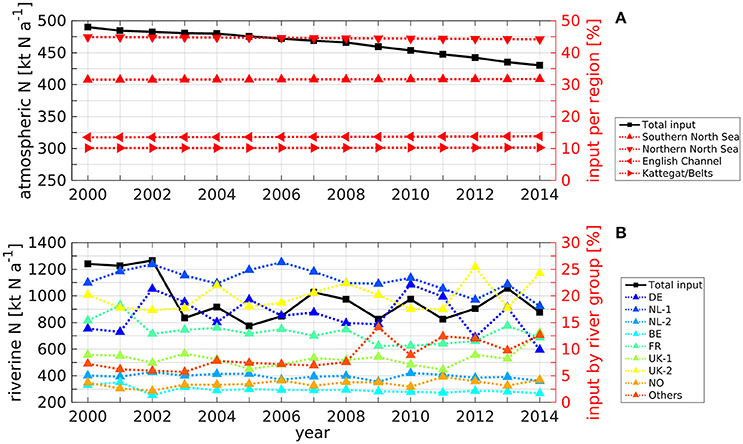
Figure 3. Time series of annual (A) atmospheric and (B) riverine TN input (left y axes and solid lines) into the TBNT domain (see Figure 2). Relative contributions (right y axes and dotted lines) represent the contribution to the total input into the TBNT domain by different regions in case of atmospheric deposition and by different river groups (see Table 1) in case of riverine input.
Figure 3A shows that the atmospheric input (solid line) decreases slowly throughout 2000–2014, with a relative reduction of about 13% relating to the observed trend (Schöpp et al., 2003). The atmospheric deposition yields 490 kt N a−1 in 2000 and stays around 485 kt N a−1 during 2001–2004. From 2005 on, it shows a steady decrease reaching 430 kt N a−1 in 2014.
The relative contributions of the atmospheric TN input into the different subregions of the TBNT domain (dotted lines) are stable throughout 2000–2014. This relates to the fact that only the total, domain-wide N deposition decreases, while the spatial patterns do not change. The largest part of about 44.7% is deposited in the northern North Sea. About 31.6% enter the southern North Sea, whose area is less than half of that of the northern North Sea region, emphasizing the remarkable spatial differences in atmospheric N deposition. The relative contributions to the English Channel region and the Kattegat/Belts are about 13.6% and 10.1%, respectively.
The absolute annual riverine TN input into the TBNT domain (Figure 3B; solid line) ranges between 775 kt N a−1 in 2005 and 1266 kt N a−1 in 2002. An apparent step change is seen between 2002 and 2003. The relative contributions of the different river groups to riverine TN input (dotted lines) show that the NL-1 rivers (incl. Rhine and Meuse; see Table 1) are the largest TN source during most years with values between 18.1% and 26.3%. The UK-2 rivers, located at the British east coast, are of similar importance ranging between 17.3% and 25.4%. The DE rivers constitute the third largest source during most years with contributions of 9.9–22.1%. The FR rivers contribute 10.6–18.2%. The UK-1 and other rivers show values between 6.1–13.1% and 5.7–14.1%, respectively, with higher values in the period after 2008 compared to the earlier period. This indicates that the relative importance of the different rivers on the North Sea system changed during this period. The remaining rivers (NL-2, BE, and NO) are less important (<5%).
The relative contributions show that the drop in TN input from 2002 to 2003 mainly relates to decreasing inputs from the DE and NL-1 rivers. Interestingly, the DE rivers show particularly high relative contributions in 2002 and 2010 (21.3% and 22.1%, respectively). Both relate to Elbe flood events in August 2002 (e.g., Ulbrich et al., 2003) and late summer 2010 (e.g., Kienzler et al., 2015; Philipp et al., 2015), respectively.
It should be noted that average annual PON:TN ratios for most groups are in the range of 0.16–0.19. Only the UK rivers show lower ratios around 0.08 and the NL-2 and NO rivers show comparably high ratios of about 0.45 and 0.47, respectively, though corresponding to small overall N loads. The standard deviation of the annual ratios is <0.05 for all groups. Thus, inorganic N inputs dominate the ecosystem dynamics.
3. Results
This section first provides a brief validation of simulated volume transports as well as spatial distributions of TN from different sources and minimum O2 concentrations, simulated by the applied model and TBNT framework. By this, we demonstrate that the applied setup reproduces the main features of the North Sea ecosystem relevant to this study. This yields the basis for our analysis of the influence of N inputs on the O2 dynamics.
3.1. Validation
3.1.1. Volume Transports
Table 2 presents volume transports across defined sections simulated by HAMSOM and corresponding transports from other modeling studies (Ozer, 2011; Winther and Johannessen, 2006) and observations (Winther and Johannessen, 2006). The 11 sections used for the comparison are indicated in Figure 2 (arrows indicate direction of positive net flow/inflow). They were selected with respect to the North Sea general circulation and data availability. Ozer (2011) conducted a model intercomparison on the North Sea circulation in 2008. Thus, the corresponding HAMSOM transports across these sections are calculated for 2008 only. For the other sections, given values represent statistics over the 15-year period 2000–2014. The provided observation data were compiled by Winther and Johannessen (2006) and originate from Otto et al. (1990), Rodhe (1996), Rydberg et al. (1996), and Danielssen et al. (1997).
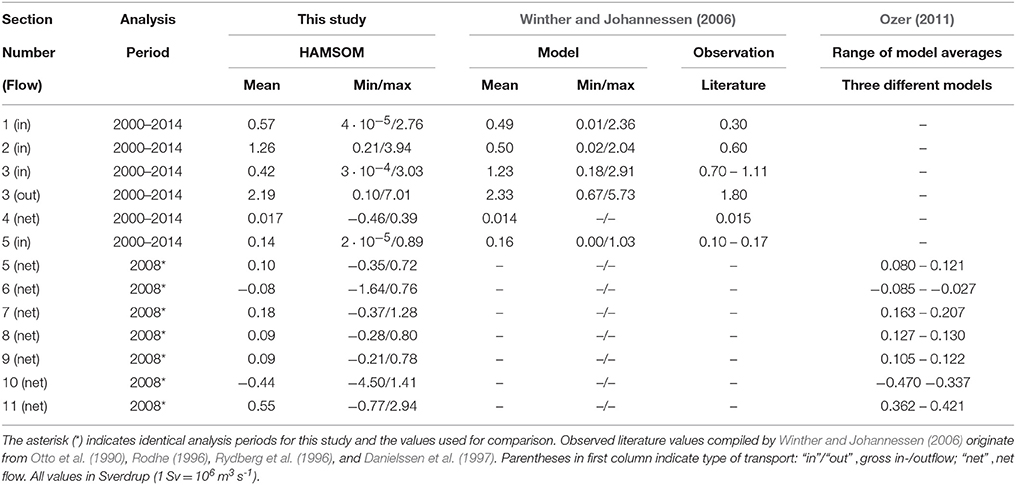
Table 2. Volume transports across defined sections (see Figure 2) derived from HAMSOM over entire period 2000–2014 compared to values from Winther and Johannessen (2006) and values for 2008 compared to Ozer (2011).
HAMSOM reproduces the gross inflow from the North Atlantic across the northern shelf edge (Table 2, sections 1 to 3). Average gross inflow through the three sections simulated by HAMSOM adds up to 2.25 Sv. This is comparable to the results of Winther and Johannessen (2006) yielding 2.22 Sv and close to the upper end of the observed range (1.60–2.01 Sv). The ratio between the inflows through sections 2 and 3 is opposite to that for the transports simulated by Winther and Johannessen (2006) and to the literature values. However, it should be noted that these transports are highly sensitive to the position of the separation between sections 2 and 3. The higher minimum–maximum range in the HAMSOM transports (compared to Winther and Johannessen, 2006) likely relates to the longer analysis period. Regarding the outflow in the Norwegian Trench area (section 3), HAMSOM shows good agreement with the other studies.
The net transport through section 4 (Kattegat) corresponds with the results of Winther and Johannessen (2006) and observations. The same applies to the gross inflow through the English Channel (section 5), for which the average net inflow in 2008 matches with Ozer (2011). The comparison of the transports across the northern shelf edge (sections 1–3) with those through sections 4 and 5 emphasizes that the Atlantic inflow from the North constitutes the dominant inflow into the North Sea.
For sections 6 and 7, the net transports are in the range reported by Ozer (2011). Though, transports for section 6 are rather at its upper end. The negative net transport through section 6 implies southward flow in the southwestern North Sea driven by the Atlantic inflow from the North and freshwater discharge from the rivers at the British east coast. In contrast, the northwestward flow in the eastern part (section 7) is governed by the continental coastal current driven by the English Channel inflow and riverine freshwater especially from the large Dutch rivers.
For the net flow into and out of the German Bight (sections 8 and 9, respectively), HAMSOM yields values of about 0.09 Sv, slightly below the range provided by Ozer (2011). This likely relates to the bathymetry in combination with the vertical resolution resulting in a distinct step in the model bathymetry causing a northward turn of parts of the coastal current before crossing section 8 (not shown).
The negative net flow across section 10 in the western central North Sea simulated by HAMSOM indicates the mainly southward flow in this region. The average value of −0.44 Sv is in the range found by Ozer (2011). In the eastern central North Sea (section 11), the positive net flow derived from HAMSOM represents the generally northward flow in this region relating to the cyclonic recirculation of most of the southward flowing water masses north of Dogger Bank (Lenhart and Pohlmann, 1997). The transport is slightly above the range reported by Ozer (2011), which may relate to a lower inflow from the Baltic Sea indicated by the differences in the transports across section 4.
In summary, the HAMSOM volume transports across the outer boundaries and in the interior of the North Sea show good agreement with other models and observations and represent well the general cyclonic circulation (e.g., Otto et al., 1990). Therefore, the current fields simulated by HAMSOM provide a reliable basis for the TBNT analysis.
3.1.2. Spatial Distributions of TN from Different Sources
In order to give insight in the dispersal of N from different input sources in the North Sea, Figure 4 shows the mass-weighted average relative contributions of selected input sources to TN (i.e., the sum of all N-related model state variables incl. sediment-N) during 2000–2014: (Figure 4A) atmosphere, (Figure 4B) German rivers (DE), (Figure 4C) 1st group of Dutch rivers (NL-1), and (Figure 4D) 2nd group of British rivers (UK-2). By aggregating pelagic and benthic state variables the internal processes (e.g., uptake of by diatoms) cancel out and the spatial distributions of TN from the different sources basically reflect the effect of lateral exchange processes. Only the loss of molecular N2 due to benthic denitrification, and atmospheric N deposition have an additional influence. The individual N sources were selected in relation to existing TBNT studies on TN (OSPAR, 2010; Painting et al., 2013; Troost et al., 2013).
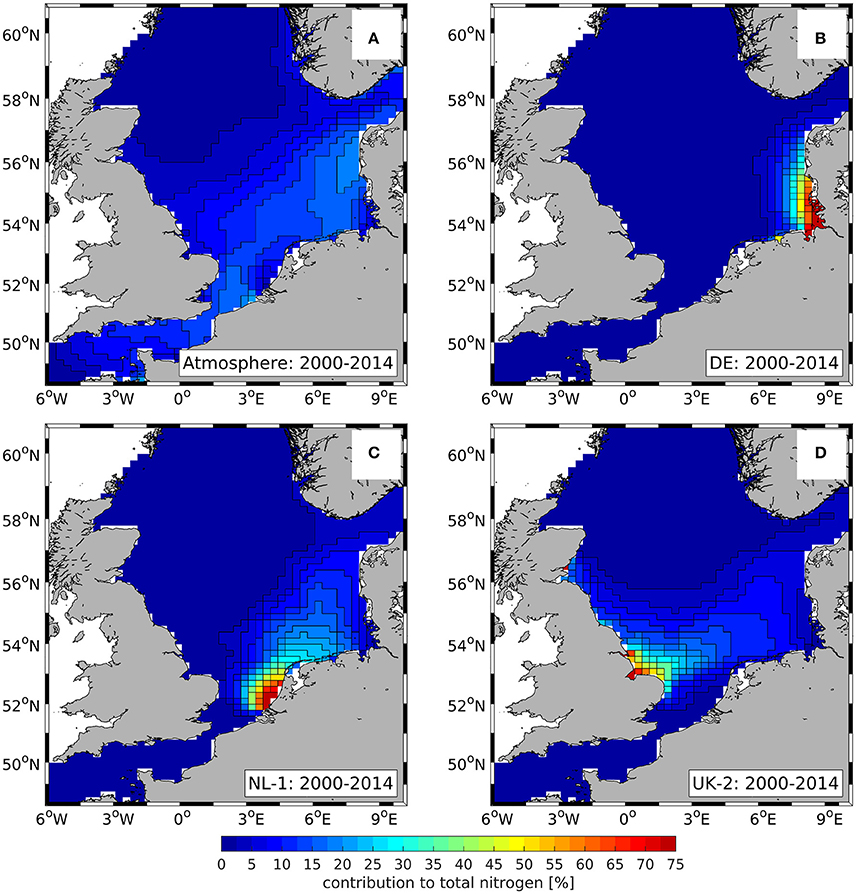
Figure 4. Spatial distribution of 15-year, water column averaged relative contributions of TN from different sources during 2000–2014: (A) atmosphere, (B) German rivers (DE), (C) 1st group of Dutch rivers (NL-1), (D) 2nd group of British rivers (UK-2). Color scale cut at upper limit. Same color scale for all panels.
The relative contributions show that the southeastern North Sea is strongly affected by atmospheric N deposition (Figure 4A) as well as the selected riverine N sources (Figures 4B–D). In contrast, these input sources are of minor importance (<2.5%) in the entire northern and large parts of the central North Sea. In these regions, TN is dominated by the NA influence (not shown) which decreases from 100% in the off-shore regions of the northern North Sea to about 50% along the 50-m-isobath.
In the coastal northwestern North Sea, the UK-2 (see Figure 4D) and other rivers (not shown) have an increased influence. In the northeastern North Sea, the atmosphere (see Figure 4C) and the Norwegian rivers (NO; not shown) constitute relevant contributions besides the NA contribution.
The atmospheric contribution (Figure 4A) plays a relevant role in the southern central and southern North Sea, ranging between 5% in the southwestern North Sea and 19% near the Danish west coast. Furthermore, the contributions of the DE, NL-1, and UK-2 rivers (Figures 4B–D, respectively) to TN are high in the southern central and southern North Sea. In the vicinity of the river mouths of Rhine/Meuse (NL-1), Humber and Wash (UK-2) as well as Elbe and Weser (DE), the contributions of the corresponding rivers can reach values of almost 100%. However, their contributions decrease to <40–60% within a distance of about 100 km from each river mouth.
Though, the contribution of the NL-1 and UK-2 rivers (Figures 4C,D, respectively) extends far into the off-shore regions of the southern North Sea. The former reaches values well above 10% in almost the entire southeastern North Sea, while the latter stays well above 10% in the entire southwestern part. The DE inputs (Figure 4B) extend northward along the German and Danish west coast. This illustrates the cyclonic general circulation of the North Sea.
The relevant contributions of the selected TN sources are accompanied by a steady decrease in the NA and EC contributions (not shown) from about 60% in the off-shore parts to 5–10% in the coastal regions between the mouths of Rhine/Meuse and the Danish northwest coast.
3.1.3. Minimum Bottom O2 Concentrations
Große et al. (2016) showed that the applied model setup reproduces the main spatial and temporal features of North Sea O2, only slightly overestimating near-bottom O2 concentrations. Therefore, Figure 5 only shows the spatial distribution of the overall minimum simulated bottom O2 concentration during 2000–2014. By this, a first insight in the concurrence of N from individual input sources and low O2 concentrations is provided.
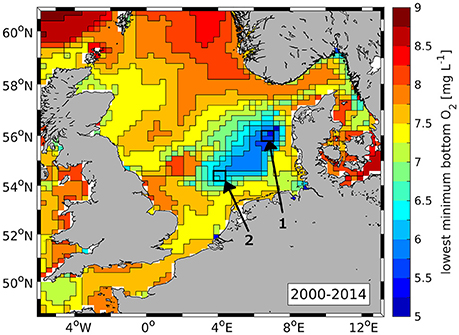
Figure 5. Spatial distribution of lowest simulated bottom O2 concentration during 2000–2014. Boxes 1 and 2 indicate regions used for the time series analyses in Section 3.2.
Lowest simulated O2 concentrations occur in the region between 54.5–56.5 °N and 4–7.5 °E. This is in good agreement with recurrent observations of O2 deficiency in this region in recent years (Figure 14 in Topcu and Brockmann, 2015). Minimum O2 concentrations of 5.2 mg O2 L−1 are found in region 1 (see Figure 5) which, therefore, is used for a detailed analysis of the O2 dynamics in relation to N inputs. Region 1 is hereafter referred to as “O2 deficiency zone” (ODZ). The comparison with the spatial patterns of TN from individual sources (see Figure 4) indicates that this region is under strong influence of the DE rivers, but also the NL-1 and UK-2 rivers. The atmosphere and the NA also play a relevant role.
Low simulated O2 concentrations also occur directly north of Dogger Bank which matches with observations (Weston et al., 2008; Greenwood et al., 2010; Queste et al., 2016). The same applies to the Oyster Grounds site (see Figure 5, region 2) where simulated minimum near-bottom concentrations yield 6–6.5 mg O2 L−1. As the Oyster Grounds are well known being susceptible to low O2 conditions (de Wilde et al., 1984; Peeters et al., 1995; Weston et al., 2008; Greenwood et al., 2010), this region is also used for a detailed analysis. At this site, the comparison with Figure 4 indicates a strong influence of the NL-1 and UK-2 rivers, and the NA (not shown). The atmospheric contribution is lower than at the ODZ site. It should be noted that the term “Oyster Grounds” used in this study refers explicitly to the defined region 2 which was chosen in relation to the study site of Greenwood et al. (2010).
3.2. O2 Consumption Related to N from Individual Sources
Based on the good agreement of the presented results with existing observations and modeling studies, the following analyses focus on the influence of N from selected input sources on near-bottom GOC.
3.2.1. Spatial Distributions
Figure 6A shows the spatial distributions of annual GOC in the model bottom layer averaged over 2000–2014. The corresponding average relative contributions related to selected N input sources are given in Figures 6B–F: (Figure 6B) boundaries (NA, EC, and BS), (Figure 6C) atmosphere, (Figure 6D) DE rivers, (Figure 6E) NL-1 rivers, and (Figure 6F) UK-2 rivers.
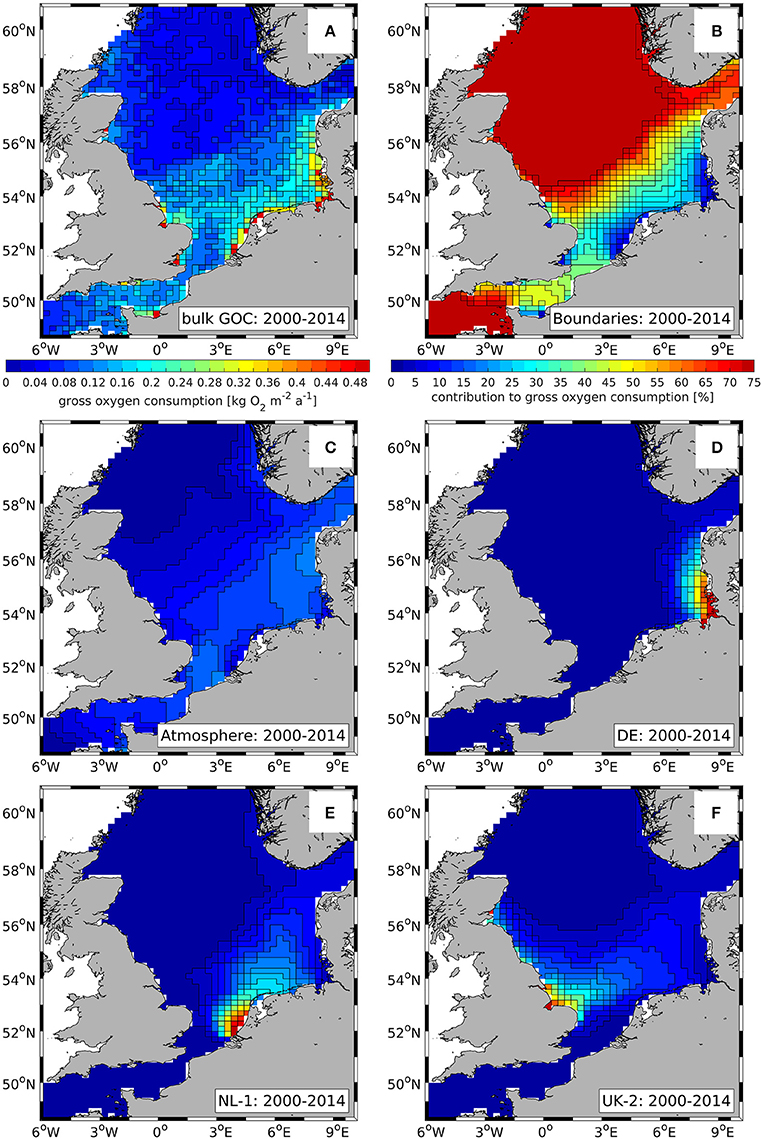
Figure 6. Spatial distribution of (A) 15-year averaged, annual near-bottom gross O2 consumption (GOC) and (B–F) average relative contributions due to N from different sources during 2000–2014: (B) boundaries (NA, EC, and BS), (C) atmosphere, (D) German rivers (DE), (E) 1st group of Dutch rivers (NL-1), (F) 2nd group of British rivers (UK-2). Both color scales cut at upper limits. Color scale of (B) also applies to (C–F).
GOC shows a general South-North gradient with high values (>0.3 kg O2 m−2 a−1) in the coastal southern North Sea and low values (<0.1 kg O2 m−2 a−1) in the deep northern parts. The lower values in the deep North Sea regions relate to lower near-surface NPP and greater bottom depths, resulting in less organic matter reaching the bottom. Highest GOC occurs in the vicinity of large river mouths (e.g., Elbe) due to riverine input of organic matter additionally enhancing local GOC. Here, values of up to about 1.3 kg O2 m−2 a−1 are simulated.
It can be seen that the coastal regions of highest GOC do not correspond to the regions of lowest bottom O2 concentrations (see Figure 5). This relates to the strong tidal mixing inhibiting long-lasting seasonal stratification which constitutes the prerequisite for the evolution of low O2 conditions (Greenwood et al., 2010; Große et al., 2016). In the off-shore regions of the southeastern North Sea average annual GOC ranges between 0.1 kg O2 m−2 a−1 and 0.2 kg O2 m−2 a−1. Here, GOC increases with decreasing water depth due to higher organic matter availability near the seafloor (Große et al., 2016).
The spatial distributions of source-specific relative contributions to GOC (see Figures 6B–F) basically represent the patterns shown for TN (see Figure 4). Thus, the input of N from the boundaries (see Figure 6B), especially the NA, dominates most off-shore regions of the North Sea, while the atmosphere and the riverine contributions from NL-1 and UK-2 (see Figures 6C,E,F, respectively) play an important role for GOC in the southern North Sea. The DE rivers' influence on GOC is confined to the German Bight and Danish west coast (see Figure 6D).
Minor differences can be seen with respect to the relative importance of the atmosphere which shows a slightly higher contribution to GOC in most off-shore areas compared to its contribution to TN. This likely relates to the stronger influence of atmospheric N deposition on NPP as deposited inorganic N is immediately available to primary producers. At river mouth locations, the corresponding river groups show slightly higher contributions to GOC than to TN which underlines the relevance of riverine organic matter for local GOC.
3.2.2. Inter-Annual Variability in the ODZ
Figure 7 provides a more detailed insight in the influence of N from individual sources on GOC in the region most susceptible to O2 deficiency. It shows the time series of average daily, near-bottom GOC at the ODZ site (see Figure 5, region 1) during the stratified period (tstrat) of the individual years 2000–2014, and average values over tstrat of the entire period. tstrat is derived from simulated T following Große et al. (2016). The entire period from the very first day of stratification until the very last day (incl. intermittences) is used for averaging. Consequently, average daily GOC provides a comparable measure for analyzing inter-annual variations in the influence of N from individual sources on the O2 dynamics, independent of the duration of seasonal stratification. For a more quantitative description, Table 3 (left-hand side) provides the corresponding average (and standard deviation) values for tstrat, average daily GOC and the relative contributions of individual N sources to average daily GOC for the entire period 2000–2014, and for the years 2002 and 2010. All values refer to a bottom layer of 6.5 m average thickness.
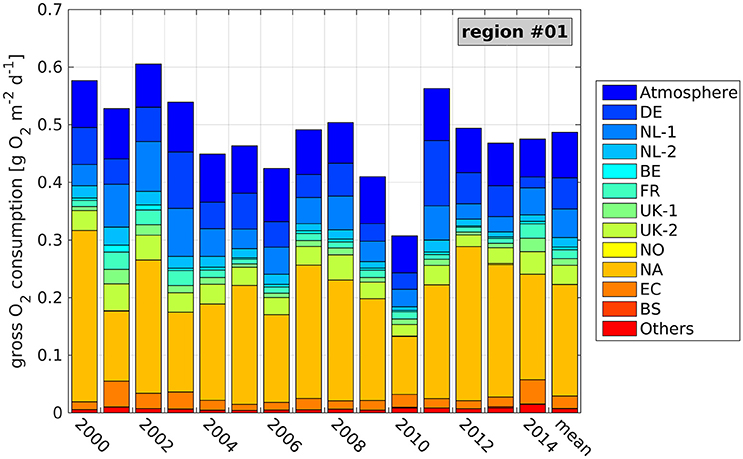
Figure 7. Average daily, near-bottom gross O2 consumption (GOC) during seasonal stratification and contributions of the different N sources (see Table 1) at the ODZ site (see Figure 5, region 1) during the individual years 2000–2014, and averaged over the entire period. Values refer to a bottom layer thickness of 6.5 m.
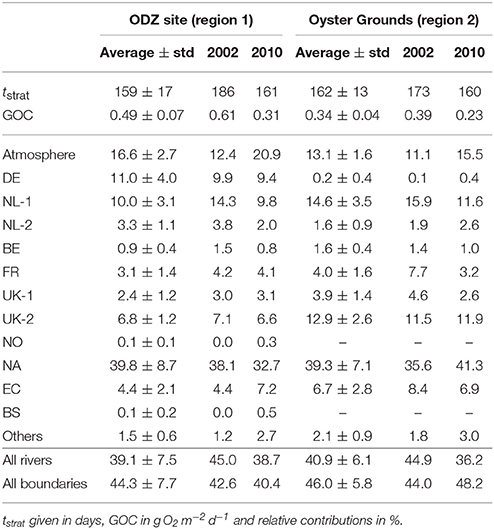
Table 3. Averages and standard deviations (std) during 2000–2014 and values for 2002 and 2010 at ODZ site and at Oyster Grounds (see Figure 5, regions 1 and 2, respectively): stratification periods [tstrat; according to Equations (1, 2) in Große et al. (2016)], daily near-bottom GOC and relative contributions of different N sources.
Figure 7 and Table 3 show that 2002 represents an exceptional year with the highest daily GOC (0.61 g O2 m−2 day−1). This high GOC coincides with the longest tstrat of 186 days, resulting in the lowest bottom O2 concentrations in the vicinity of the ODZ site in 2002 (Große et al., 2016). In contrast, 2010 constitutes the year of lowest GOC (0.31 g O2 m−2 day−1) resulting in higher bottom O2 concentrations. Interestingly, 2011 also shows high daily GOC of 0.56 g O2 m−2 day−1, though, O2 deficiency does not occur in 2011 as a result of comparably short tstrat of only 135 days (not shown). This puts emphasis on the crucial role of stratification for the evolution of O2 deficiency in the off-shore North Sea.
The NA contribution constitutes the major influence on N-related GOC at the ODZ site, with an average contribution of 39.8% to daily GOC and maximum contributions of up to 54.2%. This maximum is reached in 2000, when daily GOC reaches its second highest value of 0.58 g O2 m−2 day−1. However, it can be seen that years of high contributions by the NL-1 or DE rivers can also show very high GOC (2002 and 2011, respectively). The NL-1 contribution is highest in 2002 resulting in 15.4%, while the DE contribution is highest in 2011 (20.1%). This can be attributed to the Elbe flood in January 2011 (e.g., Kienzler et al., 2015; Mudersbach et al., 2017). Interestingly, the Elbe flood in August 2002 (Ulbrich et al., 2003; Kienzler et al., 2015; Mudersbach et al., 2017) is not reflected in a higher DE contribution in 2002, as the related loads reached the ODZ site after the growing season. However, it explains the large DE contribution of 18.2% in 2003 which is the second largest during the entire period.
The atmosphere constitutes the second largest contribution to GOC at the ODZ site, while the DE and NL-1 rivers constitute the major riverine sources yielding 11.0% and 10.0%, respectively (see Table 3). The British rivers (UK-1 and UK-2) also play a relevant role, adding up to 9.2%. The other sources are of minor importance with average contributions of <5%. However, they can show higher values during individual years (see maximum values in Table 3). The minimum–maximum ranges further indicate that especially the DE and NL-1 contributions as well as the NA contribution can show high variations between individual years. The average integrated riverine contribution to GOC of 39.1% is in the same order as the NA contribution and only about 5% less than the integrated contribution from the boundaries (NA, EC, and BS). This illustrates the great importance of riverine N inputs on O2 deficiency at the ODZ site, especially, from the German, Dutch, and British rivers.
3.2.3. Inter-Annual Variability in the Oyster Grounds
Figure 8 shows the time series of average daily, near-bottom GOC at the Oyster Grounds site (see Figure 5, region 2) analogous to Figure 7. The corresponding values are given in Table 3 (right-hand side).
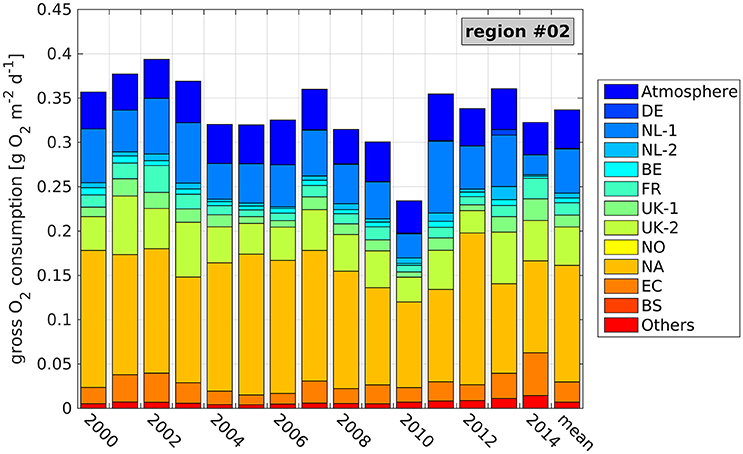
Figure 8. Average daily, near-bottom gross O2 consumption (GOC) during seasonal stratification and contributions of the different N sources (see Table 1) at the Oyster Grounds site (see Figure 5, region 2) during the individual years 2000–2014, and averaged over the entire period. Values refer to a bottom layer thickness of 5.5 m. Note different y axis compared to Figure 7.
Average daily GOC is generally lower than at the ODZ site, which only partly relates to the smaller bottom layer thickness of 5.5 m. As for the ODZ site, minimum and maximum GOC rates occur in the years 2010 (0.23 g O2 m−2 day−1) and 2002 (0.39 g O2 m−2 day−1), respectively. However, some differences between the two sites can be seen for the other years, e.g., in 2011, which constitutes the year of only seventh strongest GOC in the Oyster Grounds.
The contributions of the individual N sources to GOC reveal the causes for these regional differences. First, the DE contribution is very small in most years as the DE rivers are downstream the Oyster Grounds relative to the general circulation. Consequently, the high N inputs from these rivers in 2011 do not affect GOC in the Oyster Grounds region. Second, the absolute NA contribution, which is the largest among all contributions, is clearly lower (average of 0.13 g O2 m−2 day−1) than at the ODZ site (average of 0.19 g O2 m−2 day−1). However, the relative NA contribution is about the same as at the ODZ site (39.3%) due to the lower overall GOC. In addition, the absolute atmospheric contribution is lower in the Oyster Grounds (average of 0.04 g O2 m−2 day−1 compared to 0.06 g O2 m−2 day−1 at the ODZ site), which also results in a slightly lower relative contribution of 13.1%.
Table 3 reveals further differences for the remaining N sources compared to the ODZ site. The influence of the NL-1 and UK-2 rivers is visibly higher, yielding average relative contributions of 14.6% and 12.9%, respectively. These values correspond to a similar average absolute NL-1 contribution (0.05 g O2 m−2 day−1) as for the ODZ site and an increased average absolute contribution of the UK-2 rivers (0.04 g O2 m−2 day−1 compared to 0.03 g O2 m−2 day−1). Consequently, years of high contributions of either of the two N sources result in high GOC in the Oyster Grounds (see Figure 8; e.g., 2002, 2003, 2013). The remaining contributions are less important for GOC in the Oyster Grounds. Though, minor increases in the relative contributions can be seen in basically all contributions, except for the NL-2 and NO rivers, and the BS. This relates to the downstream locations of these sources relative to the Oyster Grounds.
The average integrated riverine contribution to N-related GOC in the Oyster Grounds adds up to 40.9%, with 30% attributed to the Dutch and British rivers. This is even higher than the NA contribution and only about 5% less than the integrated contribution from the boundaries, putting emphasis on the importance of riverine N on the O2 dynamics in the Oyster Grounds.
4. Discussion
This study, for the first time, presents a detailed quantitative analysis of the O2 dynamics of the North Sea in relation to N inputs from various external sources, including rivers, the atmosphere and adjacent seas. By this, the presented approach constitutes a valuable tool for the source-oriented approach advocated by OSPAR (1999).
There have been earlier studies on the relationship between river nutrient loads and O2 deficiency (e.g., Brockmann et al., 1988; Topcu and Brockmann, 2015). However, these studies rely on statistical analyses and the qualitative description of the interactions controlling the evolution of O2 deficiency. Other studies investigated the effect of river nutrients on the North Sea biochemistry based on nutrient reduction scenarios (e.g., Skogen et al., 2004; Lenhart et al., 2010). Though, only Lenhart et al. (2010) considered implications for the O2 conditions in the North Sea based on a model comparison.
However, these scenario-based approaches do not allow for the analysis of the current state of the ecosystem, that is represented by a reference scenario with realistic forcing data, with respect to the influence of nutrients from individual sources on the O2 dynamics. Furthermore, the assessment of the influence of individual sources would require an individual scenario for each source, which is time-consuming and costly. In contrast, the present method requires only one model simulation and one TBNT analysis dealing with all selected N input sources at once.
The source-specific information on GOC obtained from the expanded TBNT method can be used for speeding up the iterative process of finding optimal N reduction targets using the linear optimization method described by Los et al. (2014). Nevertheless, actual N reduction scenarios will still be necessary in order to assess the actual impact of the derived reductions targets, due to the non-linear ecosystem interactions.
With respect to the presented results, the simulated volume transports show good agreement with other models and literature values. The same applies to the spatial distributions of TN from individual sources which correspond to results of other North Sea TBNT studies (OSPAR, 2010; Painting et al., 2013; Troost et al., 2013), giving confidence for the applicability of a TBNT post-processing software. Consequently, the analysis of GOC related to N from these sources can be assumed to yield valid information. However, the applied model setup has some limitations which require discussion.
4.1. Limitations of the Model Forcing and Setup
The forcing provided for the different N input sources (rivers and atmosphere) has a strong influence on the results of the TBNT analysis. Although the river data is compiled to the best knowledge and represents the state of the art of North Sea river data, it is based on assumptions as a result of limited data availability. An upscaling based on the distance between gauge station and river mouth and catchment area size is applied to the British rivers (van Leeuwen, pers. comm.). Here, the uncertainty can become high in case of a large distance. In addition, for some rivers only monthly data exist which have to be interpolated to daily time series, partly with support of climatologies which may not fully represent the recent state. Furthermore, estuarine retention of N and P is not considered, although they were found to be non-negligible, e.g., in the Elbe estuary (Behrendt, 1996; Dähnke et al., 2008).
Furthermore, point sources (e.g., sewage treatment plants) in the estuaries — downstream the nutrient monitoring locations used for the load calculation (Pätsch et al., 2016) — are not considered in the river data, except for the British rivers. For the major Dutch rivers (excl. the smaller North Sea Canal) nutrient concentrations are measured right at the floodgates, i.e., point sources are implicitly considered. For the German rivers, which together with the former two are the most important riverine N sources, only limited information on point sources are available. However, Dähnke et al. (2008) found no evidence of a significant influence of point sources on concentrations in the Elbe estuary, based on stable isotope analyses. A catchment modeling study for the Weser shows that only about 0.1 kt N a−1 enter the surface waters along the Weser estuary (Heidecke et al., 2015). Hence, it can be assumed that neglecting point sources in the estuaries is a reasonable constraint.
For the atmospheric N deposition the data availability also constitutes a relevant constraint. In order to run a realistic simulation, the data needs to be provided for the entire simulation period and model domain. This can be obtained by temporal extrapolation and spatial interpolation to the model grid, based on the original N deposition data from EMEP. However, this original data as well as the spatio-temporal processing are subject to uncertainties. In this study, annual EMEP data was used, though, also monthly data are available (Desmit et al., 2015). As atmospheric N deposition in the North Sea region experiences a distinct annual cycle with higher summer and lower winter values (e.g., Neumann et al., 2016), the use of these monthly data could be worthwhile for future analyses. Differences in the applied atmospheric deposition data may also partly explain the minor differences between the results for the atmospheric contribution to TN of this study and those of Troost et al. (2013), who found a higher atmospheric contribution in the southern North Sea.
Another N-related aspect not considered in ECOHAM is the exchange between the North Sea and the Wadden Sea. Postma (1981) describe the Wadden Sea as a relevant sink for organic and source of inorganic matter. Other studies reported the Wadden Sea constitutes an important sink of N due to benthic denitrification (e.g., Kieskamp et al., 1991; van Beusekom and de Jonge, 1998; van Beusekom et al., 1999). Both would affect N availability in the open North Sea, especially, upstream of the ODZ site. Therefore, the Wadden Sea should be included in future studies.
With respect to the TBNT results, we consider the NA contribution to TN (and GOC) in the southeastern North Sea to be slightly overestimated. We conclude this from a comparison of the source-specific TN contributions of the other most relevant sources (atmosphere, DE, NL-1, and UK-2) to a box in the inner German Bight (not shown) calculated in our study with other TBNT studies on TN (e.g., OSPAR, 2010; Painting et al., 2013; Troost et al., 2013). This may relate to the limited spatial resolution of about 20 km that does not allow for the representation of sub-mesoscale features such as eddies (e.g., Johannessen et al., 1989; Røed and Fossum, 2004; Albretsen, 2007).
4.2. Limitations of the Model Intrinsics and the TBNT Method
With respect to the hydrodynamics, the component-upstream advection scheme applied by HAMSOM could be an additional cause for the overestimation of the NA contribution as it results in high numerical diffusion (Lenhart and Pohlmann, 1997). However, the identification of the actual cause goes beyond the scope of this study.
Regarding the model biogeochemistry, it should be noted that the benthic re-mineralization tends to be slightly underestimated by ECOHAM (Große et al., 2016). On the one hand, this can affect the overall GOC. On the other hand, the contributions of individual N sources to GOC may be affected as the influence of sources with high contributions to benthic re-mineralization would be amplified relative to sources with only low contributions. In addition, the rather simple sediment module does not allow for long-term storage or burial of organic matter in the sediment. However, this matches with observational studies that found burial of N and C in the North Sea sediment being only small relative to annual cycles of NPP and respiration (Wirth and Wiesner, 1988; de Haas et al., 1997; Brion et al., 2004).
In relation to the benthic processes, it should also be noted that simulated daily benthic denitrification rates in the inner German Bight are up to 4 times higher than those recently reported by Marchant et al. (2016). However, this only applies to few very near-shore areas in the model. In the off-shore regions nitrification rates range between 0.4 and 2 mmol N m−2 day−1, which is in the range they found. Hence, we rate the additional N loss in our simulation as acceptable as it only occurs in a very small region. In addition, the here applied simple benthic module only includes the effect of O2 availability in the pelagic bottom layer on benthic processes. As anoxic conditions do not occur in the pelagic North Sea, this has no effect on the benthic processes. Thus, the incorporation of a more complex benthic module, that resolves vertical O2 gradients within the sediment, would be worthwhile.
Furthermore, ECOHAM applies constant C:N:P ratios to phytoplankton, zooplankton and bacteria (Lorkowski et al., 2012; Große et al., 2016). Though, it is known that elemental ratios vary between different phytoplankton species (e.g., Geider and La Roche, 2002; Quigg et al., 2003; Malzahn et al., 2010) as well as under varying environmental conditions (e.g., Rhee, 1978; Goldman et al., 1979). In fact, different elemental ratios, e.g., in phytoplankton, would impact on the entire ecosystem including organic matter production and, thus, on the O2 dynamics. For instance, unpublished sensitivity studies showed that organic matter export below 30 m varies by up to 13% with varying stoichiometry (Redfield ± 50%). Consequently, this may slightly change the relative contributions of the different N sources to GOC in relation to temporal variability in these contributions combined with temporal variability in the elemental ratios. However, in order to assess the impact of different stoichiometry a comprehensive sensitivity analysis would be required which is beyond the scope of this study.
With respect to the expansion of TBNT by the link to the O2 cycle, the use of the mediators in case of C-based O2-affecting processes (e.g., NPP) constitutes a key element. Therefore, discussion of the constraints of this approach is required. The actual values of the C-based O2-affecting processes are proportional to the concentration of the C-based mediator state variable (see Appendix A.1–A.4). The use of the mediator implies that the concentration of the C-based mediator variable is proportional to the corresponding N-based mediator variable. This evidently can be applied in the case of a fixed C:N ratio as used for phytoplankton, zooplankton and bacteria in the present study.
Conceptually, this also holds for a varying stoichiometry as used for benthic detrital matter (i.e., sediment-N/-C) in ECOHAM. Higher concentrations of sediment-N allow for higher concentrations of sediment-C and, thus, benthic O2 consumption. However, temporal variations in the C:N ratio in benthic detrital matter in combination with temporal variations in the contributions of individual N sources to sediment-N can affect the contributions of these sources to benthic O2 consumption and, thus, to near-bottom GOC.
A quantitative analysis of this effect would require a comprehensive sensitivity study on the effect of different C:N ratios on the TBNT results. Here, we will only discuss effects of the mediator use in relation to potential event-driven changes in the C:N ratio in benthic detrital matter.
In the off-shore regions of the southern and southeastern North Sea — which are in the focus of this study — benthic organic matter originates mainly from local NPP (Große et al., 2016). Thus, organic matter input from rivers especially during the summer period does not need to be considered. Davies and Payne (1984) observed C:N ratios of 9–18 in particulate organic matter 2 m above the sea floor in the northern North Sea during the spring bloom 1976. For the southern North Sea off Belgium, Tungaraza et al. (2003) report C:N ratios of 5.7–11.2 in particulate organic matter, depending on the phytoplankton species composition. This indicates that even over short periods of time (days to weeks) C:N ratios in organic matter may vary by a factor of 2. If such short-term variations coincide with strong variations in the contributions by individual N sources to detrital matter, this may result in an under-/overestimation of the influence of individual N sources on GOC. Analogously, such effects may occur, e.g., during events of strong rainfall over sea during the growing season, which enhance wet N deposition and thereby enable new production due to increased availability (e.g., Dugdale and Goering, 1967).
Regarding the here presented analysis of source-specific GOC at the ODZ and the Oyster Grounds sites it should be noted that the C:N ratios in benthic detrital matter show only very minor variations, ranging from 7.5 to 7.9, during the growing season. As this period basically corresponds to the summer stratified period, which is in the focus of this study, the effect of changing C:N ratios on the source-specific contributions to GOC is considered to be small. However, considering model applications using variable phytoplankton stoichiometry additional efforts would be required for further improving the mediator approach. Here, it may be feasible to use the actual C:N ratios and relative contributions by the individual N sources in both, detrital matter that was previously sedimented and newly sedimented matter, as a weighing factor. By this potential errors in the current approach could be minimized.
Besides the effects of varying C:N ratios, differences in the re-mineralization rates of C (0.028 day−1) and N (0.0333 day−1) may affect the results of the expanded TBNT due to a temporal delay between C and N re-mineralization (and benthic denitrification). However, in the present study the time series of sediment-N and -C (not shown) reveal maximum temporal delays of only 2–3 days. Therefore, we consider this to have only a minor impact on the results.
In relation to the mediators, it has to be stated clearly that the results of this study can only be interpreted with respect to N, i.e., they do not reflect the overall influence of the selected input sources on the O2 dynamics. Labeling C or P from individual input sources will likely result in different relative contributions. On the one hand, this may relate to changes in the inputs by the different sources relative to each other (e.g., different ratios between P loads of individual rivers compared to N loads). On the other hand, selected processes (e.g., nitrification) cannot be considered in case of P labeling, while other processes such as P release from the sediment under anoxic conditions would play an additional role when considering P (e.g., Hupfer and Lewandowski, 2008). However, this process is not included in ECOHAM as it is designed primarily to represent the O2 cycle in relation to N and C. As N constitutes the limiting nutrient among these two with respect to organic matter production, we focused our analysis on N. In order to assess the overall impact of nutrients (i.e., N and P) from individual sources on the North Sea O2 dynamics, an analogous analysis for P would be required. However, this is beyond the scope of this study. In relation to that, it also has to be noted that the TBNT analysis does not replace actual nutrient reduction scenarios, but rather constitutes a useful tool for speeding up the iterative process of finding an optimal nutrient reduction setup (Los et al., 2014).
Furthermore, the presented method cannot be applied to formulations of benthic O2 consumption only based on the O2 concentration itself, e.g., that by Hetland and DiMarco (2008), as those cannot be linked to external nutrients.
Due to these uncertainties and constraints, we highly recommend applying the presented method to different models and model setups. This would provide a range of the contributions of the individual N sources on the O2 dynamics of the North Sea, giving a more reliable estimate of their actual influence. The only requirement for such approach is the process-based parametrization of the O2-affecting processes in that model, such that a mediator substance provides a link between the labeled element and the O2 cycle.
5. Conclusions
The here presented expansion of the TBNT method and the corresponding analysis of source-specific GOC represent the first approach for quantifying the influence of N inputs from different sources on the O2 dynamics of a marine ecosystem. Our study focused on the North Sea and our analysis constitutes a major advancement toward the source-oriented approach for the ecological management of O2 deficiency in the North Sea (OSPAR, 1999). Besides this, the described method can be applied analogously to different elements (e.g., P or C), ecosystems and models. Therefore, it could be used for the investigation of other ecosystems affected by eutrophication-related O2 deficiency, e.g., the Baltic Sea (e.g., Rosenberg, 1985) or the northern Gulf of Mexico (e.g., Rabalais and Turner, 2001).
The present analysis focused on the general spatial patterns and inter-annual variability in the regions most susceptible to O2 deficiency. Though, the applied method can also be used for analyzing the influences of individual sources of N (and other nutrients) on different time scales (days to decades).
While GOC in the northern and northern central North Sea is dominated by the N inputs from the North Atlantic, GOC in the southern central and southern North Sea is under the combined influence of the North Atlantic (NA), the English Channel (EC), the atmosphere and the large riverine N sources. Among the riverine N sources, especially, the large Dutch rivers (NL-1; incl. Rhine and Meuse) and the rivers at the British east coast (UK-2) have a relevant influence on GOC in the off-shore regions of the southern North Sea, while the German rivers dominate the southeastern coastal North Sea.
The analysis of GOC at the two study sites confirmed that seasonal stratification constitutes the prerequisite for the evolution of O2 deficiency in the off-shore regions of the southern North Sea (Große et al., 2016). It further revealed that riverine N inputs play a major role for the bottom O2 dynamics, with average relative contributions of about 40% during 2000–2014. Depending on their timing, flood events in the German or Dutch rivers can increase the riverine contribution to even more than 50%. In addition, atmospheric N contributes about 15% to the overall GOC at both sites. As riverine and atmospheric inputs are strongly anthropogenically affected (Paerl, 1997; Schöpp et al., 2003) this emphasizes the large human impact on the O2 conditions in the North Sea regions most susceptible to O2 deficiency.
Consequently, thoroughly defined riverine N reductions, e.g., under the European Union's Water Framework Directive (EU, 2000) likely constitute a potent means for improving the O2 conditions in the southern North Sea. In combination with potential future reductions in atmospheric N deposition — as adopted within the Gothenburg Protocol (UNESC, 1999) — such reductions may improve the North Sea O2 conditions or mitigate potential negative effects of climate change.
In this context it is important to note that also future changes in the physical environment, e.g., in stratification or seawater T, will have a relevant impact on the O2 conditions of the North Sea as they play a key role in the O2 dynamics (Greenwood et al., 2010; Große et al., 2016). However, our results emphasize that future scenarios for the North Sea require realistic estimates for both, the climatic conditions and the riverine and atmospheric N loads in order to provide a likely picture of the future North Sea O2 conditions.
Author Contributions
The original manuscript was conceptualized and set up by FG and H-JL. The simulations were set up and conducted jointly by FG, MK, and JP. All analyses were conducted by FG. All authors contributed equally to the reworking of the original manuscript toward the submitted version.
Funding
This study received funding from the German Environmental Protection Agency (UBA), in the frame of the project “Implementation of Descriptor 5 Eutrophication to the “MSFD”, SN: 3713225221, and the Cluster of Excellence “CliSAP” (EXC177), Universität Hamburg, funded by the German Science Foundation (DFG).
Conflict of Interest Statement
The authors declare that the research was conducted in the absence of any commercial or financial relationships that could be construed as a potential conflict of interest.
Acknowledgments
We thank the three reviewers for their helpful comments and constructive criticism on the original manuscript. We would like to thank Sonja van Leeuwen from Cefas for providing freshwater discharge and nutrient load data for the major rivers across Europe. We further thank Jerzy Bartnicki from EMEP for providing atmospheric N deposition data. The model simulations were conducted on “Mistral,” the Atos bullx DLC B700 mainframe at the German Climate Computing Center (DKRZ) in Hamburg. The methods used in this study were published as part of the dissertation by Große (2017).
Supplementary Material
The Supplementary Material for this article can be found online at: https://www.frontiersin.org/articles/10.3389/fmars.2017.00383/full#supplementary-material
References
Albretsen, J. (2007). The impact of freshwater discharges on the ocean circulation in the Skagerrak/northern North Sea area. Part II: energy analysis. Ocean Dynam. 57, 287–304. doi: 10.1007/s10236-007-0121-6
Arakawa, A., and Lamb, V. (1977). “Computational design of the basic dynamical processes of the {UCLA} general circulation model,” in General Circulation Models of the Atmosphere, Vol. 17, Methods in Computational Physics: Advances in Research and Applications, ed J. Chang (London: Elsevier), 173–265.
Artioli, Y., Friedrich, J., Gilbert, A., McQuatters-Gollop, A., Mee, L., Vermaat, J., et al. (2008). Nutrient budgets for European seas: a measure of the effectiveness of nutrient reduction policies. Mar. Pollut. Bull. 56, 1609–1617. doi: 10.1016/j.marpolbul.2008.05.027
Azam, F., Fenchel, T., Field, J., Gray, J., Meyer-Reil, L., and Thingstad, F. (1983). The ecological role of water-column microbes in the sea. Mar. Ecol. Prog. Ser. 10, 257–263. doi: 10.3354/meps010257
Backhaus, J. (1985). A three-dimensional model for the simulation of shelf sea dynamics. Ocean Dynam. 38, 165–187. doi: 10.1007/BF02328975
Backhaus, J., and Hainbucher, D. (1987). A finite difference general circulation model for shelf seas and its application to low frequency variability on the North European Shelf. Elsev. Oceanogr. Ser. 45, 221–244. doi: 10.1016/S0422-9894(08)70450-1
Behrendt, H. (1996). Inventories of point and diffuse sources and estimated nutrient loads – a comparison for different river basins in Central Europe. Water Sci. Technol. 33, 99–107.
Blauw, A., van de Wolfshaar, K., and Meuwese, H. (2006). Transboundary nutrient transports in the North Sea. WL|Delft Hydraulics Reports, Z4188 (Accessed Sep 16, 2016).
Brion, N., Baeyens, W., de Galan, S., Elskens, M., and Laane, R. (2004). The North Sea: source or sink for nitrogen and phosphorus to the Atlantic Ocean? Biogeochemistry 68, 277–296. doi: 10.1023/B:BIOG.0000031041.38663.aa
Brockmann, U., Billen, G., and Gieskes, W. (1988). “North Sea Nutrients and Eutrophication,” in Pollution of the North Sea: An Assessment, eds W. Salomons, B. Bayne, E. Duursma, and U. Förstner (Berlin; Heidelberg: Springer), 348–389.
Brockmann, U., and Eberlein, K. (1986). “River input of nutrients into the German Bight,” in The Role of Freshwater Outflow in Coastal Marine Ecosystems, ed S. Stig (Berlin; Heidelberg: Springer), 231–240.
Chen, X., Liu, C., O'Driscoll, K., Mayer, B., Su, J., and Pohlmann, T. (2013). On the nudging terms at open boundaries in regional ocean models. Ocean Model. 66, 14–25. doi: 10.1016/j.ocemod.2013.02.006
Claussen, U., Zevenboom, W., Brockmann, U., Topcu, D., and Bot, P. (2009). Assessment of the eutrophication status of transitional, coastal and marine waters within OSPAR. Hydrobiologia 629, 49–58. doi: 10.1007/s10750-009-9763-3
Conkright, M. E., Locarnini, R. A., Garcia, H. E., O'Brien, T. D., Boyer, T. P., and Stephens, C. (2002). World Ocean Atlas 2001: Objective Analyses, Data Statistics, and Figures: CD-ROM Documentation. (Accessed on November 16, 2016)
Dähnke, K., Bahlmann, E., and Emeis, K. (2008). A nitrate sink in estuaries? An assessment by means of stable nitrate isotopes in the Elbe estuary. Limnol. Oceanogr. 53, 1504–1511. doi: 10.4319/lo.2008.53.4.1504
Danielssen, D., Edler, L., Fonselius, S., Hernroth, L., Ostrowski, M., Svendsen, E., and Talpsepp, L. (1997). Oceanographic variability in the Skagerrak and northern Kattegat, May–June, 1990. ICES J. Mar. Sci. 54, 753–773. doi: 10.1006/jmsc.1996.0210
Davies, J., and Payne, R. (1984). Supply of organic matter to the sediment in the northern North Sea during a spring phytoplankton bloom. Mar. Biol. 78, 315–324. doi: 10.1007/BF00393017
de Haas, H., Boer, W., and van Weering, T. (1997). Recent sedimentation and organic carbon burial in a shelf sea: the North Sea. Mar. Geol. 144, 131–146. doi: 10.1016/S0025-3227(97)00082-0
de Wilde, P., Berghuis, E., and Kok, A. (1984). Structure and energy demand of the benthic community of the oyster ground, central north sea. Neth. J. Sea Res. 18, 143–159. doi: 10.1016/0077-7579(84)90029-2
Desmit, X., Lacroix, G., Dulière, V., Lancelot, C., Gypens, N., Ménesguen, A., et al. (2015). Ecosystem models as support to eutrophication management in the North Atlantic OCean. (EMoSEM) Final report. (Accessed on January 11, 2017).
Díaz, R., and Rosenberg, R. (1995). Marine benthic hypoxia: a review of its ecological effects and the behavioural responses of benthic macrofauna. Oceanogr. Mar. Biol. 33, 245–03.
Dugdale, R., and Goering, J. (1967). Uptake of new and regenerated forms of nitrogen in primary productivity. Limnol. Oceanogr. 12, 196–206. doi: 10.4319/lo.1967.12.2.0196
EU (2000). Directive 2000/60/EC of the European Parliament and of the Council of 23 October 2000 Establishing a Framework for Community Action in the Field of Water Policy, Vol. 43. Brussels. (Accessed on January 04, 2017).
Fennel, K., Wilkin, J., Levin, J., Moisan, J., O'Reilly, J., and Haidvogel, D. (2006). Nitrogen cycling in the Middle Atlantic bight: results from a three-dimensional model and implications for the North Atlantic nitrogen budget. Glob. Biogeochem. Cycles:GB3007. doi: 10.1029/2005GB002456
Friedrich, J., Janssen, F., Aleynik, D., Bange, H., Boltacheva, N., Çagatay, M., et al. (2014). Investigating hypoxia in aquatic environments: diverse approaches to addressing a complex phenomenon. Biogeosciences 11, 1215–1259. doi: 10.5194/bg-11-1215-2014
Geider, R., and La Roche, J. (2002). Redfield revisited: variability of C:N:P in marine microalgae and its biochemical basis. Eur. J. Phycol. 37, 1–17. doi: 10.1017/S0967026201003456
Goldman, J., McCarthy, J., and Peavey, D. (1979). Growth rate influence on the chemical composition of phytoplankton in oceanic waters. Nature 279:1. doi: 10.1038/279210a0
Gray, J., Wu, R., and Or, Y. (2002). Effects of hypoxia and organic enrichment on the coastal marine environment. Mar. Ecol. Prog. Ser. 238, 249–279. doi: 10.3354/meps238249
Greenwood, N., Parker, E., Fernand, L., Sivyer, D., Weston, K., Painting, S., et al. (2010). Detection of low bottom water oxygen concentrations in the North Sea; implications for monitoring and assessment of ecosystem health. Biogeosciences 7, 1357–1373. doi: 10.5194/bg-7-1357-2010
Gröger, M., Maier-Reimer, E., Mikolajewicz, U., Moll, A., and Sein, D. (2013). NW European shelf under climate warming: implications for open ocean-shelf exchange, primary production, and carbon absorption. Biogeosciences 10, 3767–3792. doi: 10.5194/bg-10-3767-2013
Große, F. (2017). The Influence of Nitrogen Inputs on the Oxygen Dynamics of the North Sea. Ph.D. thesis, Universität Hamburg, Hamburg. Available online at: http://ediss.sub.uni-hamburg.de/volltexte/2017/8524
Große, F., Greenwood, N., Kreus, M., Lenhart, H.-J., Machoczek, D., Pätsch, J., et al. (2016). Looking beyond stratification: a model-based analysis of the biological drivers of oxygen deficiency in the North Sea. Biogeosciences 13, 2511–2535. doi: 10.5194/bg-13-2511-2016
Heidecke, C., Hirt, U., Kreins, P., Kuhr, P., Kunkel, R., Mahnkopf, J., et al. (2015). Endbericht zum Forschungsprojekt “Entwicklung eines Instrumentes für ein flussgebietsweites Nährstoffmanagement in der Flussgebietseinheit Weser” AGRUM+-Weser. Thünen Report 21, Johann Heinrich von Thünen-Institut, Braunschweig.
Hetland, R., and DiMarco, S. (2008). How does the character of oxygen demand control the structure of hypoxia on the Texas–Louisiana continental shelf? J. Mar. Syst. 70, 49–62. doi: 10.1016/j.jmarsys.2007.03.002
Hupfer, M., and Lewandowski, J. (2008). Oxygen Controls the phosphorus release from lake sediments – a long-lasting paradigm in limnology. Int. Rev. Hydrobiol. 93, 415–432. doi: 10.1002/iroh.200711054
ICG-EMO (2009). ICG-EMO 3rd OSPAR Workshop User Guide. Brussels: Intersessional Correspondence Group on Eutrophication Modelling.
ICNS-2 (1988). Second international conference on the protection of the North Sea: ministerial declaration calling for reduction of pollution. Int. Legal Mater. 27, 835–848.
Johannessen, J., Sandven, S., Lygre, K., Svendsen, E., and Johannessen, O. (1989). Three-dimensional structure of mesoscale eddies in the Norwegian Coastal Current. J. Phys. Oceanogr. 19, 3–19. doi: 10.1175/1520-0485(1989)019<0003:TDSOME>2.0.CO;2
Kalnay, E., Kanamitsu, M., Kistler, R., Collins, W., Deaven, D., Gandin, L., et al. (1996). The NCEP/NCAR 40-year reanalysis project. B. Am. Meteorol. Soc. 77, 437–471. doi: 10.1175/1520-0477(1996)077<0437:TNYRP>2.0.CO;2
Kienzler, S., Pech, I., Kreibich, H., Müller, M., and Thieken, A. (2015). After the extreme flood in 2002: changes in preparedness, response and recovery of flood-affected residents in Germany between 2005 and 2011. Nat. Hazard. Earth Sys. 15, 505–526. doi: 10.5194/nhess-15-505-2015
Kieskamp, W., Lohse, L., Epping, E., and Helder, W. (1991). Seasonal variation in denitrification rates and nitrous oxide fluxes in intertidal sediments of the western Wadden Sea. Mar. Ecol. Prog. Ser. 72, 145–151. doi: 10.3354/meps072145
Kistler, R., Collins, W., Saha, S., White, G., Woollen, J., Kalnay, E., et al. (2001). The NCEP-NCAR 50-year reanalysis: monthly means CD-ROM and documentation. Am. Meteorol. Soc. 82, 247–267. doi: 10.1175/1520-0477(2001)082<0247:TNNYRM>2.3.CO;2
Kühn, W., Pätsch, J., Thomas, H., Borges, A., Schiettecatte, L.-S., Bozec, Y., et al. (2010). Nitrogen and carbon cycling in the North Sea and exchange with the North Atlantic–A model study, Part II: carbon budget and fluxes. Cont. Shelf Res. 30, 1701–1716. doi: 10.1016/j.csr.2010.07.001
Lacroix, G., Ruddick, K., Gypens, N., and Lancelot, C. (2007). Modelling the relative impact of rivers (Scheldt/Rhine/Seine) and Western Channel waters on the nutrient and diatoms/Phaeocystis distributions in Belgian waters (Southern North Sea). Cont. Shelf Res. 27, 1422–1446. doi: 10.1016/j.csr.2007.01.013
Lenhart, H.-J., Mills, D., Baretta-Bekker, H., van Leeuwen, S., van der Molen, J., Baretta, J., et al. (2010). Predicting the consequences of nutrient reduction on the eutrophication status of the North Sea. J. Mar. Syst. 81, 148–170. doi: 10.1016/j.jmarsys.2009.12.014
Lenhart, H.-J., and Pohlmann, T. (1997). The ICES-boxes approach in relation to results of a North Sea circulation model. Tellus A 49, 139–160. doi: 10.3402/tellusa.v49i1.12217
Liebig, J. (1841). Die Organische Chemie in ihrer Anwendung auf Agricultur und Physiologie. F. Vieweg und Sohn. Braunschweig. (Accessed on January 17, 2017).
Lorkowski, I., Pätsch, J., Moll, A., and Kühn, W. (2012). Interannual variability of carbon fluxes in the North Sea from 1970 to 2006 – Competing effects of abiotic and biotic drivers on the gas-exchange of CO2. Estuar. Coast. Shelf Sci. 100, 38–57. doi: 10.1016/j.ecss.2011.11.037
Los, F., Troost, T., and van Beek, J. (2014). Finding the optimal reduction to meet all targets – applying Linear Programming with a nutrient tracer model of the North Sea. J. Mar. Syst. 131, 91–101. doi: 10.1016/j.jmarsys.2013.12.001
Malzahn, A., Hantzsche, F., Schoo, K. L., Boersma, M., and Aberle, N. (2010). Differential effects of nutrient-limited primary production on primary, secondary or tertiary consumers. Oecologia 162, 35–48. doi: 10.1007/s00442-009-1458-y
Marchant, H., Holtappels, M., Lavik, G., Ahmerkamp, S., Winter, C., and Kuypers, M. (2016). Coupled nitrification–denitrification leads to extensive N loss in subtidal permeable sediments. Limnol. Oceanogr. 61, 1033–1048. doi: 10.1002/lno.10271
Mathis, M., and Pohlmann, T. (2014). Projection of physical conditions in the North Sea for the 21st century. Clim. Res. 61, 1–17. doi: 10.3354/cr01232
Ménesguen, A., Cugier, P., and Leblond, I. (2006). A new numerical technique for tracking chemical species in a multi-source, coastal ecosystem, applied to nitrogen causing Ulva blooms in the Bay of Brest (France). Limnol. Oceanogr. 51, 591–601. doi: 10.4319/lo.2006.51.1_part_2.0591
Ménesguen, A., and Hoch, T. (1997). Modelling the biogeochemical cycles of elements limiting primary production in the English Channel. I. Role of thermohaline stratification. Mar. Ecol. Prog. Ser. 146, 173–188. doi: 10.3354/meps146173
Mudersbach, C., Bender, J., and Netzel, F. (2017). An analysis of changes in flood quantiles at the gauge Neu Darchau (Elbe River) from 1875 to 2013. Stoch. Env. Res. Risk Assess. 31, 145–157. doi: 10.1007/s00477-015-1173-7
Müller, L. (2008). Sauerstoffdynamik der Nordsee — Untersuchungen mit einem drei-dimensionalen Ökosystemmodell. Ph.D. thesis, Universität Hamburg. Available online at: http://ediss.sub.uni-hamburg.de/volltexte/2008/3663/pdf/LM-Doktorarbeit_19.03.08.pdf (Accessed on November 20, 2017).
Neumann, D., Matthias, V., Bieser, J., Aulinger, A., and Quante, M. (2016). Sensitivity of modeled atmospheric nitrogen species and nitrogen deposition to variations in sea salt emissions in the North Sea and Baltic Sea regions. Atmos. Chem. Phys. 16, 2921–2942. doi: 10.5194/acp-16-2921-2016
Neumann, T. (2000). Towards a 3D-ecosystem model of the Baltic Sea. J. Mar. Syst. 25, 405–419. doi: 10.1016/S0924-7963(00)00030-0
Neumann, T. (2007). The fate of river-borne nitrogen in the Baltic Sea–An example for the River Oder. Estuar. Coast. Shelf Sci. 73, 1–7. doi: 10.1016/j.ecss.2006.12.005
OSPAR (1999). Strategy to Combat Eutrophication, Reference number: 1998–18. London: OSPAR Commission, (Accessed on January 23, 2017).
OSPAR (2003). OSPAR Integrated Report 2003 on the Eutrophication Status of the OSPAR Maritime Area Based Upon the First Application of the Comprehensive Procedure. London: OSPAR Commission. (Accessed on January 05, 2017).
OSPAR (2010). Results of the 2009 ICG-EMO Workshop on transboundary nutrient transport, vol. 540/2011. London: OSPAR Commission.
OSPAR (2013). Riverine Inputs and Direct Discharges to Convention Waters – Contracting Parties' RID 2011 Data Report, vol. 598/2013. London: OSPAR Commission. (Accessed on January 04, 2017).
Otto, L., Zimmerman, J., Furnes, G., Mork, M., Saetre, R., and Becker, G. (1990). Review of the physical oceanography of the North Sea. Neth. J. Sea Res. 26, 161–238. doi: 10.1016/0077-7579(90)90091-T
Ozer, J. (2011). Model to Model Comparison of Transports Through North Sea Transects. Brussels: North West Shelf Operational Oceanographic System (NOOS). (Accessed on November 04, 2016).
Paerl, H. (1997). Coastal eutrophication and harmful algal blooms: Importance of atmospheric deposition and groundwater as “new” nitrogen and other nutrient sources. Limnol. Oceanogr. 42, 1154–1165. doi: 10.4319/lo.1997.42.5_part_2.1154
Painting, S., Foden, J., Forster, R., van der Molen, J., Aldridge, J., Best, M., et al. (2013). Impacts of climate change on nutrient enrichment. Mar. Clim. Change Impacts Partnership. 219–235. doi: 10.14465/2013.arc23.219-235
Pätsch, J., and Kühn, W. (2008). Nitrogen and carbon cycling in the North Sea and exchange with the North Atlantic–A model study. Part I. Nitrogen budget and fluxes. Cont. Shelf Res. 28, 767–787. doi: 10.1016/j.csr.2007.12.013
Pätsch, J., Lenhart, H.-J., and Schütt, M. (2016). Daily Loads of Nutrients, Total Alkalinity, Dissolved Inorganic Carbon and Dissolved Organic Carbon of the European Continental Rivers for the Years 1977–2014. Technical Report, Institut fü| Meereskunde, Universität. Hamburg.
Paulmier, A., Kriest, I., and Oschlies, A. (2009). Stoichiometries of remineralisation and denitrification in global biogeochemical ocean models. Biogeosciences 6, 923–935. doi: 10.5194/bg-6-923-2009
Peeters, J., Los, F., Jansen, R., Haas, H., Peperzak, L., and de Vries, I. (1995). The oxygen dynamics of the Oyster Ground, North Sea. Impact of eutrophication and environmental conditions. Ophelia 42, 257–288. doi: 10.1080/00785326.1995.10431508
Perrot, T., Rossi, N., Ménesguen, A., and Dumas, F. (2014). Modelling green macroalgal blooms on the coasts of Brittany, France to enhance water quality management. J. Mar. Syst. 132, 38–53. doi: 10.1016/j.jmarsys.2013.12.010
Philipp, A., Kerl, F., and Müller, U. (2015). Ansprüche potenzieller Nutzer an ein Hochwasser-Frühwarnsystem für Sachsen. Hydrol. Wasserbewirts. 1, 4–22. doi: 10.5675/HyWa_2015.1_1
Pohlmann, T. (1991). Untersuchung hydro- und Thermodynamischer Prozesse in der Nordsee mit einem Dreidimensionalen Numerischem Modell. Berichte aus dem Zentrum für Meeres- und Klimaforschung, Ph.D. Thesis. Reihe B(Nr. 23).
Pohlmann, T. (1996). Predicting the thermocline in a circulation model of the North Sea - Part I: model description, calibration and verification. Cont. Shelf Res. 16, 131–146. doi: 10.1016/0278-4343(95)90885-S
Pohlmann, T. (2006). A meso-scale model of the central and southern North Sea: consequences of an improved resolution. Cont. Shelf Res. 26, 2367–2385. doi: 10.1016/j.csr.2006.06.011
Pohlmann, T., and Puls, W. (1994). “Currents and Transport in Water,” in Circulation and Contaminant Fluxes in the North Sea, ed J. Sündermann (Berlin; Heidelberg: Springer), 345–402.
Postma, H. (1981). Exchange of materials between the North Sea and the Wadden Sea. Mar. Geol. 40, 199–213. doi: 10.1016/0025-3227(81)90050-5
Queste, B., Fernand, L., Jickells, T., Heywood, K., and Hind, A. (2016). Drivers of summer oxygen depletion in the central North Sea. Biogeosciences 13, 1209–1222. doi: 10.5194/bg-13-1209-2016
Quigg, A., Finkel, Z., Irwin, A., Rosenthal, Y., Ho, T.-Y., Reinfelder, J., et al. (2003). The evolutionary inheritance of elemental stoichiometry in marine phytoplankton. Nature 425, 291–294. doi: 10.1038/nature01953
Rabalais, N., and Turner, R. (2001). Hypoxia in the Northern Gulf of Mexico: Description, Causes and Change, Washington, DC: Coastal and Estuarine Studies. American Geophysical Union, 1–36
Rabalais, N., Turner, R., and Scavia, D. (2002). Beyond Science into Policy: gulf of Mexico Hypoxia and the Mississippi River. BioScience 52, 129–142. doi: 10.1641/0006-3568(2002)052[0129:BSIPGO]2.0.CO;2
Rachor, E., and Albrecht, H. (1983). Sauerstoffmangel im Bodenwasser der Deutschen Bucht, Vol. 19. Bremerhaven: Veröfflichungen des Instituts für Meeresforschung.
Radtke, H. (2012). Einfluss biologischer Prozesse auf die Ausbreitungswege von Nährstoffen in der Ostsee. Ph.D. thesis, Universität Rostock. (Accessed on September 16, 2017).
Radtke, H., and Maar, M. (2016). Estimating the effective nitrogen import: an example for the North Sea-Baltic Sea boundary. J. Geophys. Res. Biogeo. 121, 2562–2575. doi: 10.1002/2016JG003516
Radtke, H., Neumann, T., Voss, M., and Fennel, W. (2012). Modeling pathways of riverine nitrogen and phosphorus in the Baltic Sea. J. Geophys. Res. Oceans 117, 1–15. doi: 10.1029/2012JC008119
Redfield, A. (1934). On the Proportions of Organic Derivatives in Sea Water and Their Relation to the Composition of Plankton. University Press of Liverpool. (Accessed on October 16, 2017).
Rhee, G.-Y. (1978). Effects of N:P atomic ratios and nitrate limitation on algal growth, cell composition, and nitrate uptake. Limnol. Oceanogr. 23, 10–25. doi: 10.4319/lo.1978.23.1.0010
Rodhe, J. (1996). On the dynamics of the large-scale circulation of the Skagerrak. J. Sea Res. 35, 9–21. doi: 10.1016/S1385-1101(96)90731-5
Røed, L., and Fossum, I. (2004). Mean and eddy motion in the Skagerrak/northern North Sea: insight from a numerical model. Ocean Dynam. 54, 197–220. doi: 10.1007/s10236-003-0076-1
Rosenberg, R. (1985). Eutrophication – the future marine coastal nuisance? Mar. Pollut. Bull. 16, 227–231. doi: 10.1016/0025-326X(85)90505-3
Rosenberg, R., Hellman, B., and Johansson, B. (1991). Hypoxic tolerance of marine benthic fauna. Mar. Ecol. Prog. Ser. 79, 127–131. doi: 10.3354/meps079127
Rydberg, L., Haamer, J., and Liungman, O. (1996). Fluxes of water and nutrients within and into the Skagerrak. J. Sea Res. 35, 23–38. doi: 10.1016/S1385-1101(96)90732-7
Schöpp, W., Posch, M., Mylona, S., and Johansson, M. (2003). Long-term development of acid deposition (1880–2030) in sensitive freshwater regions in Europe. Hydrol. Earth Syst. Sci. 7, 436–446. doi: 10.5194/hess-7-436-2003
Seitzinger, S., and Giblin, A. (1996). Estimating denitrification in North Atlantic continental shelf sediments. Biogeochemistry 35, 235–260. doi: 10.1007/BF02179829
Skogen, M., Søiland, H., and Svendsen, E. (2004). Effects of changing nutrient loads to the North Sea. J. Marine Syst. 46, 23–38. doi: 10.1016/j.jmarsys.2003.11.013
Steele, J. (1962). Environmental control of photosynthesis in the sea. Limnol. Oceanogr. 7, 137–150. doi: 10.4319/lo.1962.7.2.0137
Sterner, R., and Elser, J. (2002). Ecological Stoichiometry: The Biology of Elements from Molecules to the Biosphere. Princeton University Press.
Timmermann, K., Markager, S., and Gustafsson, K. (2010). Streams or open sea? Tracing sources and effects of nutrient loadings in a shallow estuary with a 3D hydrodynamic–ecological model. J. Mar. Syst. 82, 111–121. doi: 10.1016/j.jmarsys.2010.04.008
Topcu, D., Brockmann, U., and Claussen, U. (2009). Relationship between eutrophication reference conditions and boundary settings considering OSPAR recommendations and the Water Framework Directive – examples from the German Bight. Hydrobiologia 629, 91–106. doi: 10.1007/s10750-009-9778-9
Topcu, H., and Brockmann, U. (2015). Seasonal oxygen depletion in the north sea, a review. Mar. Pollut. Bull. 99, 5–27. doi: 10.1016/j.marpolbul.2015.06.021
Troost, T., Blaas, M., and Los, F. (2013). The role of atmospheric deposition in the eutrophication of the North Sea: a model analysis. J. Marine Syst. 125, 101–112. doi: 10.1016/j.jmarsys.2012.10.005
Tungaraza, C., Rousseau, V., Brion, N., Lancelot, C., Gichuki, J., Baeyens, W., et al. (2003). Contrasting nitrogen uptake by diatom and Phaeocystis-dominated phytoplankton assemblages in the North Sea. J. Exp. Mar. Biol. Ecol. 292, 19–41. doi: 10.1016/S0022-0981(03)00145-X
Tyson, R., and Pearson, T. (1991). Modern and ancient continental shelf anoxia: an overview. Geol. Soc. Lond. Spec. Publ. 58, 1–24. doi: 10.1144/GSL.SP.1991.058.01.01
Ulbrich, U., Brücher, T., Fink, A., Leckebusch, G., Krüger, A., and Pinto, J. (2003). The central European floods of August 2002: Part 1 – Rainfall periods and flood development. Weather 58, 371–377. doi: 10.1256/wea.61.03A
UNESC (1999). Protocol to the 1979 Convention on Long-range Transboundary Air Pollution to Abate Acidification, Eutrophication and Ground-level Ozone. Gothenburg: United Nations (Accessed on January 09, 2017).
van Beusekom, J., Brockmann, U., Hesse, K.-J., Hickel, W., Poremba, K., and Tillmann, U. (1999). The importance of sediments in the transformation and turnover of nutrients and organic matter in the Wadden Sea and German Bight. Deutsch. Hydrografische Z. 51, 245–266. doi: 10.1007/BF02764176
van Beusekom, J., and de Jonge, V. (1998). Retention of phosphorus and nitrogen in the Ems estuary. Estuaries 21, 527–539. doi: 10.2307/1353292
Vaquer-Sunyer, R., and Duarte, C. (2008). Thresholds of hypoxia for marine biodiversity. Proc. Natl. Acad. Sci. U.S.A. 105, 15452–15457. doi: 10.1073/pnas.0803833105
von Westernhagen, H., and Dethlefsen, V. (1983). North Sea Oxygen Deficiency 1982 and its Effects on the Bottom Fauna. Ambio 12, 264–266.
Wanninkhof, R. (1992). Relationship between wind speed and gas exchange over the ocean. J. Geophys. Res. Oceans 97, 7373–7382. doi: 10.1029/92JC00188
Weston, K., Fernand, L., Nicholls, J., Marca-Bell, A., Mills, D., Sivyer, D., et al. (2008). Sedimentary and water column processes in the Oyster Grounds: a potentially hypoxic region of the North Sea. Mar. Environ. Res. 65, 235–249. doi: 10.1016/j.marenvres.2007.11.002
Wijsman, J., Los, H., and van Beek, J. (2004). The Filtering Capacity of an Estuary for Nutrients. WL|Delft Hydraulics Reports, Z2836:51.
Keywords: North Sea, eutrophication, nitrogen, oxygen deficiency, biogeochemical modeling, nutrient tagging, trans-boundary nutrient transports (TBNT)
Citation: Große F, Kreus M, Lenhart H-J, Pätsch J and Pohlmann T (2017) A Novel Modeling Approach to Quantify the Influence of Nitrogen Inputs on the Oxygen Dynamics of the North Sea. Front. Mar. Sci. 4:383. doi: 10.3389/fmars.2017.00383
Received: 05 September 2017; Accepted: 14 November 2017;
Published: 29 November 2017.
Edited by:
Christophe Rabouille, UMR8212 Laboratoire des Sciences du Climat et de l'Environnement (LSCE), FranceReviewed by:
Perran Cook, Monash University, AustraliaX. Antón Álvarez-Salgado, Consejo Superior de Investigaciones Científicas (CSIC), Spain
Martin Johnson, University of East Anglia, United Kingdom
Copyright © 2017 Große, Kreus, Lenhart, Pätsch and Pohlmann. This is an open-access article distributed under the terms of the Creative Commons Attribution License (CC BY). The use, distribution or reproduction in other forums is permitted, provided the original author(s) or licensor are credited and that the original publication in this journal is cited, in accordance with accepted academic practice. No use, distribution or reproduction is permitted which does not comply with these terms.
*Correspondence: Fabian Große, fabian.grosse@dal.ca