The Partitioning of Carbon Biomass among the Pico- and Nano-plankton Community in the South Brazilian Bight during a Strong Summer Intrusion of South Atlantic Central Water
 Natascha M. Bergo1
  Camila N. Signori1
  André M. Amado2,3
  Frederico P. Brandini1
  Vivian H. Pellizari1*
- 1Departamento de Oceanografia Biológica, Instituto Oceanográfico, Universidade de São Paulo, São Paulo, Brazil
- 2Departamento de Oceanografia e Limnologia, Centro de Biociências, Universidade Federal do Rio Grande do Norte, Natal, Brazil
- 3Departamento de Biologia, Instituto de Ciências Biológicas, Universidade Federal de Juiz de Fora, Juiz de Fora, Brazil
To investigate how pico- and nano-plankton respond to oceanographic conditions in the Southwestern Atlantic Ocean, we assessed the influence of a summer intrusion of the South Atlantic Central Water (SACW) on the spatial and vertical dynamics of planktonic abundance and carbon biomass across environmental gradients. Seawater samples were collected from six depths within the euphotic zone at nine oceanographic stations in a transect on the Brazilian continental shelf in January 2013. The abundance of pico- and nano-plankton populations was determined by flow cytometry, and carbon biomass was calculated based on conversion factors from the literature. The autotrophic Synechococcus spp., picoeukaryotes, and nanoeukaryotes were more abundant in the surface layers of the innermost stations influenced by Coastal Water (maximum of 1.19 × 10⁵, 1.5 × 10⁴, and 8.61 × 10³ cell·mL−1, respectively), whereas Prochlorococcus spp. dominated (max. of 6.57 × 10⁴ cell·mL−1) at the outermost stations influenced by Tropical Water and in the uplifting layers of the SACW around a depth of 100 m. Numerically, heterotrophic bacterial populations were predominant, with maximum concentrations (2.11 × 10⁶ cell·mL−1) recorded in the surface layers of the inner and mid shelves in Coastal Water and the upper limits of the SACW. Nutrient-rich (high silicate and phosphate) and relatively less saline waters enhanced the picoeukaryotic biomass, while Synechococcus and heterotrophic bacteria were linked to higher temperatures, lower salinities, and higher inputs of ammonia and dissolved organic carbon. The relative importance of each group to carbon biomass partitioning under upwelling conditions is led by heterotrophic bacteria, followed by picoeukaryotes, Synechococcus and Prochlorococcus, and when the SACW is not as influential, the relative contribution of each phytoplanktonic group is more evenly distributed. In addition to habitat preferences, the physical structure of oligotrophic waters has a large impact on the vertical and spatial distribution patterns of picoplankton, reflecting the strong effect of the SACW intrusion.
Introduction
Pico-sized plankton make a significant contribution to phytoplankton primary production and carbon cycling in the ocean (Partensky et al., 1999; Agawin et al., 2000; Bell and Kalff, 2001 and references therein). Despite their small size (0.2–2 μm) compared to other plankton, picophytoplankton (which include both prokaryotes and eukaryotes) can export a large volume of carbon from the surface to deeper layers via aggregate formation or consumption by organisms at higher trophic levels (Richardson and Jackson, 2007).
On oligotrophic shelves, picoplankton communities can play a significant trophic role because they are highly abundant under certain hydrographic conditions (Murrell and Lores, 2004; Gaulke et al., 2010). The prokaryotic component is dominated by two genera: Prochlorococcus, considered the most abundant photosynthetic organisms on the planet (Partensky et al., 1999), and Synechococcus, which have a broad geographic distribution in marine ecosystems that is normally associated with their broad genomic and phenotypic diversity (Zubkov et al., 1998; Johnson et al., 2006; Sohm et al., 2015). Cyanobacterial Prochlorococcus and Synechococcus represent ~17–39 and 49–69%, respectively, of the global picophytoplankton biomass production (Buitenhuis et al., 2012). The eukaryotic fraction of pico- and nano-plankton communities is even more diverse, comprising taxa with different physiologies and life strategies, mainly composed of Chlorophyta, Haptophyta, and Heterokontophyta (Vaulot et al., 2008).
A large portion of primary production becomes dissolved organic matter, which is almost exclusively accessible to heterotrophic prokaryotes, represented by Bacteria and Archaea. They can use a variety of biochemical strategies to decompose organic matter and assimilate dissolved organic carbon (DOC), acting as key components in the microbial loop (Azam and Malfatti, 2007; Pomeroy et al., 2007). In coastal waters, ~10–50% of the total primary production is recycled by heterotrophic prokaryotes (normally referred to as heterotrophic bacteria; Fuhrman et al., 1980), determining the balance of carbon remineralization and sequestration (Buchan et al., 2014). The remaining carbon enters the classic marine food web or is transported to the deep sea via the biological pump for long term storage (Eppley and Peterson, 1979).
The Brazilian continental shelf is predominantly autotrophic, thus acting as a sink of atmospheric CO2 (Chen, 2004). On the inner shelf of the South Brazilian Bight (SBB), the annual primary production is supported by a combination of continental runoff and regeneration of sediment nutrients. On the mid and outer shelves, the western boundary currents prevail, with an overlay of water masses that possess distinct physical and chemical characteristics (Castro et al., 2006; Longhurst, 2007) (Figure 1). The Brazil Current, which is shallow (ca. 200 m) and restricted to the shelf-break, flows southwest toward the Brazil-Malvinas Confluence Zone, and transports the warm (>20°C), saline (>36 psu) and nutrient-poor Tropical Water (TW) (Emílsson, 1961; Silveira et al., 2000). Flowing southwards, it meets the relatively less saline (< 35 psu) Coastal Water (CW), which originates on the continental shelves, influenced by riverine and estuarine inputs (Castro et al., 2006). Particularly during spring and summer, the predominant northeastern-eastern winds favor the onshore intrusion of the oceanic South Atlantic Central Water (SACW, sensu Sverdrup, 1954; see review in Castro et al., 2006) and the stratification of the water column (Castro, 2014; Cerda and Castro, 2014). This relatively cold (5–20°C) and nutrient-rich water mass fertilizes the base of the euphotic zone, forms deep chlorophyll maximum (DCM) layer, and is particularly relevant to the dynamics of planktonic communities (Brandini et al., 2014). DCM layers are evident year-round, with different thicknesses and phytoplankton communities associated with bathymetry and pycnocline depths (Castro et al., 2006; Brandini et al., 2014). The development of two main fronts, the Surface Haline Front and the Bottom Thermal Front, occurs as a direct consequence of winds and tidal forcing in the SBB. These fronts separate coastal and shelf mixed waters from the outermost stratified TW of the Brazil Current, and the mixed inner-shelf from the thermally stratified mid-shelf, respectively (sensu Castro et al., 1987). The seasonal dynamics and interactions of different water masses create frontal ecological niches in the euphotic zone of oligotrophic waters, affecting the microbial distribution. Consequently, the carbon partitioning among the different planktonic groups is altered along the shelf (Gérikas-Ribeiro et al., 2016a).
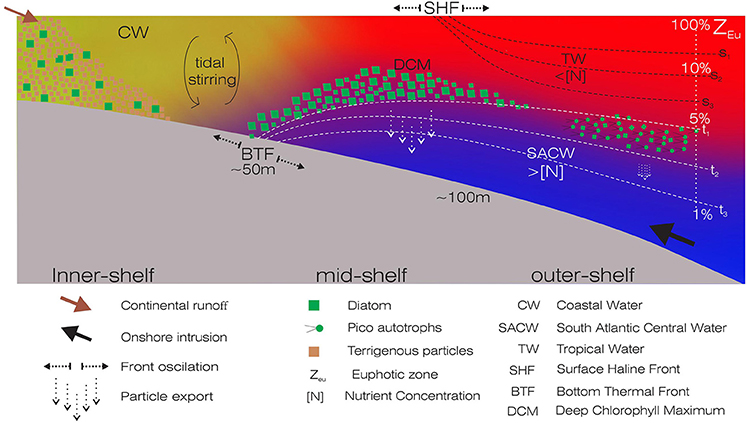
Figure 1. Schematic representation of a typical cross-shelf transect showing the positions of the Surface Haline Front (SHF) and the Bottom Thermal Front (BTF), and the associated biogeochemical processes. The overlying water masses are shown as follows: Coastal Water (CW) in yellow, Tropical Water (TW) in red, South Atlantic Central Water (SACW) in blue. Different arrows represent the continental runoff, onshore intrusion, front oscillations and particle export. Green squares and dots represent autotrophic communities. Redrawn from the Project OCEANOS/CARBOM (Environmental Characterization and Evaluation of Biogenic Ocean Resources from the Brazilian Continental Shelf and the Adjacent Oceanic Zone).
Despite increasing efforts to study microbial communities on the Brazilian continental shelf (Alves et al., 2014; Gérikas-Ribeiro et al., 2016a), the relative contribution of photoautotrophs and heterotrophic bacteria to the carbon cycle is largely unknown in terms of abundance and carbon biomass, particularly their distribution within distinct water masses in the South Atlantic. We examined the influence of the SACW summer intrusion on the spatial dynamics of abundance and carbon biomass partitioning of pico- and nano-plankton communities across environmental gradients.
Materials and Methods
Sampling Strategy
Seawater samples were collected at nine stations along a cross-shelf transect of the SBB during a summer expedition (January 2013) onboard the R/V Alpha Crucis from the University of São Paulo (IO-USP). The sampling stations were placed over the inner-, mid- and outer shelf sections of the bight, reaching up to 2,500 m (latitudes 24°35′–26°71′S and longitudes 45°78′ 46°01′W; Figures 2A,B). Six sampling depths per oceanographic station within the euphotic zone were chosen, defined using the temperature, salinity and onboard fluorimeter profiles.
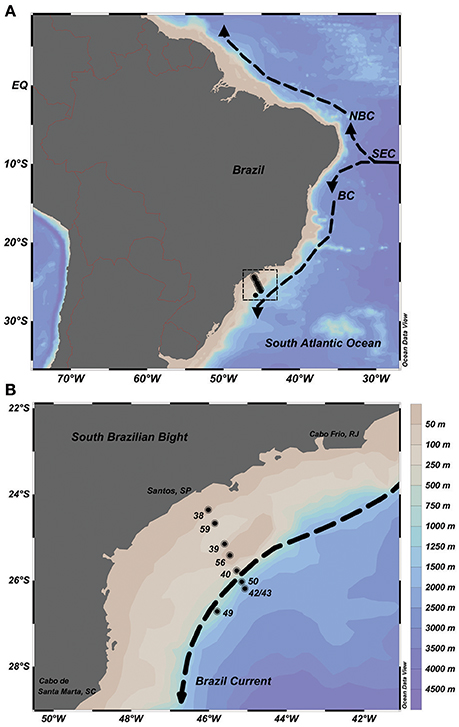
Figure 2. Sampling map on the Brazilian continental shelf, Southwestern Atlantic Ocean. (A) Basic scheme of circulation: The South Equatorial Current (SEC) bifurcates into the North Brazil Current (NBC) and the Brazil Current (BC). (B) Oceanographic stations sampled in January 2013 (black dots), bathymetry of the South Brazilian Bight and the Brazil Current flowing southward (dashed arrow).
In order to explore the oceanographic conditions and the biological responses, wind stress was plotted for the sampling period (25–31 January 2013) using the dataset “CFSv2 Operational Analysis” (Saha et al., 2014), available from the National Oceanic and Atmospheric Administration (https://www.ncdc.noaa.gov/data-access/model-data/model-datasets/climate-forecast-system-version2-cfsv2). Data of absolute geostrophic currents were obtained from the E.U. Copernicus Marine Service Information, and the “Global Ocean” dataset was selected from 15 to 30 January 2013. The product identifier was the “SEALEVEL_GLO_PHY_L4_REP_OBSERVATIONS_008_047” (http://marine.copernicus.eu/services-portfolio/access-toproducts/?option=com_csw&view=details&product_id=SEALEVEL_GLO_PHY_L4_REP_OBSERVATIONS_008_047, last accessed in June 2017).
All samples for biological and chemical analyses, in addition to physical data (temperature [°C], salinity [psu] and fluorescence [Relative Fluorescence Units; RFU]) were obtained using a combined Sea-Bird CTD/Carrousel 911 system with 12 10-L Niskin bottles and a chlorophyll-a fluorescence sensor (ECO FL). Samples for inorganic and organic nutrients were filtered through 0.22-μm filters onboard and frozen (at −20°C) until analysis (up to 30 days). Triplicate samples (1.5 ml) for flow cytometry were placed into cryovials and immediately preserved with a Sigma-Aldrich glutaraldehyde solution (0.1% of final concentration), flash-frozen in liquid nitrogen for a few minutes to fix, and stored at −80°C for 30 days until analysis.
Environmental Factors
Concentrations of inorganic nutrients (nitrate, nitrite, phosphate, and silicate) were determined using a flow injection auto-analyzer (FIAstar 5000, Foss Tecator, Denmark), after filtration through 0.22-μm filters. Samples for DOC and nitrogen (DON) were analyzed by Pt-catalyzed high-temperature combustion method in a Total Organic Analyzer (TOC—V 2.0 with a VNP module, Shimadzu Scientific Instruments) according to Benner and Strom (1993).
Flow Cytometry Analysis
Cell abundance of Synechococcus spp., Prochlorococcus spp., picoeukaryotes (≤ 2 μm), nanoeukaryotes (2–5 μm) and heterotrophic prokaryotes were determined according to Marie et al. (1999, 2014) using a BD Accuri™ C6 flow cytometer (Ann Arbor, MI, USA) equipped with a peristaltic pump for quantitative volume sampling and two argon-ion lasers for red (640 nm) and blue (488 nm) excitation.
Cells of Prochlorococcus, Synechococcus, picoeukaryotes, and nanoeukaryotes were quantified based on auto fluorescence in red (FL3—intracellular concentration of chlorophyll, 4,650 nm) and orange (FL2—intracellular concentration of phycoerythrin, 580 ± 30 nm) wavelengths simultaneously. To reduce the noise, a threshold of 500 was applied to FL3. After analyzing the autotrophs, SYBR Green I (Invitrogen Life Technologies, USA) was added, and the samples were incubated in the dark at room temperature for 15 min (Marie et al., 1999). Flow cytometry acquisition for heterotrophic bacteria was triggered on FL1 (530 ± 30 nm) with a threshold value of 500 and 90° scatter light side. Data were analyzed using Flowing Software® 2.5 (http://flowingsoftware.btk.fi/index.php?page=1).
Picoplanktonic cell abundance (cell·L−1) was converted to biomass (μgC·L−1) using constant cell-to-carbon conversion factors based on the literature: 36 fgC·cell−1 for Prochlorococcus, 255 fgC·cell−1 for Synechococcus and 2,590 fgC·cell−1 for picoeukaryotes (Buitenhuis et al., 2012) as well as 20 fgC·cell−1 for heterotrophic bacteria (Lee and Fuhrman, 1987). Due to the lack of robust conversion factors, nanophytoplankton biomass was not calculated.
Data Analysis
Sampling maps and graphs of the hydrographic conditions of the water column and picoplankton carbon distribution were generated using Ocean Data View (version 4.7.6) with the DIVA algorithm for variable resolution in a rectangular grid (Schlitzer, 2016). The software R (version 3.2.3) was used for statistical analyses.
Linear regressions were performed between total biomass of picophytoplankton and heterotrophic bacteria to determine their relationship. Carbon biomass was transformed (log(x+1)) and an nMDS (non-metric multidimensional scaling) using the Bray-Curtis similarity index was performed to look for patterns in the data. Environmental parameters were fitted to the nMDS using the envfit function of the vegan package with 999 permutations (Oksanen et al., 2016).
A principal component analysis (PCA, n = 51) based on Euclidean distance was performed to study the influence of environmental parameters (temperature, salinity, fluorescence, inorganic nutrients, DOC, and DON) on the sample distributions. For both analyses, the samples were classified according to their sampling location across the continental margin, and their respective water mass signatures. Additionally, to verify differences in biological groups between locations (continental shelf, slope, and rise) and water masses (CW, TW, and SACW), we performed a permutational multivariate analysis of variance (PERMANOVA, adonis function) using the vegan package (Anderson, 2001).
Results
Distribution of Environmental Characteristics
The prevailing winds during the sampling period were blowing from the east, which are favorable to coastal upwelling in the region, and were more intense in the study area, varying from 4.0 to 6.4 m.s−1 (Figure 3A). Additionally, two cyclonic meanders were found close to our transect (Figure 3B). The combination of the two effects (winds and meanders) results in a strong mechanism capable of bringing the SACW from the slope regions to near the coast, as described by Campos et al. (2000) and Silveira et al. (2004) in the study domain.
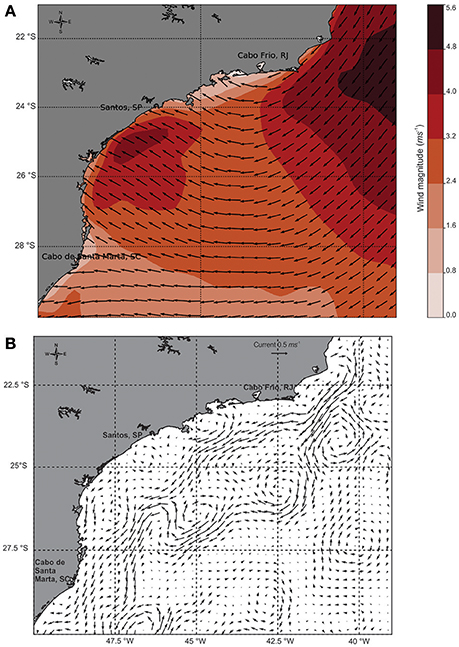
Figure 3. Summer scenario during the sampling period in the South Atlantic Ocean: (A) Wind direction and magnitude (m.s−1), (B) Geostrophic velocity (m.s−1) from daily-mean observations.
Seawater temperatures varied between 14 and 26.7°C, with the coolest temperatures near the bottom at stations 56 and 59 and the warmest temperatures in the upper mixed layer at the shallowest station 38 (Figure 4A). Salinities ranged from 34.97 psu at station 38 to 37.15 psu at the outer station 43 (Figure 4B). The temperature-salinity signatures indicate the presence of three main epipelagic water masses of the Southwestern Atlantic Ocean: Coastal Water (T>20°C, S<36 psu), mainly found up to 25 m depth on the continental shelf, Tropical Water (T>20°C, S>36 psu) at ca. 150 m depth, from the shelf break to the open ocean, and the SACW (5<T<20°C, 34.3<S<36 psu). Deepening of the thermocline was observed in the oceanic waters over the shelf break (station 40) and on the outer shelf (stations 50, 42, 43, and 49) (Figure 4).
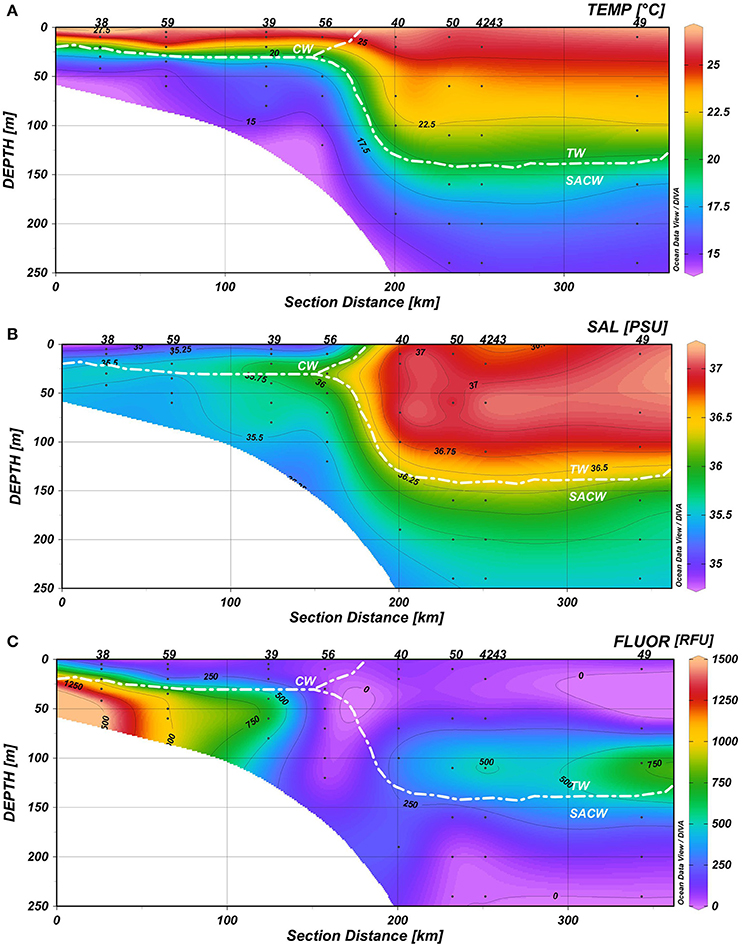
Figure 4. Hydrographic conditions of the water column (0–250 m) in a 350 km transect: (A) Temperature (°C), (B) Salinity (psu), and (C) Fluorescence (RFU). Station labels are indicated at the top of each panel (38, 59, 39, 56, 40, 50, 42, 43, and 49 along a transect from the coast to the ocean).
Relatively lower temperatures and lower salinities were associated with fluorescence peaks (>900 RFU) and upward enhancement of the DCM due to the thermocline rise. Chlorophyll fluorescence ranged from 3.83 at station 49 to 1457.72 RFU at station 38; and the maximum values occurred on the continental shelf at ~50 m, beyond the continental slope at ~100 m, as well as in the mixed layer (Figure 4C).
The nutricline was also well-defined and coincident with or immediately below the SACW upper limit. The vertical and spatial fluctuations of nitrate (0–10.45 μM), silicate (0.02–10.61 μM), and phosphate (0.07–1.61 μM) also reflected the SACW intrusion; maximum concentrations were found near the bottom of the continental shelf. DOC and DON varied between 0.67–1.61 mg·L−1 and 0.12–0.83 mg·L−1, respectively (Supplementary Table 1, Supplementary Figure 1).
Stations representing the different water masses are clearly distributed based on their environmental and physical characteristics in our PCA analysis (Figure 5). Three PCA components explained 70.1% of the samples variability based on the environmental parameters (temperature, salinity, fluorescence, phosphate, silicate, ammonia, nitrite, nitrate, DOC, and DON). The first component (PC1) was negatively correlated with temperature and salinity and positively correlated with nutrients, which may reflect the influence of the cold and nutrient-rich SACW. The second axis (PC2) showed a high positive correlation with DOC and ammonia, while the third component (PC3) was negatively correlated with fluorescence and ammonia and positively correlated with DON (Table 1). Higher temperatures and salinities characterized the Tropical Water. Higher concentrations of DOC and ammonia, which represent the continental inputs, characterized the Coastal Water. Higher concentrations of nutrients (silicate, phosphate, and nitrate) and higher fluorescence (as a proxy of primary productivity) in addition to lower temperatures and salinities, represented the SACW.
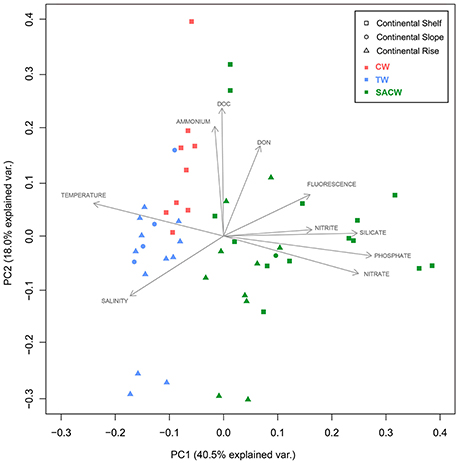
Figure 5. Oceanographic-environmental scenario of the study area. Outcome of the principal component analysis (PCA): Plot of principle components PC1 and PC2 showing the distribution of environmental variables (temperature, salinity, fluorescence, phosphate, silicate, nitrite, nitrate, ammonia, dissolved organic carbon (DOC) dissolved organic nitrogen (DON). Squares represent samples collected on the continental shelf, circles represent samples collected on the continental slope, and triangles represent samples collected on the continental rise. Different colors represent the waters masses: Red is Coastal Water (CW), blue is Tropical Water (TW), and green is South Atlantic Central Water (SACW).
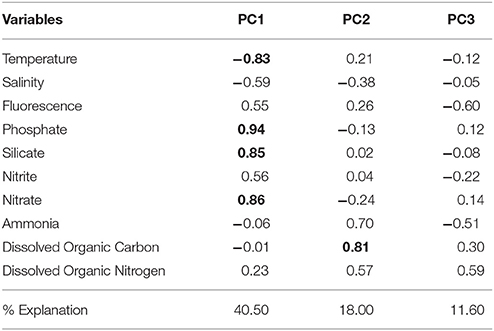
Table 1. Results of principal component analysis (PCA) using environmental variables (temperature, salinity, fluorescence, phosphate, silicate, nitrite, nitrate, ammonia, dissolved organic carbon, and dissolved organic nitrogen). Principal component loadings >0.70 are shown in bold.
Pico- and Nano-plankton Abundance
Synechococcus were more abundant in surface layers of the innermost stations, 38 and 39 (1.19 × 10⁵ and 1.16 × 10⁵ cell·mL−1, respectively). Maximum cell numbers were counted above the DCM at all stations, and the highest concentrations were more confined to the continental shelf, particularly in the CW. Decreasing abundances were observed with depth at the outermost stations 50, 42, 43, and 49 (Supplementary Table 2).
Prochlorococcus were dominant in the Tropical Water and in the uplifted layers of the SACW, ~100 m depth. The highest abundances were recorded at the outermost stations, 49, 42, and 50, with 6.37 × 10⁴, 6.57 × 10⁴, and 5.78 × 10⁴ cell·mL−1, respectively. Generally, in surface waters, few or no cells were recorded (Supplementary Table 2).
Picoeukaryotic populations were more abundant on the inner continental shelf than in the surface waters of the CW (station 38) and in the upper limit of SACW (stations 59 and 39). The maximum concentrations (1.0–1.5 × 10⁴ cell·mL−1) were distributed at the innermost stations along the transect, whereas lower abundances (<9.7 × 10² cell·mL−1) were found at the outer stations (50, 42, 43) below depths of 100–150 m (Supplementary Table 2).
A very similar spatial distribution was observed for photosynthetic nanoeukaryotes. Nanoeukaryotes were more abundant at the innermost stations 38 (8.62 × 10³ cell·mL−1), 59 (3.30 × 10³ cell·mL−1), and 39 (3.88 × 10³ cell·mL−1). Along the coastal-ocean gradient, the highest abundance of nanoeukaryotes was observed at the surface of the inner continental shelf in the CW; in the external and middle portions, higher cell concentrations were recorded at ~50 m in depth.
Numerically, heterotrophic bacterial populations were dominant in this study (Table 2). Their highest abundances occurred in the CW and the upper limits of the SACW. The highest concentrations were in the surface layers of the inner- and mid-shelves at stations 38 (2.11 × 10⁶ cell·mL−1) and 59 (2.03 × 10⁶ cell·mL−1). Other samples had concentrations one order of magnitude lower, except for station 42 (240 m), which had an even lower abundance of 8.10 × 10⁴ cell·mL−1 (Supplementary Table 2).
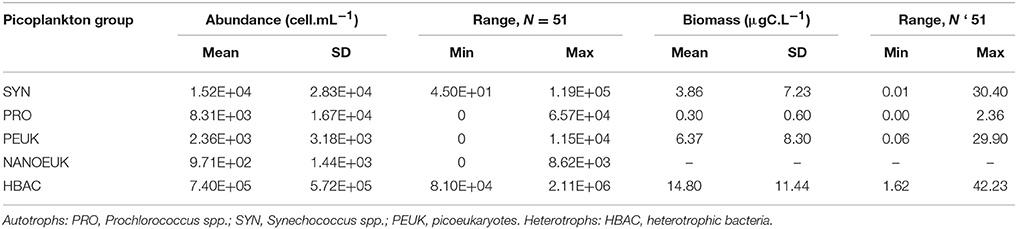
Table 2. Means, standard deviations (SD) and minimum–maximum (min–max) range of picoplankton abundances (cell.mL−1) and carbon biomass (μgC.L−1) from all stations and depths.
Picoplankton Carbon Biomass Assessments
For carbon biomass, heterotrophic bacteria were dominant (averaging 67.6%), ranging from 1.62 to 42.23 μgC·L−1. Regarding the total autotrophic biomass, picoeukaryotes corresponded to 65.8 ± 24.5% of biomass followed by Synechococcus (26.9 ± 26.9%) and Prochlorococcus (7.3 ± 11.3%) (Table 3).
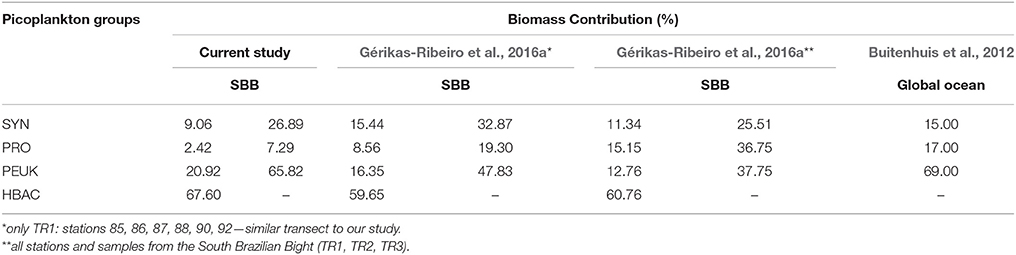
Table 3. Comparison of picoplankton biomass contribution (%) for each group [Synechococcus spp. (SYN), Prochlorococcus spp. (PRO), picoeukaryotes (PEUK), and heterotrophic bacteria (HBAC)] between the current study and Gérikas-Ribeiro et al. (2016a) and Buitenhuis et al. (2012) for the South Brazilian Bight (SBB) and global ocean, respectively.
A clear association between hydrographic patterns and the spatial and vertical distribution of picoplanktonic groups was observed in the water column. Synechococcus (3.86 ± 7.23 μgC·L−1) were generally confined to the first 30 m of the water column, where relatively low concentrations of inorganic nutrients and higher temperatures prevailed. Peaks of carbon concentrations from autotrophic Synechococcus were mainly present on the inner shelf (stations 38 and 39) and associated with CW (Figure 6A). Prochlorococcus contributed more to carbon biomass on the oceanic side of the TW (stations 50, 42, 49), and the highest carbon biomass (>1.15 μgC·L−1) were observed below 70 m, near the limit between the TW and the SACW (Figure 6B). Picoeukaryotes (6.37 ± 8.30 μgC·L−1) were mainly present on the inner and mid-shelves (stations 38, 59, 39, 56), with carbon peaks at: surface waters at station 38 (above 20 m depth, CW), at 50 m at stations 59 and 39 (SACW) and at 25 m at station 56 (interception between CW, TW, and SACW) (Figure 6C). Heterotrophic bacteria (14.80 ± 11.44 μgC·L−1) contributed more to carbon biomass on the inner and mid-shelves (stations 38–56), with peaks related to the CW and mid concentrations in the upper limit of the SACW (Figure 6D).
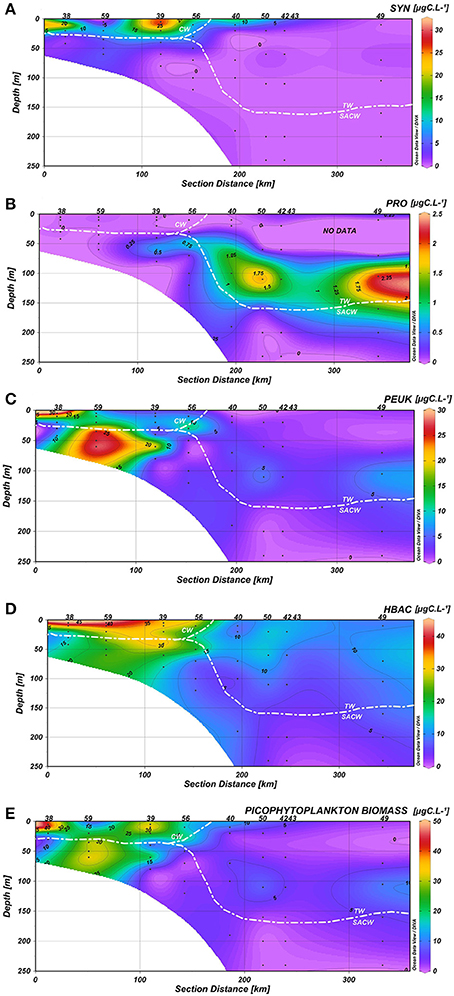
Figure 6. Carbon biomass (μgC.L−1) distribution of (A) Synechococcus (SYN), (B) Prochlorococcus (PRO), (C) Picoeukaryotes (PEUK), (D) Heterotrophic bacteria (HBAC), (E) Total picophytoplankton in the water column along the coastal-ocean gradient.
If we consider the distribution of the total of picophytoplanktonic communities, they exhibited similar spatial patterns to heterotrophic bacteria, with higher biomass concentrations at stations 38, 59, 39, and 56, connected to the CW and the upper limits of the SACW (Figure 6E). Heterotrophic bacterial biomass was positively correlated with picophytoplankton biomass (p < 0.05, Figure 7).
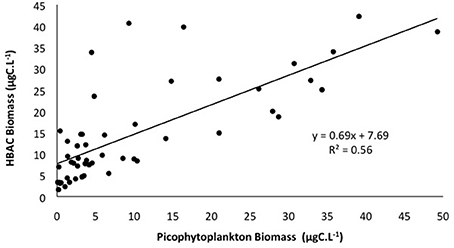
Figure 7. Relationship between total carbon biomass (μgC.L−1) of picophytoplankton (Synechoccocus, Prochlorococcus, and picoeukaryotes) and heterotrophic bacteria (HBAC). Linear regression is statistically significant at p < 0.05.
The Influence of Environmental Factors on Picoplankton Biomass
nMDS analyses showed the biological distribution over the continental margin and across environmental parameters, including temperature, salinity, fluorescence, organic, and inorganic nutrients, as well as the water masses (Figure 8). Among the factors, temperature, fluorescence, and DOC presented significant (p < 0.005) correlations with the biological groups. The plankton community distribution is explained more by the location (40%) than by the water masses (18%), according to the PERMANOVA test (r2 = 0.38, p < 0.0001 for “location”; r2 = 0.18, p < 0.0001 for “water masses”).
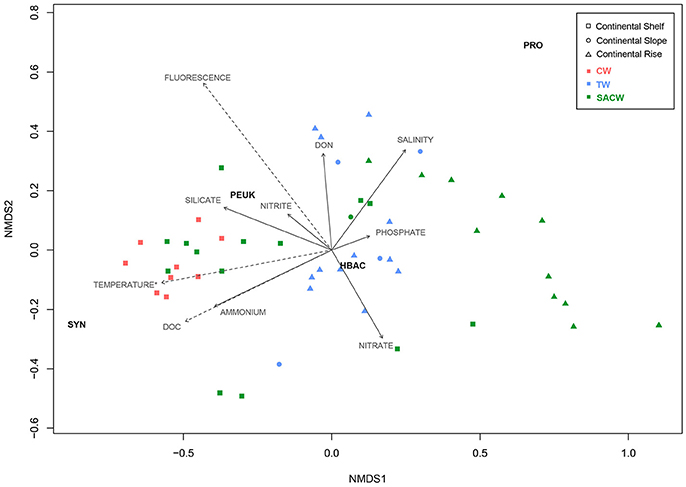
Figure 8. Non-metric multidimensional scaling (nMDS) ordination (stress = 0.059, r2 = 0.996). Squares represent samples collected on the continental shelf, circles represent samples collected on the continental slope, and triangles represent samples collected on the continental rise. Different colors represent the waters masses: Red is Coastal Water (CW), blue is Tropical Water (TW), and green is South Atlantic Central Water (SACW). Each arrow shows one environmental gradient, and dashed arrows show gradients significantly correlated to the ordination (envfit, p < 0.005). The arrow points to the direction of the most rapid change in the environment (direction of the gradient) and its length is proportional to the correlation between ordination and environmental variable (strength of the gradient).
Synechococcus were mainly distributed along the continental shelf and driven by higher temperatures, DOC and ammonia, that showed high negative correlations with nMDS axis 1. Higher Synechococcus carbon biomass was related to the water masses CW and SACW. Prochlorococcus were mostly present on the continental rise, characterized by relatively higher salinities and lower temperatures of deeper waters. Picoeukaryotes were mainly related to the inner continental shelf, with higher fluorescence, silicate and nitrite. Heterotrophic bacteria did not seem to respond to any abiotic condition.
Discussion
In an extensive review of the carbon biomass distribution in the global ocean, there was a noticeable absence of data from the South Atlantic Ocean (Buitenhuis et al., 2012). Although, previous studies (Andrade et al., 2004; Alves et al., 2014; Gérikas-Ribeiro et al., 2016a) have provided relevant data on picoplanktonic abundance along the Brazilian continental shelf, the present study contributes to a better understanding of the influence of a seasonal oceanographic condition, the SACW intrusion, on the spatial distribution of pico- and nano-planktonic abundance and carbon biomass partitioning.
The strong uplift of the SACW over the continental shelf and the development of a seasonal thermocline were promoted by the combined effect of prevailing eastern winds and the Brazil Current meanders, and represented the most relevant feature of the physical structure of the water column. In addition, the SACW intrusion interacting with the CW and the TW, created spatial variations in thermohaline characteristics, as well as in light and nutrient availability as previously reported (e.g., Brandini, 1990; Brandini et al., 2014; Moser et al., 2014). This combination of water masses created a higher niche diversity of picoplanktonic communities. Nutrient-rich (higher silicate and phosphate) and relatively less saline waters enhanced the picoeukaryotic biomass, whereas higher temperatures, lower salinities, higher inputs of ammonia and DOC, due CW and continental runoff at innermost stations, have influenced the distribution of Synechococcus. The significant relation between Prochlorococcus and salinity showed their preference for more saline open waters, which explains their peaks in the TW.
In general, our cell concentrations are comparable to previous studies concerning the influence of oceanographic processes on planktonic populations in other coastal systems and oligotrophic waters (Katano et al., 2005; Williams et al., 2015). The Synechococcus cells were abundant in surface waters on the continental shelf, and in the CW associated with the thermocline. These organisms have a predominant distribution on continental shelves and are less abundant on the continental slope and in oligotrophic waters (Chiang et al., 2002; Tsai et al., 2005, 2008; Wang et al., 2011). Their high abundance is normally associated with the presence of tropical and subtropical mesotrophic waters and upwelling events (Zubkov et al., 1998; Dongen-Vogels et al., 2011). Synechococcus abundance may be affected by Ekman transport, which removes the surface waters through wind action and replaces them with deep water containing fewer Synechococcus cells (Paerl et al., 2011). In addition, colder and nutrient-rich waters (including trace metals) can inhibit Synechococcus growth (Brand et al., 1986; Paerl et al., 2011), explaining the highest concentrations of their cells at the innermost stations, 38 and 39.
In this study, Prochlorococcus were abundant at ~100 m, close to the nutricline base in the TW, suggesting the presence of an ecotype adapted to low-light. In surface waters (>50 m), they were less abundant (or even absent) compared to other picophytoplanktonic groups, and also to previous studies. Globally, Prochlorococcus distribution is mostly related to tropical and subtropical oligotrophic oceanic waters (Partensky et al., 1999), where the vertical distribution is associated with ecotypes adapted to different depths (Moore et al., 1998; West et al., 2001; Johnson et al., 2006). For the same region, we have reported Prochlorococcus abundances at one or two orders of magnitude lower than those recorded during the spring 2013 by Gérikas-Ribeiro et al. (2016a) (Table 3), probably due the use of different cytometers (BD Accuri C6 in our case vs. BD FACSCanto II in their study). The low concentrations of photosynthetic pigments in Prochlorococcus cells at surface waters may lead to an underestimation of cell concentrations by this flow cytometer, whereas cells in deeper waters containing relatively higher concentrations of pigments have allowed better detection (Partensky et al., 1999; Gérikas-Ribeiro et al., 2016b). Even so, the observed mean cell concentrations are of the same magnitude as previous studies in other marine ecosystems (e.g., Vaulot and Marie, 1999; Grob et al., 2007; Guo et al., 2014), and this underestimation does not affect the spatial distribution patterns of picoplankton herein demonstrated.
The mean picoeukaryotic cell abundance obtained in this study (2.4 × 10³ cell.ml−1) corroborates literature data from oligotrophic waters (Zubkov et al., 1998; Kirkham et al., 2013), including the Southwestern Atlantic (Gérikas-Ribeiro et al., 2016a). Their optimal temperature distribution ranged from 17 to 20°C, ca. 5°C lower than registered by Pan et al. (2007), and their preference for nutrient-rich waters (high nitrate and phosphate) was previously observed by Worden and Not (2008). The peaks of picoeukaryotes in two different layers of the euphotic zone are probably related to their ability to move in the water column in response to different gradients of light and nutrients to improve their optimal growth conditions (Raven, 1998). For instance, picoeukaryotic cells below the nutricline can be related to the resident populations that use nitrate from deeper layers. On the other hand, their presence in surface waters at the innermost stations could also be linked to Ekman transport, pumping waters enriched by picoeukaryotic cells from deeper layers to the surface.
The prevailing distribution of heterotrophic bacteria at the innermost stations and their connection to the CW and upper limits of the SACW seem to be linked to the accumulation of dissolved and particulate organic matter in the frontal regions (e.g., Pomeroy et al., 1983; Peele et al., 1985; Ducklow, 1986; Arístegui and Montero, 2005; Linacre et al., 2015; Gérikas-Ribeiro et al., 2016a). The similar distribution (e.g., Zubkov et al., 1998; Gérikas-Ribeiro et al., 2016a) and linear relationship between heterotrophic bacteria and picophytoplankton biomass in the water column reveal a connection among the picoplankton communities, the production of organic matter and nutrient cycling (Liu et al., 2004; Linacre et al., 2015). The growth of heterotrophic bacteria is partially supported by organic compounds produced by phytoplankton cells, and the remineralization of inorganic nutrients by heterotrophic bacteria stimulates, in turn, the growth of phytoplankton. In addition, other sources of dissolved organic compounds may sustain the heterotrophic communities, such as viral lysis, seasonal blooms, and senescent cells (Myklestad, 2000; Buchan et al., 2014).
Only more recently, the partitioning of carbon biomass of autotrophic and heterotrophic picoplankton populations was assessed in oceanic waters. The relative picophytoplanktonic biomass contribution to the global ocean was estimated at 15% for Synechococcus, 17% for Prochlorococcus, and 69% for picoeukaryotes (Buitenhuis et al., 2012). Excluding the heterotrophs, a similar picoeukaryote biomass contribution was found in our study (65.8%), followed by Synechococcus (26.9%) and Prochlorococcus (7.3%). The relative contribution of each group under upwelling conditions was led by heterotrophic bacteria, followed by picoeukaryotes, Synechococcus, and Prochlorococcus; when the SACW is not as influential, the relative contribution of each phytoplanktonic group is evenly distributed (Table 3). Particularly for this region, it seems that picoeukaryotes benefit from colder and nutrient-rich oceanic waters.
Using a transect from the coast to the oceanic region we showed that the physical structure of oligotrophic waters had a large impact on the vertical (water column) and horizontal distribution patterns of picoplankton carbon biomass. These patterns reflect the strong effect of the SACW intrusion on the Southeastern Brazilian continental shelf, inducing the dispersion of DOC below the euphotic zone in an effective biological pump. Influence of northeastern-eastern winds, pumping of deep water by cyclonic vortices, internal waves, and even mixing of surface layers by tropical cyclones can bring new nutrients to the euphotic zone that partially sustain the deep picoplanktonic populations (Dongen-Vogels et al., 2011; Linacre et al., 2015). However, the fraction of picoplankton in surface layers, as well as the remarkable biomass peaks found occasionally in deeper waters of the study area may be associated not only with the regional physical dynamics favoring the summer intrusion of the SACW, but also with habitat preferences (light and nutrient availability) of the different picoplankton populations.
From our findings, a combination of water masses has created a higher niche diversity of picoplanktonic communities and determined their spatial distribution. The wind-driven and meander-induced SACW intrusion has favored the autotrophic and heterotrophic carbon biomass, influencing the carbon biomass partitioning in oligotrophic waters of the Southwestern Atlantic.
Author Contributions
NB conceived and designed the experiments, performed the experiments, analyzed the data, wrote the paper, prepared figures and/or tables. CS analyzed the data, wrote the paper, prepared figures and/or tables and reviewed drafts of the paper. AA performed the experiments, contributed reagents/materials and reviewed drafts of the paper. FB conceived and designed the experiments and reviewed drafts of the paper. VP conceived and designed the experiments, contributed reagents/materials/analysis tools and reviewed drafts of the paper.
Conflict of Interest Statement
The authors declare that the research was conducted in the absence of any commercial or financial relationships that could be construed as a potential conflict of interest.
The reviewer PT and handling Editor declared their shared affiliation, and the handling Editor states that the process nevertheless met the standards of a fair and objective review.
Acknowledgments
This study was part of the Project OCEANOS/CARBOM (Environmental Characterization and Evaluation of Biogenic Ocean Resources from the Brazilian Continental Shelf and the Adjacent Oceanic Zone—CNPq 565060/2010-4). We thank the captain and the crew of the research vessel Alpha Crucis (IO-USP; FAPESP Process number 2010/06147-5) for their help in sampling, as well as LECOM's research team and Rosa C. Gamba for their scientific support. We are very thankful to Dr. Daniel Vaulot for his invaluable support with flow cytometry and Dalton K. Sasaki for his help with plotting the wind data. We also thank Dr. Linda Waters and Elsevier for language editing. We thank BD Biosciences-Brazil for lending the Accuri C6 to us for this project. NB was supported by a Master‘s fellowship from the Federal Agency for the Support and Evaluation of Graduate Education—CAPES. CNS receives a Post Doc fellowship from The São Paulo Research Foundation—FAPESP (Process number 2016/16183-5).
Supplementary Material
The Supplementary Material for this article can be found online at: https://www.frontiersin.org/article/10.3389/fmars.2017.00238/full#supplementary-material
Figure S1. Concentrations of inorganic and organic nutrients in the water column (0–250 m) along a 350 km transect: (A) Ammonia (μM), (B) Nitrate (μM), (C) Nitrite (μM), (D) Phosphate (μM), Dissolved Organic Carbon—DOC (mg.L−1), Dissolved Organic Nitrogen—DON (mg.L−1). Station labels are indicated at the top of each panel (38, 59, 39, 56, 40, 50, 42, 43, and 49 along the transect from the coast to the ocean).
Table S1. Environmental data, with the following information: ship station, sample number, bottom depth (m), latitude (°N), longitude (°E), sampling depth (m), temperature (°C), salinity (psu), fluorescence (RFU), phosphate (μM), silicate (μM), nitrite (μM), nitrate (μM), ammonia (μM), dissolved organic carbon (mg.L−1), dissolved organic nitrogen (mg.L−1).
Table S2. Cell abundance (cell.mL−1) of Synechococcus spp. (SYN), Prochlorococcus spp. (PRO), picoeukaryotes (PEUK), nanoeukaryotes (NANOEUK) and heterotrophic bacteria (HBAC) for each sample, considering the ship station, latitude (°N), longitude (°E), sampling depth (m), and the corresponding water mass.
References
Agawin, N., Duarte, C., and Agusti, S. (2000). Nutrient and temperature control of the contribution of picoplankton to phytoplankton biomass and production. Limnol. Oceanogr. 45, 591–600. doi: 10.4319/lo.2000.45.3.0591
Alves, N. Jr., Meirelles, P. M., de Oliveira Santos, E., Dutilh, B., Silva, G. G. Z., Paranhos, R., et al. (2014). Microbial community diversity and physical–chemical features of the Southwestern Atlantic Ocean. Arch. Microbiol. 197, 165–179. doi: 10.1007/s00203-014-1035-6
Anderson, M. J. (2001). A new method for non-parametric multivariate analysis of variance. Aust. Ecol. 26, 32–46. doi: 10.1111/j.1442-9993.2001.01070.pp.x
Andrade, L., Gonzalez, A. M., Valentin, J. L., and Paranhos, R. (2004). Bacterial abundance in the southwest Atlantic Ocean. Hydrobiologia 511, 103–111. doi: 10.1023/B,HYDR.0000014033.81848.48
Arístegui, J., and Montero, M. F. (2005). Temporal and spatial changes in plankton respiration and biomass in the Canary Islands region, the effect of mesoscale variability. J. Mar. Syst. 54, 65–82. doi: 10.1016/j.jmarsys.2004.07.004
Azam, F., and Malfatti, F. (2007). Microbial structuring of marine ecosystems. Nat. Rev. Microbiol. 5, 782–791. doi: 10.1038/nrmicro1747
Bell, T., and Kalff, J. (2001). The contribution of picophytoplankton in marine and freshwater systems of different trophic status and depth. Limnol. Oceanogr. 46, 1243–1248. doi: 10.4319/lo.2001.46.5.1243
Benner, R., and Strom, M. (1993). A critical evaluation of the analytical blank associated with DOC measurements by high-temperature catalytic oxidation. Mar. Chem. 41, 153–160. doi: 10.1016/0304-4203(93)90113-3
Brand, L., Sunda, W., and Guillard, R. (1986). Reduction of marine phytoplankton reproduction rates by copper and cadmium. J. Exp. Mar. 96, 225–250.
Brandini, F. P. (1990). Hydrography and characteristics of the phytoplankton in shelf and oceanic waters off southeastern Brazil during winter (July/August 1982) and summer (February/March 1984). Hydrobiologia 196, 111–148. doi: 10.1007/BF00006105
Brandini, F. P., Nogueira, M. Jr., Simião, M., Codina, J. C. U., and Noernberg, M. A. (2014). Deep chlorophyll maximum and plankton community response to oceanic bottom intrusions on the continental shelf in the South Brazilian Bight. Cont. Shelf. 89, 61–75. doi: 10.1016/j.csr.2013.08.002
Buchan, A., LeCleir, G. R., Gulvik, C. A., and González, J. M. (2014). Master recyclers, features and functions of bacteria associated with phytoplankton blooms. Nat. Rev. Microbiol. 12, 686–698. doi: 10.1038/nrmicro3326
Buitenhuis, E. T., Li, W. K. W., Lomas, M. W., Karl, D. M., Landry, M. R., and Jacquet, S. (2012). Bacterial biomass distribution in the global ocean. Earth Syst. Sci. Data Discuss. 5, 301–315. doi: 10.5194/essdd-5-301-2012
Campos, E. J. D., Velhote, D., and Silveira, I. C. A. (2000). Shelf break upwelling driven by Brazil current cyclonic meanders. Geophys. Res. Lett. 27, 751–754. doi: 10.1029/1999GL010502
Castro, B. M. (2014). Summer/winter stratification variability in the central part of the South Brazil Bight. Cont. Shelf Res. 89, 15–23. doi: 10.1016/j.csr.2013.12.002
Castro, B. M., Brandini, F. P., Pires-Vanin, A. M. S., and Miranda, L. B. (2006). “Multidisciplinary oceanographic processes on the western Atlantic continental shelf between 4°N and 34°S,” in The Global Coastal Ocean, eds A. R. Robinson, and K. H. Brink (Cambridge: Harvard University Press), 1062.
Castro, B. M., Miranda, L., and Miyao, S. (1987). Condições hidrográficas na plataforma continental ao largo de Ubatuba, variações sazonais e em média escala. Bolm. Inst. Ocean. 35, 135–151. doi: 10.1590/S0373-55241987000200004
Cerda, C., and Castro, B. M. (2014). Hydrographic climatology of South Brazil Bight shelf waters between Sao Sebastiao (24°S) and Cabo Sao Tome (22°S). Cont. Shelf Res. 89, 5–14. doi: 10.1016/j.csr.2013.11.003
Chen, C.-T. A. (2004). “Exchanges of carbon in the coastal seas,” in The Global Carbon Cycle, Integrating Humans, Climate, and Natural World, eds C. B. Field and M. R. Raupach (Washington, DC: Island Press), 568.
Chiang, K., Kuo, M., Chang, J., and Wang, R. (2002). Spatial and temporal variation of the Synechococcus population in the East China Sea and its contribution to phytoplankton biomass. Cont. Shelf. Res. 22, 3–13. doi: 10.1016/S0278-4343(01)00067-X
Dongen-Vogels, V., van Seymour, J. R., Middleton, J. F., Mitchell, J. G., and Seuront, L. (2011). Influence of local physical events on picophytoplankton spatial and temporal dynamics in South Australian continental shelf waters. J. Plankt. Res. 33, 1825–1841. doi: 10.1093/plankt/fbr077
Ducklow, H. (1986). Bacterial biomass in warm-core Gulf Stream ring 82-B, mesoscale distributions, temporal changes and production. Deep Sea Res. A Oceanogr. Res. 33, 1789–1812.
Emílsson, I. (1961). The shelf and coastal waters off southern Brazil. Bol. Inst. Oceanogr. 11, 101–112. doi: 10.1590/S0373-55241961000100004
Eppley, R. W., and Peterson, B. J. (1979). Particulate organic matter flux and planktonic new production in the deep ocean. Nature 282, 677–680. doi: 10.1038/282677a0
Fuhrman, J., Ammerman, J., and Azam, F. (1980). Bacterioplankton in the coastal euphotic zone, distribution, activity and possible relationships with phytoplankton. Mar. Biol. 60, 201–207. doi: 10.1007/BF00389163
Gaulke, A., Wetz, M., and Paerl, H. (2010). Picophytoplankton, a major contributor to planktonic biomass and primary production in a eutrophic, river-dominated estuary. Estuar. Coast. Shelf Sci. 90, 45–54. doi: 10.1016/j.ecss.2010.08.006
Gérikas-Ribeiro, C., dos Santos, A. L., Marie, D., Pellizari, V. H., Brandini, F. P., and Vaulot, D. (2016a). Pico and nanoplankton abundance and carbon stocks along the Brazilian Bight. PeerJ 4:e2587. doi: 10.7717/peerj.2587
Gérikas-Ribeiro, C., Marie, D., Lopes dos Santos, A., Pereira Brandini, F., and Vaulot, D. (2016b). Estimating microbial populations by flow cytometry, Comparison between instruments. Limnol. Oceanogr. Methods 14, 750–758. doi: 10.1002/lom3.10135
Grob, C., Ulloa, O., Claustre, H., Huot, Y., and Alarcon, G. (2007). Contribution of picoplankton to the total particulate organic carbon concentration in the eastern South Pacific. Biogeosciences 4, 837–852. doi: 10.5194/bg-4-837-2007
Guo, C., Liu, H., Zheng, L., Song, S., and Chen, B. (2014). Seasonal and spatial patterns of picophytoplankton growth, grazing and distribution in the East China Sea. Biogeosciences 11, 1847–1862. doi: 10.5194/bg-11-1847-2014
Johnson, Z., Zinser, E., Coe, A., and McNulty, N. (2006). Niche partitioning among Prochlorococcus ecotypes along ocean-scale environmental gradients. Science 311, 1737–1740. doi: 10.1126/science.1118052
Katano, T., Kaneda, A., and Takeoka, H. (2005). Seasonal changes in the abundance and composition of picophytoplankton in relation to the occurrence of “Kyucho” and bottom intrusion in Uchiumi Bay, Japan. Mar. Ecol. Prog. 298, 59–67. doi: 10.3354/meps298059
Kirkham, A., Lepère, C., Jardillier, L., and Not, F. (2013). A global perspective on marine photosynthetic picoeukaryote community structure. ISME J. 7, 922–936. doi: 10.1038/ismej.2012.166
Lee, S., and Fuhrman, J. (1987). Relationships between biovolume and biomass of naturally derived marine bacterioplankton. Appl. Environ. Microbiol. 53, 1298–1303.
Linacre, L., Lara-Lara, R., Camacho-Ibar, V., Herguera, J. C., Bazán-Guzmán, C., and Ferreira-Bartrina, V. (2015). Distribution pattern of picoplankton carbon biomass linked to mesoscale dynamics in the southern Gulf of Mexico during winter conditions. Deep Sea Res. I 106, 55–67. doi: 10.1016/j.dsr.2015.09.009
Liu, H., Dagg, M., Campbell, L., and Urban-Rich, J. (2004). Picophytoplankton and bacterioplankton in the Mississippi River plume and its adjacent waters. Estuaries 27, 147–156. doi: 10.1007/BF02803568
Longhurst, A. R. (2007). “The Atlantic Ocean,” in Ecological Geography of the Sea, ed A. R. Longhurst (San Diego, CA: Elsevier Inc), 560.
Marie, D., Brussaard, C., Partensky, F., Vaulot, D., and Wiley, J. (1999). Flow cytometric analysis of phytoplankton, bacteria and viruses. Curr. Protoc. Cytom. 11, 1–15.
Marie, D., Rigaut-Jalabert, F., and Vaulot, D. (2014). An improved protocol for flow cytometry analysis of phytoplankton cultures and natural samples. Cytom. A 85, 962–968. doi: 10.1002/cyto.a.22517
Moore, L., Rocap, G., and Chisholm, S. (1998). Physiology and molecular phylogeny of coexisting Prochlorococcus ecotypes. Nature 393, 464–467. doi: 10.1038/30965
Moser, G., Takanohashi, R., de Chagas Braz, M., de Lima, D. T., Kirsten, F. V., Guerra, J. V., et al. (2014). Phytoplankton spatial distribution on the Continental Shelf off Rio de Janeiro, from Paraíba do Sul River to Cabo Frio. Hydrobiologia 728, 1–21. doi: 10.1007/s10750-013-1791-3
Murrell, M., and Lores, E. (2004). Phytoplankton and zooplankton seasonal dynamics in a subtropical estuary, importance of cyanobacteria. J. Plankton Res. 26, 371–382. doi: 10.1093/plankt/fbh038
Myklestad, S. M. (2000). “Dissolved organic carbon from phytoplankton,” in Marine Chemistry, ed P. J. Wangersky (Berlin: Springer), 111–148.
Oksanen, J., Guillaume, F., Kindt, R., Legendre, P., Minchin, P., O'Hara, R., et al. (2016). Vegan, Community Ecology Package. R Package Version 2.3-5. Available online at: https://cran.r-project.org/web/packages/vegan/index.html
Paerl, H. W., Hall, N. S., and Calandrino, E. (2011). Controlling harmful cyanobacterial blooms in a world experiencing anthropogenic and climatic-induced change. Sci. Total Environ. 40, 1739–1745. doi: 10.1016/j.scitotenv.2011.02.001
Pan, L., Zhang, J., and Zhang, L. (2007). Picophytoplankton, nanophytoplankton, heterotrohpic bacteria and viruses in the Changjiang Estuary and adjacent coastal waters. J. Plankton Res. 29, 187–197. doi: 10.1093/plankt/fbm006
Partensky, F., Hess, W., and Vaulot, D. (1999). Prochlorococcus, a marine photosynthetic prokaryote of global significance. Microbiol. Mol. 63, 106–127.
Peele, E., Murray, R., Hanson, R., and Pomeroy, L. (1985). Distribution of microbial biomass and secondary production in a warm-core Gulf Stream ring. Deep Sea Res. 2, 1–20. doi: 10.1016/0198-0149(85)90055-x
Pomeroy, L. R., Atkinson, L. P., Blanton, J. O., Campbell, W. B., Jacobsen, T. R., Kerrick, K. H., et al. (1983). Microbial distribution and abundance in response to physical and biological processes on the continental shelf of southeastern USA. Cont. Shelf. Res. 2, 1–20. doi: 10.1016/0278-4343(83)90019-5
Pomeroy, L. R., Williams, P. J., Azam, F., and Hobbie, J. E. (2007). The microbial loop. Oceanography 20, 28–33. doi: 10.5670/oceanog.2007.45
Raven, J. (1998). The twelfth Tansley Lecture. Small is beautiful, the picophytoplankton. Funct. Ecol. 12, 503–513. doi: 10.1046/j.1365-2435.1998.00233.x
Richardson, T. L., and Jackson, G. A. (2007). Small phytoplankton and carbon export from the surface ocean. Science 315, 838–840. doi: 10.1126/science.1133471
Saha, S., Moorthi, S., Wu, X., Wang, J., Nadiga, S., Tripp, P., et al. (2014). The NCEP climate forecast system version 2. J. Clim. 27, 2185–2208. doi: 10.1175/JCLI-D-12-00823.1
Schlitzer, R. (2016). Ocean Data View. Available online at: http://odv.awi.de
Silveira, I. C. A., Calado, L., Castro, B. M., Cirano, M., Lima, J. A. M., and Mascarenhas, A. S. (2004). On the baroclinic structure of the Brazil current-intermediate western boundary current at 22°-23° S. Geophys. Res. Lett. 31, L14308. doi: 10.1029/2004GL020036
Silveira, I. C. A., Schmidt, A. C. K., Campos, E. J. D., de Godoi, S. S., and Ikeda, Y. (2000). A Corrente do Brasil ao largo da costa leste brasileira. Rev. Bras. Oceanogr. 48, 171–183. doi: 10.1590/S1413-77392000000200008
Sverdrup, H. U. (1954). “Oceanography,” in The Earth as a Planet, ed G. P. Kuiper (Chicago, IL: University of Chicago Press), 243.
Sohm, J. A., Ahlgren, N. A., Thomson, Z. J., Williams, C., Moffett, J. W., Saito, M. A., et al. (2015). Co-occurring Synechococcus ecotypes occupy four major oceanic regimes defined by temperature, macronutrients and iron. ISME J. 10, 333–345. doi: 10.1038/ismej.2015.115
Tsai, A., Chiang, K., and Chang, J. (2005). Seasonal diel variations of picoplankton and nanoplankton in a subtropical western Pacific coastal ecosystem. Limnol. Oceanogr. 50, 1221–1231. doi: 10.4319/lo.2005.50.4.1221
Tsai, A., Chiang, K., Chang, J., and Gong, G. (2008). Seasonal variations in trophic dynamics of nanoflagellates and picoplankton in coastal waters of the western subtropical Pacific Ocean. AME 51, 263–274. doi: 10.3354/ame01196
Vaulot, D., and Marie, D. (1999). Diel variability of photosynthetic picoplankton in the equatorial Pacific. J. Geophys. Res. 104, 3297–3310. doi: 10.1029/98JC01333
Vaulot, D., Eikrem, W., Viprey, M., and Moreau, H. (2008). The diversity of small eukaryotic phytoplankton in marine ecosystems. FEMS Microbiol. Rev. 32, 795–820. doi: 10.1111/j.1574-6976.2008.00121.x
Wang, K., Wommack, K., and Chen, F. (2011). Abundance and distribution of Synechococcus spp. and cyanophages in the Chesapeake Bay. Appl. Environ. 21, 7459–7468. doi: 10.1128/AEM.00267-11
West, N., Schönhuber, W., and Fuller, N. (2001). Closely related Prochlorococcus genotypes show remarkably different depth distributions in two oceanic regions as revealed by in situ hybridization using 16S rRNA. Environ. Microb. 147, 1731–1744. doi: 10.1099/00221287-147-7-1731
Williams, A., McInnes, A., Rooker, J., and Quigg, A. (2015). Changes in microbial plankton assemblages induced by mesoscale oceanographic features in the Northern Gulf of Mexico. PLoS ONE 10:e0138230. doi: 10.1371/journal.pone.0138230
Worden, A. Z., and Not, F. (2008). “Ecology and diversity of picoeukaryotes,” in The Microbial Ecology of the Oceans, 2nd Edn., ed D. L. Kirchman (New York, NY: Wiley-Liss), 159–205.
Keywords: Synechococcus spp., Prochlorococcus spp., Picoeukaryotes, heterotrophic bacteria, environmental factors, spatial distribution, Southwestern Atlantic
Citation: Bergo NM, Signori CN, Amado AM, Brandini FP and Pellizari VH (2017) The Partitioning of Carbon Biomass among the Pico- and Nano-plankton Community in the South Brazilian Bight during a Strong Summer Intrusion of South Atlantic Central Water. Front. Mar. Sci. 4:238. doi: 10.3389/fmars.2017.00238
Received: 28 December 2016; Accepted: 14 July 2017;
Published: 28 July 2017.
Edited by:
Anas Ghadouani, University of Western Australia, AustraliaReviewed by:
Paul Gerard Thomson, University of Western Australia, AustraliaAntonio Olita, Consiglio Nazionale Delle Ricerche (CNR), Italy
Copyright © 2017 Bergo, Signori, Amado, Brandini and Pellizari. This is an open-access article distributed under the terms of the Creative Commons Attribution License (CC BY). The use, distribution or reproduction in other forums is permitted, provided the original author(s) or licensor are credited and that the original publication in this journal is cited, in accordance with accepted academic practice. No use, distribution or reproduction is permitted which does not comply with these terms.
*Correspondence: Vivian H. Pellizari, vivianp@usp.br