 Peng Chao1,2†
 Xueqin Zhang3†
 Lei Zhang4Yong Wang1Miriban Wusiman3
 Gulizere Aimaijiang3Xiaoyang Chen1*Yining Yang1,2*
- 1Department of Cardiology, People’s Hospital of Xinjiang Uygur Autonomous Region, Urumqi, China
- 2Xinjiang Key Laboratory of Cardiovascular Homeostasis and Regeneration Research, Urumqi, Xinjiang Uygur Autonomous Region, China
- 3Department of Nephrology, People’s Hospital of Xinjiang Uygur Autonomous Region, Urumqi, China
- 4Department of Endocrinology, People’s Hospital of Xinjiang Uygur Autonomous Region, Urumqi, China
Objective: Acute myocardial infarction (AMI) is a severe cardiovascular disease that threatens human life and health globally. N6-methyladenosine (m6A) governs the fate of RNAs via m6A regulators. Nevertheless, how m6A regulators affect AMI remains to be deciphered. To solve this issue, an integrative analysis of m6A regulators in AMI was conducted.
Methods: We acquired transcriptome profiles (GSE59867, GSE48060) of peripheral blood samples from AMI patients and healthy controls. Key m6A regulators were used for LASSO, and consensus clustering was conducted. Next, the m6A score was also computed. Immune cell infiltration, ferroptosis, and oxidative stress were evaluated. In-vitro and in-vivo experiments were conducted to verify the role of the m6A regulator ALKBH5 in AMI.
Results: Most m6A regulators presented notable expression alterations in circulating cells of AMI patients versus those of controls. Based on key m6A regulators, we established a gene signature and a nomogram for AMI diagnosis and risk prediction. AMI patients were classified into three m6A clusters or gene clusters, respectively, and each cluster possessed the unique properties of m6A modification, immune cell infiltration, ferroptosis, and oxidative stress. Finally, the m6A score was utilized to quantify m6A modification patterns. Therapeutic targeting of ALKBH5 greatly alleviated apoptosis and intracellular ROS in H/R-induced H9C2 cells and NRCMs.
Conclusion: Altogether, our findings highlight the clinical significance of m6A regulators in the diagnosis and risk prediction of AMI and indicate the critical roles of m6A modification in the regulation of immune cell infiltration, ferroptosis, and oxidative stress.
Introduction
Acute myocardial infarction (AMI) remains a severe cardiovascular disease that threatens human life and health across the globe, which is caused by the rupture or erosion of vulnerable atherosclerotic plaques with superimposed thrombosis, leading to coronary occlusion and progressive cell death in areas of low perfusion (1). The proportion of young adults among AMI patients has increased in recent years (2). The widespread adoption of reperfusion treatment and improved antithrombotic strategy have remarkably improved AMI patients’ prognosis (3). Nonetheless, prompt revascularization may result in reperfusion damage, thus lowering the clinical benefit of revascularization (4). There are currently no effective therapeutic strategies for myocardial ischemia/reperfusion damage. In addition, AMI is still the leading cause of chronic heart failure (5). Thus, it is of significance to discover novel biomarkers with strong sensitivity and specificity for diagnosing AMI (6).
N6-methyladenosine (m6A) represents the most studied RNA epi-transcriptomic modification, which affects the diverse mRNA metabolism traits and the biogenesis of non-coding RNAs. The m6A modification process is governed by three types of m6A regulators: methyltransferases, m6A-binding proteins, and demethylases (7). Recent investigations demonstrate the significance of m6A modification in AMI. For instance, alterations in m6A modification result in heart failure progression through modulation of translation (8). Deletion of m6A methyltransferase METTL3 triggers heart regeneration and repair following myocardial damage (9). m6A demethylase ALKBH5 deficiency leads to post-ischemic angiogenesis through post-transcriptionally stabilizing WNT5A (10). Ferroptosis is a form of programmed cell death triggered by iron-dependent accumulation of lipid hydroperoxide (11). Experimental evidence proves that mitigation of ferroptosis alleviates AMI in murine models (12). m6A methyltransferase METTL14 motivates doxorubicin-induced ferroptosis of cardiomyocytes (13). AMI is usually correlated to increased oxidative stress and inflammation, and both result in disease progression and are modulated by m6A modification (14). Thus, the current research implemented an integrative analysis of m6A regulators in blood samples of AMI patients. We built an m6A regulator gene model for diagnosing AMI and predicting disease risk, proposed a novel m6A-based classification of AMI, and unveiled the relationships of m6A modification with immune cell infiltration, ferroptosis, and oxidative stress, thus potentially improving the clinical management of AMI.
Materials and methods
Acquisition of AMI datasets
AMI datasets were queried from the Gene Expression Omnibus (GEO), which is a public functional genomics data repository (https://www.ncbi.nlm.nih.gov/geo/). After screening, the GSE59867 (15) and GSE48060 (16) datasets were included in the current study. The GSE59867 dataset comprised gene expression profiles of peripheral blood samples from 111 AMI patients and 46 healthy controls. The GSE48060 dataset covered transcriptome data of blood samples from 31 AMI patients and 21 controls. Both datasets were based on the Affymetrix platform. The Affymetrix data were preprocessed using the affy package (17). The GSE59867 dataset acted as the training set, while the GSE48060 dataset acted as the testing set.
Collection of m6A regulators
We gathered the list of 25 m6A regulators (Supplementary Table 1). The chromosomal location of m6A regulators was visualized with the RCircos package (18). The transcript levels of m6A regulators were compared in AMI relative to healthy controls in the GSE59867 dataset. Relationships between regulators were inferred utilizing Pearson’s correlation analysis.
Generation of an m6A-based gene signature for AMI diagnosis
Through univariate and multivariate logistic regression analyses, m6A regulators with p <0.05 were screened out. To avoid overfitting of the data, we further selected the least absolute shrinkage and selection operator (LASSO) to reduce dimensionality. The LASSO coefficient of each gene was calculated through ten-fold cross-validation, and the key m6A regulators with non-zero LASSO coefficients were selected to develop an m6A gene regulator model utilizing the glmnet package (19). The risk score was computed by linearly combining the key m6A regulators weighted by the corresponding coefficients. Receiver operator characteristic curves (ROCs) were plotted to investigate the diagnostic efficacy of the risk score and each key m6A regulator.
Nomogram establishment
To predict the risk of AMI, we incorporated the expression level of the 10 key m6A gene regulators selected by LASSO analysis to construct a nomogram through the rms package. Then, the consistency between the actual observation and predicted probability was assessed through calibration curves (by a bootstrap method with 1,000 resamples). In addition, the clinical utility of the nomogram was investigated by using decision curve analysis together with clinical impact curves.
Consensus clustering analysis
Consensus clustering was implemented for building an m6A regulator-based classification using the “ConsensusClusterPlus” package, with Euclidean distance and the K-means clustering approach (20). A total of 1,000 bootstraps were performed using the “K-means” algorithm with “Euclidean” distance. Each bootstrap consisted of 80% of the AMI samples. The range of cluster numbers, k, was set from two to nine, and the optimal value for k was determined based on the cumulative distribution function (CDF) curve and the CDF delta area curve. To visually represent the cluster membership, a consensus matrix heatmap was generated. Moreover, the difference in transcriptome profiling was visualized via the principal component analysis (PCA).
Immune cell infiltration
Utilizing the GSVA package with default parameters (21), the single-sample gene set enrichment analysis (ssGSEA) algorithm was executed to estimate the abundance of each immune cell type in each sample based on the transcriptome data and specific immune cell markers (22).
Selection of m6A cluster-relevant genes
Genes with differential expression between m6A clusters (m6A cluster A vs. m6A cluster B, m6A cluster A vs. m6A cluster C, m6A cluster B vs. m6A cluster C) were screened using the limma package (23). The intersecting genes with adjusted p <0.05 were selected as m6A cluster-relevant genes, as previously described (24).
Functional enrichment analysis
Enrichment analysis of Gene Ontology (GO) terms together with the Kyoto Encyclopedia of Genes and Genomes (KEGG) pathways of m6A cluster-relevant genes was executed utilizing the clusterProfiler package (25).
Gene set enrichment analysis (GSEA) was utilized to select significant functional gene sets with the fgsea package (26), with the “h.all.v7.0.symbols” of the molecular signatures database used as the predefined hallmark gene set (27). Briefly, all the expressed genes were ranked according to the stat values from the differential expression analysis. Next, all ensemble IDs of the differentially expressed gene list were mapped to the “org.Hs.eg.db” annotation file to generate a map table. The enrichment score (ES) was computed through the permutation test for each gene set. Adjusted p <0.05 was utilized as the cutoff for interpreting the results.
Definition of the m6A score
We extracted m6A cluster-relevant genes to define the m6A score for PCA. The formula for computing the m6A score is as follows: m6A score = ∑ (PC1i + PC2i), where PC1i and PC2i denote the transcript levels of m6A cluster-relevant genes in principal components 1 and 2. The Sankey diagram was drawn to illustrate the relationships between m6A clusters, gene clusters, and m6A scores using the ggalluvial package.
Cell culture
H9C2 cells were cultivated in high-glucose Dulbecco’s modified Eagle’s medium (SEVEN, Beijing, China) plus 10% fetal bovine serum (HyClone, UT, USA), 100 U/ml of penicillin, and 100 µg/ml of streptomycin in a humidified atmosphere with 5% CO2 at 37°C. To build a hypoxia/reoxygenation (H/R) cell model, when the confluence reached 80%~90%, H9C2 cells were exposed to hypoxia (oxygen deprivation, 0.5%) for 6 h and were subsequently cultured in the normal oxygen condition for 12 h (28, 29). To inhibit ALKBH5 expression, H9C2 cells were pretreated with 50 μM of the ALKBH5 inhibitor IOX1 (Selleck, Shanghai, China) for 2 h (4) or transfected with siRNAs against ALKBH5 (si-ALKBH5) (GenePharma, Shanghai, China) for 24 h via Lipofectamine RNAiMAX (Invitrogen, CA, USA).
Neonatal rat cardiomyocytes (NRCMs) were procured from the cardiac tissues of Sprague–Dawley rats aged between 1 and 3 days, sourced from Beijing HFK Bioscience Co., Ltd., China. In brief, ventricular tissues were sectioned and subjected to enzymatic digestion using 0.08% trypsin, repeated 10–12 times, followed by cell collection via centrifugation at 60g for 8 min. The harvested cells were then suspended in a suitable plating medium and incubated for 1 h to facilitate the removal of non-cardiomyocytes. Subsequently, the isolated cardiomyocytes were transferred into Dulbecco’s modified Eagle’s medium (DMEM) enriched with 10% newborn calf serum (NBCS) and 0.1 mM of 5-bromodeoxyuridine (Brdu). These cells were then plated at a concentration of 1 × 10⁶ cells per dish in 35 mm dishes coated with gelatin. After a 24-h incubation period in fresh culture medium, the cells were prepared for further experimental analysis.
Animal experiment
The experimental protocols involving animals in this study received approval from the Experimental Animal Ethics Committee at the People’s Hospital of Xinjiang Uygur Autonomous Region, under the approval number SYDW2023110315. Male C57BL/6J mice, aged 7 weeks, were acquired from Beijing HFK Bioscience Co., Ltd., Beijing, China. All procedures related to animal surgery and care adhered to the NIH’s Guidelines for the Care and Use of Laboratory Animals.
Following a week of acclimatization, the mice, each weighing around 25 g, were divided into four groups at random: control, sham, acute myocardial infarction (AMI), and AMI+rAAV-ALKBH5. To establish the AMI model, we performed ligation of the left anterior descending (LAD) coronary artery. The process involved anesthetizing the mice with pentobarbital sodium (60 mg/kg, intraperitoneally), intubation, and mechanical ventilation, followed by the permanent occlusion of the LAD. Indicators of successful AMI model creation included pallor in the myocardium near the ligation site and ST-segment elevation on the electrocardiogram. The sham group underwent identical surgical procedures, excluding the ligation of the LAD.
For the AMI+rAAV-ALKBH5 group, we utilized an adeno-associated virus serotype 9 (AAV9) vector, equipped with a cytomegalovirus (CMV) promoter, which carried the ALKBH5 gene sequence (termed AAV-ALKBH5). We administered these vectors to C57BL/6 mice through tail vein injections. Each mouse received a dose of 2.5 × 10¹¹ vector genomes (vg).
IHC staining
For immunohistochemical (IHC) analysis, cardiac tissue sections underwent xylene-based deparaffinization and sequential ethanol rehydration. Antigen unmasking followed the protocols specified in the Antibody Manual. To inhibit endogenous peroxidase, sections were treated with 3% hydrogen peroxide for 15 min and then blocked using 5% goat serum for half an hour. Primary antibody (1:300; Beyotime, Wuhan, China) incubation was carried out at 4°C overnight within a moisture-controlled environment, succeeded by an hour-long exposure to HRP-linked secondary antibodies at ambient temperature. Signal development was achieved using a DAB Kit (ZSGB-Bio, Beijing, China), adhering to the provided guidelines. The process concluded with hematoxylin counterstaining of the sections.
Immunofluorescence
Cells were seeded on a 24-well plate and cultivated until the confluence reached 70%~80%. Cells were washed with PBS three times, fixed with 4% paraformaldehyde (Sangon, Shanghai, China) for 15 min at room temperature, with subsequent permeation with 0.5% Triton® X-100 (Sigma, Shanghai, China) for 20 min. Normal goat serum (Beyotime, Shanghai, China) was added to the cells and closed at room temperature for an hour. The cells were incubated with primary antibody against ALKBH5 (Proteintech, Wuhan, China) and cTNT (Proteintech, Wuhan, China) overnight for 4°C and Alexa Fluor 488-conjugated AffiniPure goat anti-rabbit IgG (Proteintech) for 1 h at 37°C. The cell nucleus was stained with DAPI (Sigma) away from the light for 5 min. Photographs were acquired utilizing a fluorescence microscope (Zeiss, Baden-Wurtberg, Germany).
The procedure for immunofluorescence (IF) staining of cardiac tissue sections paralleled that of IHC, with the distinction that after antigen retrieval, sections were blocked using 5% goat serum, followed by overnight incubation with primary antibodies (Proteintech, Wuhan, China). Subsequently, the sections were treated with Alexa Fluor-tagged secondary antibodies for 1 h at ambient temperature and then mounted in a medium infused with DAPI (Sigma).
TUNEL staining
Cell apoptosis was measured through the TUNEL apoptosis detection kit (AtaGenix, Wuhan, China). H9C2 cells and NRCMs were inoculated on a 24-well plate. Until the confluence was 70%~80%, cells were fixed with 4% paraformaldehyde (Sangon) for 30 min at room temperature, and permeated with 0.1% Triton® X-100 (Sigma) for 5 min. Cells were administrated with 50 µl of the TUNEL mixture in the dark humified chamber for an hour at 37°C. Next, cells were washed with PBS two times and treated with 0.05 μg/μl of DAPI (Sigma) away from the light for 10 min. Images were acquired by a fluorescence microscope (Zeiss).
Reactive oxygen species detection
Intracellular reactive oxygen species (ROS) were measured by the ROS detection kit (Beyotime) based on the DCFH-DA staining method. H9C2 cells and NRCMs were seeded on a 24-well plate (3 × 10⁵ cells/well) for 24 h. Cells were washed twice with PBS and exposed to 1 ml of DCFH-DA (10 µM) at 37°C for 20 min away from the light. Subsequently, serum-free DMEM was adopted for the removal of excessive DCFH-DA. Photographs were captured under a fluorescence microscope (Zeiss).
Western blot
Samples comprising both heart tissues and cells were gathered, followed by the preparation of their lysates. Proteins, in consistent amounts ranging from 40 to 60 μg, were separated via SDS/PAGE and subsequently transferred onto PVDF membranes. These membranes were initially blocked using a 5% milk solution in Tris-buffered saline containing Tween 20 at ambient temperature for 2 h. This was followed by an overnight incubation at 4°C with primary antibodies (ALKBH5: 1:1,000, Abcam, Ab195377; Bcl-2: 1:2,000, Abcam, Ab194583; Bax: 1:10,000, Abcam, Ab32503, United Kingdom). Subsequently, the membranes were exposed to secondary antibodies (1:20,000; Proteintech, SA00001-2) linked to horseradish peroxidase for 1 h at room temperature, and detection was carried out using a chemiluminescence detection system (GE, Amersham Imager 680RGB, United States). The grayscale intensity of each blot was quantified using ImageJ software (provided by the National Institutes of Health, Bethesda, MD, USA), with band intensities normalized against the reference protein GAPDH (1:20,000; Proteintech, 10494-1-AP) or the aggregate target protein.
Masson’s trichrome staining and hematoxylin and eosin staining
Heart tissue samples were processed by fixing in 4% paraformaldehyde for a duration of 48 h, followed by dehydration and embedding in paraffin. Subsequently, they were sectioned into continuous slices with a thickness of 5 μm, suitable for histological analysis. To assess the extent of fibrosis in the left ventricle (LV), Masson’s trichrome staining was employed, as detailed in prior studies. The fibrosis level in the LV was calculated as the total collagen area within the LV divided by the LV’s total tissue area, multiplied by 100%. Additionally, the presence of inflammatory cells was evaluated using hematoxylin and eosin (H&E) staining. This involved staining with hematoxylin for 3 min, followed by a 3-min eosin counterstain. After treatment with xylene and mounting, the pathological alterations in the cardiac sections were examined using an Olympus optical microscope.
Statistical analysis
For continuous variables, the Student’s t-test or the Mann–Whitney U test was utilized for inferring the differences between two groups, with one-way analysis of variance or the Kruskal–Wallis test for comparison between multiple groups. Categorical data were expressed as numbers (or percent), with the chi-square test or Fisher’s exact test for comparison. Pearson’s or Spearman’s test was utilized for relationships between parameters. R packages (version 3.6.1) were applied for statistical analysis. Two-sided p <0.05 was regarded as statistical significance.
Results
Expression alterations of m6A regulators in AMI patients’ peripheral blood samples
The workflow of the current study is illustrated in Figure 1A. We presented an integrative analysis of m6A regulators in AMI. The genomic location of each m6A regulator is presented in Figure 1B and Supplementary Table 1. The deregulation of m6A regulators was investigated in circulating cells of AMI patients relative to that of healthy controls (Figures 1C, D). Specifically, ELAVL1, YTHDF1, IGF2BP1, IGFBP2, RBM15B, IGFBP1, and ALKBH5 displayed significant upregulation in AMI, with downregulation of FMR1, LRPPRC, YTHDC1, RBMX, HNRNPA2B1, YTHDC2, RBM15, CBLL1, METTL16, ZC3H13, YTHDF3, WTAP, and FTO (Figure 1E; Table 1), indicating that deregulated m6A regulators might participate in AMI pathogenesis.
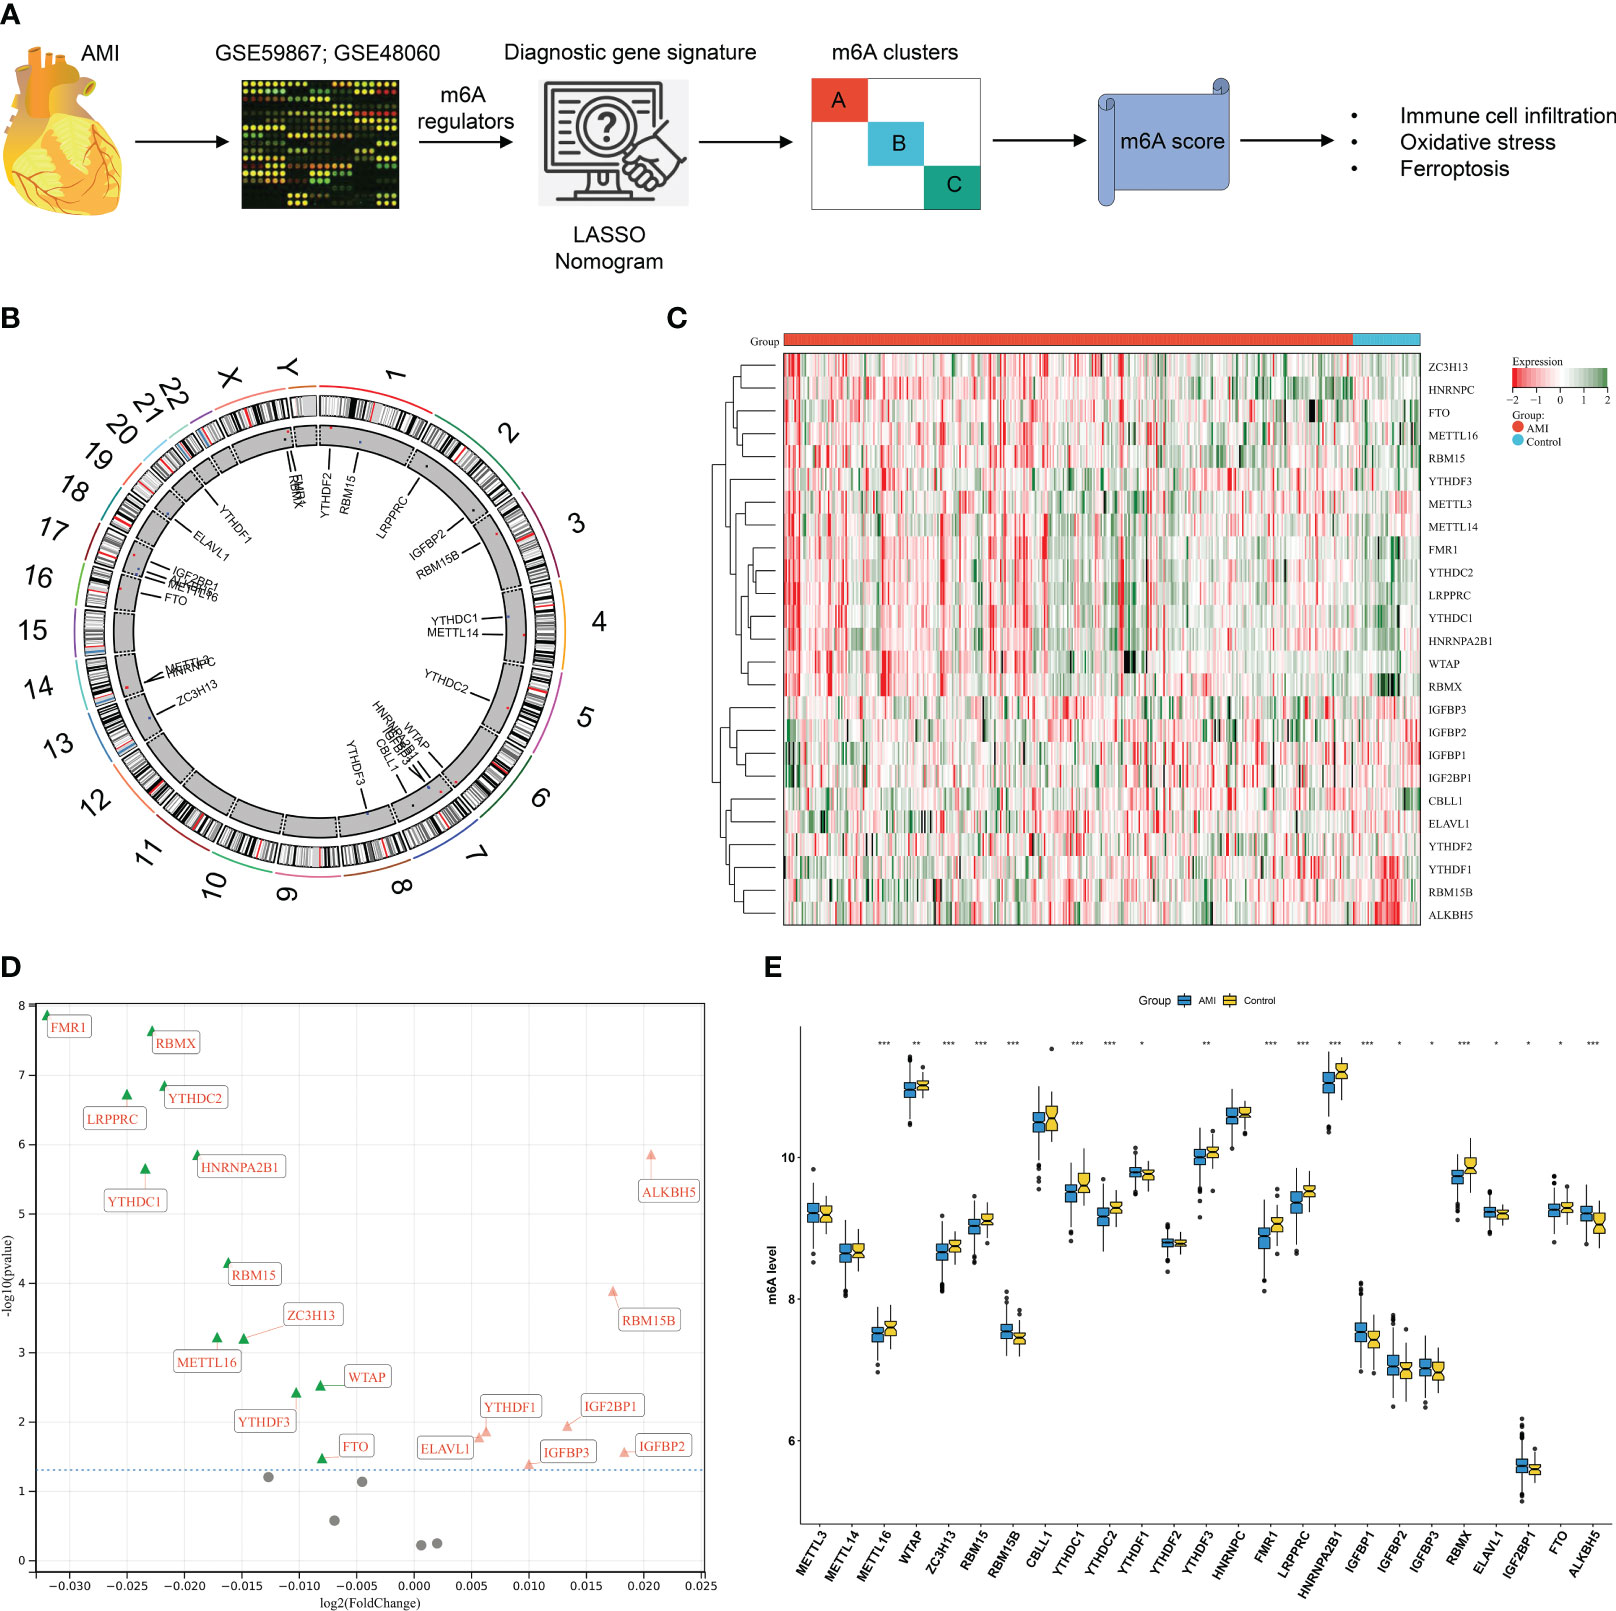
Figure 1 Expression alterations of N6-methyladenosine (m6A) regulators in acute myocardial infarction (AMI) patients’ peripheral blood samples in the GSE59867 dataset. (A) The workflow of the current study. (B) Details of the genomic location of m6A gene regulators were visualized through a circos plot. (C) Heatmap of the transcript expression level of each m6A gene regulator in peripheral blood samples from AMI patients and healthy controls. (D) Volcano plot of the 25 gene regulator genes: the red triangle represents upregulation in the AMI tissue, the green triangle represents upregulation in the control tissue, and the gray circle denotes no significance between AMI and control tissues. (E) Comparison of the expression of m6A regulators in AMI patients relative to healthy controls. *p < 0.05; **p < 0.01; ***p < 0.001.
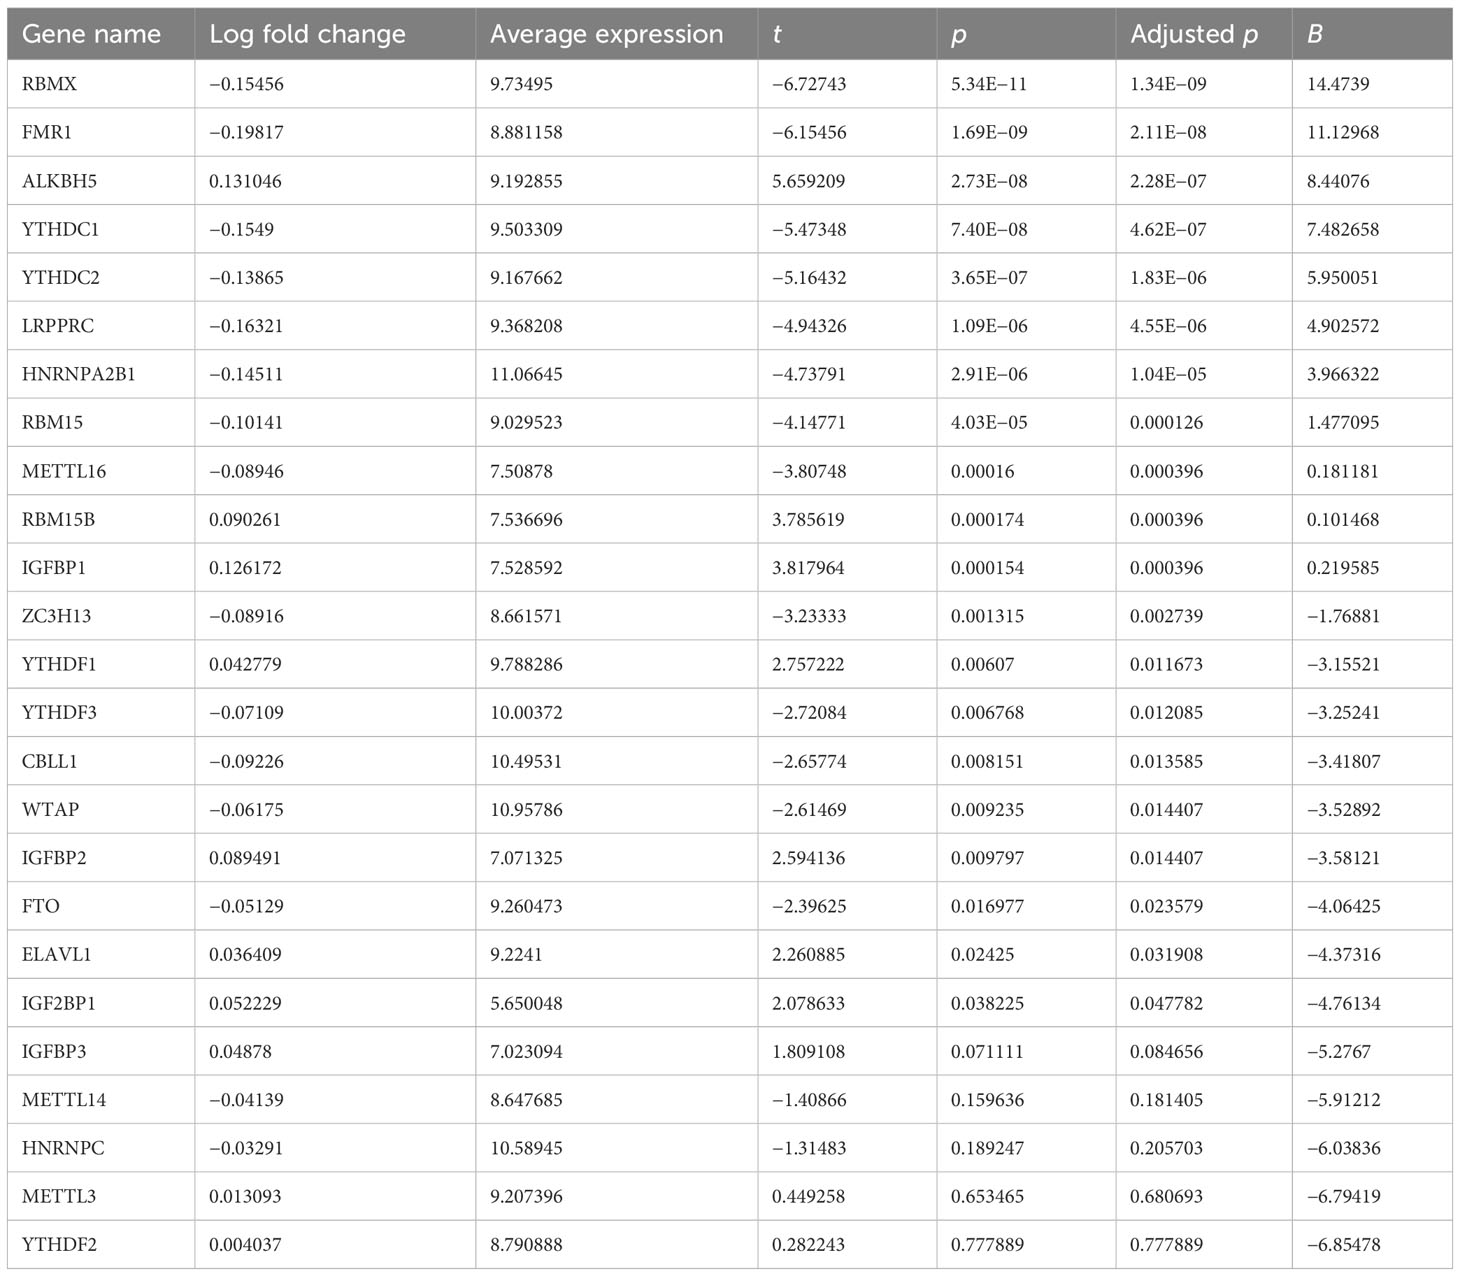
Table 1 Deregulation of m6A regulators in circulating cells from AMI patients versus controls.
Generation of an m6A regulator-based gene signature for diagnosing AMI
At the transcript level, we focused on the notably positive and negative interactions between m6A regulators in AMI (Figure 2A). Based on univariate and multivariate logistic regression results, WTAP, RBMX, and ALKBH5 were independent factors of AMI risk (Table 2). LASSO was executed to select the key m6A regulators. Consequently, 10 key m6A regulators were determined, comprising METTL16, WTAP, RBM15, CBLL1, YTHDC1, FMR1, IGFBP1, RBMX, ELAVL1, and ALKBH5 (Figures 2B, C). The m6A regulator-based gene signature was then generated, following the formula: risk score = (−3.891500067) * RBMX transcript level * + (−2.376689271) * RBM15 transcript level + (−1.76826797) * CBLL1 transcript level + (−1.557858912) * FMR1 transcript level + (−0.473279382) * METTL16 transcript level + (−0.461816131) * YTHDC1 transcript level + (1.528727298) * IGFBP1 transcript level + (1.872962542) * ELAVL1 transcript level + (3.096662537) * WTAP transcript level + (5.00949281) * ALKBH5 transcript level (Figure 2D). A higher risk score was observed in AMI patients relative to healthy controls (Figure 2E). ROCs proved that the m6A regulator-based risk score can accurately diagnose AMI (Figure 2F).
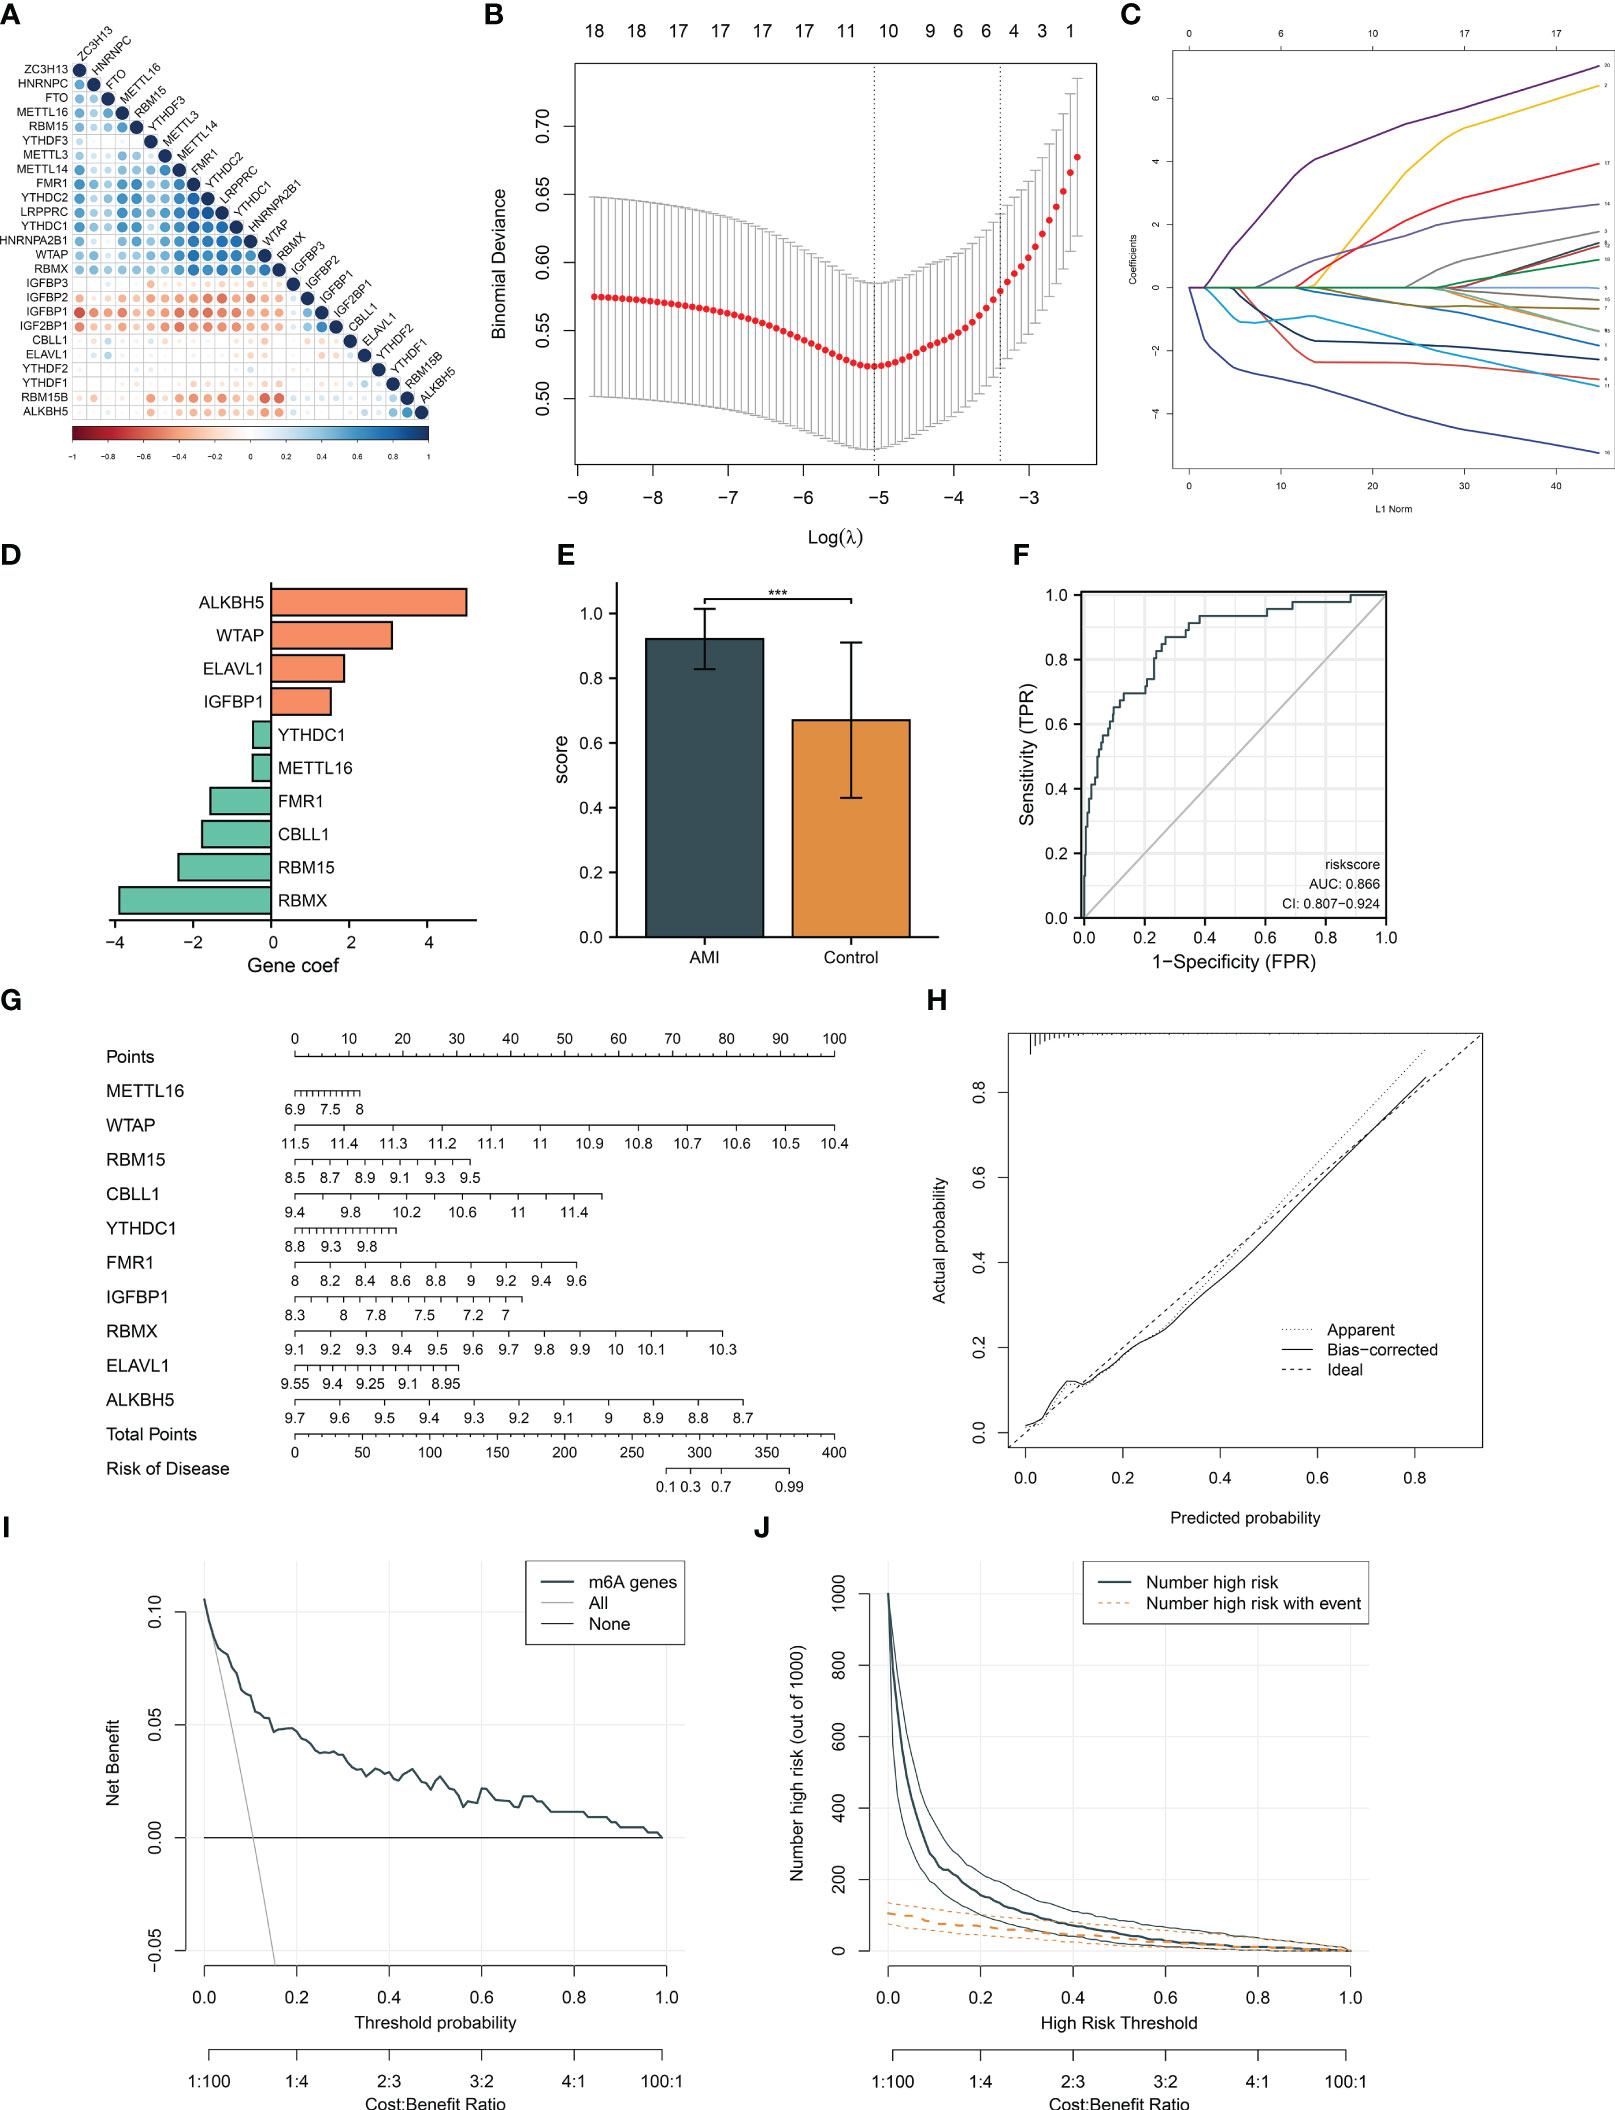
Figure 2 Generation of an m6A regulator gene model and a nomogram for diagnosing AMI and risk prediction in the GSE59867 dataset. (A) Correlation analysis between m6A regulators. The red dot represents a positive association; the blue dot represents a negative association. The bigger the circle, the stronger the association. (B) Ten cross-validation analysis for selecting key m6A regulators in the least absolute shrinkage and selection operator (LASSO) regression model. (C) The coefficient profiling of the LASSO. (D) The LASSO coefficient of each key m6A gene regulator in the LASSO-derived signature. (E) Differences of the m6A risk score between AMI patients and controls. (F) ROCs for assessing the diagnostic efficacy of risk score. (G) Definition of a nomogram based on key m6A gene regulator expression for risk prediction. (H) Calibration curve analysis to estimate the relationship of the nomogram predicted with actual probability. (I) Decision curve analysis for investigating the clinical net benefit of the nomogram. (J) Evaluation of the clinical impact of the nomogram. ***p < 0.001.
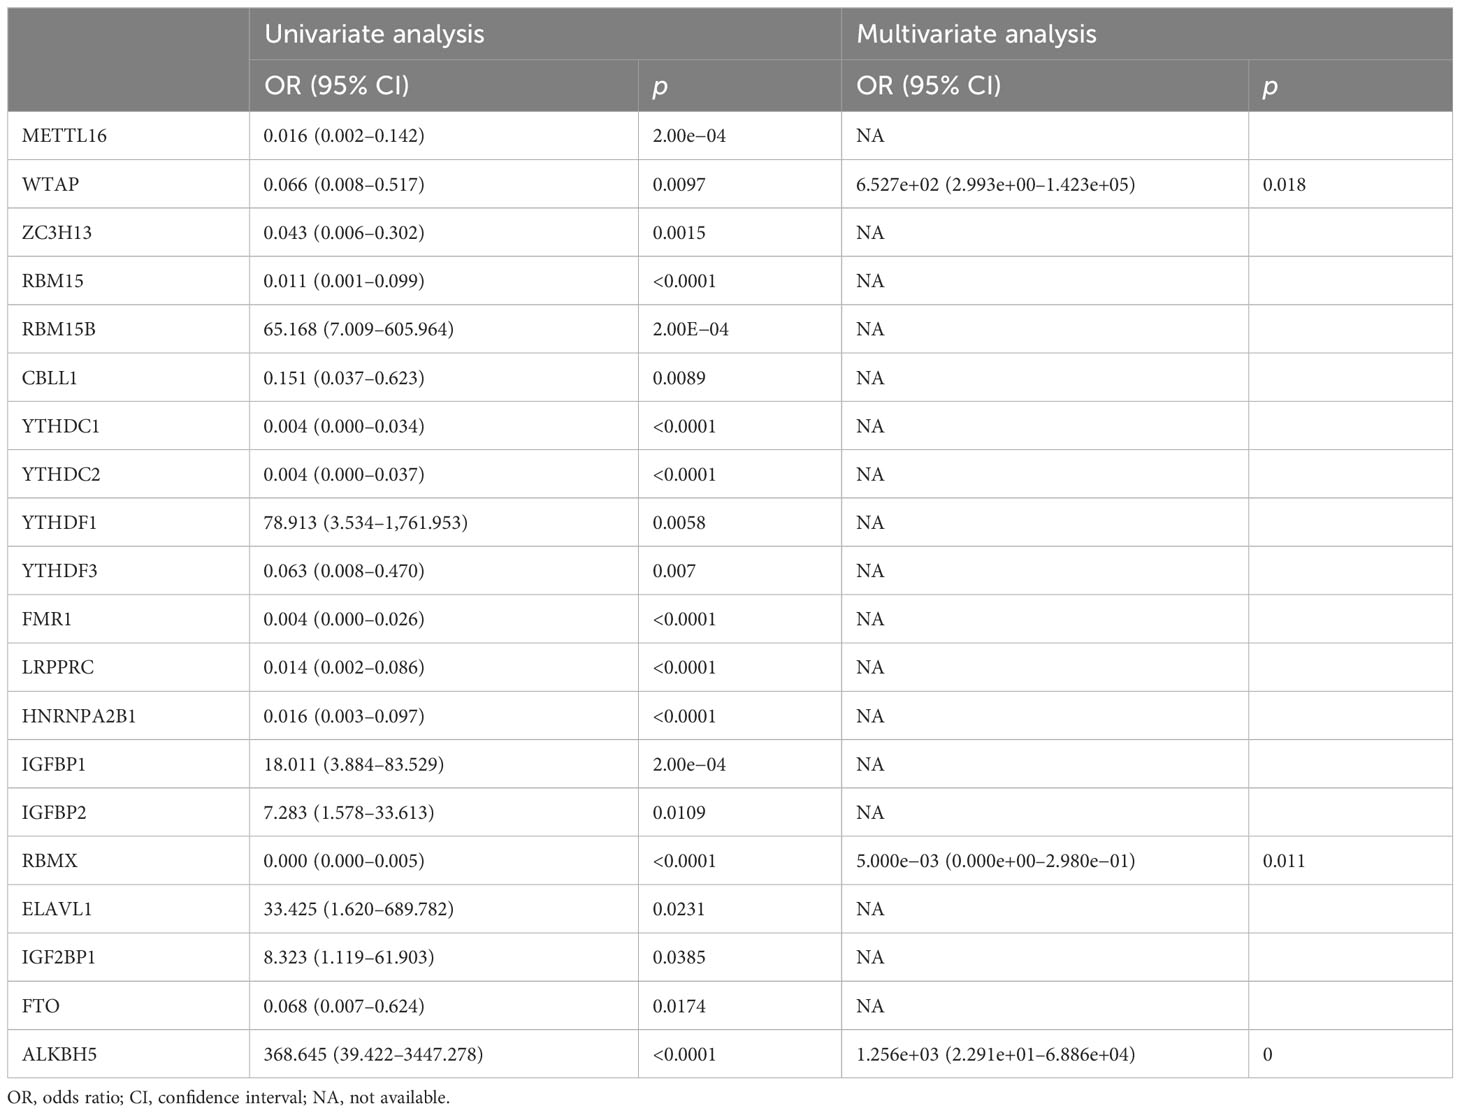
Table 2 Univariate and multivariate logistic regression analyses of m6A regulators.
Establishment of an m6A regulator-based nomogram for risk prediction
For facilitating clinical application, the current study generated a nomogram comprising key m6A regulators for predicting the risk of AMI (Figure 2G). The calibration curves demonstrated a high consistency between the nomogram prediction and actual observation (Figure 2H). In accordance with the decision curve analysis, the nomogram possessed higher net benefits for identifying AMI (Figure 2I). Additionally, clinical impact curves were drawn to assess the clinical utility of the nomogram. The results demonstrated that the nomogram-predicted outcome coincided well with the actual outcome (Figure 2J).
Expression alterations of key m6A regulators and their relationships with ferroptosis and oxidative stress and assessment of their diagnostic performance
Circulating key m6A regulators were deregulated in AMI relative to controls (Figure 3A). Evidence proves that m6A modification regulates ferroptosis in heart diseases (11, 13). Herein, we noticed that key m6A regulators were remarkably associated with most ferroptosis genes in AMI (Figure 3B). Previous research unveiled that m6A-modified oxidative stress facilitates myocardial ischemia/reperfusion damage (30, 31). NRF2 and its cytoplasmic repressor KEAP1 act as the main regulators of oxidative stress (32). Key m6A regulators were observably linked with NFE2L2 and KEAP1 in AMI (Figure 3C). ROCs demonstrated that key m6A regulators have a conspicuous performance in diagnosing AMI (Figures 3D-M). The outstanding diagnostic efficacy of each key m6A regulator was also verified in the GSE48060 dataset (Supplementary Figures 1A–J).
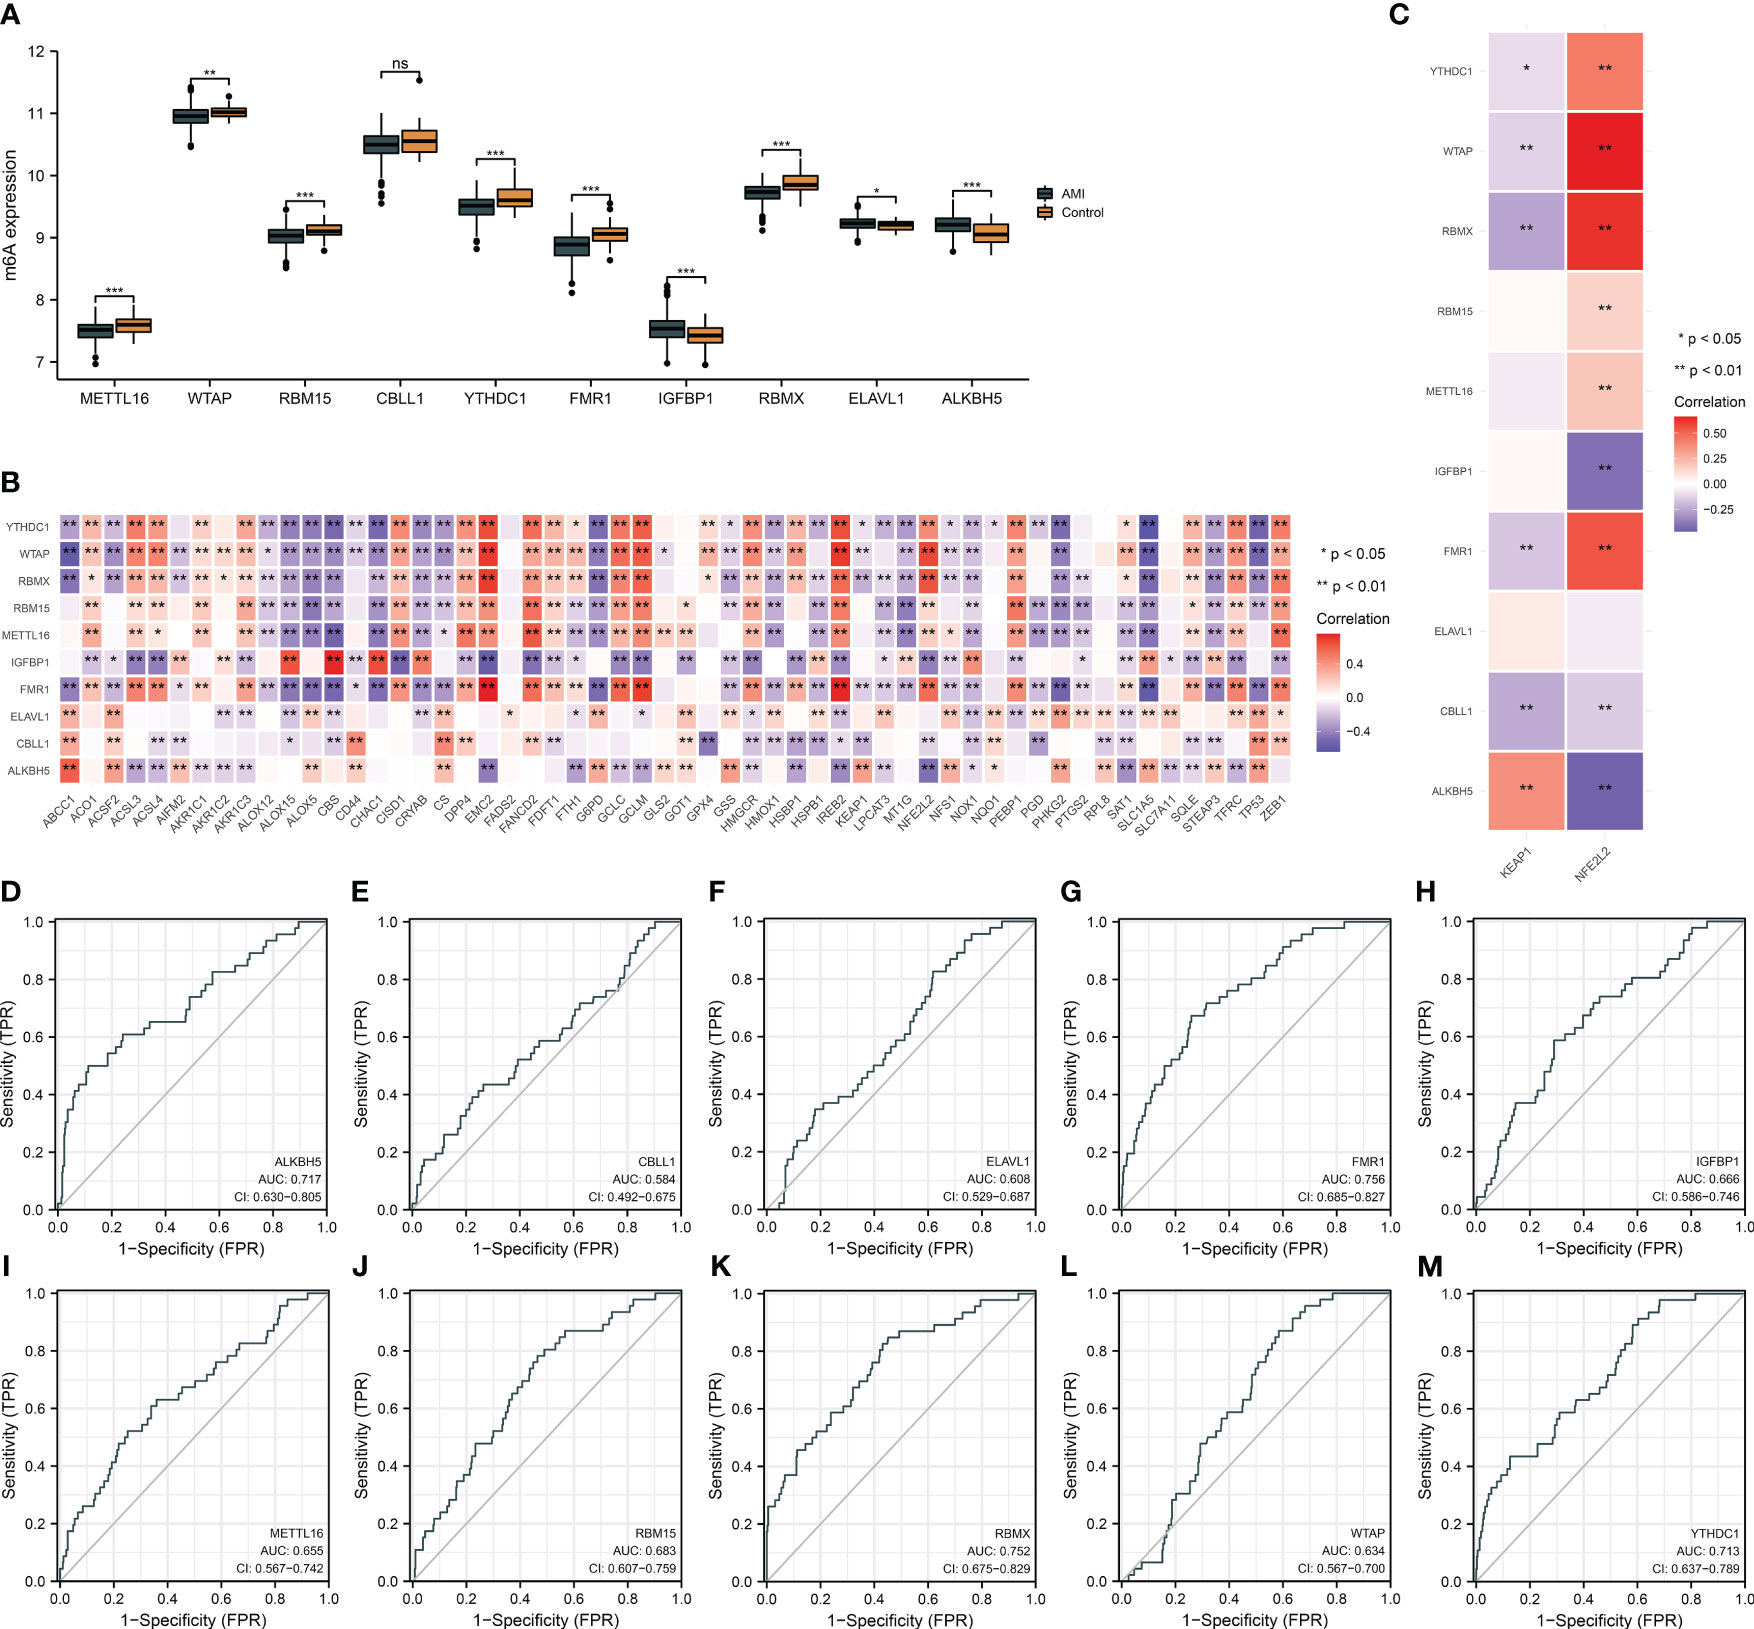
Figure 3 Expression alterations of key m6A regulators and their relationships with ferroptosis and oxidative stress and assessment of their diagnostic performance in the GSE59867 dataset. (A) Differences in the transcript level of each key m6A regulator in AMI and controls. (B) Heatmap illustrating the relationship of key m6A regulators with ferroptosis genes. Red, positive association; blue, negative association. (C) Association between key m6A regulators and oxidative stress mediators (NFE2L2 and KEAP1). (D–M) ROCs for evaluating the diagnostic ability of each key m6A regulator (ALKBH5, CBLL1, ELAVL1, FMR1, IGFBP1, METTL16, RBM15, RBMX, WTAP, and YTHDC1) in AMI. *p < 0.05; **p < 0.01; ***p < 0.001; ns: p > 0.05 NS means no significant.
Classification of AMI patients into three m6A clusters
In accordance with the transcriptome profiles of m6A regulators, the present research implemented consensus clustering analysis among AMI patients. When k = 3, the CDF curve displayed the smallest descending slope (Figure 4A). The area under the CDF curve exhibited the lowest decrease when k = 4 (Figure 4B). Item and consensus matrix plots revealed that AMI patients were obviously stratified into three m6A clusters (Figures 4C, D). Based on the above evidence, the optimal k value was set as 3. Diverse transcript levels of m6A regulators were investigated across m6A clusters, reflecting the unique m6A modification phenotype of each cluster (Figures 4E, F). PCA proved the discrepancy in transcriptome profiling among the three m6A clusters (Figure 4G).
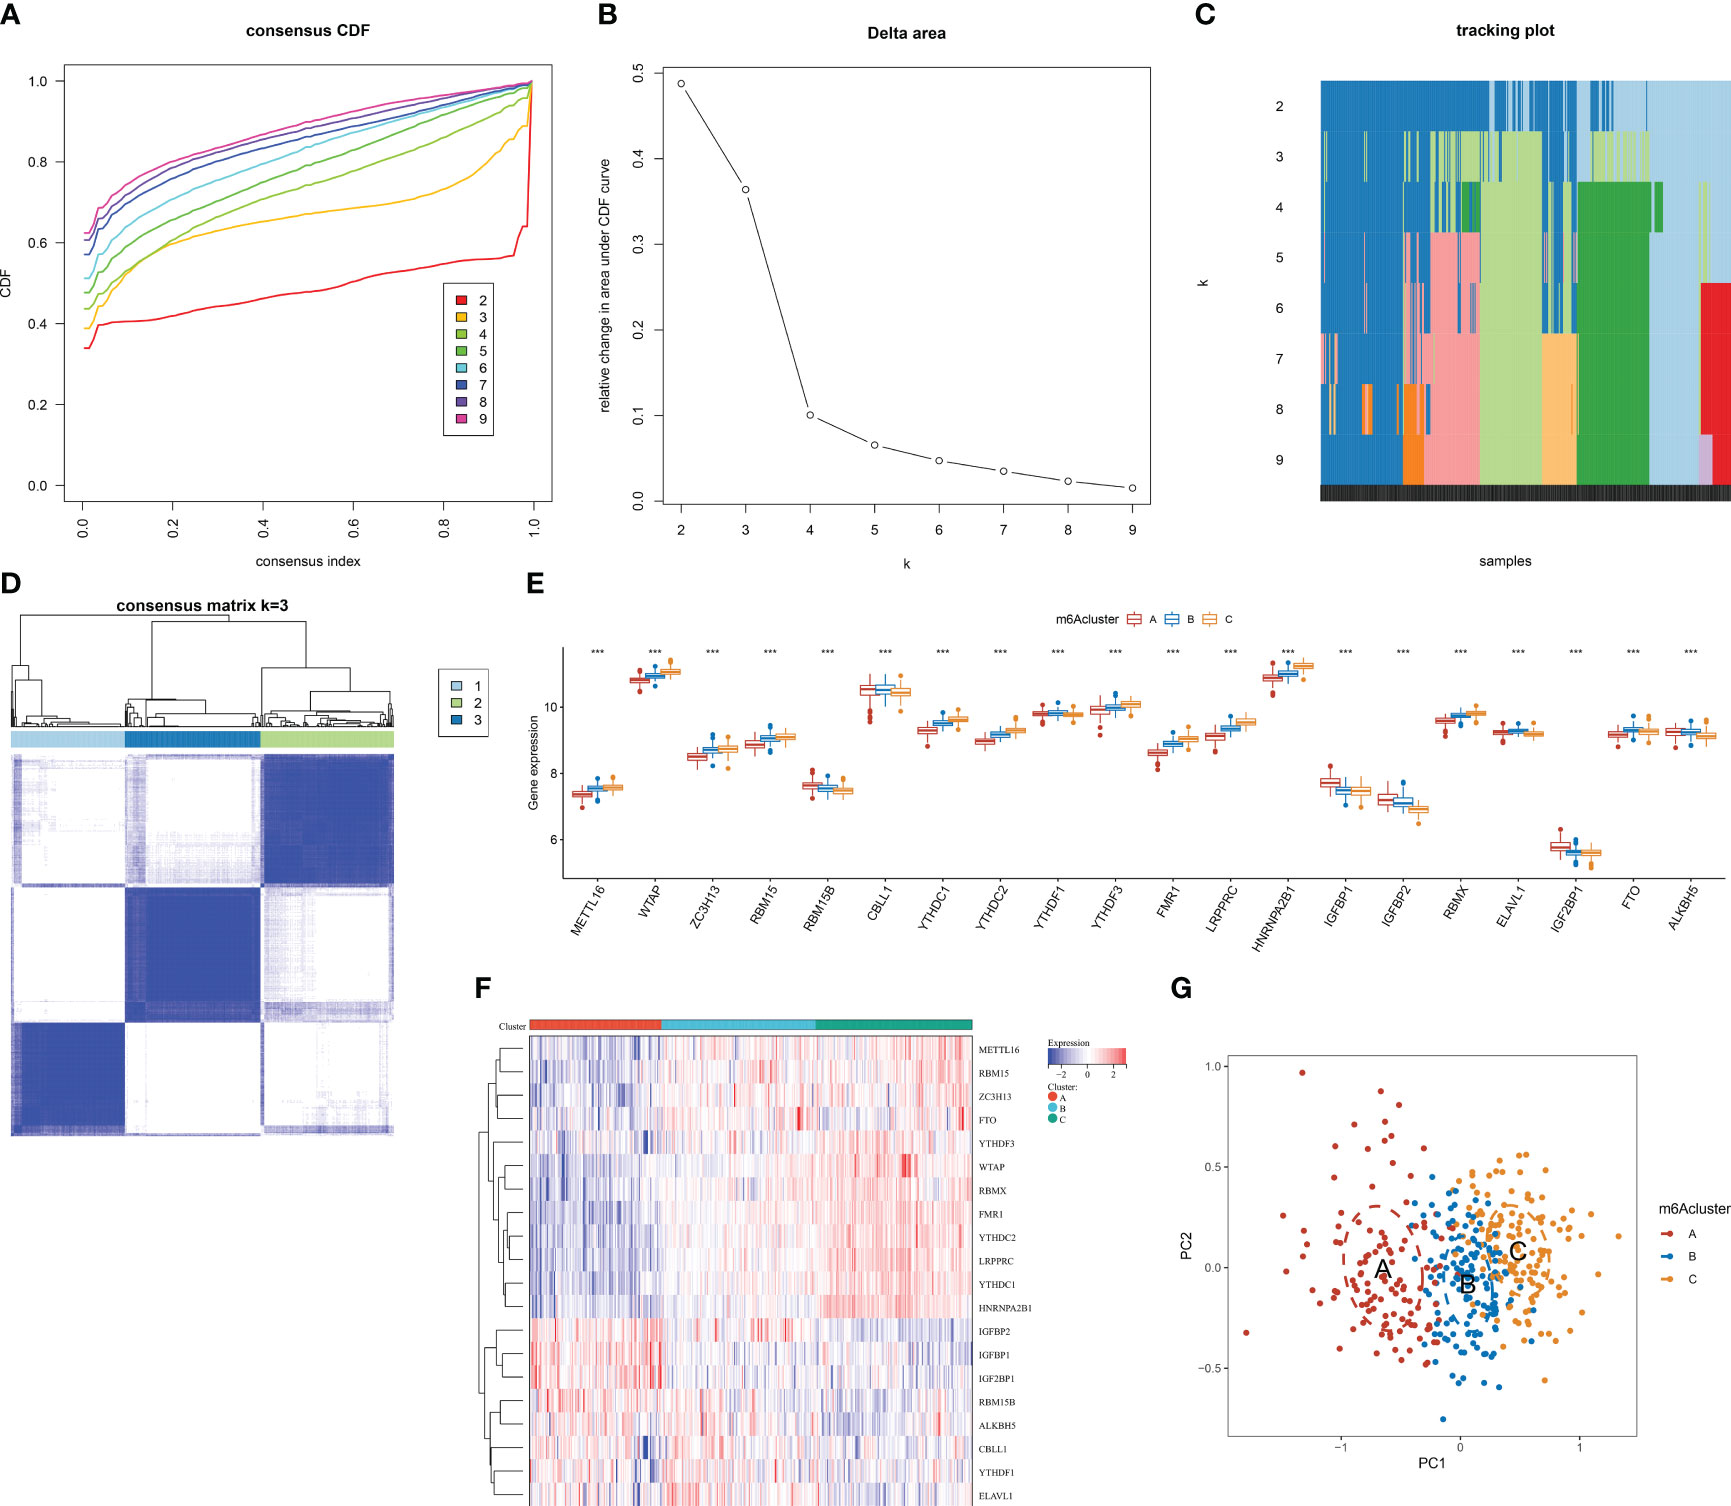
Figure 4 Identification of the three m6A clusters associated with AMI in the GSE59867 dataset. (A) Consensus clustering cumulative distribution function curve from k = 2 to k = 9. (B) Relative change value in the area under the CDF curve for k = 2 to k = 9. (C) Item tracking plot for k = 2 to k = 9. (D) Consensus matrix at k = 3 based on the transcriptome profiling of m6A regulators. (E) Differences in the transcript level of each m6A regulator between m6A clusters. (F) Heatmap illustrating the transcriptome profiles of m6A regulators in each m6A cluster. (G) PCA plots visualizing the transcriptome differences among the three m6A clusters based on m6A regulators. ***p < 0.001.
Three m6A clusters with diverse immune cell infiltration, ferroptosis, and oxidative stress traits in AMI
Next, the widespread discrepancy in the abundance of most immune cell types was found across the three m6A clusters (Figure 5A). Each m6A regulator was markedly correlated to immune cell infiltration (Figure 5B). Notably, FMR1 displayed the strongest positive association with activated CD4+ T cells, with the strongest negative relationship between LRPPRC and MDSCs (Figures 5C, D). We also focused on the unique ferroptosis features in each m6A cluster based on the diverse transcript levels of ferroptosis genes (Figure 5E). NFE2L2 presented the highest transcript level in m6A cluster C, followed by clusters B and C (Figure 5F). No notable discrepancy in KEAP1 level was investigated across m6A clusters (Figure 5G). Thus, three m6A clusters possessed diverse immune cell infiltration, ferroptosis, and oxidative stress traits.
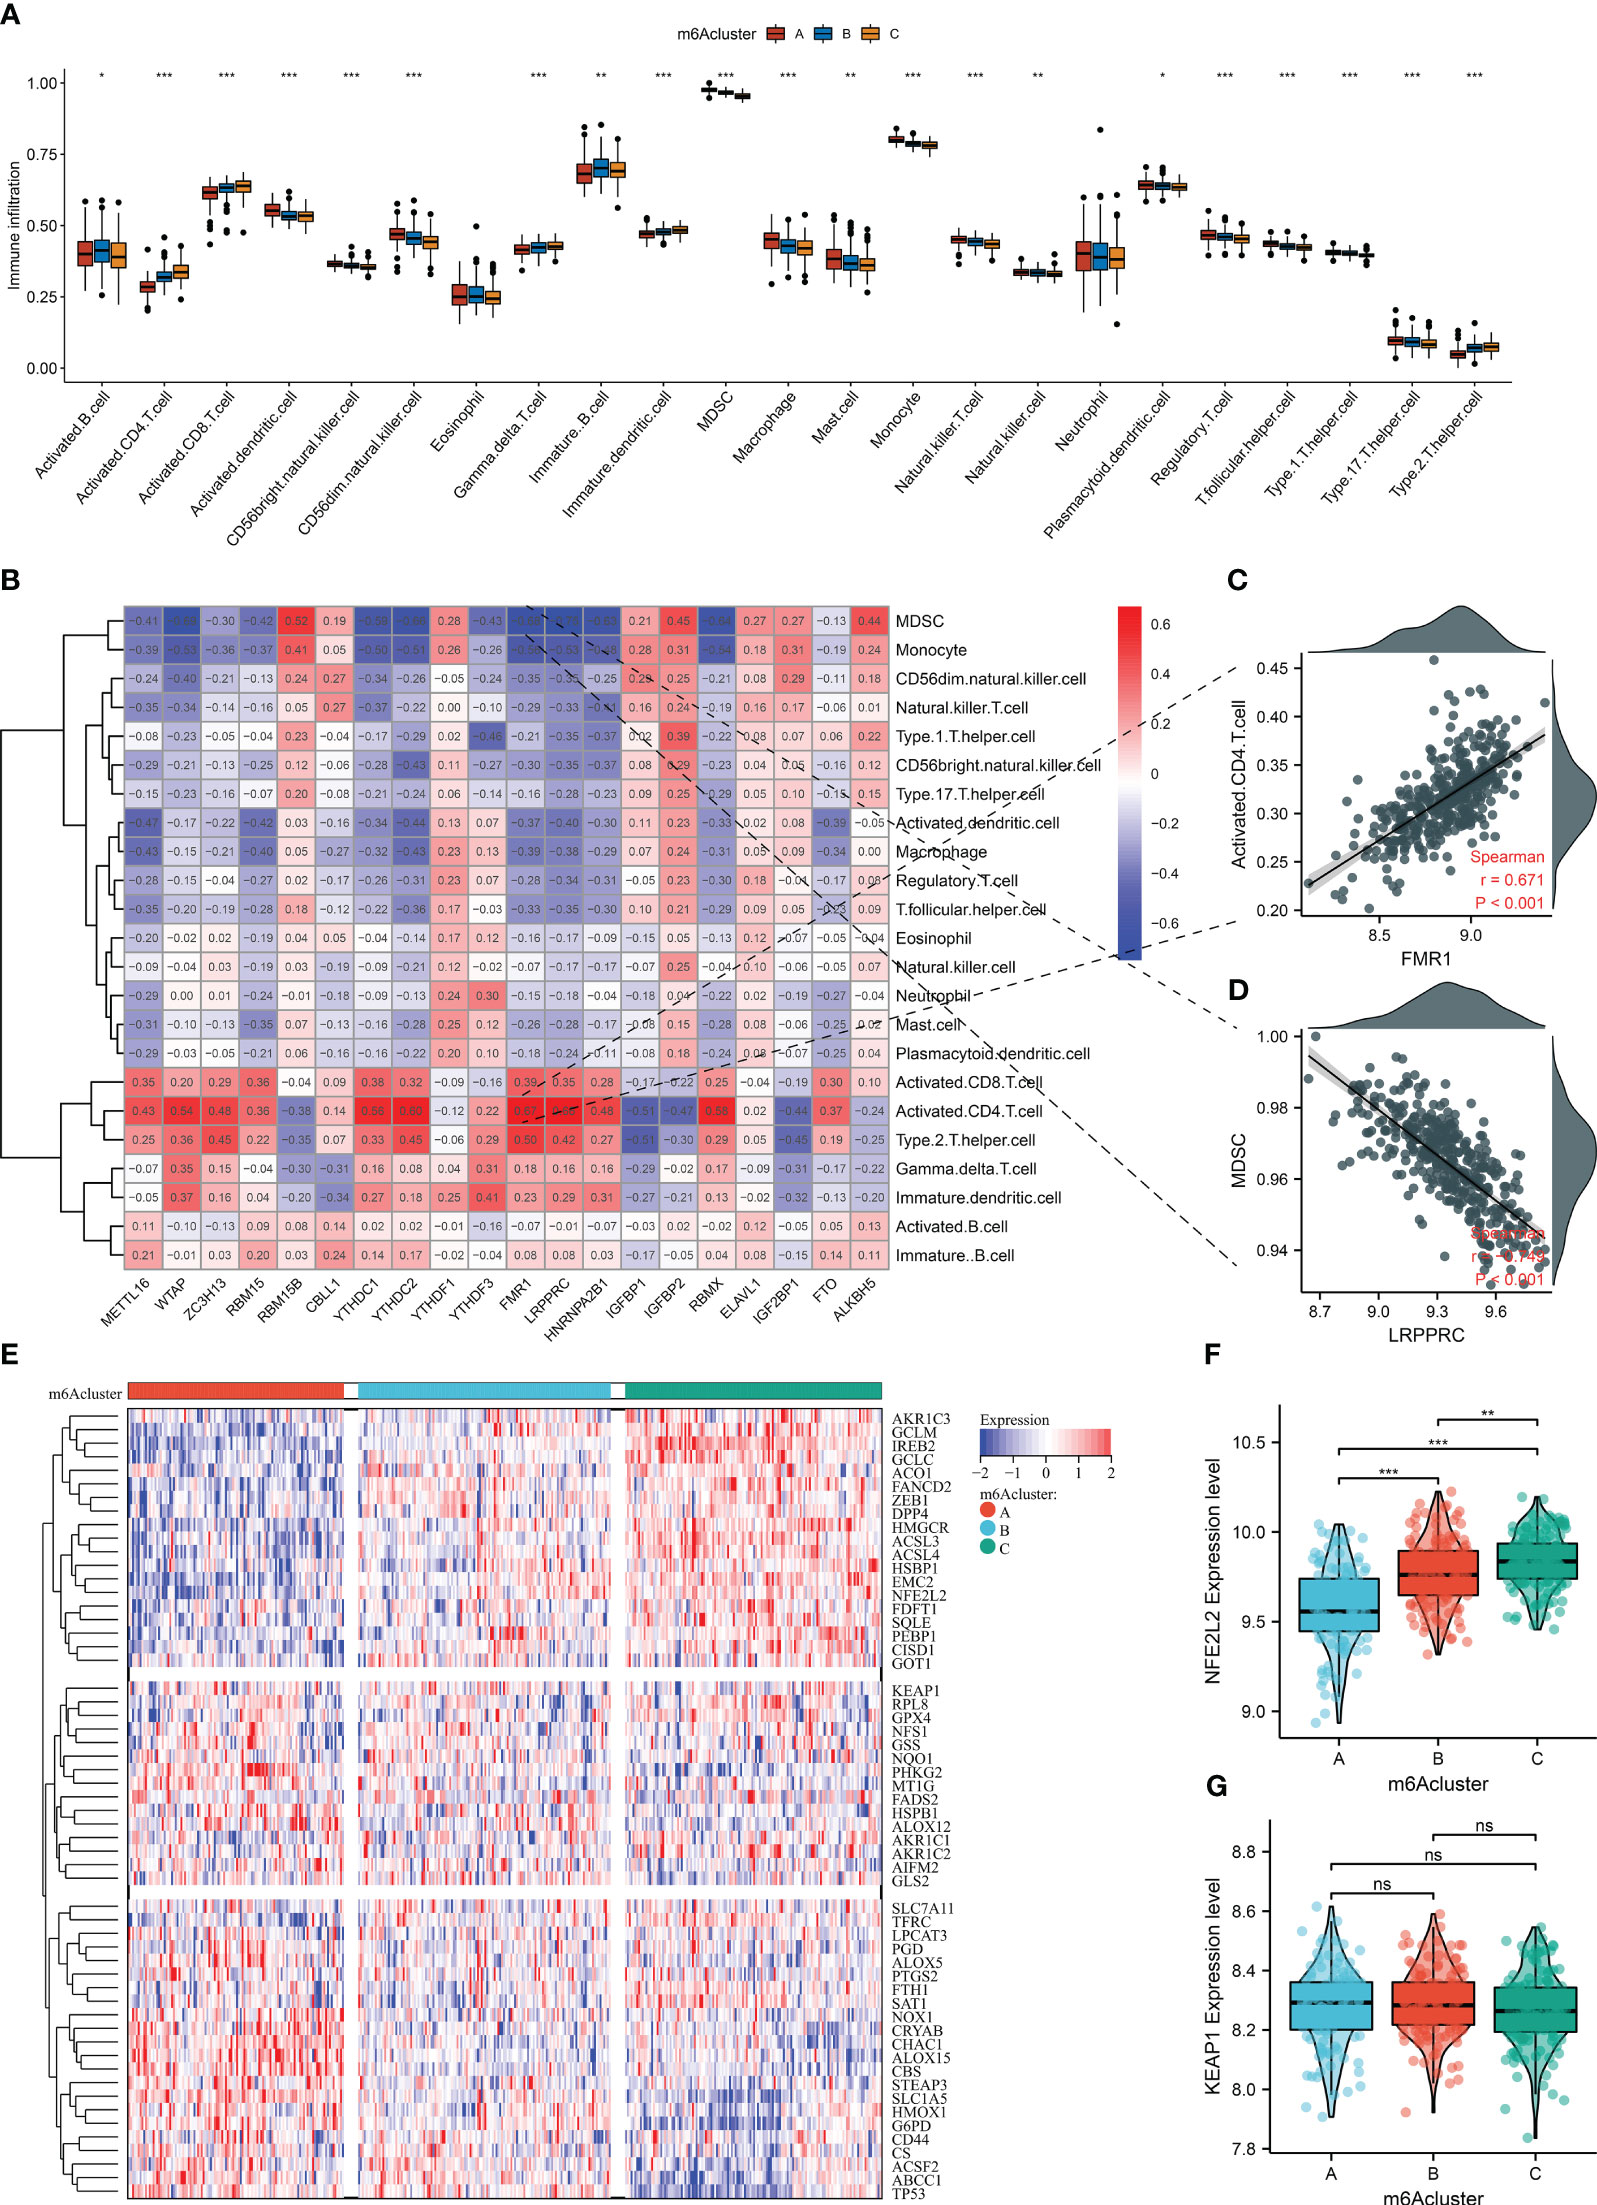
Figure 5 The three m6A clusters with diverse immune cell infiltration, ferroptosis, and oxidative stress traits in AMI from the GSE59867 dataset. (A) Differences in the infiltration of immune cells between m6A clusters. (B) Correlation heatmap showed the relationship between m6A regulators and the abundance of immune cells. (C) Scatter plots of the correlation between FMR1 and activated CD4+ T cells. (D) Scatter plots illustrating the association of LRPPRC and MDSCs. (E) Heatmap of the transcript level of each ferroptosis gene across m6A clusters. (F, G) Comparison of the transcript levels of oxidative stress mediators (NFE2L2 and KEAP1) between the three m6A clusters. *p < 0.05; **p < 0.01; ***p < 0.001; ns: p > 0.05 NS means no significant.
Selection of m6A cluster-relevant genes
To further unveil the m6A modification mechanisms, genes with differential expression between m6A clusters were selected with adjusted p <0.05. After intersecting, 265 m6A cluster-relevant genes were eventually acquired (Figure 6A; Supplementary Table 2). In accordance with the GO annotation results, m6A cluster-relevant genes presented notable enrichment of viral infection and mRNA metabolism processes (Figures 6B, C). In addition, nucleocytoplasmic transport was prominently linked with m6A cluster-relevant genes (Figure 6D). These findings proved the functional importance of m6A cluster-relevant genes in AMI.
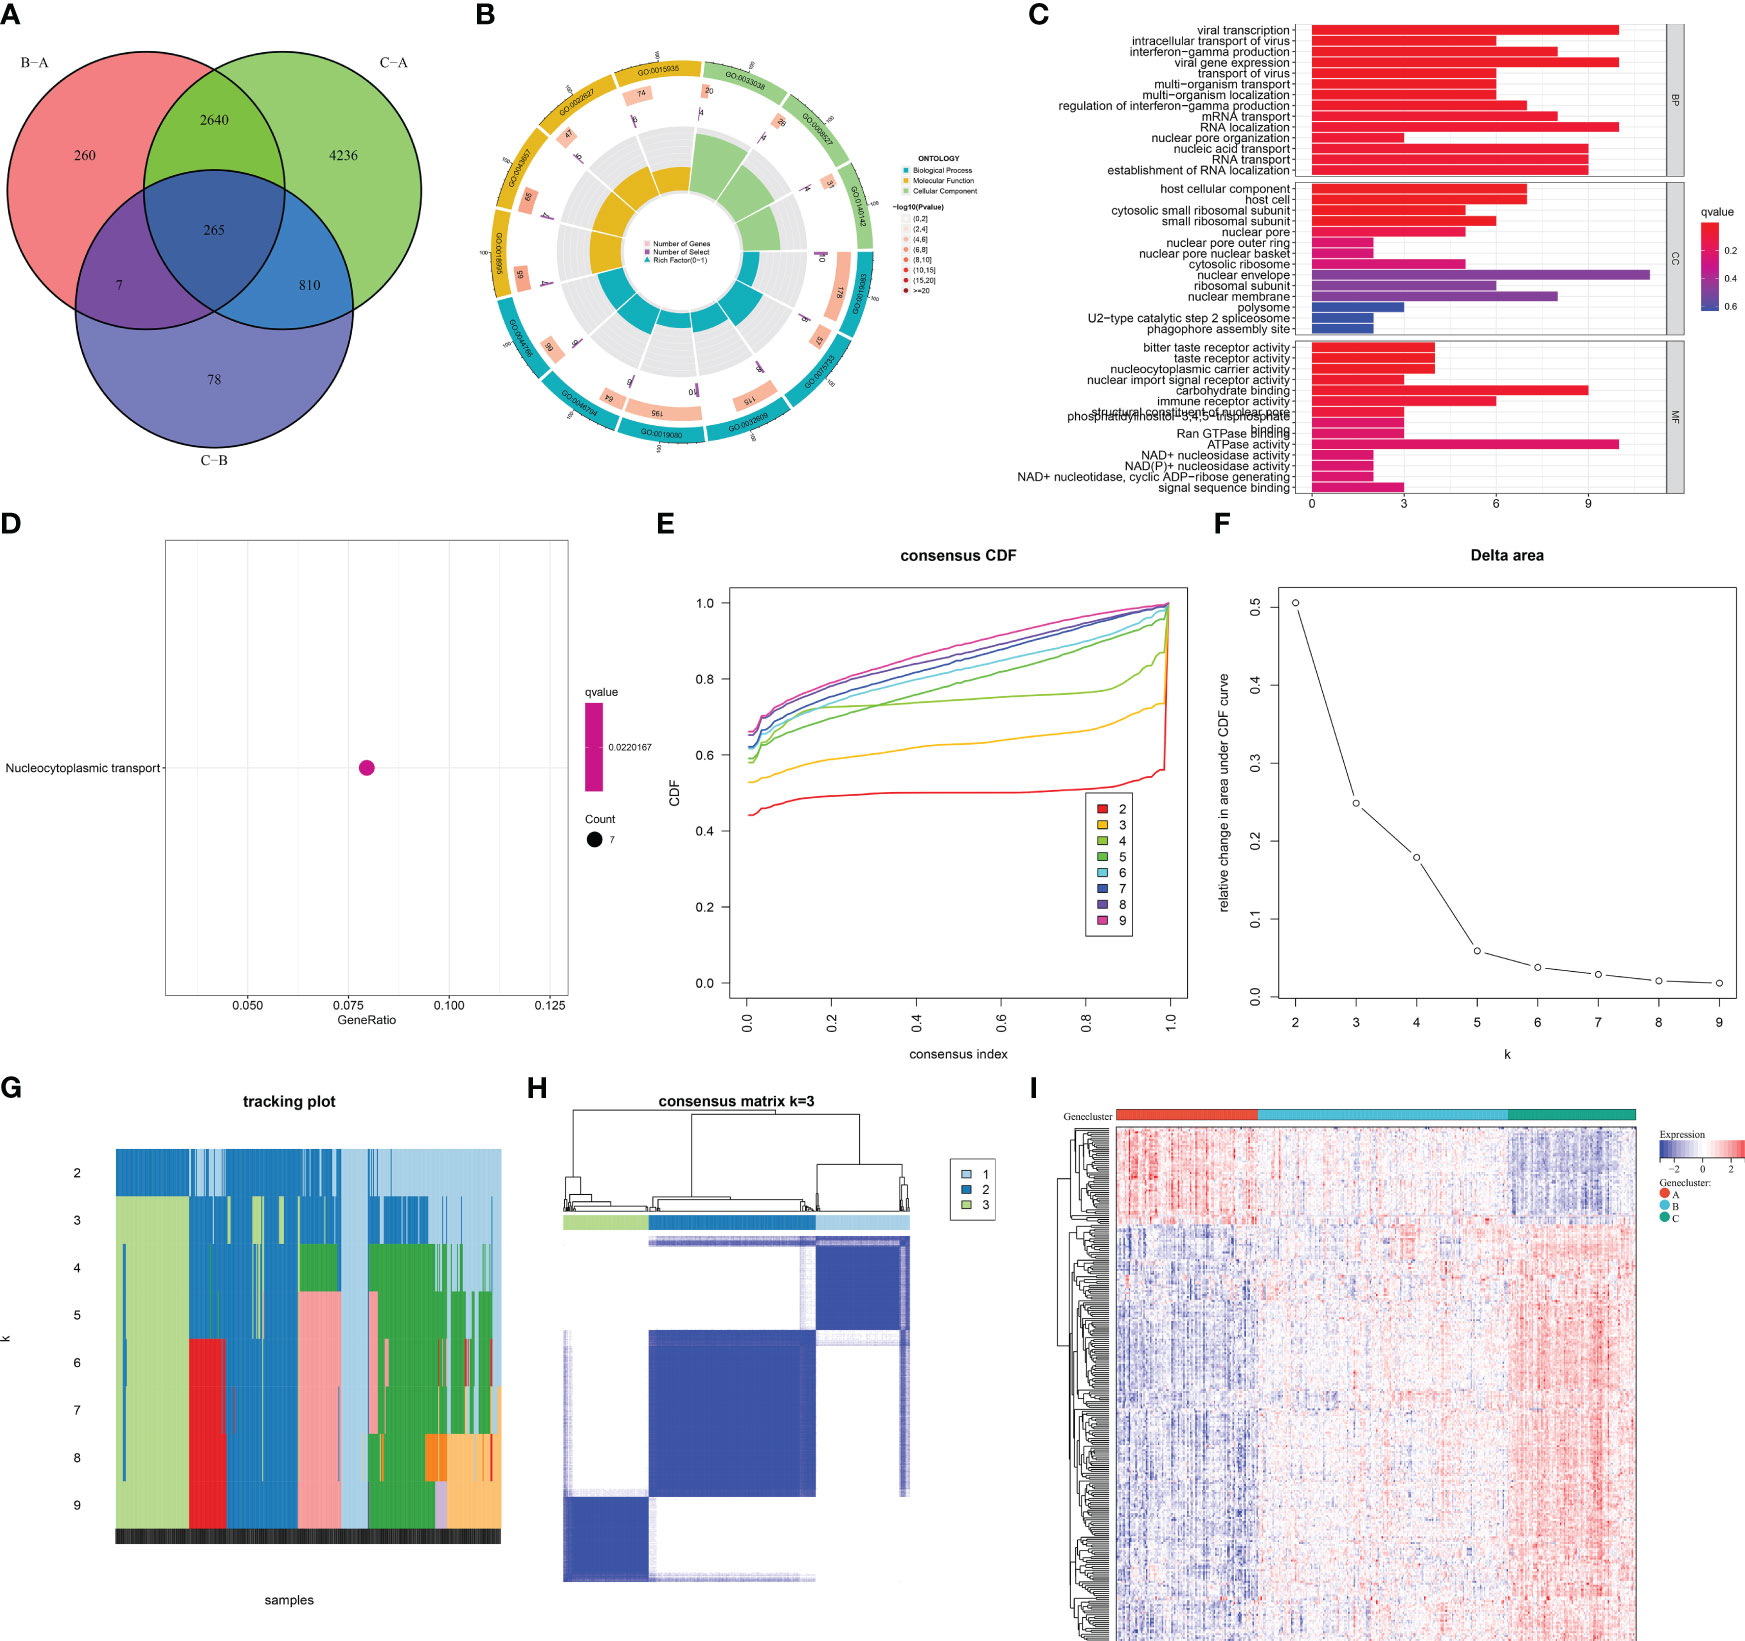
Figure 6 Selection of m6A cluster-relevant genes and construction of m6A gene clusters in AMI patients from the GSE59867 dataset. (A) Venn diagram illustrating the m6A cluster-relevant genes through intersecting differentially expressed genes between m6A clusters. (B, C) The enriched GO terms by m6A cluster-relevant genes. (D) The enriched one KEGG pathway by m6A cluster-relevant genes. (E) Consensus clustering cumulative distribution function curve from k = 2 to k = 9. (F) Relative change value in the area under the CDF curve for k = 2 to k = 9. (G) Item tracking plot for k = 2 to k = 9. (H) Consensus matrix at k = 3 based on the transcriptome profiling of m6A cluster-relevant genes across distinct m6A gene clusters. (I) Heatmap of the transcript levels of m6A cluster-relevant genes across distinct m6A gene clusters.
Construction of the three m6A gene clusters across AMI patients
Based on the m6A cluster-relevant genes, consensus clustering was executed across AMI patients. The CDF curve presented the smallest descending slope when k = 3 (Figure 6E). When k = 4, the area under the CDF curve had the lowest decrease (Figure 6F). Item and consensus matrix plots demonstrated that AMI patients were clearly classified into three m6A gene clusters (Figures 6G, H). Altogether, the optimal k value was 3. In Figure 6I, each m6A gene cluster presented unique transcript levels of m6A cluster-relevant genes.
The heterogeneity in m6A regulators, immune cells, ferroptosis, and oxidative stress among distinct m6A gene clusters
As expected, the three m6A gene clusters presented prominent differences in transcript levels of m6A regulators, proving the distinct m6A modification patterns (Figure 7A). In addition, heterogeneity in the infiltration of most immune cells was found across m6A regulators (Figure 7B). Next, the current study investigated ferroptosis activity among m6A gene clusters. As illustrated in Figure 7C, ferroptosis genes displayed unique transcript levels in each gene cluster. m6A gene cluster A possessed the lowest level of NFE2L2, followed by clusters B and C (Figure 7D). Also, lower KEAP1 expression was investigated in m6A gene cluster C (Figure 7E). The above evidence proved the heterogeneity in m6A regulators, immune cells, ferroptosis, and oxidative stress among diverse m6A gene clusters.
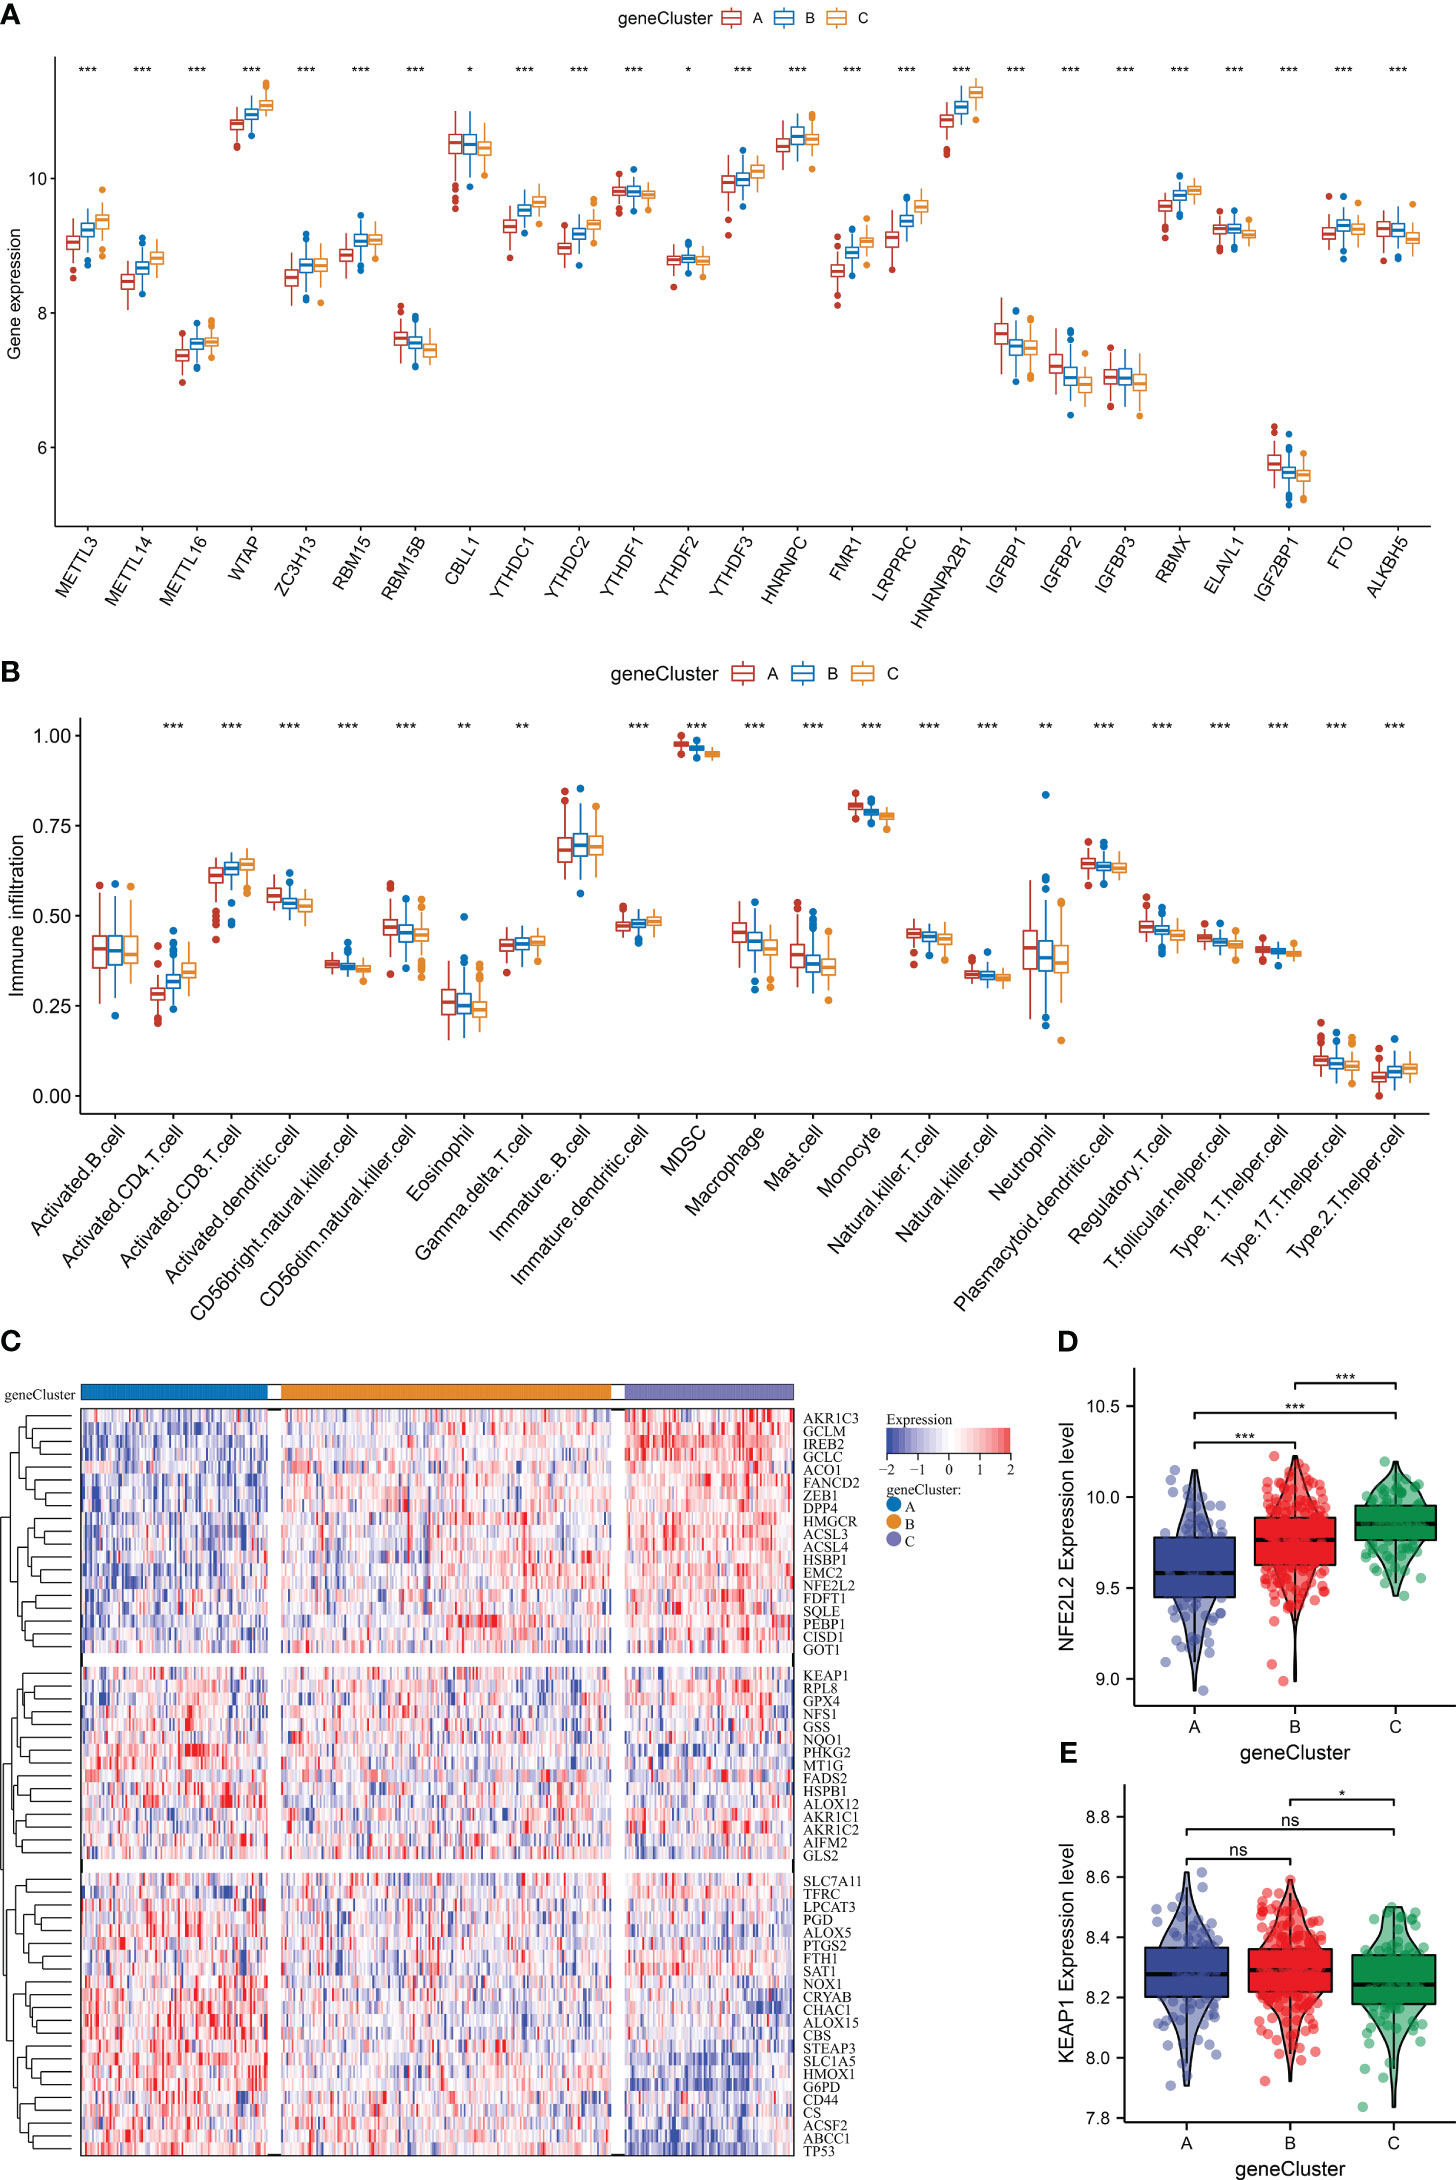
Figure 7 The heterogeneity in m6A regulators, immune cells, ferroptosis, and oxidative stress among distinct m6A gene clusters in the GSE59867 dataset. (A) Differences in the transcript level of each m6A regulator across m6A gene clusters. (B) Comparison of the abundance of immune cells between m6A gene clusters. (C) Heatmap of the transcript levels of ferroptosis genes in each m6A gene cluster. (D, E) Differences in the transcript levels of oxidative stress regulators (NFE2L2 and KEAP1) between m6A gene clusters. *p < 0.05; **p < 0.01; ***p < 0.001; ns: p > 0.05. NS means no significant.
Definition of the m6A score system for AMI
To quantify the m6A modification in AMI, PCA was adopted for the extracted m6A cluster-relevant genes (Figure 8A). A remarkable difference in the m6A score was noticed across the three m6A clusters (Figure 8B). m6A cluster C presented the highest m6A score, followed by cluster B, and cluster A had the lowest score. A similar m6A score pattern was observed among the three m6A gene clusters (Figure 8C). Hence, the m6A score can reflect the m6A modification in AMI.
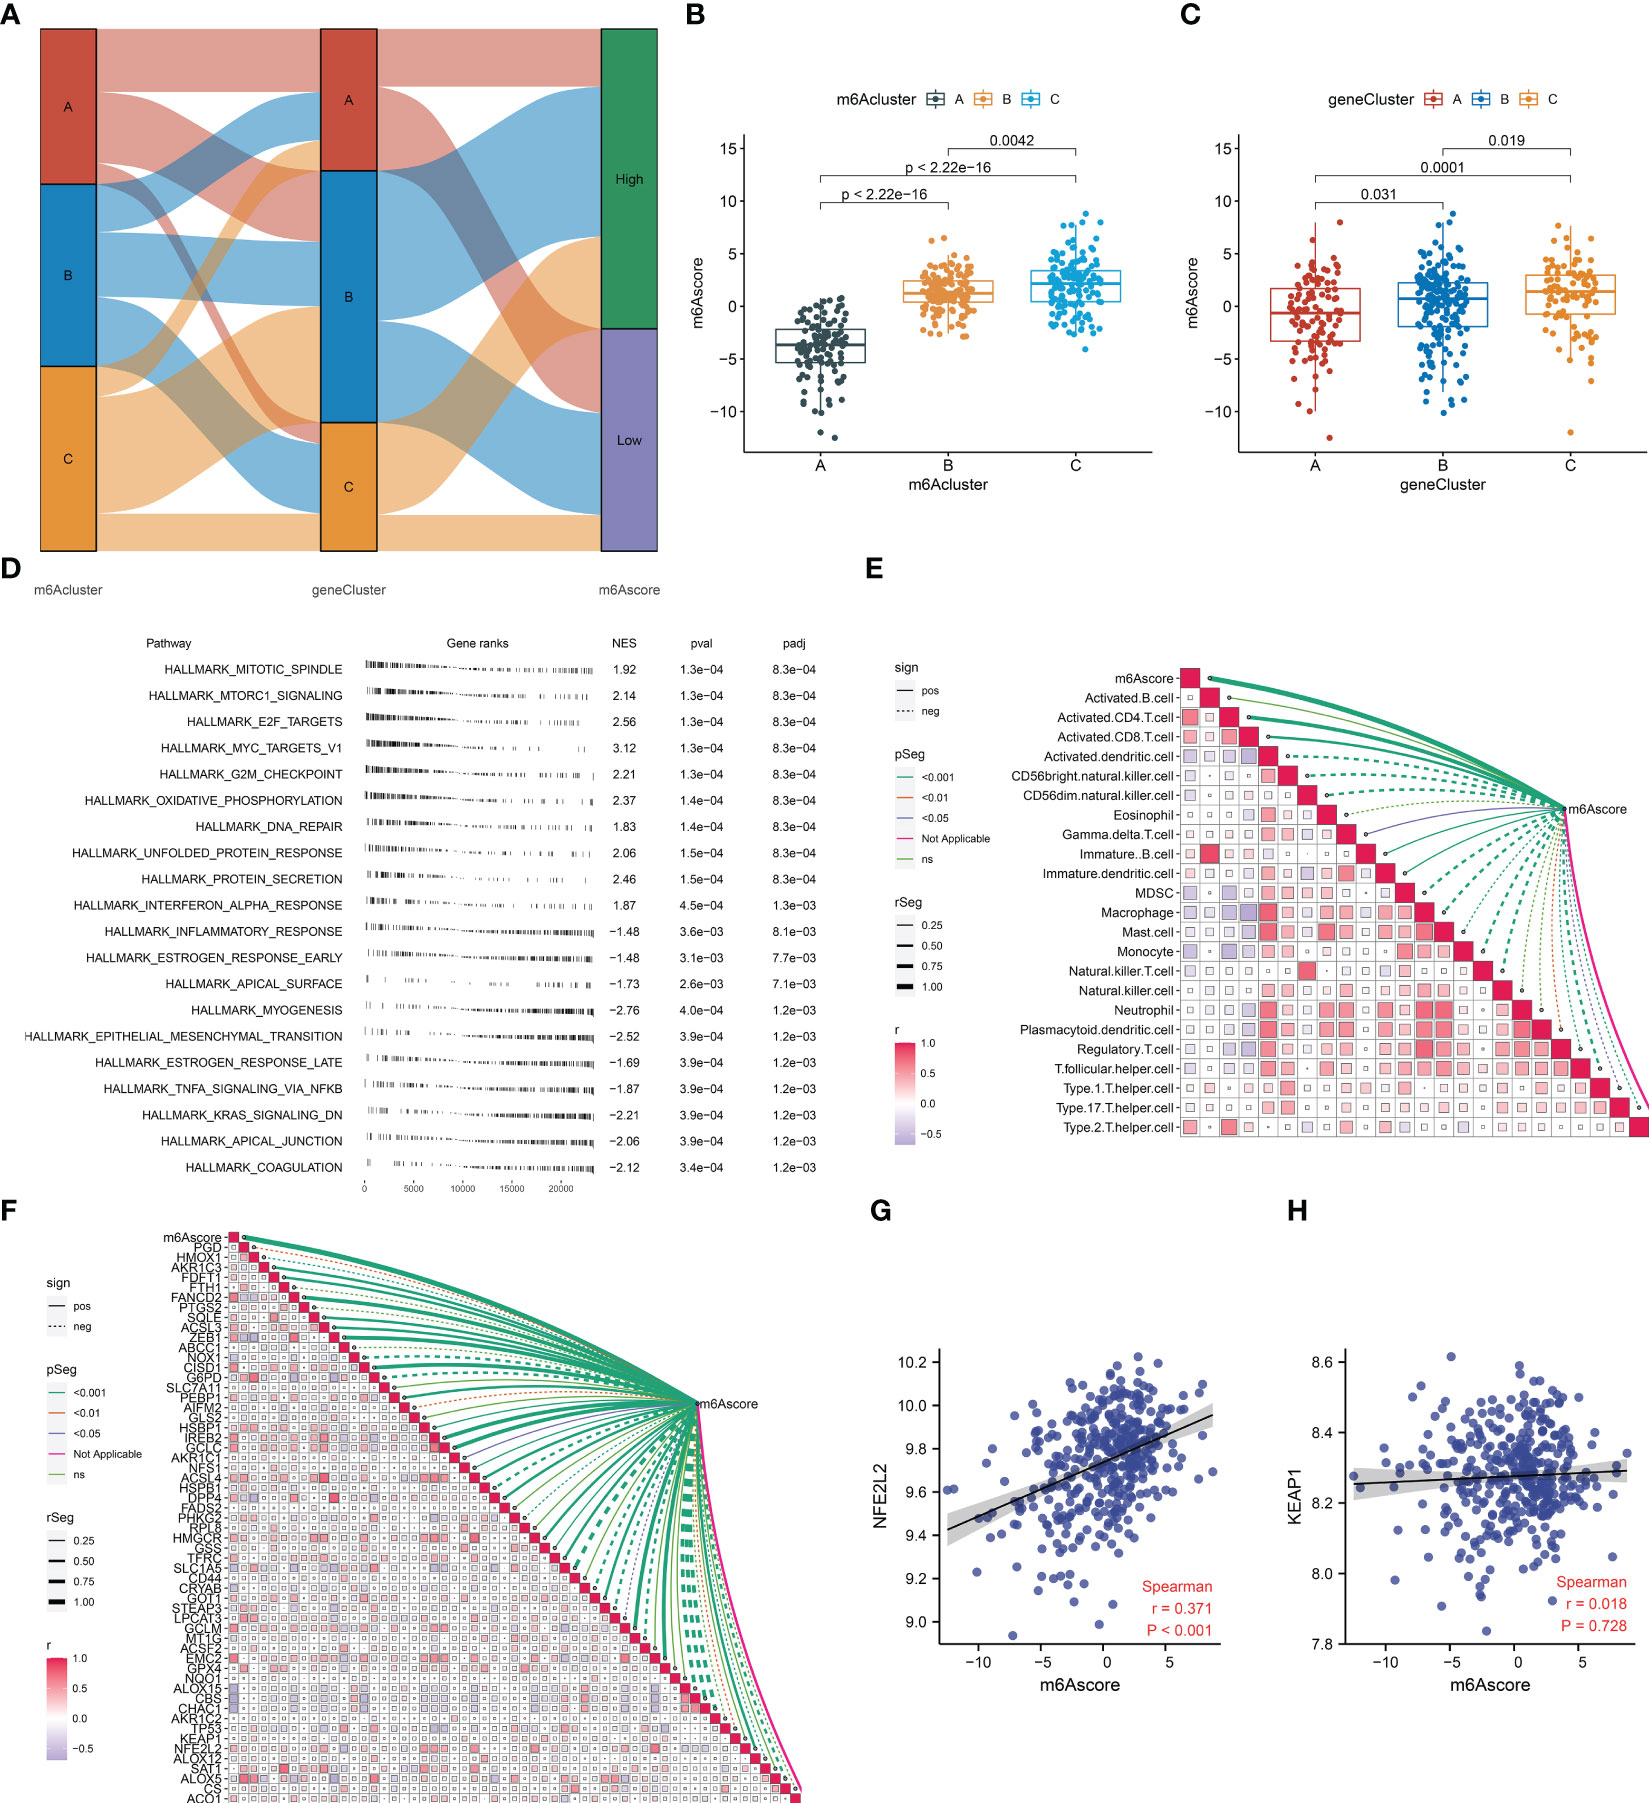
Figure 8 Definition of the m6A score and its association with the hallmark gene set, immune cells, ferroptosis, and oxidative stress in AMI from the GSE59867 dataset. (A) Sankey diagram depicting the relationship among the m6A clusters, m6A gene clusters, and m6A scores. (B, C) Differences in the m6A score between m6A clusters and m6A gene clusters. (D) The enriched hallmark gene set based on the m6Ascoe. Each black line represents a gene. The X-axis denotes gene rank and ranked genes from the differentially expressed gene list based on their expression value at the top or bottom of the predefined gene list. The Y-axis denotes the hallmark gene set. The three columns on the right are the normalized enrichment score (NES) and p-value (pval) together with the adjusted p-value (padj). (E) Association between the m6A score and the abundance of immune cells. The solid line denotes a positive correlation, while the dashed line indicates a negative correlation. The thicker the outer border of the box, the stronger the correlation. (F) Relationship between the m6A score and the transcript level of each ferroptosis gene. The solid line denotes a positive correlation, while the dashed line indicates a negative correlation. The thicker the outer border of the box, the stronger the correlation. (G, H) Scatter plots illustrating the correlation of the m6A score with the transcript level of NFE2L2 and KEAP1.
Association between the m6A score and hallmark gene set, immune cells, ferroptosis, and oxidative stress in AMI
The mechanisms underlying the m6A score were further probed during AMI. The significant hallmark gene sets linked with the m6A score were selected utilizing GSEA. In Figure 8D, proliferation-, inflammatory response-, and fibrosis-relevant gene sets were remarkably associated with the m6A score. Notably, the m6A score presented positive relationships with activated CD4+ and CD8+ T cells and immature dendritic cells, with negative associations with MDSCs, macrophages, monocytes, natural killer T cells, and type 1 helper cells (Figure 8E). Moreover, prominent relationships between the m6A score and most ferroptosis genes were observed (Figure 8F). For two key mediators of oxidative stress (NFE2L2 and KEAP1), the m6A score exhibited a significantly positive correlation to NFE2L2 (Figures 8G, H).
Therapeutic targeting of ALKBH5 alleviates apoptosis of H/R-induced H9C2 cells and NRCMs
We further focused on the role of m6A regulator ALKBH5 in AMI. We established an H/R-induced H9C2 cell model and an NRCM model. ALKBH5 expression was greatly increased in hypoxic H9C2 cells and in the NRCM model in comparison to normoxia (Figures 9A, B, 10A, D). To downregulate ALKBH5 expression, H9C2 cells and the NRCM model were pretreated with the ALKBH5 inhibitor IOX1 or transfected with si-ALKBH5. As expected, ALKBH5 expression was notably suppressed in hypoxic H9C2 cells and in the NRCM model. The WB results also show the same trend (Figure 10E). TUNEL staining showed that H9C2 cell and NRCM apoptosis was significantly enhanced by hypoxic conditions (Figures 9C, D, 10B, D). Therapeutic targeting of ALKBH5 by its inhibitor IOX1 or si-ALKBH5 greatly ameliorated hypoxia-induced cell apoptosis.
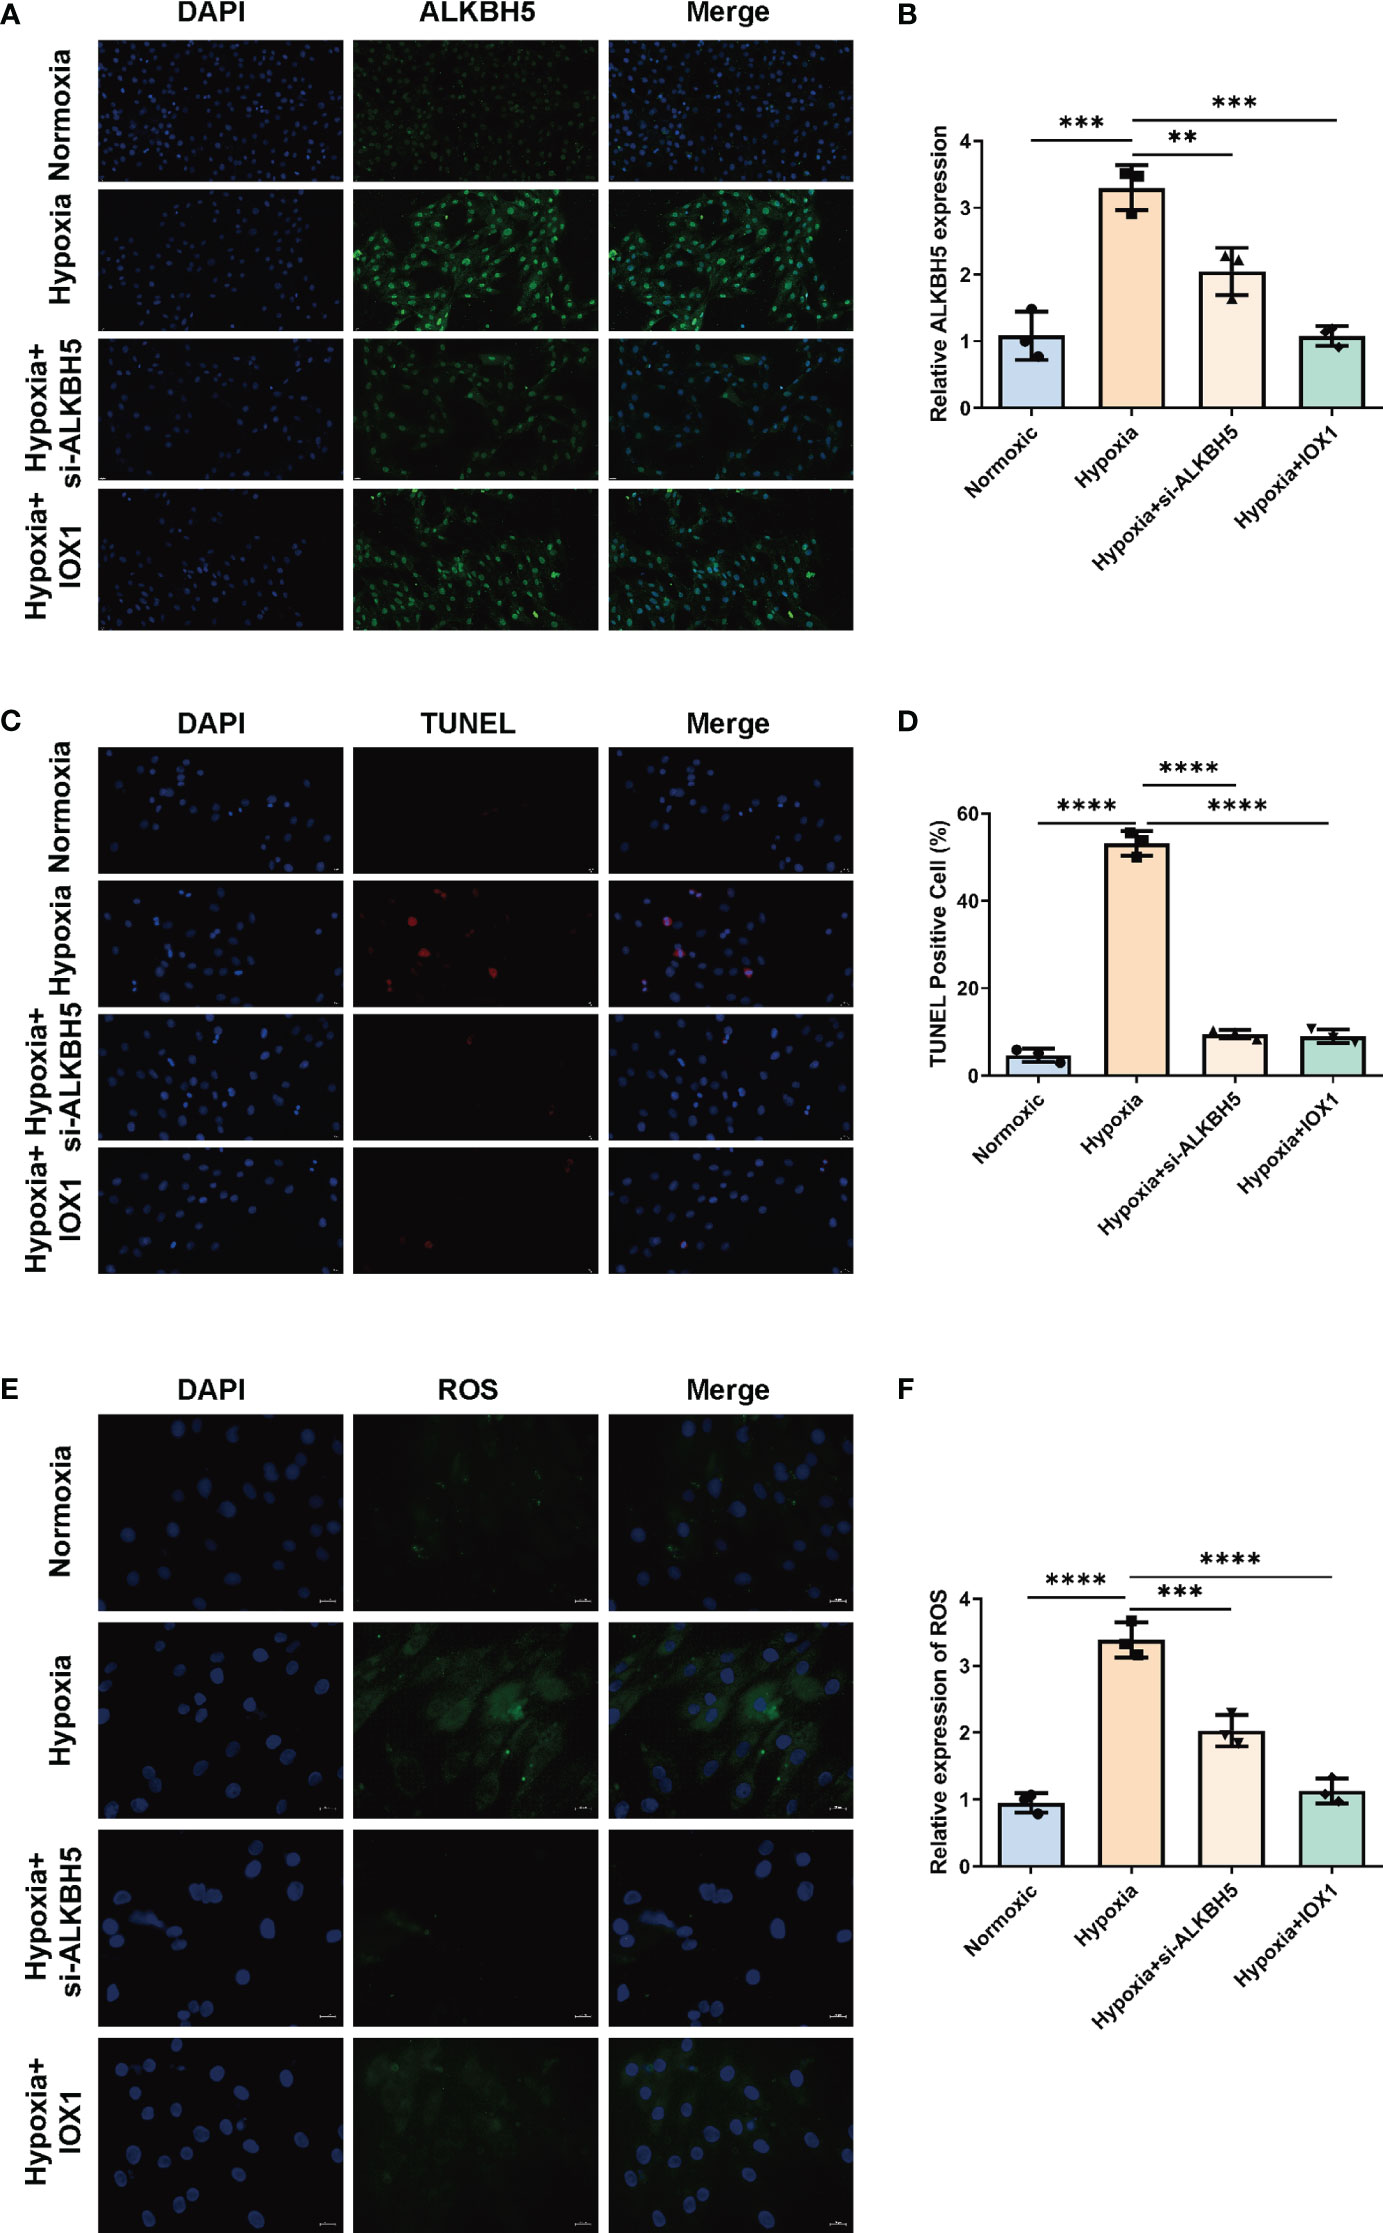
Figure 9 Therapeutic targeting of ALKBH5 attenuates H/R-induced apoptosis and ROS in H9C2 cells. (A) Representative immunofluorescent images of ALKBH5 in H9C2 cells with normoxia, hypoxia, hypoxia + ALKBH5 inhibitor IOX1, or hypoxia + si-ALKBH5. Scale bar, 20 μm. (B) Quantification of ALKBH5 expression in the above H9C2 cells. (C) Representative images of TUNEL staining in H9C2 cells with normoxia, hypoxia, hypoxia + ALKBH5 inhibitor IOX1, or hypoxia + si-ALKBH5. Scale bar, 20 μm. (D) Quantification of TUNEL-positive cell percentage in the above cells. **p < 0.01; ***p < 0.001; ****p < 0.0001. (E) Representative photographs of DCFH-DA-stained ROS in H9C2 cells with normoxia, hypoxia, hypoxia + ALKBH5 inhibitor IOX1, or hypoxia + si-ALKBH5. Scale bar, 20 μm. (F) Quantification of intracellular ROS levels in the above H9C2 cells. ***p < 0.001; ****p < 0.0001.
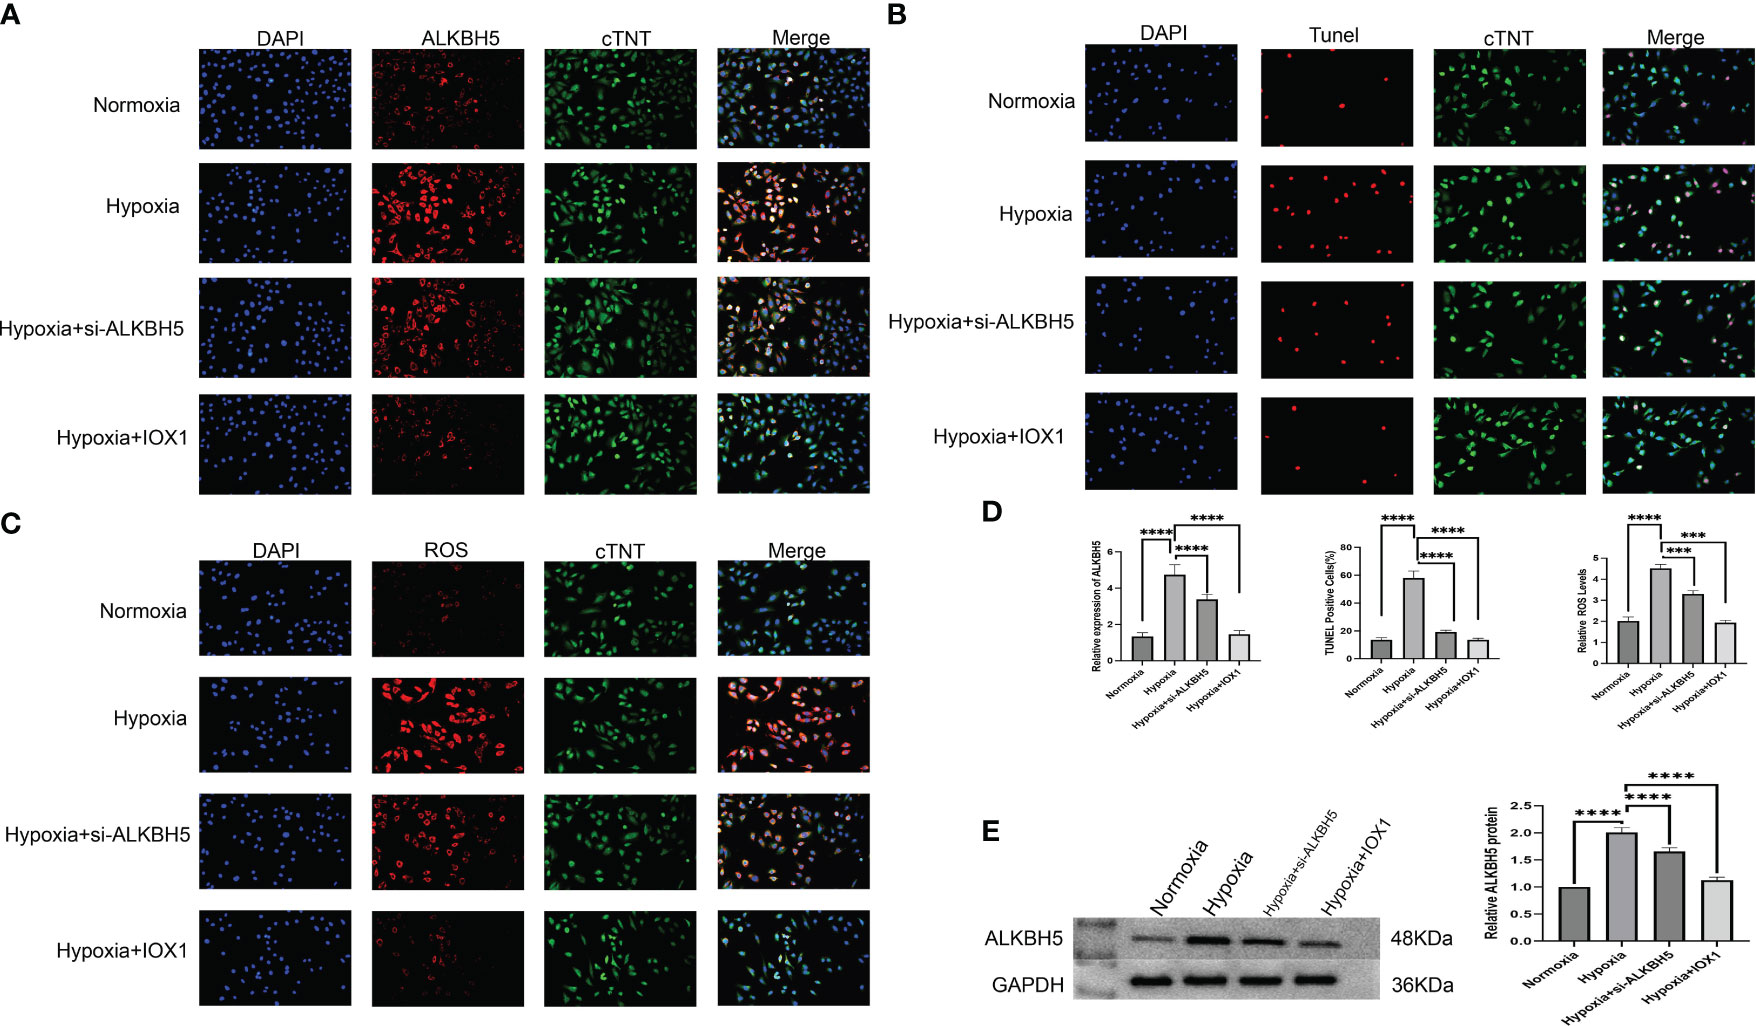
Figure 10 Therapeutic targeting of ALKBH5 alleviates apoptosis and attenuates intracellular ROS of H/R-induced NRCMs. (A) Representative immunofluorescent images of ALKBH5 in NRCMs with normoxia, hypoxia, hypoxia + ALKBH5 inhibitor IOX1, or hypoxia +si-ALKBH5. Scale bar, 50 μm. (B) Representative images of TUNEL staining in NRCMs with normoxia, hypoxia, hypoxia + ALKBH5 inhibitor IOX1, or hypoxia + si-ALKBH5. Scale bar, 50 μm. (C) Representative photographs of DCFH-DA-stained ROS in NRCMs with normoxia, hypoxia, hypoxia + ALKBH5 inhibitor IOX1, or hypoxia + si-ALKBH5. Scale bar, 50 μm. (D) Quantification of ALKBH5 expression in NRCMs, quantification of TUNEL-positive cell percentage in NRCMs, and quantification of intracellular ROS levels in NRCMs. ***p < 0.001; ****p < 0.0001. (E) Representative Western blot images and quantification of ALKBH5 protein levels in NRCMs. ***p < 0.001; ****p < 0.0001.
Therapeutic targeting of ALKBH5 attenuates intracellular ROS in H/R-induced H9C2 cells and NRCMs
Based on the DCFH-DA staining method, we measured the influence of ALKBH5 on intracellular ROS levels. It was found that intracellular ROS levels were prominently enhanced in hypoxic H9C2 cells and NRCMs versus the normoxic condition (Figures 9E, F, 10C, D). The ALKBH5 inhibitor IOX1 and si-ALKBH5 both remarkably alleviated intracellular ROS levels in hypoxic H9C2 cells and NRCMs.
ALKBH5 is highly expressed in myocardial infarction models and is associated with myocardial fibrosis and cardiomyocyte apoptosis
We then concentrated on examining the function of the m6A modulator ALKBH5 in AMI. We established an AMI animal model. ALKBH5 expression was greatly increased in AMI mice in comparison to the control and sham operation groups. To overexpress the ALKBH5 level, mice were injected with rAAV-ALKBH5. As expected, ALKBH5 expression was notably overexpressed in AMI mice (Figures 11A-C). Masson and H&E staining showed that the fibrosis level was higher in the AMI and AMI+rAAV-ALKBH5 groups than in the control and sham operation groups. Especially in the AMI+rAAV-ALKBH5 group, the fibrosis level was the highest (Figures 11D, E). As for apoptosis, Bax and BCL-2 were used to evaluate the apoptosis level. The results demonstrated that the expression of Bax was the highest in the AMI+rAAV-ALKBH5 group and significantly elevated in both the AMI+rAAV-ALKBH5 and AMI groups compared with the control and sham surgery groups. Conversely, BCL-2 exhibited a completely opposite trend, with its lowest expression observed in the AMI+rAAV-ALKBH5 group. This indicated that the level of cardiomyocyte apoptosis is the highest in the AMI+rAAV-ALKBH5 group (Figure 11A).
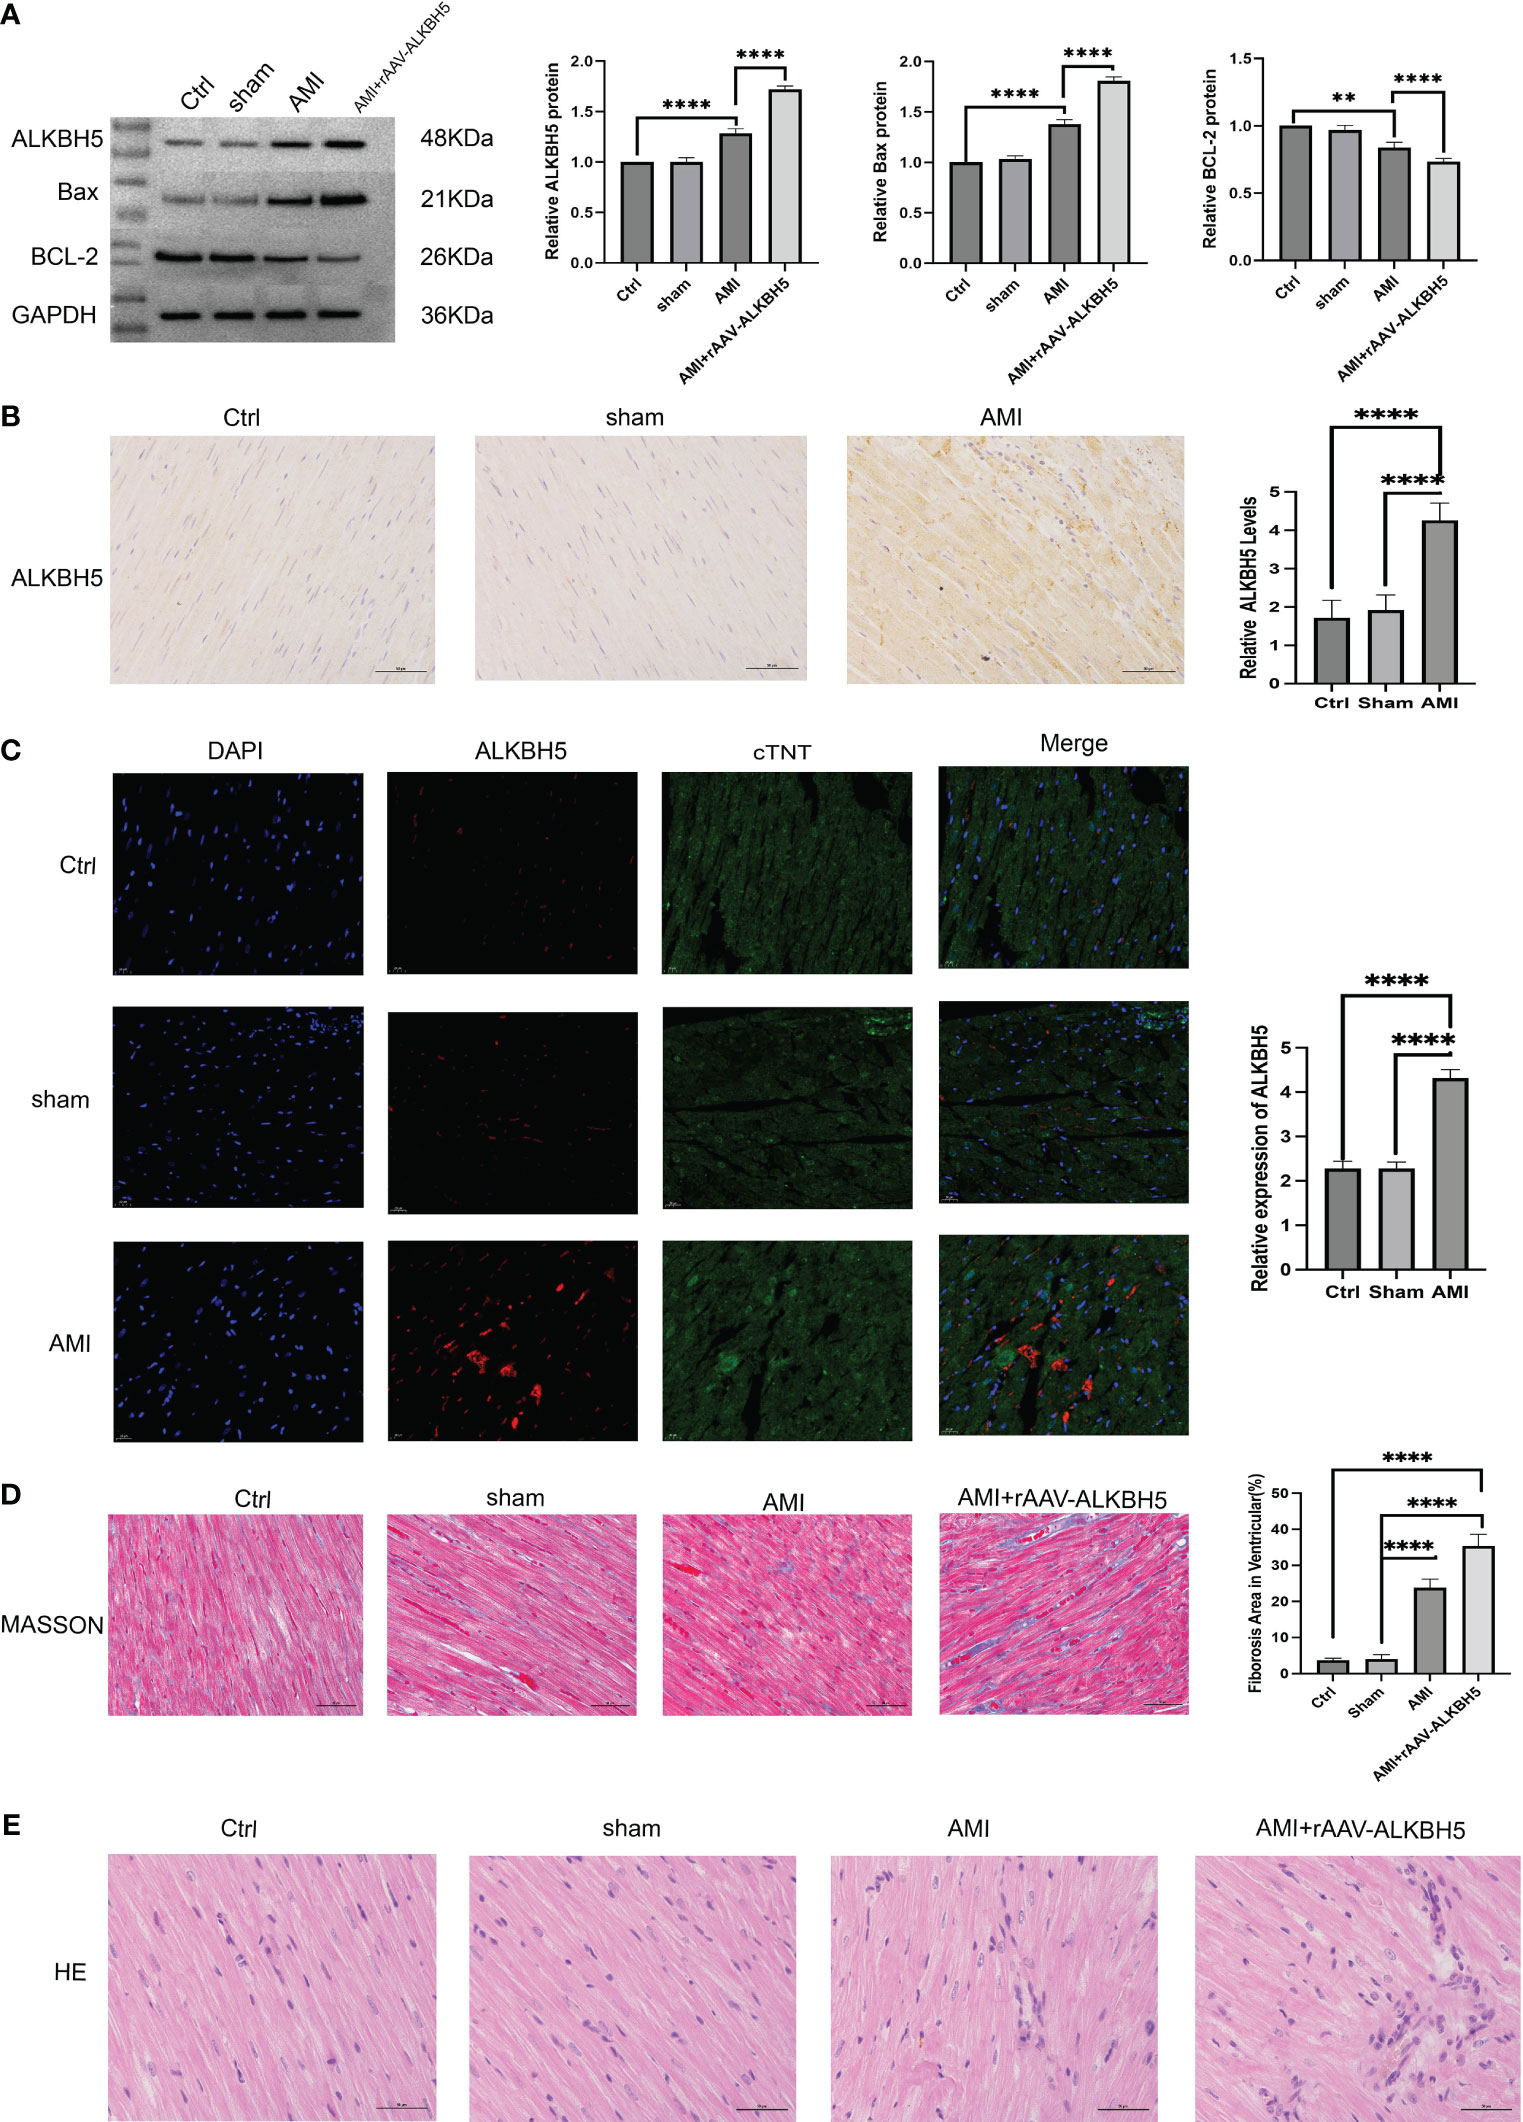
Figure 11 ALKBH5 is highly expressed in myocardial infarction models and is associated with myocardial fibrosis and cardiomyocyte apoptosis. (A) Representative Western blot images and quantification of ALKBH5, Bax, and BCL-2 protein levels in the heart tissue of the control, sham operation, AMI, or AMI+rAAV-ALKBH5 groups. ****p < 0.0001. (B) Representative images of immunohistochemical ALKBH5 staining in control, sham operation, and AMI hearts, quantified at the right. ****p < 0.0001. Scale bar, 50 μm. (C) Representative immunofluorescent images of ALKBH5 in the heart tissue of the control, sham operation, or AMI groups, quantified at the right. Scale bar, 50 μm. ****p < 0.0001. (D) Representative micrographs of Masson staining in the heart tissue of the control, sham operation, AMI, or AMI+rAAV-ALKBH5 groups. Scar tissue and viable myocardium are identified in blue and red, respectively. Quantifications of the fibrotic areas are shown on the right. Scale bar, 50 μm. ****p < 0.0001. (E) Representative images of H&E staining of the hearts from the four groups of mice. Scale bar, 50 μm.
Discussion
Deregulation of epigenetic processes and aberrant gene expression are crucial mechanisms in AMI (33). Among the RNA modifications, m6A represents the most studied RNA epi-transcriptomic modification (34). Mounting evidence proves that m6A modification affects AMI initiation and progression (35). Consistently, our research uncovered that deregulated m6A regulators occurred in circulating cells of AMI, with upregulated ELAVL1, YTHDF1, IGF2BP1, IGFBP2, RBM15B, IGFBP1, and ALKBH5 as well as downregulated FMR1, LRPPRC, YTHDC1, RBMX, HNRNPA2B1, YTHDC2, RBM15, CBLL1, METTL16, ZC3H13, YTHDF3, WTAP, and FTO.
Early diagnosis and targeted management are essential for AMI patients’ prognostic outcome. Predictive models have proven to be valuable in increasing tailored care through heightening informed decision-making (36). By incorporating 10 key m6A regulators (METTL16, WTAP, RBM15, CBLL1, YTHDC1, FMR1, IGFBP1, RBMX, ELAVL1, and ALKBH5), we proposed an m6A regulator-based gene signature that can diagnose AMI with strong sensitivity and specificity. Additionally, an m6A regulator-based nomogram was defined for risk prediction. To facilitate precision medicine, AMI patients were further categorized into three m6A clusters. Each cluster presented a unique m6A modification pattern, revealing the disease heterogeneity among AMI patients. In addition, we proposed the m6A score for individually quantifying m6A modification levels in AMI patients. Among the key m6A regulators, it was proven that suppressing ALKBH5 could alleviate apoptosis and intracellular ROS levels in H/R H9C2 cells.
Inflammatory response intimately contributes to AMI, which requires the coordinated efforts of diverse immune cells (37). The heterogeneity in immune cells existed across m6A clusters. Among m6A regulators, FMR1 presented the strongest positive association with activated CD4+ T cells, with the strongest negative relationship between LRPPRC and MDSCs. Moreover, the m6A score exhibited positive relationships with activated CD4+ and CD8- T cells and immature dendritic cells, with negative correlations to MDSCs, macrophages, monocytes, natural killer T cells, and type 1 helper cells. Thus, m6A modification might mediate the immune microenvironment of AMI (38).
Oxidative stress is an imbalance state between oxidation and antioxidation (39). NFE2L2 (NRF2), a key mediator of oxidative stress, possessed the highest transcript level in m6A cluster C, followed by clusters B and C, while the m6A score was positively associated with NFE2L2. Several experimental studies unveiled that m6A modification impacts distinct pathophysiological processes through modulating NRF2-mediated oxidative stress (40–42). Ferroptosis influences the activity of glutathione peroxidase by inducting small molecules, resulting in membrane lipid peroxidation because of redox imbalance and excess ROS generation, destroying the integrity of the cell membrane (43). Iron accumulation in the endoplasmic reticulum contributes to ferroptosis in myocardial ischemia–reperfusion damage (44). The three m6A clusters presented distinct expression levels of ferroptosis genes, with prominent relationships of m6A score with ferroptosis genes, indicating the functional roles of m6A in modulating ferroptosis during AMI. Despite this, prospective cohorts are required to prove the diagnostic efficacy of m6A regulators. Additionally, the regulatory mechanisms of m6A on immune cell infiltration, ferroptosis, and oxidative stress in AMI will be conducted through experimental validation.
Conclusion
Collectively, our research unveiled the deregulation of m6A regulators during AMI. We defined an m6A regulator gene signature that accurately diagnosed and predicted the risk of AMI. In addition, AMI patients were classified into three m6A clusters with diverse m6A modification patterns. The m6A score was computed to quantify m6A modification levels. The regulatory functions of m6A modification in immune cell infiltration, ferroptosis, and oxidative stress were also investigated during AMI. Therapeutic targeting of ALKBH5 notably ameliorated apoptosis and intracellular ROS in H/R-induced H9C2 cells and NRCMs, revealing the potential of ALKBH5 as a treatment target of AMI. Altogether, our findings demonstrated that regulation of m6A modification might result in AMI progression and support future studies in the clinically relevant and hopeful field.
Data availability statement
The datasets presented in this study can be found in online repositories. The names of the repository/repositories and accession number(s) can be found in the article/Supplementary Material.
Ethics statement
The studies involving humans were approved by the Ethics Committee of the People’s Hospital of Xinjiang Uygur Autonomous Region. The studies were conducted in accordance with the local legislation and institutional requirements. The participants provided their written informed consent to participate in this study.
Author contributions
PC: Data curation, Formal Analysis, Methodology, Software, Writing – original draft. XZ: Data curation, Formal Analysis, Methodology, Software, Writing – original draft, Investigation, Validation, Visualization. LZ: Data curation, Methodology, Software, Writing – original draft. YW: Methodology, Validation, Visualization, Writing – original draft. MW: Software, Visualization, Writing – original draft. GA: Validation, Writing – original draft. XC: Conceptualization, Investigation, Supervision, Writing – review & editing. YY: Conceptualization, Investigation, Supervision, Writing – review & editing.
Funding
The author(s) declare that no financial support was received for the research, authorship, and/or publication of this article.
Conflict of interest
The authors declare that the research was conducted in the absence of any commercial or financial relationships that could be construed as a potential conflict of interest.
Publisher’s note
All claims expressed in this article are solely those of the authors and do not necessarily represent those of their affiliated organizations, or those of the publisher, the editors and the reviewers. Any product that may be evaluated in this article, or claim that may be made by its manufacturer, is not guaranteed or endorsed by the publisher.
Supplementary material
The Supplementary Material for this article can be found online at: https://www.frontiersin.org/articles/10.3389/fimmu.2024.1308978/full#supplementary-material
Supplementary Figure 1 | Verification of the diagnostic efficacy of key m6A regulators in the GSE48060 dataset. (A-J) ROCs of each key m6A regulator in diagnosing AMI.
Supplementary Table 1 | The genomic location of m6A regulators were visulaized through circos plot.
Supplementary Table 2 | The information of m6A cluster-relevant genes.
Abbreviations
AMI, acute myocardial infarction; m6A, N6-methyladenosine; LASSO, least absolute shrinkage and selection operator; ROCs, receiver operator characteristic curves; CDF, cumulative distribution function; PCA, principal component analysis; ssGSEA, single-sample gene set enrichment analysis; GO, Gene Ontology; KEGG, Kyoto Encyclopedia of Genes and Genomes; GSEA, gene set enrichment analysis; ROS, reactive oxygen species; IHC, immunohistochemical; LAD, left anterior descending; NRCMs, neonatal rat cardiomyocytes.
References
1. Räber L, Ueki Y, Otsuka T, Losdat S, Häner JD, Lonborg J, et al. Effect of alirocumab added to high-intensity statin therapy on coronary atherosclerosis in patients with acute myocardial infarction: the PACMAN-AMI randomized clinical trial. Jama. (2022) 327:1771–81. doi: 10.1001/jama.2022.5218
2. Rallidis LS, Xenogiannis I, Brilakis ES, Bhatt DL. Causes, angiographic characteristics, and management of premature myocardial infarction: JACC state-of-the-art review. J Am Coll Cardiol. (2022) 79:2431–49. doi: 10.1016/j.jacc.2022.04.015
3. Chen Z, Wang D, Ma M, Li C, Wan Z, Zhang L, et al. Rationale and design of the OPTIMAL-REPERFUSION trial: A prospective randomized multi-center clinical trial comparing different fibrinolysis-transfer percutaneous coronary intervention strategies in acute ST-segment elevation myocardial infarction. Clin Cardiol. (2021) 44:455–62. doi: 10.1002/clc.23582
4. Cheng P, Han H, Chen F, Cheng L, Ma C, Huang H, et al. Amelioration of acute myocardial infarction injury through targeted ferritin nanocages loaded with an ALKBH5 inhibitor. Acta Biomater. (2022) 140:481–91. doi: 10.1016/j.actbio.2021.11.041
5. Wiggers H, Køber L, Gislason G, Schou M, Poulsen MK, Vraa S, et al. The DANish randomized, double-blind, placebo controlled trial in patients with chronic HEART failure (DANHEART): A 2 × 2 factorial trial of hydralazine-isosorbide dinitrate in patients with chronic heart failure (H-HeFT) and metformin in patients with chronic heart failure and diabetes or prediabetes (Met-HeFT). Am Heart J. (2021) 231:137–46. doi: 10.1016/j.ahj.2020.09.020
6. Sandoval Y, Lewis BR, Mehta RA, Ola O, Knott JD, De Michieli L, et al. Rapid exclusion of acute myocardial injury and infarction with a single high-sensitivity cardiac troponin T in the emergency department: A multicenter United States evaluation. Circulation. (2022) 145:1708–19. doi: 10.1161/CIRCULATIONAHA.122.059235
7. Kumari R, Ranjan P, Suleiman ZG, Goswami SK, Li J, Prasad R, et al. mRNA modifications in cardiovascular biology and disease: with a focus on m6A modification. Cardiovasc Res. (2022) 118:1680–92. doi: 10.1093/cvr/cvab160
8. Berulava T, Buchholz E, Elerdashvili V, Pena T, Islam MR, Lbik D, et al. Changes in m6A RNA methylation contribute to heart failure progression by modulating translation. Eur J Heart Fail. (2020) 22:54–66. doi: 10.1002/ejhf.1672
9. Gong R, Wang X, Li H, Liu S, Jiang Z, Zhao Y, et al. Loss of m(6)A methyltransferase METTL3 promotes heart regeneration and repair after myocardial injury. Pharmacol Res. (2021) 174:105845. doi: 10.1016/j.phrs.2021.105845
10. Zhao Y, Hu J, Sun X, Yang K, Yang L, Kong L, et al. Loss of m6A demethylase ALKBH5 promotes post-ischemic angiogenesis via post-transcriptional stabilization of WNT5A. Clin Transl Med. (2021) 11:e402. doi: 10.1002/ctm2.402
11. Li N, Yi X, He Y, Huo B, Chen Y, Zhang Z, et al. Targeting ferroptosis as a novel approach to alleviate aortic dissection. Int J Biol Sci. (2022) 18:4118–34. doi: 10.7150/ijbs.72528
12. Song Y, Wang B, Zhu X, Hu J, Sun J, Xuan J, et al. Human umbilical cord blood-derived MSCs exosome attenuate myocardial injury by inhibiting ferroptosis in acute myocardial infarction mice. Cell Biol Toxicol. (2021) 37:51–64. doi: 10.1007/s10565-020-09530-8
13. Zhuang S, Ma Y, Zeng Y, Lu C, Yang F, Jiang N, et al. METTL14 promotes doxorubicin-induced cardiomyocyte ferroptosis by regulating the KCNQ1OT1-miR-7-5p-TFRC axis. Cell Biol Toxicol. (2021). doi: 10.1007/s10565-021-09660-7
14. Daiber A, Steven S, Euler G, Schulz R. Vascular and cardiac oxidative stress and inflammation as targets for cardioprotection. Curr Pharm Des. (2021) 27:2112–30. doi: 10.2174/1381612827666210125155821
15. Maciejak A, Kiliszek M, Michalak M, Tulacz D, Opolski G, Matlak K, et al. Gene expression profiling reveals potential prognostic biomarkers associated with the progression of heart failure. Genome Med. (2015) 7:26. doi: 10.1186/s13073-015-0149-z
16. Suresh R, Li X, Chiriac A, Goel K, Terzic A, Perez-Terzic C, et al. Transcriptome from circulating cells suggests dysregulated pathways associated with long-term recurrent events following first-time myocardial infarction. J Mol Cell Cardiol. (2014) 74:13–21. doi: 10.1016/j.yjmcc.2014.04.017
17. Gautier L, Cope L, Bolstad BM, Irizarry RA. affy–analysis of Affymetrix GeneChip data at the probe level. Bioinformatics. (2004) 20:307–15. doi: 10.1093/bioinformatics/btg405
18. Zhang H, Meltzer P, Davis S. RCircos: an R package for Circos 2D track plots. BMC Bioinf. (2013) 14:244. doi: 10.1186/1471-2105-14-244
19. Engebretsen S, Bohlin J. Statistical predictions with glmnet. Clin Epigenet. (2019) 11:123. doi: 10.1186/s13148-019-0730-1
20. Wilkerson MD, Hayes DN. ConsensusClusterPlus: a class discovery tool with confidence assessments and item tracking. Bioinformatics. (2010) 26:1572–3. doi: 10.1093/bioinformatics/btq170
21. Hänzelmann S, Castelo R, Guinney J. GSVA: gene set variation analysis for microarray and RNA-seq data. BMC Bioinf. (2013) 14:7. doi: 10.1186/1471-2105-14-7
22. Bindea G, Mlecnik B, Tosolini M, Kirilovsky A, Waldner M, Obenauf AC, et al. Spatiotemporal dynamics of intratumoral immune cells reveal the immune landscape in human cancer. Immunity. (2013) 39:782–95. doi: 10.1016/j.immuni.2013.10.003
23. Ritchie ME, Phipson B, Wu D, Hu Y, Law CW, Shi W, et al. limma powers differential expression analyses for RNA-sequencing and microarray studies. Nucleic Acids Res. (2015) 43:e47. doi: 10.1093/nar/gkv007
24. Zhang B, Wu Q, Li B, Wang D, Wang L, Zhou YL. m(6)A regulator-mediated methylation modification patterns and tumor microenvironment infiltration characterization in gastric cancer. Mol Cancer. (2020) 19:53. doi: 10.1186/s12943-020-01170-0
25. Yu G, Wang LG, Han Y, He QY. clusterProfiler: an R package for comparing biological themes among gene clusters. Omics. (2012) 16:284–7. doi: 10.1089/omi.2011.0118
26. Subramanian A, Tamayo P, Mootha VK, Mukherjee S, Ebert BL, Gillette MA, et al. Gene set enrichment analysis: a knowledge-based approach for interpreting genome-wide expression profiles. Proc Natl Acad Sci U.S.A. (2005) 102:15545–50. doi: 10.1073/pnas.0506580102
27. Liberzon A, Birger C, Thorvaldsdóttir H, Ghandi M, Mesirov JP, Tamayo P. The Molecular Signatures Database (MSigDB) hallmark gene set collection. Cell Syst. (2015) 1:417–25. doi: 10.1016/j.cels.2015.12.004
28. Li J, Zhao Y, Zhou N, Li L, Li K. Dexmedetomidine attenuates myocardial ischemia-reperfusion injury in diabetes mellitus by inhibiting endoplasmic reticulum stress. J Diabetes Res. (2019) 2019:7869318. doi: 10.1155/2019/7869318
29. Zheng W, Liu C. The cystathionine γ-lyase/hydrogen sulfide pathway mediates the trimetazidine-induced protection of H9c2 cells against hypoxia/reoxygenation-induced apoptosis and oxidative stress. Anatol J Cardiol. (2019) 22:102–11. doi: 10.14744/AnatolJCardiol.2019.83648
30. Pang P, Qu Z, Yu S, Pang X, Li X, Gao Y, et al. Mettl14 attenuates cardiac ischemia/reperfusion injury by regulating wnt1/β-catenin signaling pathway. Front Cell Dev Biol. (2021) 9:762853. doi: 10.3389/fcell.2021.762853
31. Wang J, Zhang J, Ma Y, Zeng Y, Lu C, Yang F, et al. WTAP promotes myocardial ischemia/reperfusion injury by increasing endoplasmic reticulum stress via regulating m(6)A modification of ATF4 mRNA. Aging (Albany NY). (2021) 13:11135–49. doi: 10.18632/aging.v13i8
32. Chen R, Li W, Qiu Z, Zhou Q, Zhang Y, Li WY, et al. Ischemic postconditioning-mediated DJ-1 activation mitigate intestinal mucosa injury induced by myocardial ischemia reperfusion in rats through keap1/nrf2 pathway. Front Mol Biosci. (2021) 8:655619. doi: 10.3389/fmolb.2021.655619
33. Rizzacasa B, Amati F, Romeo F, Novelli G, Mehta JL. Epigenetic modification in coronary atherosclerosis: JACC review topic of the week. J Am Coll Cardiol. (2019) 74:1352–65. doi: 10.1016/j.jacc.2019.07.043
34. Niu X, Xu J, Liu J, Chen L, Qiao X, Zhong M. Landscape of N(6)-methyladenosine modification patterns in human ameloblastoma. Front Oncol. (2020) 10:556497. doi: 10.3389/fonc.2020.556497
35. Sun P, Wang C, Mang G, Xu X, Fu S, Chen J, et al. Extracellular vesicle-packaged mitochondrial disturbing miRNA exacerbates cardiac injury during acute myocardial infarction. Clin Transl Med. (2022) 12:e779. doi: 10.1002/ctm2.779
36. Helgestad OKL, Povlsen AL, Josiassen J, Möller S, Hassager C, Jensen LO, et al. Data-driven point-of-care risk model in patients with acute myocardial infarction and cardiogenic shock. Eur Heart J Acute Cardiovasc Care. (2021) 10:668–75. doi: 10.1093/ehjacc/zuab045
37. Zhu X, Yin T, Zhang T, Zhu Q, Lu X, Wang L, et al. Identification of immune-related genes in patients with acute myocardial infarction using machine learning methods. J Inflammation Res. (2022) 15:3305–21. doi: 10.2147/JIR.S360498
38. Li Z, Song Y, Wang M, Shen R, Qin K, Zhang Y, et al. m6A regulator-mediated RNA methylation modification patterns are involved in immune microenvironment regulation of coronary heart disease. Front Cardiovasc Med. (2022) 9:905737. doi: 10.3389/fcvm.2022.905737
39. Chen QM. Nrf2 for protection against oxidant generation and mitochondrial damage in cardiac injury. Free Radic Biol Med. (2022) 179:133–43. doi: 10.1016/j.freeradbiomed.2021.12.001
40. Arumugam T, Ghazi T, Chuturgoon AA. Fumonisin B(1) alters global m6A RNA methylation and epigenetically regulates Keap1-Nrf2 signaling in human hepatoma (HepG2) cells. Arch Toxicol. (2021) 95:1367–78. doi: 10.1007/s00204-021-02986-5
41. Wang J, Ishfaq M, Xu L, Xia C, Chen C, Li J. METTL3/m(6)A/miRNA-873-5p attenuated oxidative stress and apoptosis in colistin-induced kidney injury by modulating keap1/nrf2 pathway. Front Pharmacol. (2019) 10:517. doi: 10.3389/fphar.2019.00517
42. Xia C, Wang J, Wu Z, Miao Y, Chen C, Li R, et al. METTL3-mediated M6A methylation modification is involved in colistin-induced nephrotoxicity through apoptosis mediated by Keap1/Nrf2 signaling pathway. Toxicology. (2021) 462:152961. doi: 10.1016/j.tox.2021.152961
43. Chen L, Niu X, Qiao X, Liu S, Ma H, Shi X, et al. Characterization of interplay between autophagy and ferroptosis and their synergistical roles on manipulating immunological tumor microenvironment in squamous cell carcinomas. Front Immunol. (2021) 12:739039. doi: 10.3389/fimmu.2021.739039
Keywords: acute myocardial infarction, N6-methyladenosine, immune cell infiltration, ferroptosis, oxidative stress, ALKBH5
Citation: Chao P, Zhang X, Zhang L, Wang Y, Wusiman M, Aimaijiang G, Chen X and Yang Y (2024) Characterization of the m6A regulators’ landscape highlights the clinical significance of acute myocardial infarction. Front. Immunol. 15:1308978. doi: 10.3389/fimmu.2024.1308978
Received: 07 October 2023; Accepted: 13 February 2024;
Published: 20 March 2024.
Edited by:
Emma Louise Robinson, University of Colorado, United StatesCopyright © 2024 Chao, Zhang, Zhang, Wang, Wusiman, Aimaijiang, Chen and Yang. This is an open-access article distributed under the terms of the Creative Commons Attribution License (CC BY). The use, distribution or reproduction in other forums is permitted, provided the original author(s) and the copyright owner(s) are credited and that the original publication in this journal is cited, in accordance with accepted academic practice. No use, distribution or reproduction is permitted which does not comply with these terms.
*Correspondence: Xiaoyang Chen, chenxiaoyang20707@163.com; Yining Yang, yangyn5126@xjrmyy.com
†These authors have contributed equally to this work and share first authorship