 Jinguo Zhang
 Hongwei Jin
 Shuaikang Pan
 Chaoqiang Han1
 Qingqing Sun
 Xinghua Han
- 1Department of Medical Oncology, Anhui Provincial Hospital Affiliated to Anhui Medical University, Hefei, China
- 2Department of Medical Oncology, The First Affiliated Hospital of USTC, Division of Life Science and Medicine, University of Science and Technology of China, Hefei, China
- 3School of Medical Oncology, Anhui Medical University, Hefei, China
- 4School of Medical Oncology, Wan Nan Medical College, Wuhu, China
Background: Currently, targeting immune checkpoint molecules holds great promise for triple-negative breast cancer (TNBC). However, the expression landscape of immune checkpoint genes (ICGs) in TNBC remains largely unknown.
Method: Herein, we systematically investigated the ICGs expression patterns in 422 TNBC samples. We evaluated the ICGs molecular typing based on the ICGs expression profile and explored the associations between ICGs molecular subtypes and tumor immune characteristics, clinical significance, and response to immune checkpoint inhibitors (ICIs).
Results: Two ICGs clusters and two ICGs-related gene clusters were determined, which were involved in different survival outcomes, biological roles and infiltration levels of immune cells. We established a quantification system ICGs riskscore (named IRS) to assess the ICGs expression patterns for individuals. TNBC patients with lower IRS were characterized by increased immune cell infiltration, favorable clinical outcomes and high sensitivity to ICIs therapy. We also developed a nomogram model combining clinicopathological variables to predict overall survival in TNBC. Genomic feature analysis revealed that high IRS group presented an increased tumor mutation burden compared with the low IRS group.
Conclusion: Collectively, dissecting the ICGs expression patterns not only provides a new insight into TNBC subtypes but also deepens the understanding of ICGs in the tumor immune microenvironment.
Introduction
As reported in the GLOBOCAN 2020 survey, the number of breast cancer (BC) has recently overtaken lung cancer as the most common cancer type worldwide and has become the leading cause of cancer death in women (1). It has been reported that triple negative breast cancer (TNBC) makes up approximately 15%-20% of all BC patients, which is characterized by estrogen (ER), progesterone (PR), and human epidermal growth factor receptor-2 (HER2) negativity (2). Due to the variety and heterogeneity, distinct molecular subtypes of TNBC are still not completely understood. As defined by Lehmann et al., the molecular subtypes of TNBC consist of basal-like 1 (BL1), basal-like 2 (BL2), mesenchymal (M) and luminal androgen receptor (LAR) (3). According to the components of the tumor immune microenvironment, TNBC has been divided into four distinct subsets including fully inflamed (FI), stroma restricted (SR), margin-restricted (MR), and immune desert (ID) (4, 5). Different molecular subtypes of TNBC have different etiology, prognosis and clinical-pathological characteristics. Several clinical trials are ongoing to prove the the clinical applicability and effect of subtyping-based targeted therapy for refractory metastatic TNBC (6, 7). Therefore, more efforts are still needed to advance the TNBC subtypes research.
As TNBC lacks established therapeutic targets, surgery and chemotherapy remain the preferred treatment modality (8). However, the efficacy of chemotherapy varies among individuals. Furthermore, TNBC presents a more aggressive phenotype than other BC subtypes and most patients ultimately succumb to tumor recurrence and metastasis (9). In recent years, immunotherapy has emerged as an attractive alternative for conventional cancer treatments (10). TNBC, the most immunogenic subtype of BC, has been regarded as the most suitable candidate for immunotherapy (11). The effect of immunotherapies on early-stage TNBC and metastatic TNBC has recently been studied in several clinical trials (12, 13). However, only a minority of TNBC patients achieve durable clinical benefits from anti-PD-1/L1 treatments (14). Hence, identification of the most suitable subgroups of TNBC patients who can truly benefit from immunotherapy is urgently required.
Immune check-point inhibitors (ICIs) are becoming the most effective immunotherapeutic approaches for cancer treatments (15). ICIs aim to target immune check-point genes (ICGs) to reverse the immunosuppressive tumor environment, and thus enhance the anti-tumor responses by activating infiltrating immune cells (16). Indeed, the efficacy of immunotherapy largely depends on the host tumor microenvironment and immune status (17). Therefore, the development of quantitative biomarkers for individual immune status is warranted. Currently, the ICGs expression patterns have been investigated in lung adenocarcinoma and gastric cancer (18, 19). However, the effect of ICGs patterns on the immune characteristics of TNBC remains unclear. In this study, we explored the ICGs expression profiles and identified distinct ICGs molecular typing in TNBC. We also established a risk scoring system (IRS) to evaluate immune function in individual patients. Our results dissected the role of ICGs expression patterns in molecular subtypes, tumor-infiltrating immune cells and prognosis evaluation.
Materials and methods
TNBC dataset and preprocessing
In this study, the transcriptome expression data, and clinical characteristics of TNBC patients were derived from TCGA database (https://cancergenome.nih.gov/) and METABRIC dataset. The METABRIC datasets are derived from the UK-Canada METABRIC project (20). The detail clinical information of TNBC in TCGA cohort and METABRIC cohort was summarized in Supplementary Table S1. A total of 422 TNBC tumor samples were enrolled for analysis including the TCGA-TNBC dataset. (N = 123) and METABRIC-TNBC (N = 299). The list of ICGs was acquired according to a previous report (21). The normalized matrix expression and clinical data of METABRIC-TNBC were obtained from the cBioPotal website (http://www.cbioportal.org/) (22). For the TCGA-TNBC data, the values of the RNA sequencing data (FPKM) were converted into transcripts per kilobase million (TPM) values. We obtained somatic mutation profiles from TNBC patients from the TCGA data portal. In addition, TNBC patients who missed corresponding clinical data were excluded from further analyses.
Construction of ICGs expression clusters by consensus molecular clustering
We combined the transcriptome data of TCGA-TNBC and METABRIC-TNBC into final expression data. Batch effect of individual datasets was removed using “ComBat” in R. The expression of ICGs was extracted for further analysis. To identify distinct ICGs expression patterns, unsupervised clustering analysis was applied based on the expression of ICGs. We established the optimal cluster number based on the cophenetic correlation, dispersion, silhouette, and other factors. Consensus clustering was performed with the package “ConsensusClusterPlus” with 1000 times repetitions (23).
Gene set variation analysis and immune cell infiltration analysis
To further understand the biological phenomena in different TNBC ICG clusters, the R package “gsva” was used to perform GSVA. We retrieved the gene sets ‘c2.cp.kegg.v7.2.symbols’ and ‘h.all.v7.4.symbols’ from the MSigDB database (http://www.gsea-msigdb.org/gsea/downloads.jsp ). We selected the top 20 biological terms with adjusted P < 0:05. To quantify the enrichment score of 23 immune cells infiltrating in different TNBC ICG clusters, we performed a single-sample gene set enrichment analysis (ssGSEA) (24). The enrichment scores were rescaled to a continuous scale of 0 to 1.
Generation of ICGs gene signature
Our differentially expressed genes (DEGs) screening among different ICGs clusters was performed using the “limma” R package with the criteria of adjusted P < 0.05. GO and KEGG pathways analyses were applied to evaluate the biological processes in the DEGs, which was achieved with the “ggplot2,” “clusterProfiler,” “org.Hs.eg.db” and “enrichplot” R packages (25, 26). The results were visualized with the top 30 biological terms. Then, we selected prognostic value of DEGs using a univariate Cox regression model. The TNBC ICGs gene clusters were constructed based on the expression of prognostic DEGs.
Construction of ICGs risk score by LASSO regression
The least absolute shrinkage and selection operator (LASSO) method was applied to evaluate the ICGs expression patterns with a quantization index. The most correlated genes were identified to construct IRS model using the R package “glmnet”. We applied 10-fold cross-validation to optimize the model and reduce overfitting. In this model, a prognostic risk score was computed as follows: IRS= Expression of gene 1 *Coef 1 + Expression of gene 2 *Coef 2 + Expression of gene 3 *Coef 3 + Expression of gene n *Coef n. In our study, we divided the TNBC patients into high- and low-risk subgroups based on the median risk score for subsequent study. Dimension reduction analysis was performed by the techniques of principal component analysis (PCA) and t-distributed stochastic neighbor embedding (t-SNE). A receiver operating characteristic curve (ROC curve) was drawn with the R package “survivalROC” (27). By using the “survival” and “survminer” packages in R, survival curves were plotted for the high- and low-risk groups.
Establishment of a predictive nomogram and mutation analysis
It has been widely accepted that nomograms predict cancer prognosis (28). A nomogram was constructed by integrating variables that could serve as independent prognostic factors including tumor stage, age, tumor size, node status and IRS model. We calculated a nomogram score to predict the probability of 1-, 3-, and 5 years OS (overall survival) of TNBC. Assessment of the calibration capability of the nomogram was performed by plotting calibration curves. Regarding the effect of IRS on TNBC mutation profiles, different IRS groups of mutations were visualized using the ‘maftools’ package in R.
Evaluation of immune infiltration characteristics and ICIs therapy
To estimate the immune cells composition in TNBC samples, the CIBERSORT analyses were performed on expression data to calculate the abundance of 22 types of immune cells (29). The Wilcoxon rank-sum test was adopted to detect the difference of 22 immune cells in the high- and low-risk TNBC groups. The estimator, immune, and stromal scores were calculated for TNBC samples based on the ESTIMATE algorithm of the “estimate” package (30). In addition, we further compared the immune function in the high- and low-risk TNBC groups. Analyses of IRS model genes and CD8 T cells infiltration were carried out using the immune gene module in the TIMER2 database (http://timer.comp-genomics.org/) (31). On the basis of mRNA expression, tumor stemness was found to be measured by RNA stemness score (RNAss) and DNA stemness score (DNAss) (32). Correlation analysis between IRS and RNAss or DNAss was tested by Spearman’s rank correlation test. To estimate the immune state of TCGA-TNBC samples, immunophenoscore (IPS) was calculated from an online database (https://tcia.at/) (33). Analysis of IPS in different IRS groups was conducted based on the status of CTLA-4 and PD-1 expression. We predicted chemotherapeutic response in patients using the R package ‘pRRophetic’ (34).
Statistical analysis
Analyses of all data in this study were performed using R software (version 4.1.1). Comparisons between two groups were conducted using Wilcoxon rank sum tests. We performed Kaplan-Meier and log-rank survival analyses on a univariate basis. The correlations were calculated using Spearman’s rank correlation. P values less than 0.05 were considered statistically significant.
Results
ICGs expression patterns in TNBC
Typically, solid cancers exploit several mechanisms to escape immune surveillance. Among them, overexpressed ICGs in cancer cells are the key regulators to escape the body’s immune system. It is well recognized that the antitumor response is tightly regulated by checkpoint genes between tumor cells and immune cells (35). A complex and finely tuned signaling network of ICGs was presented by the STRING database (Figure 1A). The prognostic value of ICGs in TNBC was evaluated by univariate Cox regression analysis and Kaplan–Meier (KM) log-rank test (Supplementary Table S2). We next combined TCGA-TNBC and METABRIC-TNBC datasets to perform consensus clustering analysis. Unsupervised clustering analysis revealed two distinct ICGs clusters in TNBC (Figure 1B, C). Interestingly, TNBC patients with ICGscluster-B had a longer survival time than ICGscluster-A (Figures 1D). ICGs expression profile analyses found that ICGscluster-B subgroup exhibited higher expression of checkpoint genes compared to ICGscluster-A group (Figure 1E).
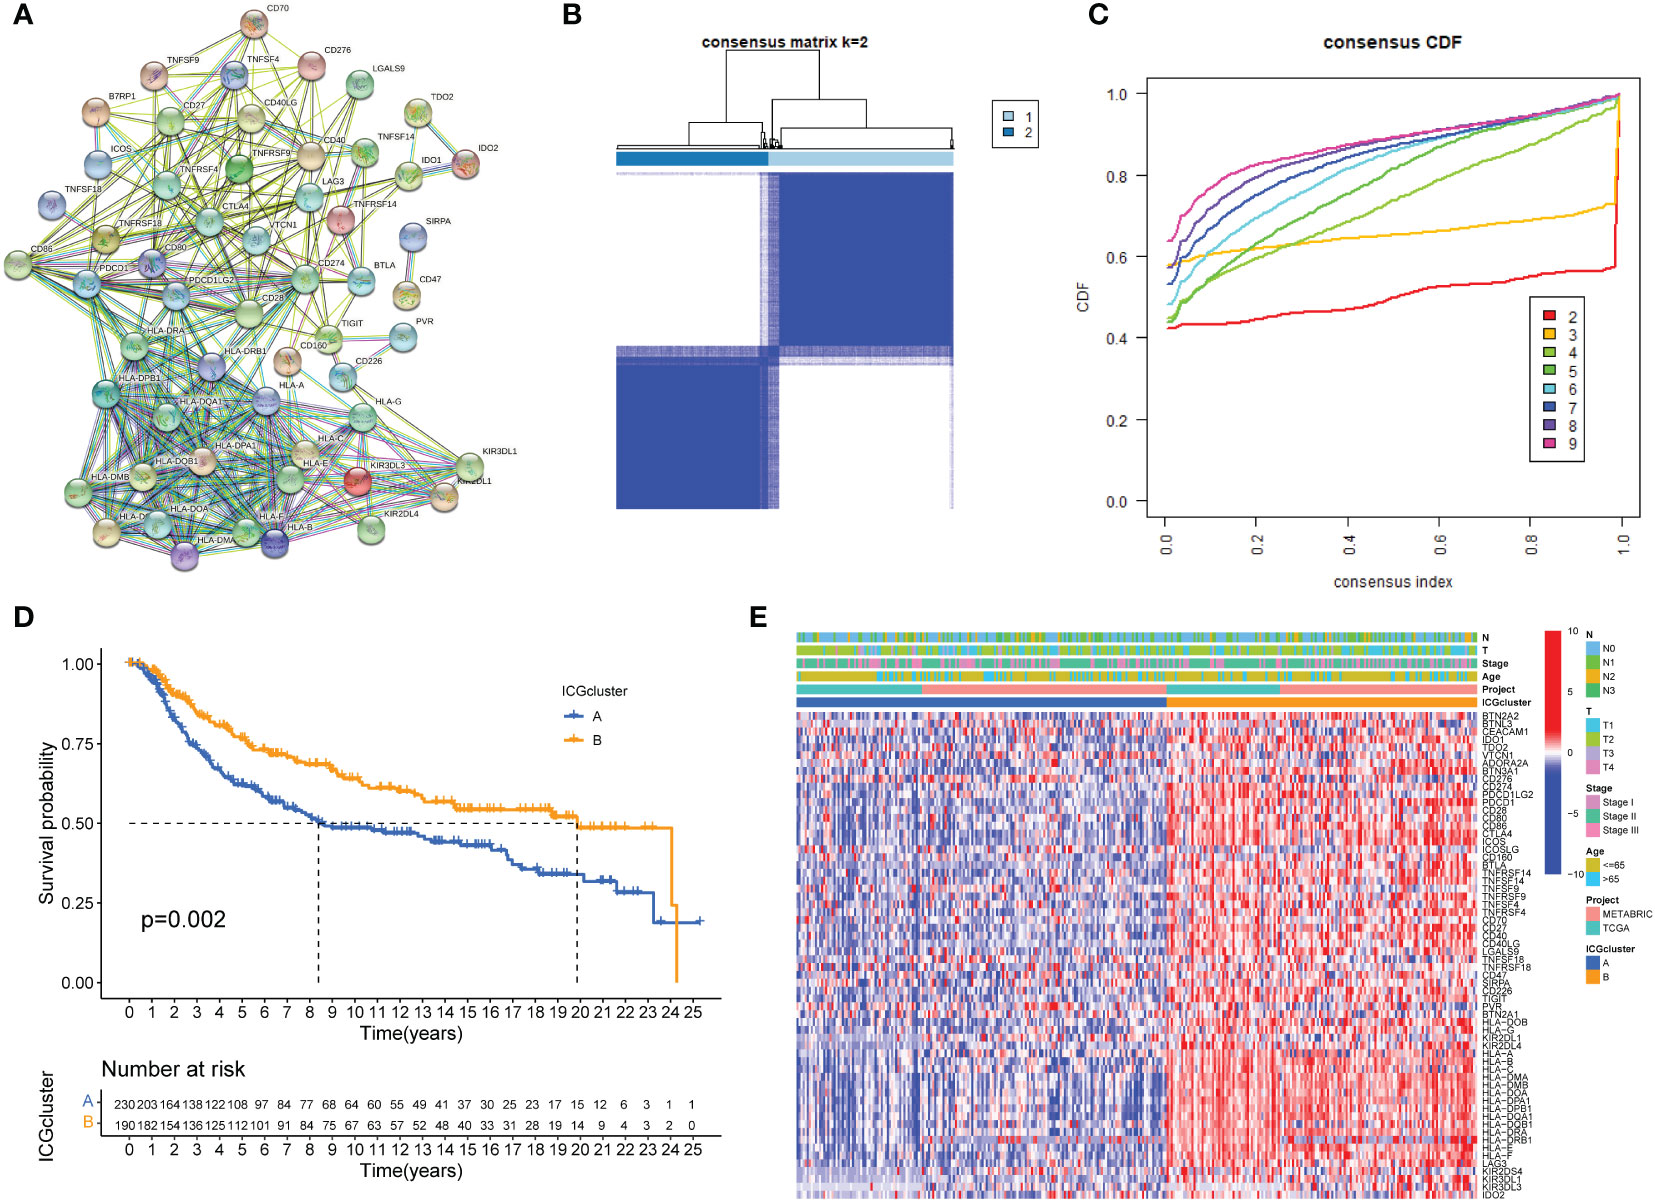
Figure 1 ICGs expression patterns in TNBC. (A) Protein interaction network of ICGs by STRING database. (B, C) Consensus clustering matrix for k = 3 based on ICG expression. (D) Kaplan-Meier curves of OS for two TNBC subtypes. The numbers of patients in ICGscluster-A and ICGscluster-B subtypes are 230 and 190, respectively. (E) Unsupervised clustering of ICGs expression to divide TNBC patients into two ICGs subtypes. The ICGclusters, datasets, age, stage and survival status were used as patient annotations.
Construction of ICGs-related gene clusters in TNBC
Principal component analysis was conducted to classify TNBC samples into two classes with clear differences after dimensionality reduction (Figure 2A). To further explore the biological behaviors between different ICGs cluster, the results of GSVA revealed that ICGscluster-B was highly enriched in various immune-related pathways, such as natural killer (NK) cell mediated cytotoxicity, T cell receptor signaling pathway, interferon gamma response and IL-6 JAK STAT3 signaling (Figures 2B, C). To further characterize the immune infiltration in different ICGs clusters, we applied the ssGSEA method in TNBC samples. As shown in Figure 2D, ICGscluster-B patients had a higher abundance of antitumor immune cells including activated CD8 T cell, activated dendritic cell and so on. We next identified ICGs-related DEGs using the “limma” algorithm and 570 DEGs were recognized between two ICGs clusters (Supplementary Table S3). GO and KEGG enrichment analyses displayed that these ICGs-related DEGs were mainly involved in T cell activation, MHC protein complexs, immune receptor activity and cytokine−cytokine receptor interactions (Supplementary Figures S1 and S2). The univariate cox regression analysis was applied to screen the prognostic ICGs-related DEGs (Supplementary Table S4). We next conducted the consensus clustering analysis and the results showed two ICGs geneClusters (named ICGs-G1 and ICGs-G2) based on the expression of prognostic ICGs-related DEGs (Figures 2E, F). Survival analysis indicated that patients with ICGs-G2 were associated with better prognosis (Figure 2G). The heat plot showed that ICGs-G2 patients were largely overlapped with ICGscluster-B subtype (Figure 2H). As expected, higher expression of ICGs was observed in ICGs-G2 subtype compared to ICGs-G1 subgroup (Figure 2I).
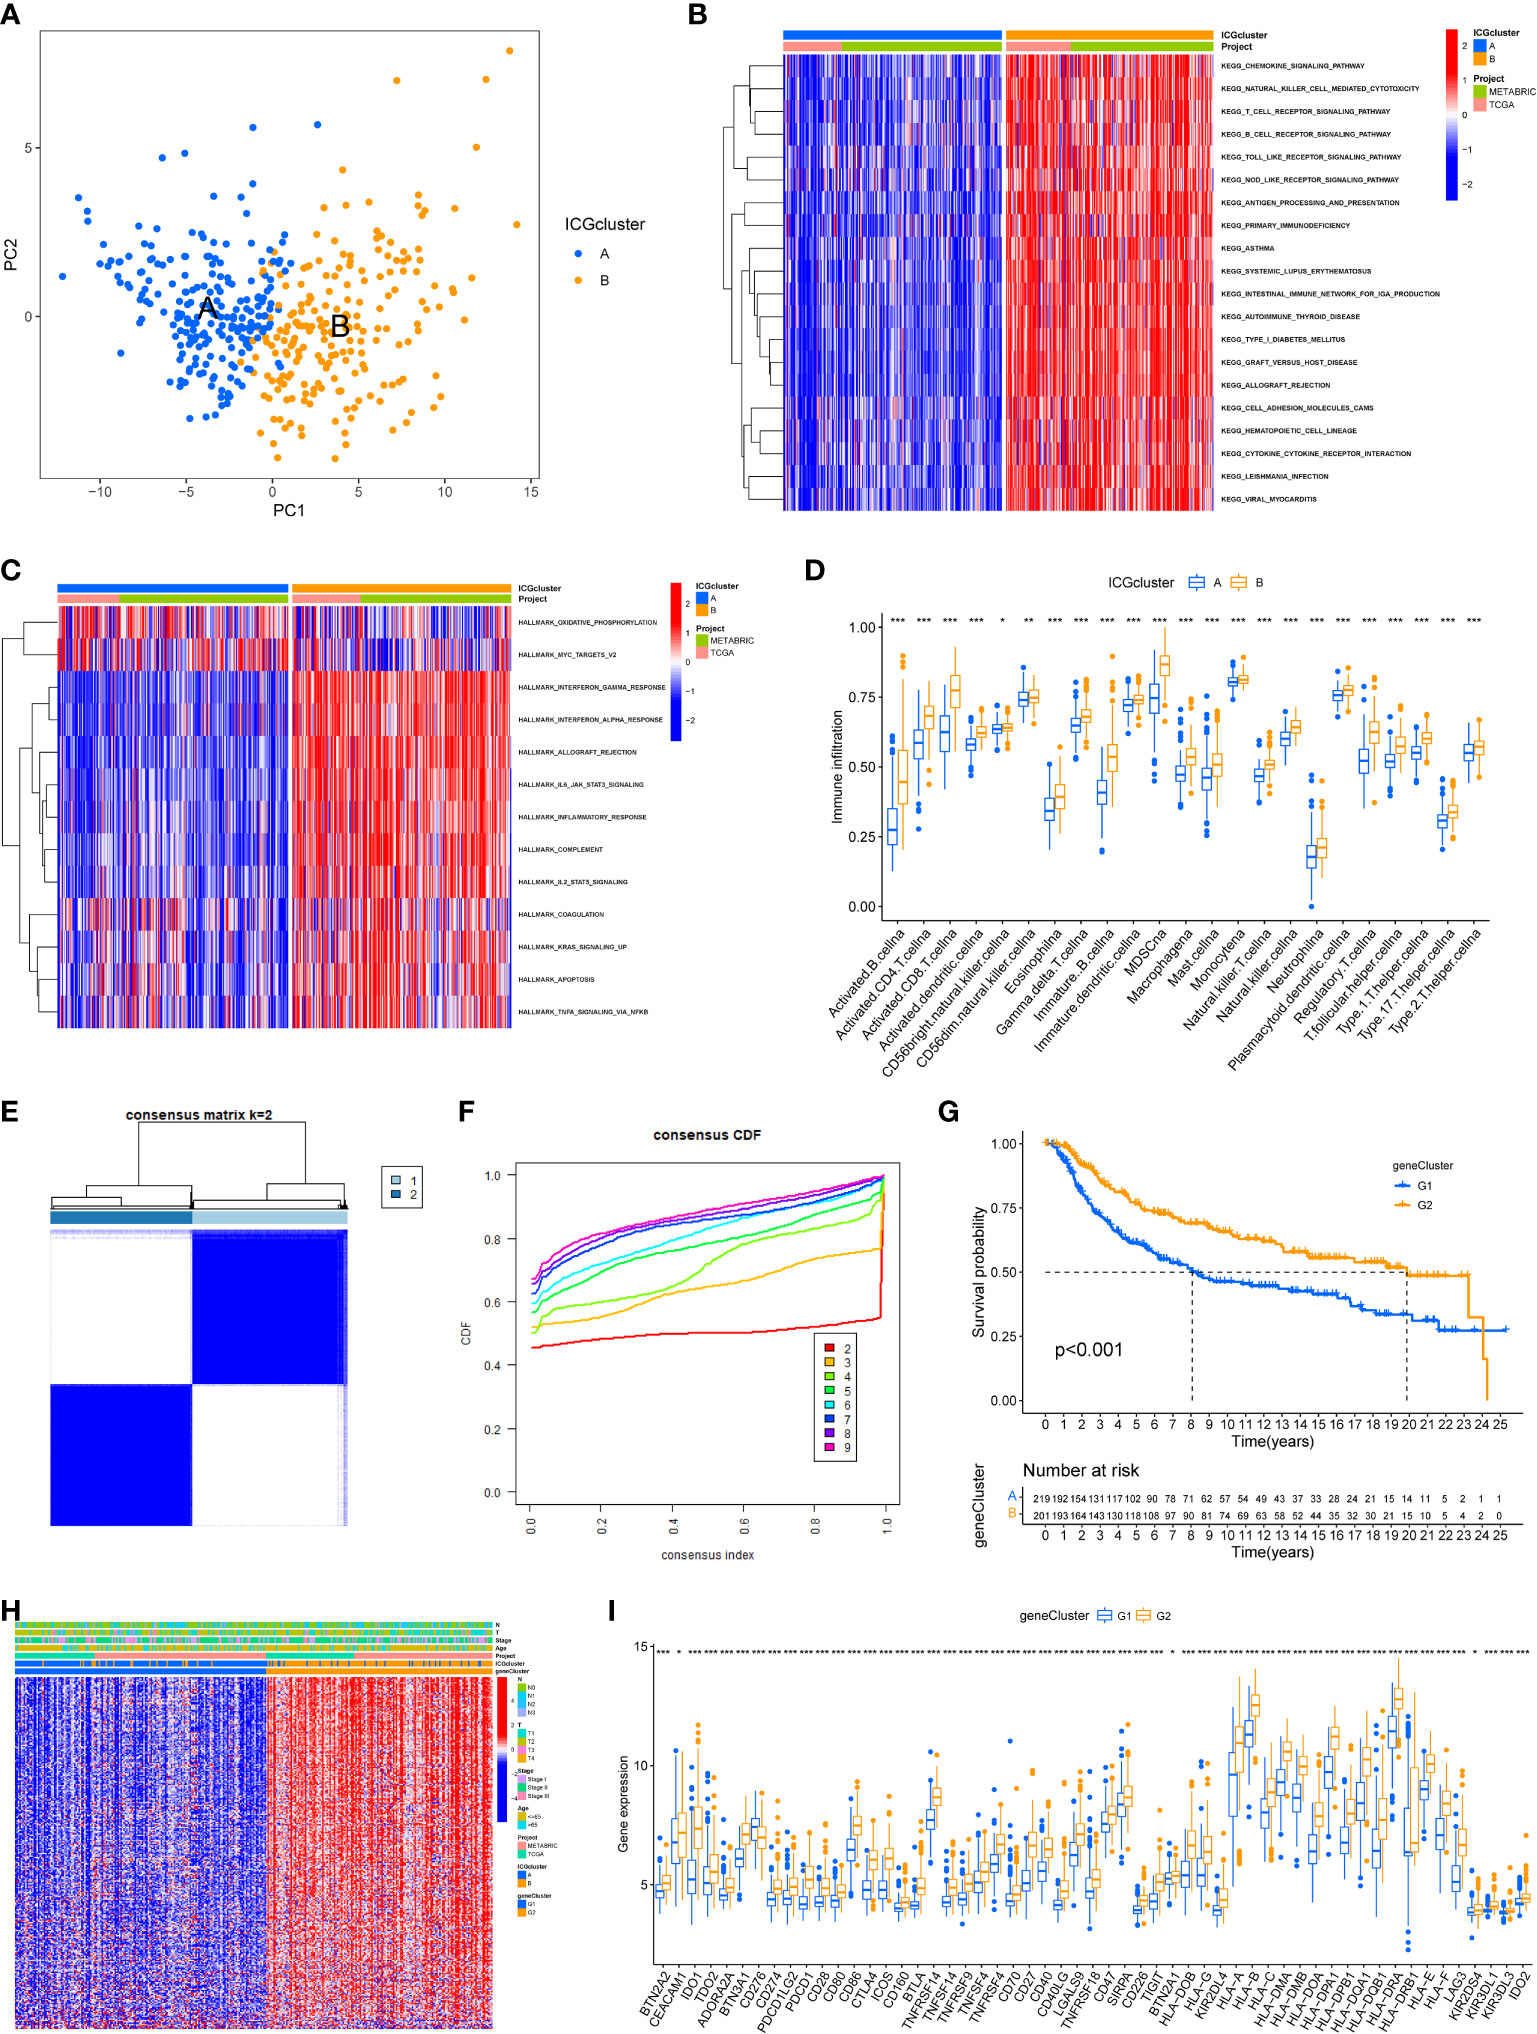
Figure 2 Identification of ICGs-related geneclusters in TNBC. (A) Principal component analysis of two immune checkpoint patterns, showing a remarkable difference between different patterns. (B) Heat map showed the GSVA score of KEGG pathways in two ICGs subtypes. Red indicated activated pathways, and blue indicated inhibited pathways. (C) Heat map showed the GSVA score of Hallmark signature in two ICGs subtypes. Red indicated high enrichment Hallmark. (D) The abundance of each infiltrating immune cells in two ICGs clusters. The lines in the boxes indicated the median value. The top and bottom ends of the boxes were interquartile range of values. (E, F) The identification of ICGs geneClusters by consensus clustering matrix for k = 2. (G) The survival curves of the ICGs geneClusters were plotted by the Kaplan-Meier plotter. The numbers of patients in geneCluster G1 and geneCluster G2 subtypes are 219 and 201. (H) Unsupervised clustering of prognostic ICGs-related DEGs to divide patients into two genomic subtypes. The ICGs geneClusters, ICGs clusters, datasets, age stage and survival status were used as patient annotations. (I) The expression of ICGs in two ICGs geneClusters (*P < 0.05; **P < 0.01; ***P < 0.001).
Generation of an ICGs risk model
We next constructed a Lasso logistic regression model to assess the immune status for individual TNBC patients. Four ICGs-related genes were selected to generate the best risk score model (named IRS) (Figures 3A, B). The riskscore was calculated by the formula IRS = expression level of FGD3 *(-0.22) + expression level of TMEM176A*(-0.19) + expression level of CD1B*(-0.57) + expression level of MATK*(-0.24). We also noted that TNBC patients with ICGs-G2 subtype or ICGscluster-B subtype had a lower IRS, indicating that IRS was a poor prognostic indicator (Figures 3C, D). The relationships among ICGs clusters, ICGs geneCluster and IRS were illustrated as Figure 3E. The ICGscluster-B subtype in ICGs-G2 subpopulation was linked to a low IRS. Finally, we found TNBC patients with a low IRS had higher expression of ICGs than those with a high IRS (Figure 3F).
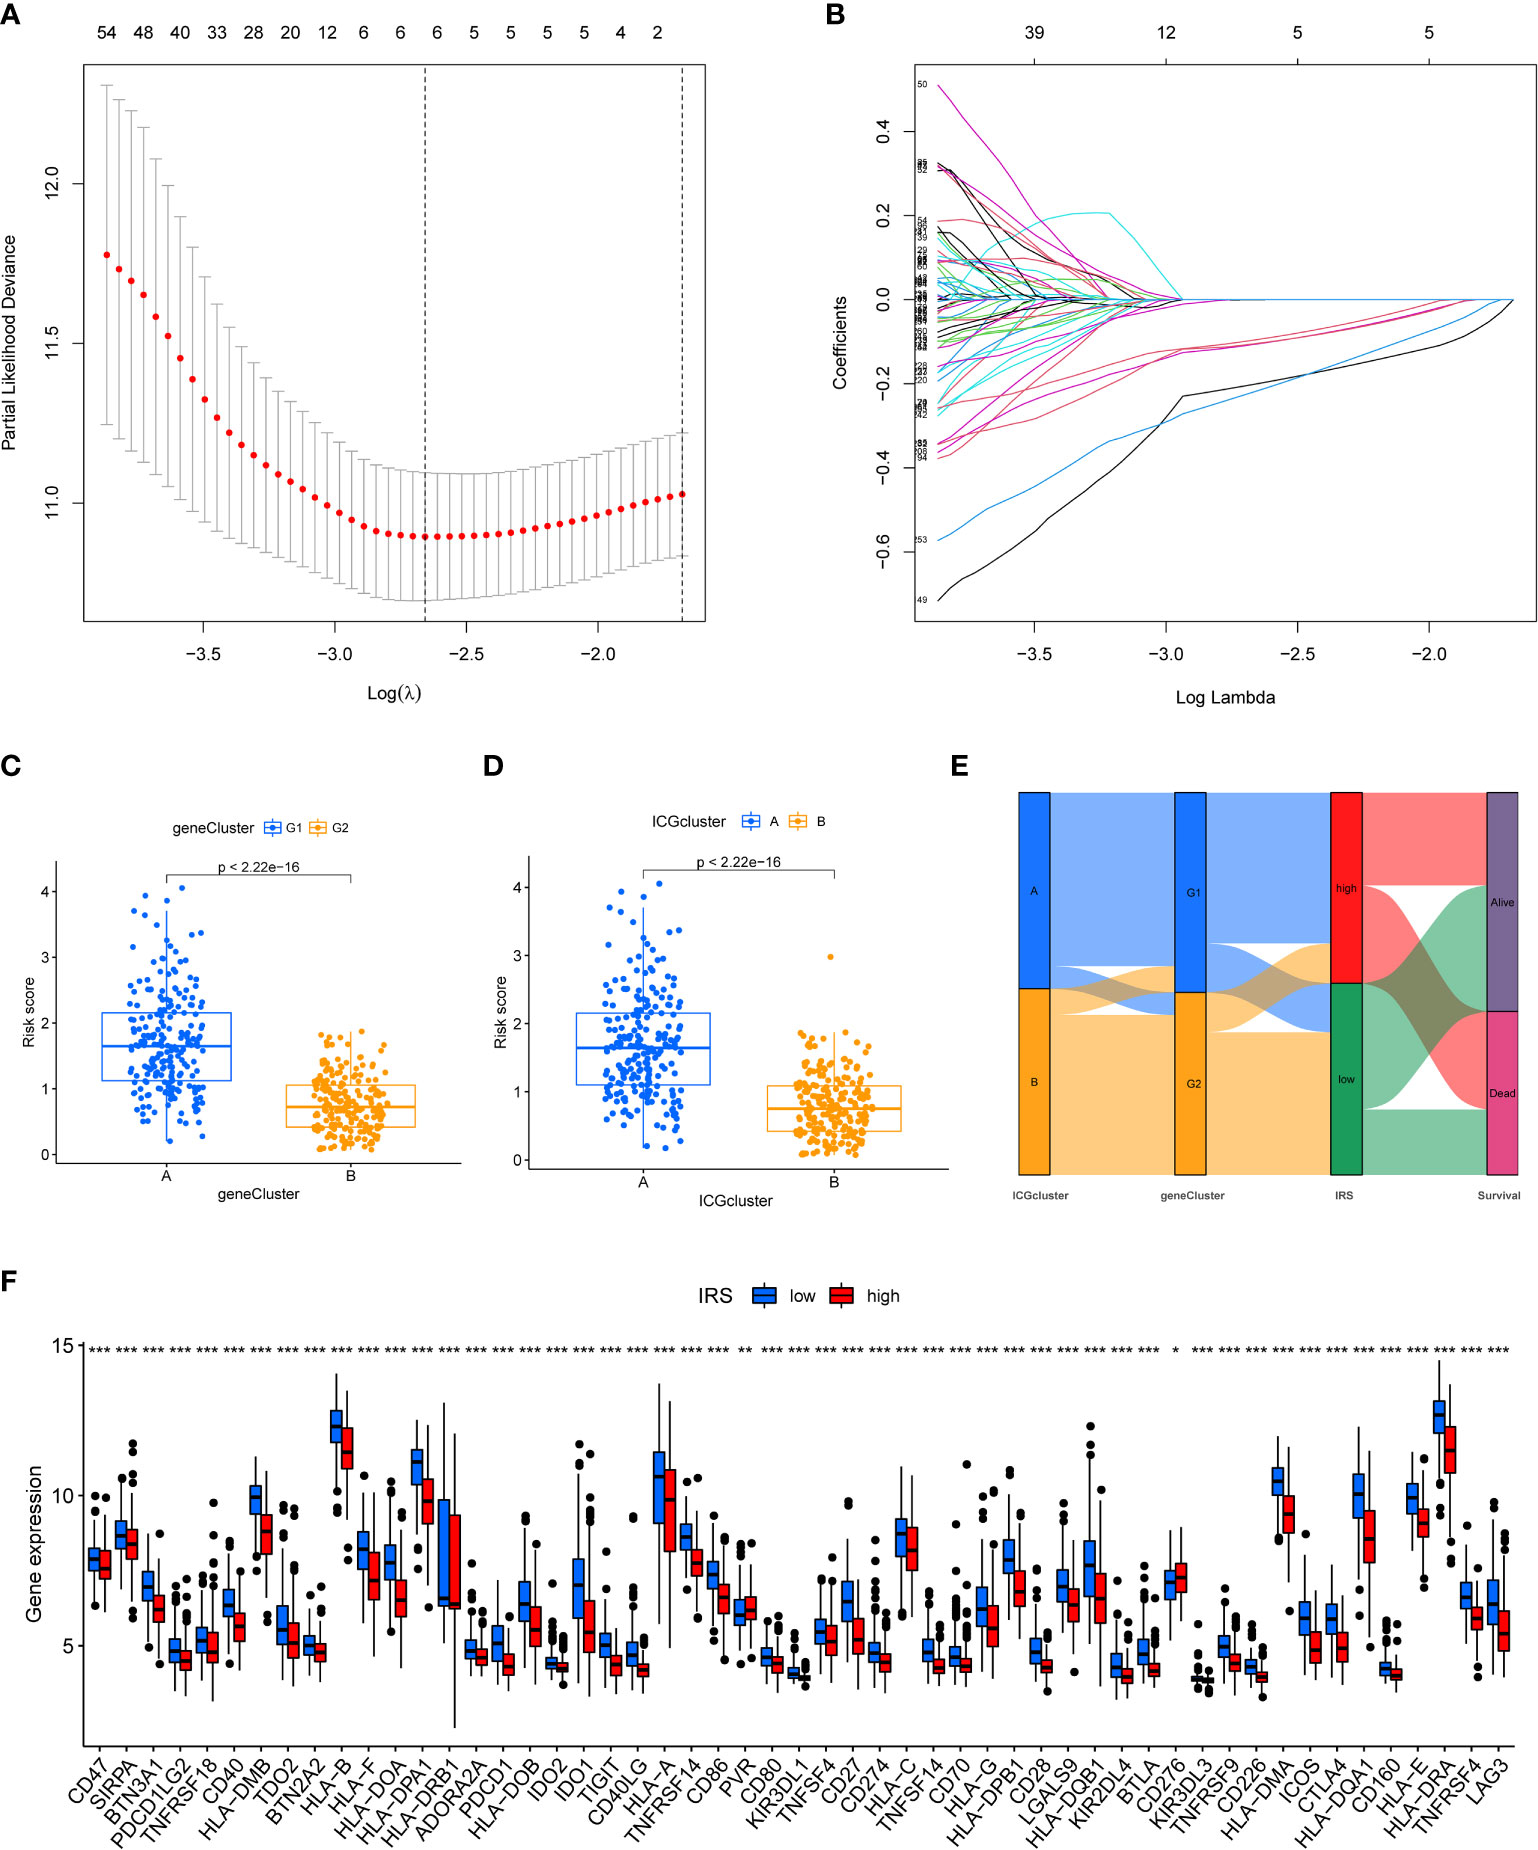
Figure 3 Construction of ICGs-related risk model. (A) Elucidation for LASSO coefficient profiles of prognostic ICGs. (B) The least absolute shrinkage was performed and construction of selection operator (LASSO) regression model. (C) The correlation between IRS model and ICGs geneClusters. (D) The correlation between IRS model and ICGs cluster. (E) Alluvial diagram of ICGs clusters in groups with different geneClusters, IRS, and survival status. (F) The expression of ICGs in high and low IRS group (*P < 0.05; **P < 0.01; ***P < 0.001).
Validation of the efficacy of ICGs-related riskscore model
We then divided the TNBC cohort into a training cohort (N = 211) and a validation cohort (N = 209). The clinical characteristics of two cohorts were summarized in Supplementary Table S5. Patients were classified into low-risk and high-risk groups based on their median risk scores. In both the training and validation cohort, TNBC patients with high IRS predicted shorter OS than those with low IRS (Figures 4A, B). Time-dependent ROC curves also exhibited excellent stability of our IRS model in the training cohort (5‐year AUC, 0.705; 3‐year AUC, 0.684; 1‐year AUC, 0.746; Figure 4C) and validation cohort (5‐year AUC, 0.606; 3‐year AUC, 0.644; 1‐year AUC, 0.605; Figure 4D). The distribution of IRS model in training cohort and validation cohort was presented in Figures 4E, F. Moreover, the scatter plot showed that the mortality rate of TNBC patients increased with the increased level of IRS in both the training cohort and validation cohort (Figures 4G, H). As shown in Figures 4I, J, high expression of FGD3, TMEM176A and MATK was observed in low IRS group.
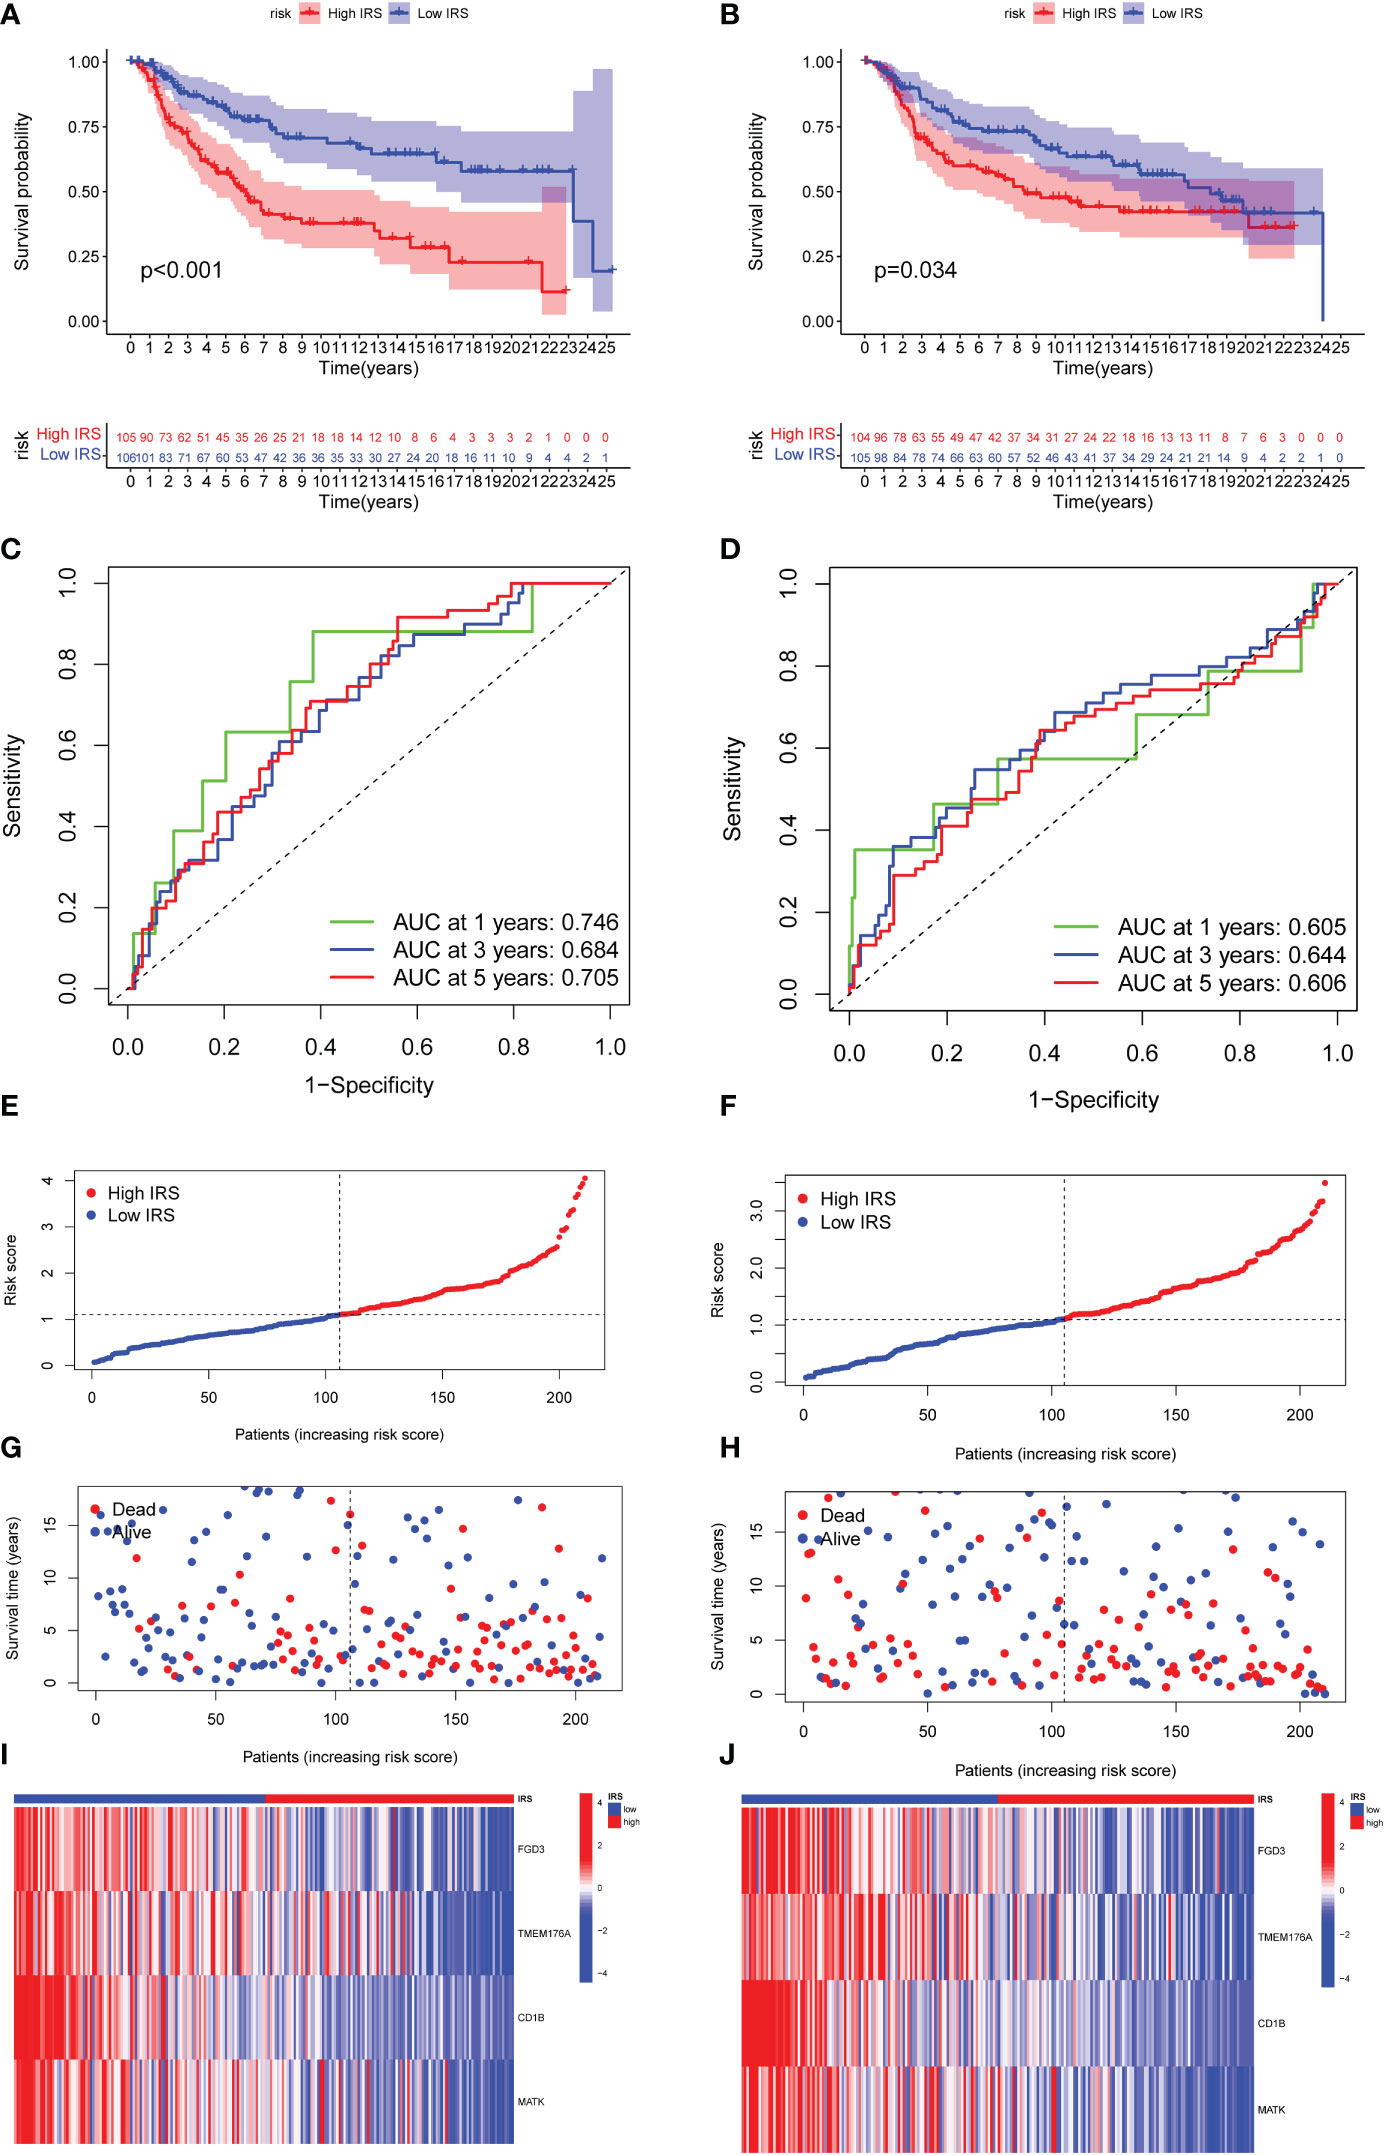
Figure 4 Validation of the efficacy of ICGs-related riskscore model. (A, B) Kaplan–Meier curves for OS in TNBC patients according to the riskscore stratification in the training cohort and validation cohort. (C, D) Time-dependent ROC analysis for OS prediction at 1 year, 3 year and 5 year in TNBC patients in the training cohort and validation cohort. (E, F) Distribution of risk score for the training group and validation cohort. (G, H) Distribution of survival time of patients in the training and validation cohort. (I, J) Heatmap depicting the expression of FGD3, TMEM176A, CD1B and MATK between high IRSgroup and the low IRSgroup in training and validation group.
Construction of nomogram for predicting OS
PCA and t-SNE methods were applied to separate two risk subgroups. As shown in Figures 5A–D, different risk subgroups were divided into two obvious directions. To explore whether the effect of our IRS model was an independent factor, we combined clinicopathological variables including age, stage tumor size and node status with IRS to perform Cox analyses. Univariable Cox regression analysis showed that IRS was a high-risk factor for TNBC patients [HR =1.714, 95% CI (1.323, 2.221), p < 0.001, Figure 5E]. Multivariate Cox analysis further supported that IRS could serve as an adverse independent prognostic factor [HR=1.544, 95% CI (1.173, 2.003), p =0.002, Figure 5F]. We also performed multivariable Cox-regression analysis adjusting for stage, IRS and the infiltration of immune cells. The results further confirmed the independent prognostic role of IRS (Supplementary Figure S3). We next developed a nomogram combining clinicopathological features and IRS model to help clinicians to predict the survival of TNBC patients. Calibration curves for OS prediction at 1, 3, and 5 years were as shown in Figure 5G. In addition, if the total nomogram score of one patient was 138 points, the estimated survival probabilities for this patient were 96.8%, 77.5%, and 66.2% for 1, 3, and 5 years, respectively (Figure 5H).
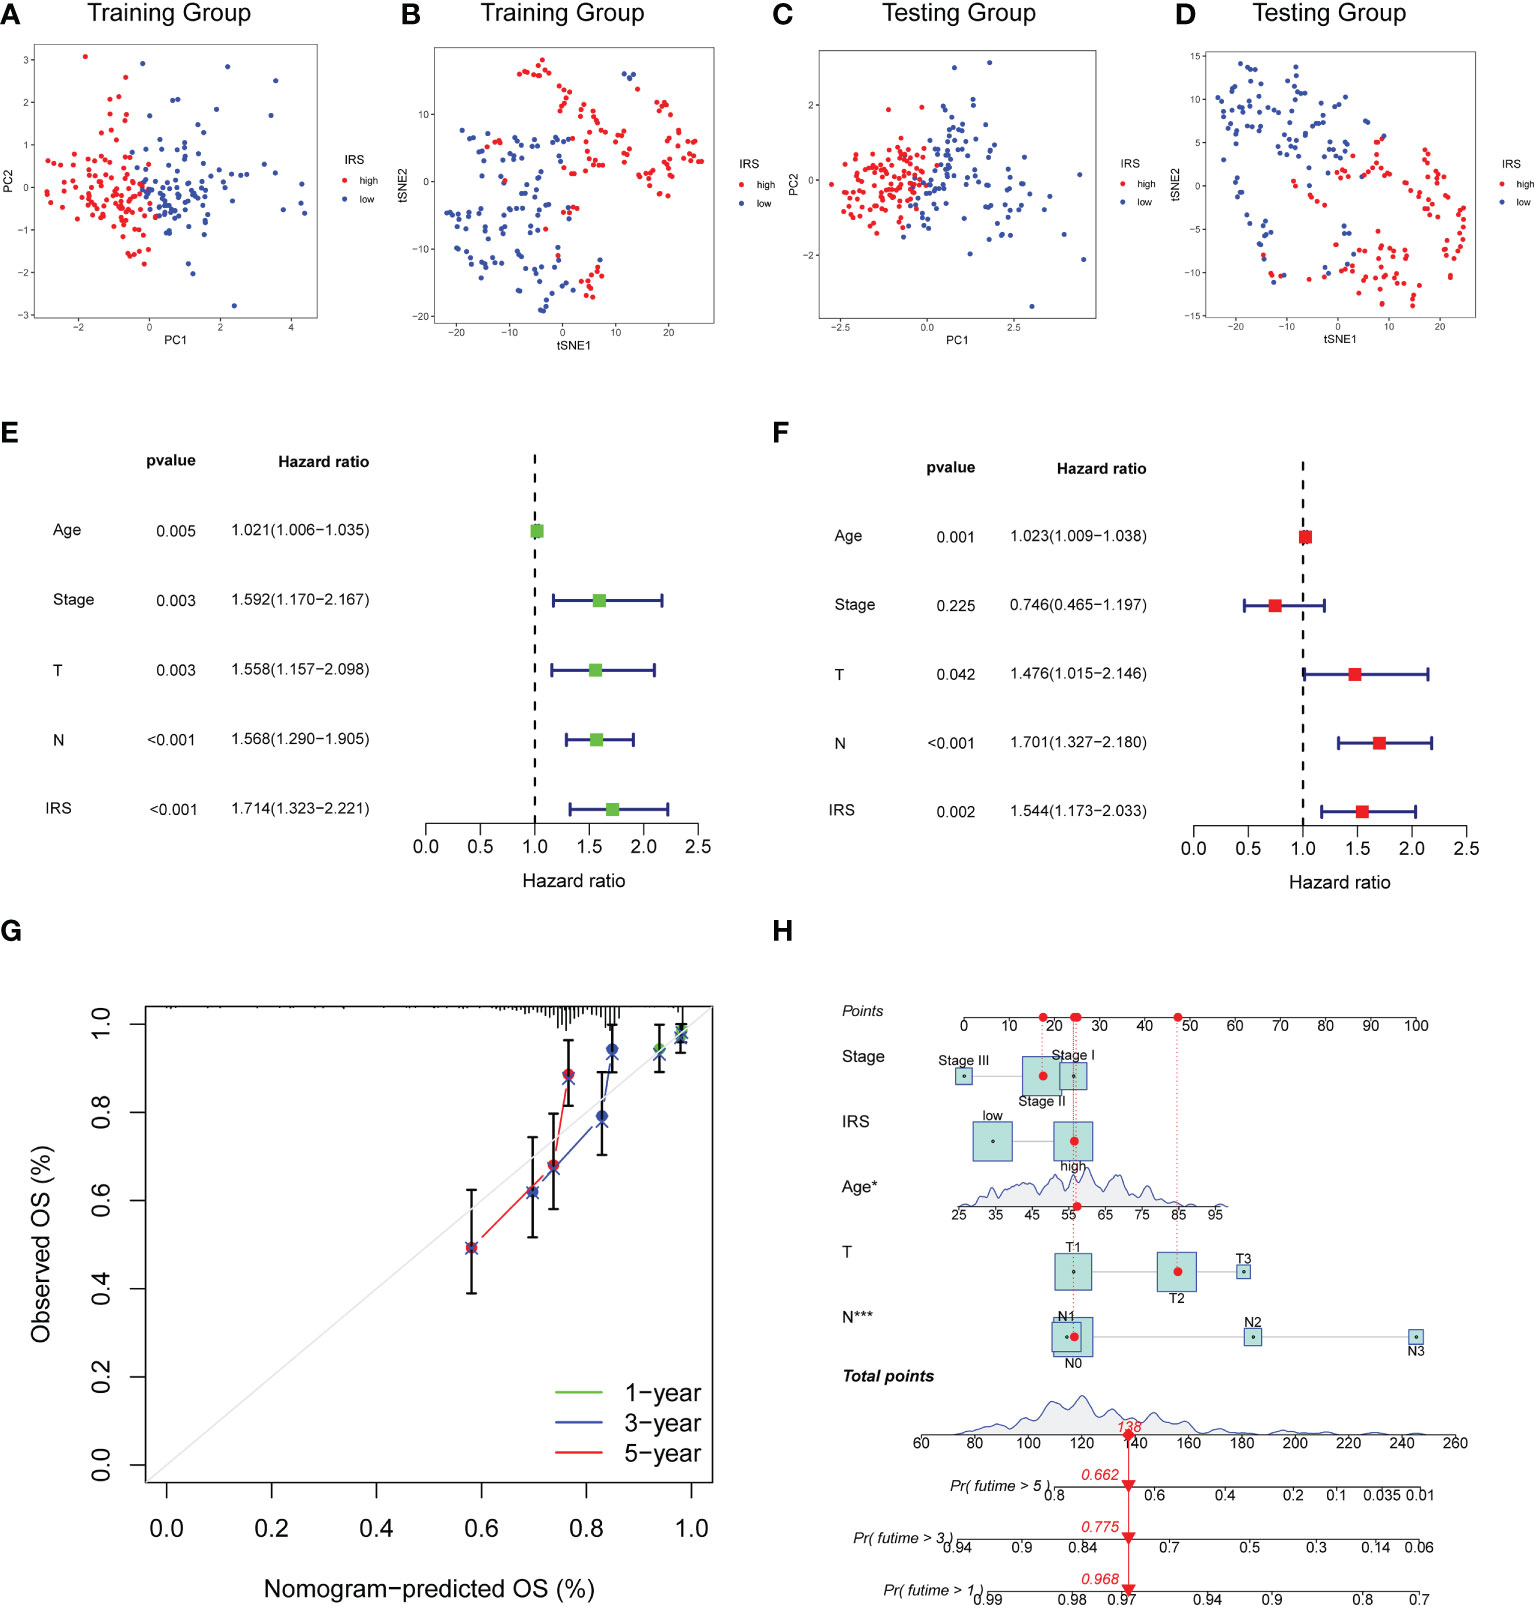
Figure 5 Construction of Nomogram for predicting OS in TNBC. (A, B) PCA analysis and t-SNE analysis of TNBC patients based on IRS model for the training cohort. (C, D) PCA analysis and t-SNE analysis of TNBC patients based on IRS model for the validation cohort. (E) Forest plot for IRS and clinical features in TNBC patients by univariate analyses. (F) The multivariate Cox forest plot of IRS and clinical characteristics. (G) Calibration curves for predicting patients’ OS at 1-, 3-, and 5-year in TNBC patients based on the nomogram. (H) Nomogram depending on the IRS and other clinicopathologic feature predicting the 1-, 3-, and 5-year overall survival for TNBC patients.
Immune characteristics and genomic features in different risk subgroups
We further investigated the immune cells infiltration in different risk subgroups by CIBERSORT algorithm. As shown in Figure 6A, the expression of CD1B was strongly associated with the infiltration of CD8 T cells, T help cells and resting dendritic cells. FBP1 had a strong correlation with infiltration of CD8 T cells, memory CD4 T cells and M1 macrophages. Furthermore, a strong positive correlation was observed between the infiltration of CD8 T cells, memory CD4 T cells and activated NK cells. Overall, IRS was negatively correlated with the infiltration of activated NK cells and CD8 T cells (Figure 6B, C). M0 macrophages and M2 macrophage cells infiltration were positively correlated with IRS. However, M1 macrophage cells infiltration was negatively correlated with IRS (Supplementary Figure S4). We also calculated the relationship between CD8 T cells infiltration and IRS model genes using other algorithms (Supplementary Figure S5). The results of the ESTIMATE algorithm also demonstrated that TNBC patients with a low IRS had a higher ImmuneScore and ESTIMATEScore (Figure 6D). In addition, the immune function in low IRS patients might be attributed to the activation of various immune cells (Figure 6E). High IRS was proven to be positively associated with the stemness index DNAss and RNAss (Supplementary Figure S6). Then, we investigated the genomic features in different IRS subgroups of TCGA-TNBC cohort. The waterfall plot demonstrated that high IRS group presented an increased tumor mutation burden compared with the low IRS group (Figures 6F, 6G). TTN (33% vs.12%) had higher mutation rates in high IRS group.
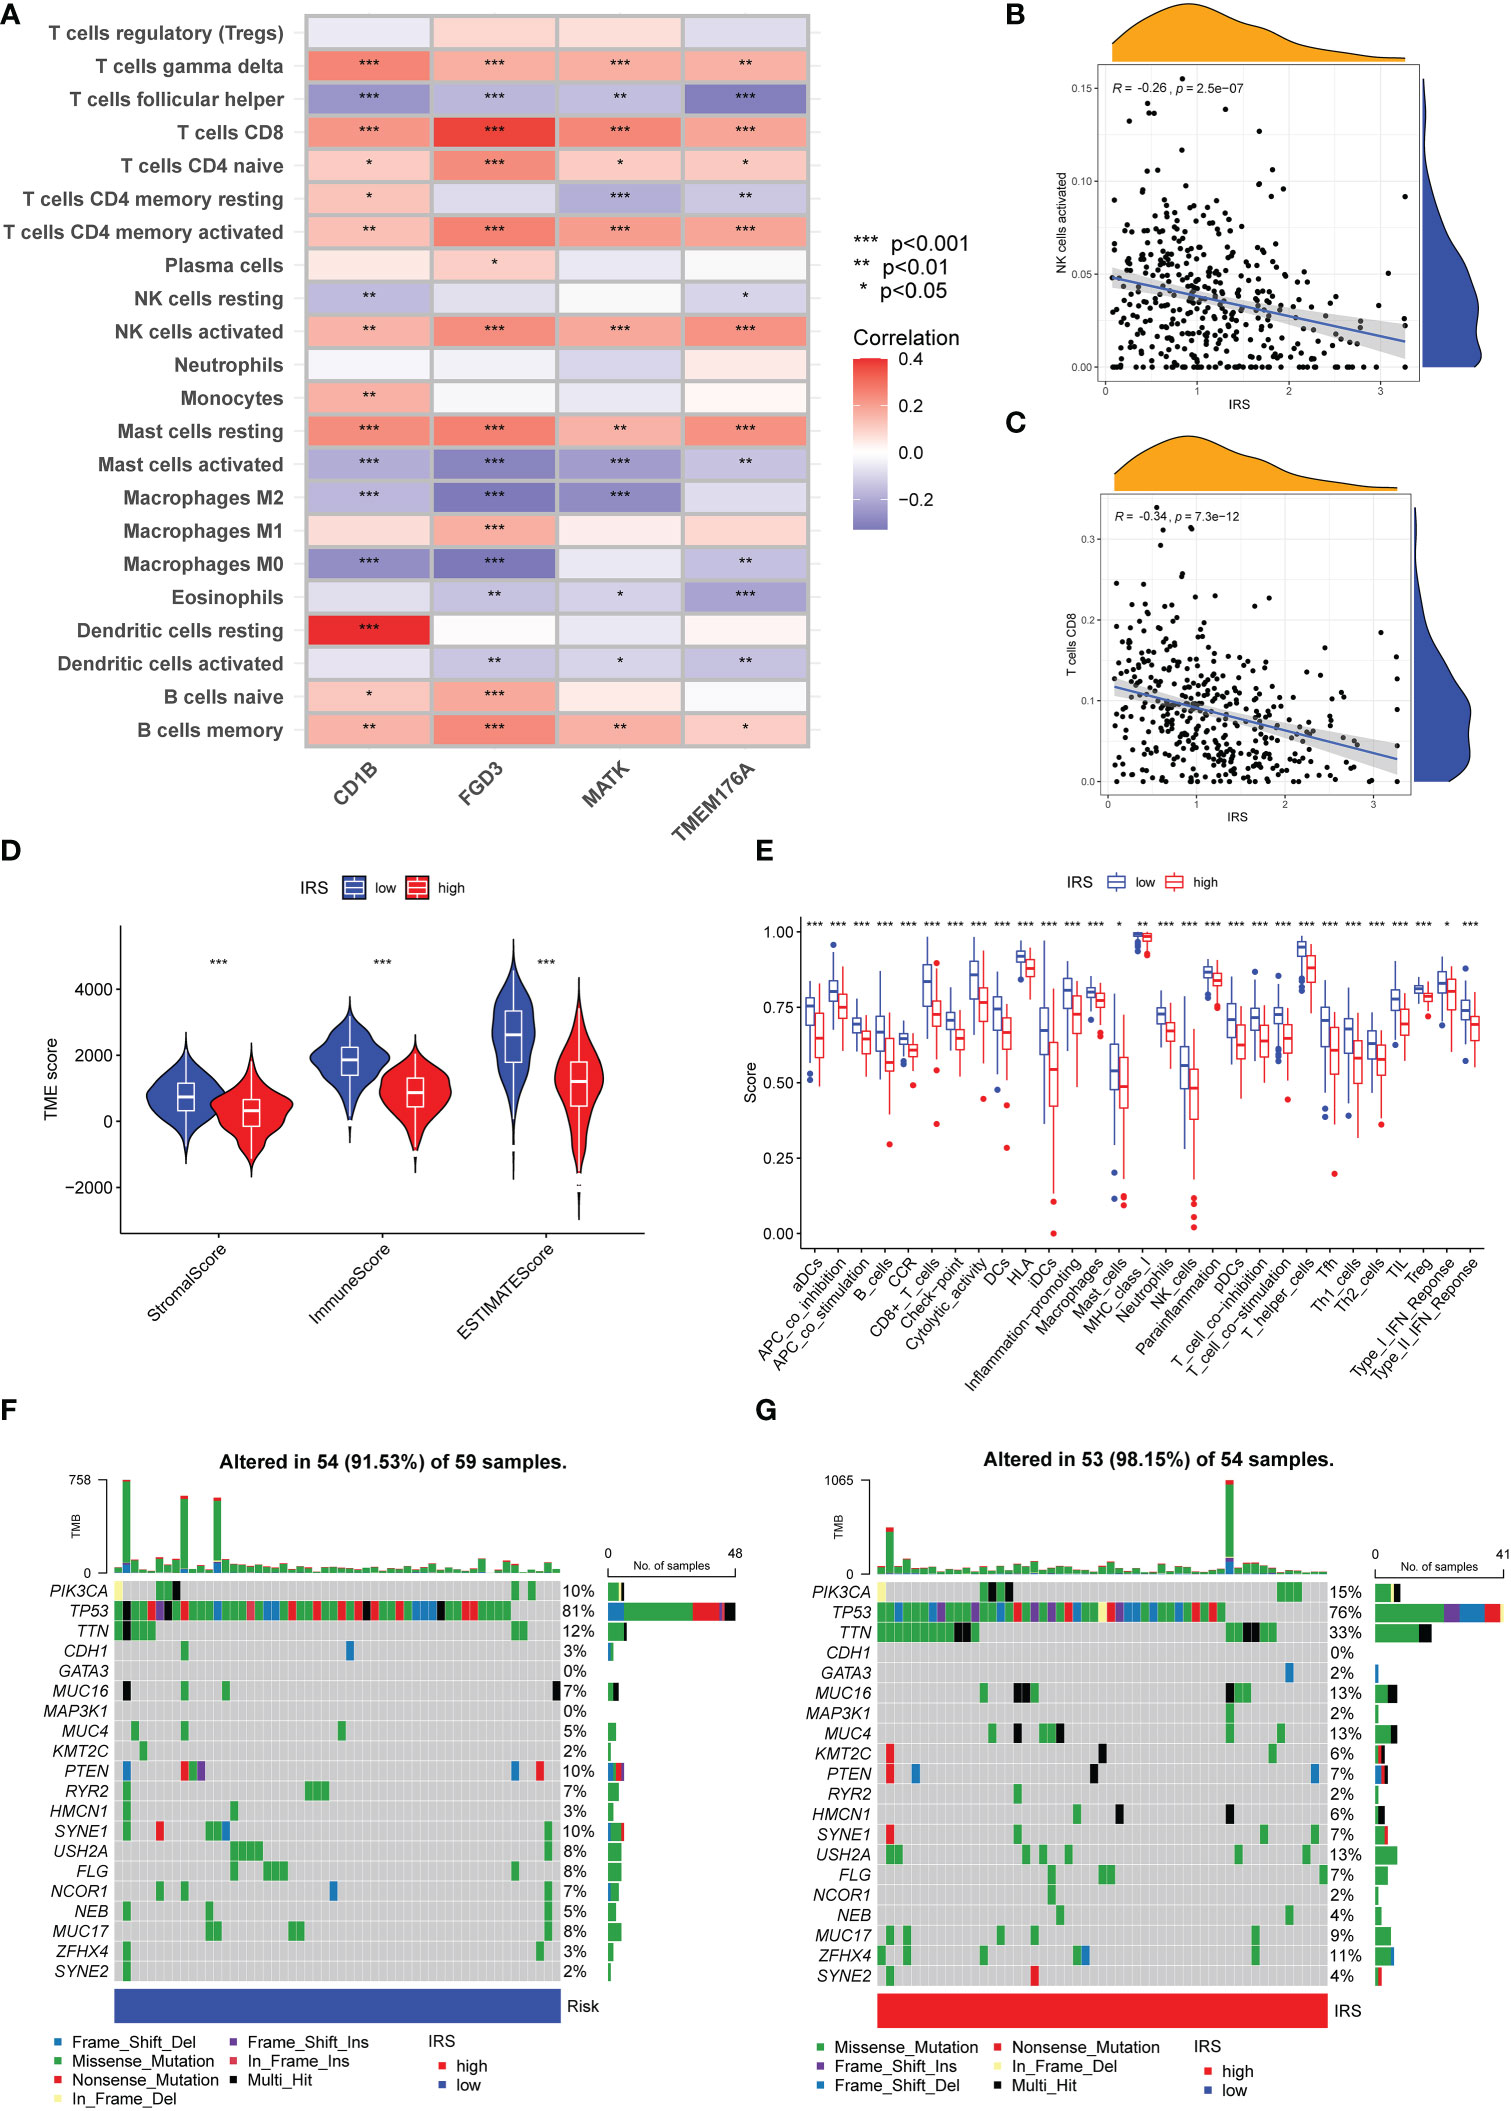
Figure 6 Immune Characteristics and genomic features of ICGs-related riskscore model. (A) Heatmap depicting the correlations between the expression of FGD3, TMEM176A, CD1B, MATK and 22 immune infiltration cells. (B) Correlation analysis between IRS and the level of activated NK cells infiltration. (C) Correlation analysis between IRS and the level of CD8 T cells infiltration. (D) Following the ESTIMATE algorithm, the level of stromal, immune, and ESTIMATE scores in different IRS groups. (E) Immune function analysis in different IRS groups. (F, G) The waterfall plot of showed the somatic mutation rate in low IRS and high IRS group. Each column indicated an individual sample. The upper barplot was the tumor mutation burden for an individual sample. The right histogram generalized the percentage of each variant type. The number on the right indicated the mutation frequency for each gene.
Predictive value of ICGs-related riskscore model in ICIs therapy
Associations of clinical parameters and the IRS model were also explored. As the Figure 7A shown, our IRS model was significantly correlated with tumor stage and tumor size. We next adopted the IPS score to assess the potential clinical efficacy of ICIs in different IRS subgroups. The IPS score is a valid indicator as a measure of immunogenicity. There was no significant difference for TNBC patients with PD-1 negative expression (Figures 7B, D). More remarkably, low IRS might serve as a valid candidate biomarker for ICIs in patients with PD-1 positive expression (Figures 7C, E). Although TNBC patients with a high IRS might not be the most suitable candidates for ICIs therapy, drug sensitivity analysis revealed that TNBC patients with a high IRS were more sensitive to several targeted drugs or small molecule inhibitors such as lapatinib, GW.441756, A.443654, BIBW2992, Bicalutamide, GNF. 2, NSC.87877 and PF.4708671 (Figures 7F, G and Supplementary Figure S7).
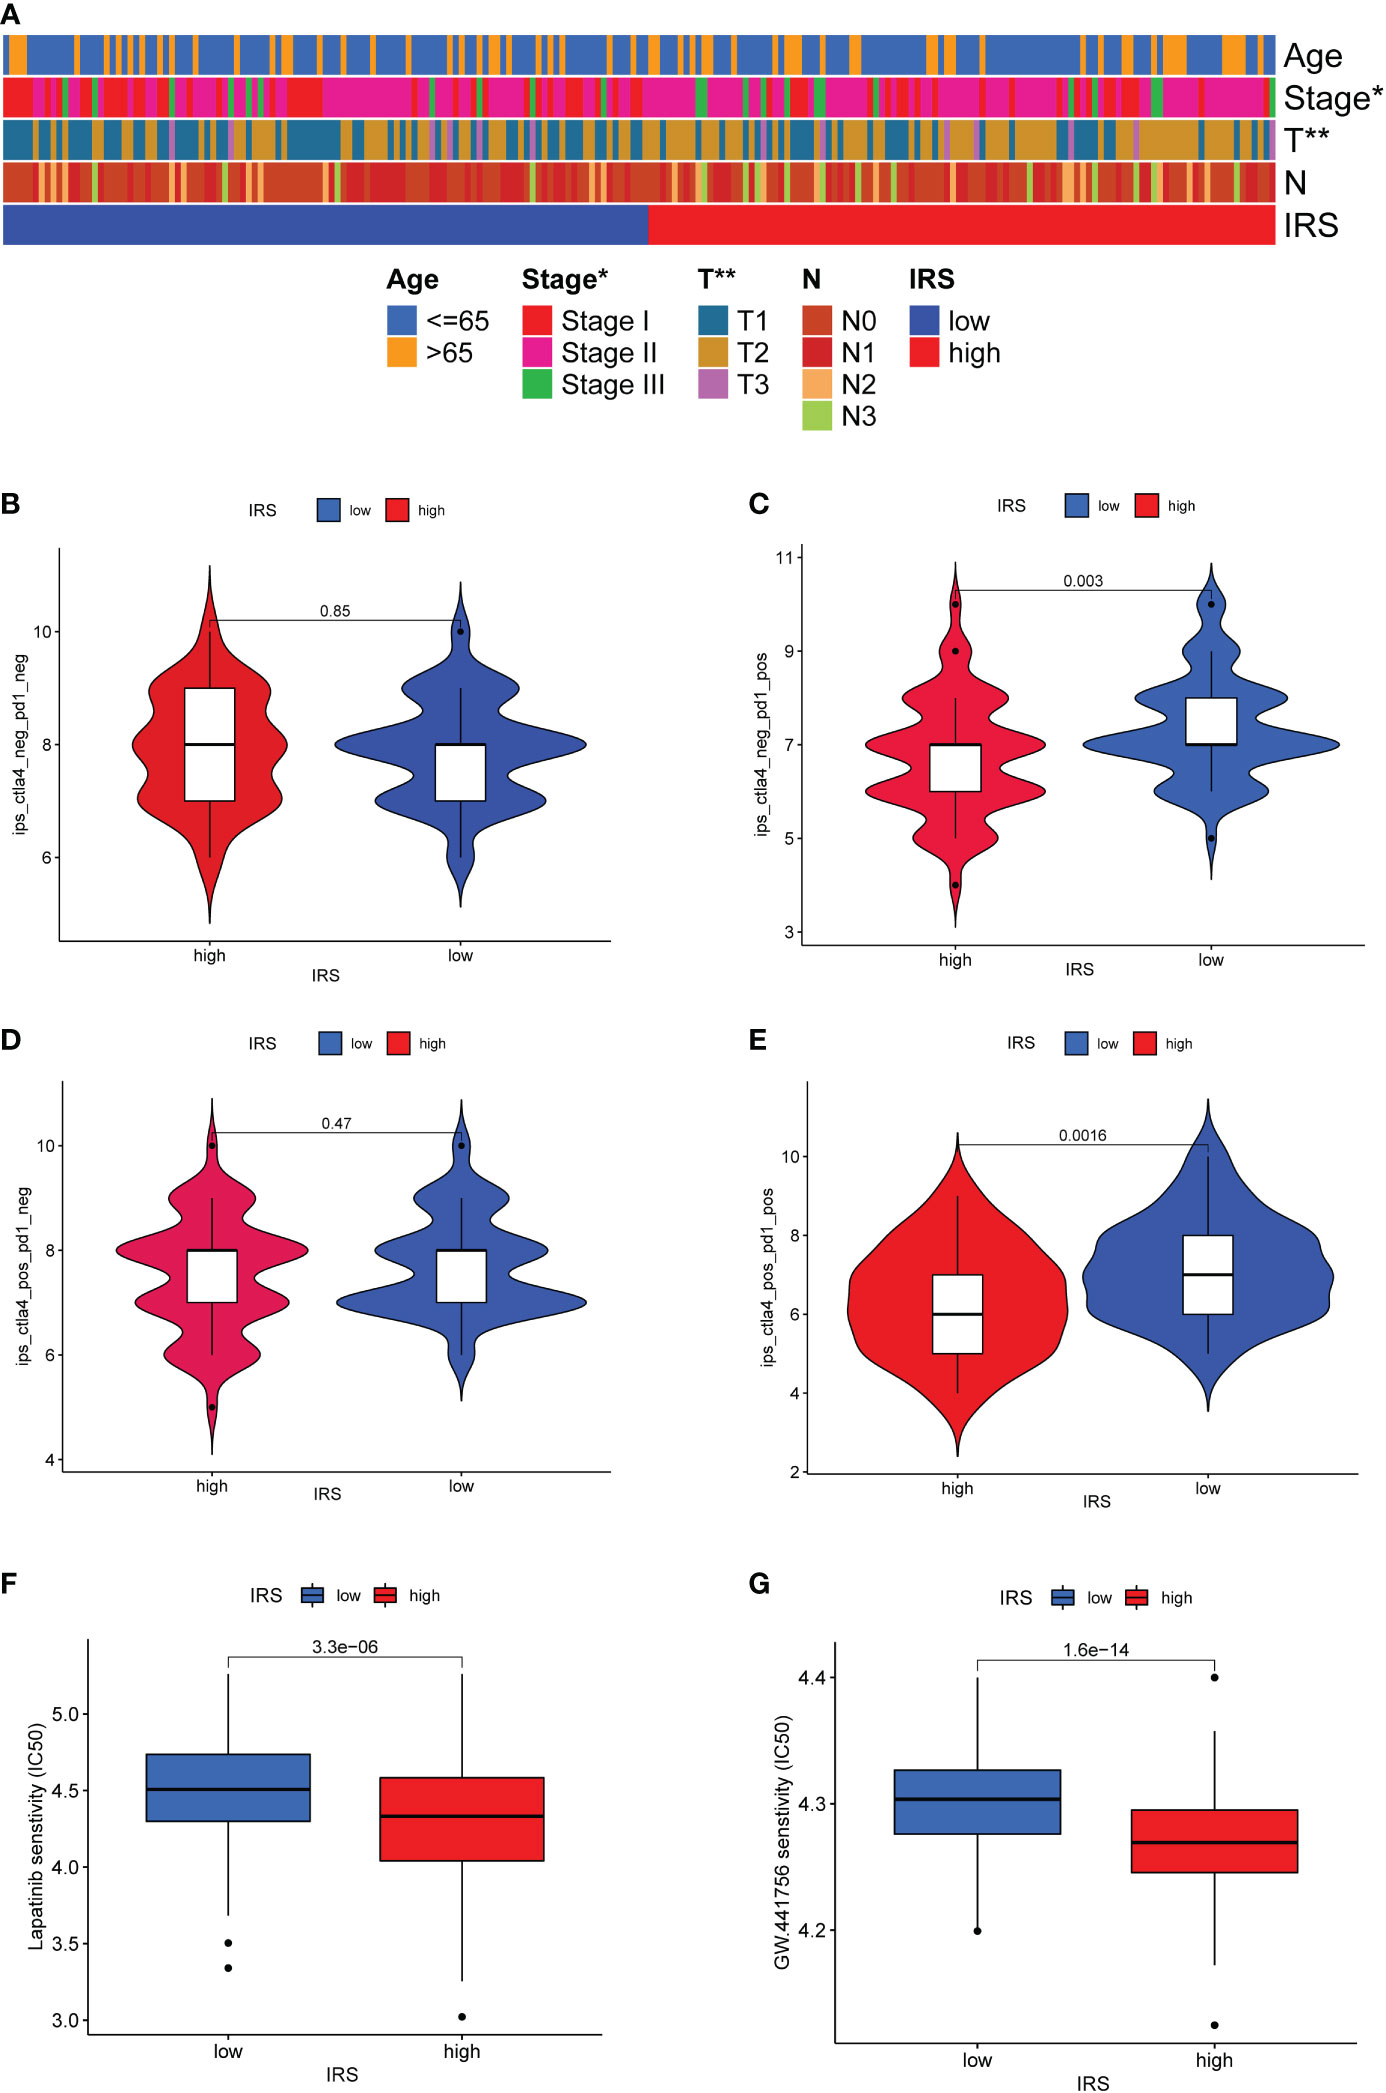
Figure 7 Predictive value of ICGs-related riskscore model in ICIs therapy. (A) Heatmap showing the relationship between IRS and clinicopathological parameter. (B–E) The relative distribution of IPS identified by the status of CTLA-4 or PD-1 was compared between high IRS group versus low IRS group in TCGA-TNBC cohort. (F, G) Drug sensitivity analysis in different IRS groups.
Discussion
Immune checkpoint blockade (ICB), an emerging immunotherapy, has been approved to treat multiple cancers (36–38). Although immunotherapy has been widely used in clinical practice, immune-cold cancers still lack a positive clinical outcome (5). TNBC are believed to be more immunogenic than other BC subtypes, but TNBC patients often show heterogeneous responses to ICB therapy. Therefore, the identification of suitable TNBC populations and effective therapeutic targets will develop a novel strategy to improve anti-tumor immune activities. Our study aimed to depict the immune checkpoints expression patterns from a molecular subtyping viewpoint and explore the immunotherapeutic value of ICGs patterns in TNBC. Here, we first investigated the expression of ICGs and evaluated the prognostic value of ICGs in TNBC. Then, ICGs-related subtypes were identified based on the expression of ICGs and ICG-related DEGs. Finally, we constructed a quantitative scoring system IRS and investigated its role in immune cell infiltrates and ICB treatment.
In this study, we first extracted the expression of 53 ICGs from transcriptome data of TCGA-TNBC and depicted the interaction network of ICGs. Inhibitory checkpoint molecules often function as immune inhibitory signaling in the immune system (39). The levels of inhibitory checkpoint molecules have been reported to be involved in predicting patient response to immunotherapy (40). We next revealed two ICG subtypes that were associated with patients’ survival outcomes and immune cells infiltration. Here, our ICGs subtypes were identified based on the expression of ICGs in TNBC. However, extensive studies have revealed the heterogeneity of molecular subtypes of TNBC. Gruosso et al. proposed that TNBC could be classified into four phenotypes: fully inflamed, stroma restricted, margin-restricted, and immune desert (4). Jiang et al. defined TNBC tumors into the following four transcriptional subtypes: luminal androgen receptor, immunomodulatory, basal-like immune-suppressed, and mesenchymal-like (41). For the above two molecular typing, subtypes of fully inflamed and immunomodulatory were characterized by high levels of immune genes or pathways, and satisfactory clinical outcomes. Our results showed that TNBC patients with ICGscluster-B often presented longer OS and higher expression of ICGs than those with ICGsclusters-A.
We further compared transcriptome differences between two ICGs clusters and identified two ICG-related gene subgroups. Considering the individual heterogeneity of TNBC, we established a quantification system IRS to assess the ICGs expression patterns for individuals. Oncotype DX, MammaPrint, and EndoPred are the promising multigene signatures currently available to diagnose recurrence of different BC cancer subtypes (42). So far, no clinical signatures have yet been made to evaluate the immune response in BC. Nevertheless, some gene signatures involved in the immune response in BC have been identified. Tumor-infiltrating lymphocytes (TILs) are the most widely studied immune cells in this context. A large, randomized trial have shown that increasing TIL levels in primary biopsies is associated with better OS and fewer recurrences (43). In addition, Yang et al. identified an immune-enhanced type of BC using 17-gene immune signature, which was associated with improved patient outcomes (44). Our analyses found that lower IRS was correlated with a favorable outcome, indicating the IRS signature was a negative indicator in TNBC. To further verify the accuracy and effectiveness of our IRS model, we compared the survival outcomes, ROC values and risk curves in the training and test cohort. The validation and training sets showed little variation in these parameters, suggesting that our IRS signature has good prediction performance, universality, and accuracy.
In this study, FGD3, TMEM176A, CD1B and MATK were applied to construct our ICGs-related Riskscore. The Facio-Genital Dysplasia 3 gene (FGD3) has been identified as a guanine nucleotide exchange factor for cell division control protein 42 (45). Guo et al. reported that FGD3 inhibited the malignant biological behavior of pancreatic cancer cell by FGD3/HSF4/p65 signaling axis (46). Low expression of FGD3 was an independent poor prognostic factor for overall survival and disease-free survival in young BC patients (47). TMEM176A, located on chromosome 7, belongs to the membrane-spanning 4A gene family (48). Human TMEM176A was initially discovered as a candidate in a screen looking for tumor-associated antigens in human hepatocellular carcinoma (HCC) (49). Recently, the epigenetic regulation of TMEM176A has been uncovered in cancer. The study of Li et al. revealed that reduced expression of TMEM176A in HCC was caused by hypermethylation of the promoter region, which might serve as a novel diagnostic and prognostic marker (50). In human lung cancer, it was reported that TMEM176A potently inhibited the growth of lung cancer cells both in vitro and in vivo by inhibiting ERK signaling (11). CD1B plays a critical role in regulating the T cells immune response to self- and foreign-lipid antigens (51). The genetic variation of CD1B correlated with biochemical recurrence in patients with localized prostate cancer (52). An increasing body of bioinformatics analyses has identified CD1B as prognostic biomarker in colon cancer and lung cancer (53–56). MATK has been found to phosphorylate and inhibit Src family kinases, and play an inhibitory role in cell growth and proliferation of T-cells (57). Colorectal cancer often exhibits epigenetic inactivation of CHK/MATK, which might promote proliferation and invasiveness through SFK-dependent and independent mechanisms (58). However, the role of FGD3, TMEM176A, CD1B and MATK in anti‐tumor immunity remains unclear.
Previous studies indicated that baseline infiltrating lymphocytes (TILs) could provide independent prognostic value in patients with TNBC in the absence of ICIs therapies or adjuvant chemotherapy (59, 60). A high number of TILs predicts favorable prognosis and pathological complete response in TNBC and HER2-enriched BC subtypes (61). TNBC patients with sparse or unresponsive tumor-infiltrating lymphocytes have limited efficacy of ICIs treatment (62). In the present study, patients with low IRS tended to have a higher infiltrating of CD8 T cells, activated NK cells and M1 Macrophages, which indicated that these patients had a better long-term survival than patients with high IRS and might be more suitable for ICI therapies. Regarding the effect of IRS on mutation burden in TNBC, we found that the low IRS subgroup had a lower mutation rate than the high IRS subgroup. The role of tumor mutation burden (TMB) in TNBC is controversial. The prevailing view is that high TMB patients exhibit a better survival outcome and higher immune cell infiltration than low TMB patients (63). However, some studies reported that TMB in TNBC showed no significant associations with immune cell infiltration (64, 65).
Further analysis revealed that our IRS was related to tumor size and disease stage, which indicated IRS could also serve as an indicator of tumor progression in TNBC. Finally, we verified the predictive value of the IRS model by IPS predictor. A low IRS could be suitable as an indicator for efficiency of immunotherapy in the TCGA-TNBC cohort, especially in those with PD-1 positive expression. Drug sensitivity analysis revealed that patients with high IRS were more sensitive to several targeted drugs or small molecule inhibitors. Thus, we hypothesized that TNBC patients with low IRS should receive immunotherapy, and patients with high IRS should not. To our knowledge, this is the first study to define the TNBC subtypes based on the ICGs expression pattern. However, a few limitations of this study must be acknowledged. Our molecular subtyping was constructed based on the expression of ICGs, and the differences and efficiency between ICGs subtypes and other TNBC subtypes should be compared in the future. Next, we defined a four-gene signature to predict the prognosis of TNBC. Additional clinicopathological parameters might need to be incorporated into our model in the follow-up studies. Also, the standardized TILs scoring in TNBC samples is also required to examine relations with our IRS model. Finally, prospective TNBC cohort and real-world TNBC series are clearly warranted to further examine our findings.
Conclusions
Our study systematically explored the ICGs expression patterns and defined ICGs-related subtypes in TNBC. In clinical application, we developed an ICGs-related riskscore IRS to stratify TNBC into high or low risk subgroups. Our IRS is a robust biomarker that can be used to evaluate the immune infiltration, survival outcomes, tumor progression and immunotherapy response. Our findings not only provide new insight into the subtype of TNBC but also deepen the understanding of ICGs in the tumor immune microenvironment.
Data availability statement
Publicly available datasets or databases were analyzed in the present study. This data can be found here: TCGA database (https://portal.gdc.cancer.gov) and cBioPortal database (http://www.cbioportal.org/).
Author contributions
XH and JZ were responsible for the research design. JZ, and HJ were responsible for data collection, analysis and writing the original draft. SP, QS and CH were responsible for manuscript revision and editing. All authors contributed to the article and approved the submitted version.
Funding
This work was supported by grants from Joint Funding for Artificial Intelligence in Medicine (MAI2022C003) and China Postdoctoral Science Foundation (2022M723048).
Acknowledgments
We are thankful for all research participants and clinicians involved in this research. We acknowledged TCGA database and cBioPortal database for providing their platforms and contributors for uploading their meaningful datasets.
Conflict of interest
The authors declare that the research was conducted in the absence of any commercial or financial relationships that could be construed as a potential conflict of interest.
Publisher’s note
All claims expressed in this article are solely those of the authors and do not necessarily represent those of their affiliated organizations, or those of the publisher, the editors and the reviewers. Any product that may be evaluated in this article, or claim that may be made by its manufacturer, is not guaranteed or endorsed by the publisher.
Supplementary material
The Supplementary Material for this article can be found online at: https://www.frontiersin.org/articles/10.3389/fimmu.2023.1073550/full#supplementary-material
Supplementary Figure 1 | Functional enrichment for ICG-related genes using GO annotation analysis.
Supplementary Figure 2 | Functional enrichment for ICG-related genes using KEGG annotation analysis.
Supplementary Figure 3 | Multivariable Cox-regression analysis adjusting for stage, IRS and the infiltration of immune cells.
Supplementary Figure 4 | Correlation analysis between ICGs-related riskscore and the level of M0 macrophages, M1 macrophages and M2 macrophages.
Supplementary Figure 5 | The relationship between CD8 T cells infiltration and IRS model genes by other immune-cell infiltration algorithms.
Supplementary Figure 6 | Correlation analysis between IRS and the stemness index DNAss and RNAss.
Supplementary Figure 7 | Drug sensitivity analysis in different IRS groups.
References
1. Sung H, Ferlay J, Siegel RL, Laversanne M, Soerjomataram I, Jemal A, et al. Global cancer statistics 2020: GLOBOCAN estimates of incidence and mortality worldwide for 36 cancers in 185 countries. CA: Cancer J Clin (2021) 71(3):209–49. doi: 10.3322/caac.21660
2. Huppert LA, Gumusay O, Rugo HS. Emerging treatment strategies for metastatic triple-negative breast cancer. Ther Adv Med Oncol (2022) 14:17588359221086916. doi: 10.1177/17588359221086916
3. Lehmann BD, Bauer JA, Chen X, Sanders ME, Chakravarthy AB, Shyr Y, et al. Identification of human triple-negative breast cancer subtypes and preclinical models for selection of targeted therapies. J Clin Invest (2011) 121(7):2750–67. doi: 10.1172/jci45014
4. Gruosso T, Gigoux M, Manem VSK, Bertos N, Zuo D, Perlitch I, et al. Spatially distinct tumor immune microenvironments stratify triple-negative breast cancers. J Clin Invest (2019) 129(4):1785–800. doi: 10.1172/jci96313
5. Song X, Zhou Z, Li H, Xue Y, Lu X, Bahar I, et al. Pharmacologic suppression of B7-H4 glycosylation restores antitumor immunity in immune-cold breast cancers. Cancer Discovery (2020) 10(12):1872–93. doi: 10.1158/2159-8290.cd-20-0402
6. Jiang YZ, Liu Y, Xiao Y, Hu X, Jiang L, Zuo WJ, et al. Molecular subtyping and genomic profiling expand precision medicine in refractory metastatic triple-negative breast cancer: the FUTURE trial. Cell Res (2021) 31(2):178–86. doi: 10.1038/s41422-020-0375-9
7. Wu SY, Xu Y, Chen L, Fan L, Ma XY, Zhao S, et al. Combined angiogenesis and PD-1 inhibition for immunomodulatory TNBC: concept exploration and biomarker analysis in the FUTURE-C-Plus trial. Mol Cancer (2022) 21(1):84. doi: 10.1186/s12943-022-01536-6
8. Derakhshan F, Reis-Filho JS. Pathogenesis of triple-negative breast cancer. Annu Rev Pathol (2022) 17:181–204. doi: 10.1146/annurev-pathol-042420-093238
9. Bianchini G, De Angelis C, Licata L, Gianni L. Treatment landscape of triple-negative breast cancer - expanded options, evolving needs. Nat Rev Clin Oncol (2022) 19(2):91–113. doi: 10.1038/s41571-021-00565-2
10. Wang F, Cheng F, Zheng F. Stem cell like memory T cells: A new paradigm in cancer immunotherapy. Clin Immunol (Orlando Fla) (2022) 241:109078. doi: 10.1016/j.clim.2022.109078
11. Li H, Yang W, Zhang M, He T, Zhou F, GH J, et al. Methylation of TMEM176A, a key ERK signaling regulator, is a novel synthetic lethality marker of ATM inhibitors in human lung cancer. Epigenomics (2021) 13(17):1403–19. doi: 10.2217/epi-2021-0217
12. Schmid P, Adams S, Rugo HS, Schneeweiss A, Barrios CH, Iwata H, et al. Atezolizumab and nab-paclitaxel in advanced triple-negative breast cancer. New Engl J Med (2018) 379(22):2108–21. doi: 10.1056/NEJMoa1809615
13. Schmid P, Cortes J, Pusztai L, McArthur H, Kümmel S, Bergh J, et al. Pembrolizumab for early triple-negative breast cancer. New Engl J Med (2020) 382(9):810–21. doi: 10.1056/NEJMoa1910549
14. Nakhjavani M, Shigdar S. Future of PD-1/PD-L1 axis modulation for the treatment of triple-negative breast cancer. Pharmacol Res (2022) 175:106019. doi: 10.1016/j.phrs.2021.106019
15. Guirgis HM. The impact of PD-L1 on survival and value of the immune check point inhibitors in non-small-cell lung cancer; proposal, policies and perspective. J immunotherapy Cancer (2018) 6(1):15. doi: 10.1186/s40425-018-0320-3
16. Gaikwad S, Agrawal MY, Kaushik I, Ramachandran S, Srivastava SK. Immune checkpoint proteins: Signaling mechanisms and molecular interactions in cancer immunotherapy. Semin Cancer Biol (2022) 86:137–50. doi: 10.1016/j.semcancer.2022.03.014
17. Jenkins L, Jungwirth U, Avgustinova A, Iravani M, Mills AP, Haider S, et al. Cancer-associated fibroblasts suppress CD8+ T cell infiltration and confer resistance to immune checkpoint blockade. Cancer Res (2022) 82(16):2904–17. doi: 10.1158/0008-5472.can-21-4141
18. Zhang J, Han X, Lin L, Chen J, Wang F, Ding Q, et al. Unraveling the expression patterns of immune checkpoints identifies new subtypes and emerging therapeutic indicators in lung adenocarcinoma. Oxid Med Cell Longevity (2022) 2022:3583985. doi: 10.1155/2022/3583985
19. Zhen Z, Shen Z, Sun P. Dissecting the role of immune checkpoint regulation patterns in tumor microenvironment and prognosis of gastric cancer. Front Genet (2022) 13:853648. doi: 10.3389/fgene.2022.853648
20. Curtis C, Shah SP, Chin SF, Turashvili G, Rueda OM, Dunning MJ, et al. The genomic and transcriptomic architecture of 2,000 breast tumours reveals novel subgroups. Nature (2012) 486(7403):346–52. doi: 10.1038/nature10983
21. Hu FF, Liu CJ, Liu LL, Zhang Q, Guo AY. Expression profile of immune checkpoint genes and their roles in predicting immunotherapy response. Briefings Bioinf (2021) 22(3). doi: 10.1093/bib/bbaa176
22. Cerami E, Gao J, Dogrusoz U, Gross BE, Sumer SO, Aksoy BA, et al. The cBio cancer genomics portal: an open platform for exploring multidimensional cancer genomics data. Cancer Discovery (2012) 2(5):401–4. doi: 10.1158/2159-8290.cd-12-0095
23. Wilkerson MD, Hayes DN. ConsensusClusterPlus: a class discovery tool with confidence assessments and item tracking. Bioinf (Oxford England) (2010) 26(12):1572–3. doi: 10.1093/bioinformatics/btq170
24. Hänzelmann S, Castelo R, Guinney J. GSVA: gene set variation analysis for microarray and RNA-seq data. BMC Bioinf (2013) 14:7. doi: 10.1186/1471-2105-14-7
25. Yu G. Gene ontology semantic similarity analysis using GOSemSim. Methods Mol Biol (Clifton NJ) (2020) 2117:207–15. doi: 10.1007/978-1-0716-0301-7_11
26. Yu G, Wang LG, Han Y, He QY. clusterProfiler: an r package for comparing biological themes among gene clusters. Omics J Integr Biol (2012) 16(5):284–7. doi: 10.1089/omi.2011.0118
27. Heagerty PJ, Lumley T, Pepe MS. Time-dependent ROC curves for censored survival data and a diagnostic marker. Biometrics (2000) 56(2):337–44. doi: 10.1111/j.0006-341x.2000.00337.x
28. Iasonos A, Schrag D, Raj GV, Panageas KS. How to build and interpret a nomogram for cancer prognosis. J Clin Oncol Off J Am Soc Clin Oncol (2008) 26(8):1364–70. doi: 10.1200/jco.2007.12.9791
29. Newman AM, Liu CL, Green MR, Gentles AJ, Feng W, Xu Y, et al. Robust enumeration of cell subsets from tissue expression profiles. Nat Methods (2015) 12(5):453–7. doi: 10.1038/nmeth.3337
30. Yoshihara K, Shahmoradgoli M, Martínez E, Vegesna R, Kim H, Torres-Garcia W, et al. Inferring tumour purity and stromal and immune cell admixture from expression data. Nat Commun (2013) 4:2612. doi: 10.1038/ncomms3612
31. Li T, Fu J, Zeng Z, Cohen D, Li J, Chen Q, et al. TIMER2.0 for analysis of tumor-infiltrating immune cells. Nucleic Acids Res (2020) 48(W1):W509–w14. doi: 10.1093/nar/gkaa407
32. Malta TM, Sokolov A, Gentles AJ, Burzykowski T, Poisson L, Weinstein JN, et al. Machine learning identifies stemness features associated with oncogenic dedifferentiation. Cell (2018) 173(2):338–54.e15. doi: 10.1016/j.cell.2018.03.034
33. Charoentong P, Finotello F, Angelova M, Mayer C, Efremova M, Rieder D, et al. Pan-cancer immunogenomic analyses reveal genotype-immunophenotype relationships and predictors of response to checkpoint blockade. Cell Rep (2017) 18(1):248–62. doi: 10.1016/j.celrep.2016.12.019
34. Geeleher P, Cox N, Huang RS. pRRophetic: an r package for prediction of clinical chemotherapeutic response from tumor gene expression levels. PloS One (2014) 9(9):e107468. doi: 10.1371/journal.pone.0107468
35. Zou W, Chen L. Inhibitory B7-family molecules in the tumour microenvironment. Nat Rev Immunol (2008) 8(6):467–77. doi: 10.1038/nri2326
36. Chang JY, Verma V, Welsh JW, Formenti SC. Radiotherapy plus immune checkpoint blockade in PD(L)-1-resistant metastatic NSCLC. Lancet Oncol (2022) 23(4):e156. doi: 10.1016/s1470-2045(22)00134-6
37. Hoch T, Schulz D, Eling N, Gómez JM, Levesque MP, Bodenmiller B. Multiplexed imaging mass cytometry of the chemokine milieus in melanoma characterizes features of the response to immunotherapy. Sci Immunol (2022) 7(70):eabk1692. doi: 10.1126/sciimmunol.abk1692
38. Kikuchi H, Matsui A, Morita S, Amoozgar Z, Inoue K, Ruan Z, et al. Increased CD8+ T-cell infiltration and efficacy for multikinase inhibitors after PD-1 blockade in hepatocellular carcinoma. J Natl Cancer Institute (2022) 114(9):1301–5. doi: 10.1093/jnci/djac051
39. Kim HR, Park HJ, Son J, Lee JG, Chung KY, Cho NH, et al. Tumor microenvironment dictates regulatory T cell phenotype: Upregulated immune checkpoints reinforce suppressive function. J immunotherapy Cancer (2019) 7(1):339. doi: 10.1186/s40425-019-0785-8
40. Gentles AJ, Newman AM, Liu CL, Bratman SV, Feng W, Kim D, et al. The prognostic landscape of genes and infiltrating immune cells across human cancers. Nat Med (2015) 21(8):938–45. doi: 10.1038/nm.3909
41. Jiang YZ, Ma D, Suo C, Shi J, Xue M, Hu X, et al. Genomic and transcriptomic landscape of triple-negative breast cancers: Subtypes and treatment strategies. Cancer Cell (2019) 35(3):428–40.e5. doi: 10.1016/j.ccell.2019.02.001
42. Cardoso F, Kyriakides S, Ohno S, Penault-Llorca F, Poortmans P, Rubio IT, et al. Early breast cancer: ESMO clinical practice guidelines for diagnosis, treatment and follow-up†. Ann Oncol Off J Eur Soc Med Oncol (2019) 30(8):1194–220. doi: 10.1093/annonc/mdz173
43. Loi S, Sirtaine N, Piette F, Salgado R, Viale G, Van Eenoo F, et al. Prognostic and predictive value of tumor-infiltrating lymphocytes in a phase III randomized adjuvant breast cancer trial in node-positive breast cancer comparing the addition of docetaxel to doxorubicin with doxorubicin-based chemotherapy: BIG 02-98. J Clin Oncol Off J Am Soc Clin Oncol (2013) 31(7):860–7. doi: 10.1200/jco.2011.41.0902
44. Yang B, Chou J, Tao Y, Wu D, Wu X, Li X, et al. An assessment of prognostic immunity markers in breast cancer. NPJ Breast Cancer (2018) 4:35. doi: 10.1038/s41523-018-0088-0
45. Hayakawa M, Matsushima M, Hagiwara H, Oshima T, Fujino T, Ando K, et al. Novel insights into FGD3, a putative GEF for Cdc42, that undergoes SCF(FWD1/beta-TrCP)-mediated proteasomal degradation analogous to that of its homologue FGD1 but regulates cell morphology and motility differently from FGD1. Genes to Cells devoted to Mol Cell Mech (2008) 13(4):329–42. doi: 10.1111/j.1365-2443.2008.01168.x
46. Guo F, Cheng X, Jing B, Wu H, Jin X. FGD3 binds with HSF4 to suppress p65 expression and inhibit pancreatic cancer progression. Oncogene (2022) 41(6):838–51. doi: 10.1038/s41388-021-02140-6
47. Renda I, Bianchi S, Vezzosi V, Nori J, Vanzi E, Tavella K, et al. Expression of FGD3 gene as prognostic factor in young breast cancer patients. Sci Rep (2019) 9(1):15204. doi: 10.1038/s41598-019-51766-w
48. Cuajungco MP, Podevin W, Valluri VK, Bui Q, Nguyen VH, Taylor K. Abnormal accumulation of human transmembrane (TMEM)-176A and 176B proteins is associated with cancer pathology. Acta histochemica (2012) 114(7):705–12. doi: 10.1016/j.acthis.2011.12.006
49. Wang Y, Han KJ, Pang XW, Vaughan HA, Qu W, Dong XY, et al. Large Scale identification of human hepatocellular carcinoma-associated antigens by autoantibodies. J Immunol (Baltimore Md 1950) (2002) 169(2):1102–9. doi: 10.4049/jimmunol.169.2.1102
50. Li H, Zhang M, Linghu E, Zhou F, Herman JG, Hu L, et al. Epigenetic silencing of TMEM176A activates ERK signaling in human hepatocellular carcinoma. Clin Epigenet (2018) 10(1):137. doi: 10.1186/s13148-018-0570-4
51. Beckman EM, Porcelli SA, Morita CT, Behar SM, Furlong ST, Brenner MB. Recognition of a lipid antigen by CD1-restricted alpha beta+ T cells. Nature (1994) 372(6507):691–4. doi: 10.1038/372691a0
52. Lee CH, Chen LC, Yu CC, Lin WH, Lin VC, Huang CY, et al. Prognostic value of CD1B in localised prostate cancer. Int J Environ Res Public Health (2019) 16(23):4723. doi: 10.3390/ijerph16234723
53. Chen W, Huang J, Xiong J, Fu P, Chen C, Liu Y, et al. Identification of a tumor microenvironment-related gene signature indicative of disease prognosis and treatment response in colon cancer. Oxid Med Cell Longevity (2021) 2021:6290261. doi: 10.1155/2021/6290261
54. Li N, Li Y, Zheng P, Zhan X. Cancer stemness-based prognostic immune-related gene signatures in lung adenocarcinoma and lung squamous cell carcinoma. Front Endocrinol (2021) 12:755805. doi: 10.3389/fendo.2021.755805
55. Yuan J, Yuan B, Zeng L, Liu B, Chen Y, Meng X, et al. Identification and validation of tumor microenvironment-related genes of prognostic value in lung adenocarcinoma. Oncol Lett (2020) 20(2):1772–80. doi: 10.3892/ol.2020.11735
56. Zhang H, Qin C, Gan H, Guo X, Zhang L. Construction of an immunogenomic risk score for prognostication in colon cancer. Front Genet (2020) 11:499. doi: 10.3389/fgene.2020.00499
57. Lee BC, Avraham S, Imamoto A, Avraham HK. Identification of the nonreceptor tyrosine kinase MATK/CHK as an essential regulator of immune cells using Matk/CHK-deficient mice. Blood (2006) 108(3):904–7. doi: 10.1182/blood-2005-12-4885
58. Chüeh AC, Advani G, Foroutan M, Smith J, Ng N, Nandurkar H, et al. CSK-homologous kinase (CHK/MATK) is a potential colorectal cancer tumour suppressor gene epigenetically silenced by promoter methylation. Oncogene (2021) 40(17):3015–29. doi: 10.1038/s41388-021-01755-z
59. Park JH, Jonas SF, Bataillon G, Criscitiello C, Salgado R, Loi S, et al. Prognostic value of tumor-infiltrating lymphocytes in patients with early-stage triple-negative breast cancers (TNBC) who did not receive adjuvant chemotherapy. Ann Oncol Off J Eur Soc Med Oncol (2019) 30(12):1941–9. doi: 10.1093/annonc/mdz395
60. Tomioka N, Azuma M, Ikarashi M, Yamamoto M, Sato M, Watanabe KI, et al. The therapeutic candidate for immune checkpoint inhibitors elucidated by the status of tumor-infiltrating lymphocytes (TILs) and programmed death ligand 1 (PD-L1) expression in triple negative breast cancer (TNBC). Breast Cancer (Tokyo Japan) (2018) 25(1):34–42. doi: 10.1007/s12282-017-0781-0
61. Gao ZH, Li CX, Liu M, Jiang JY. Predictive and prognostic role of tumour-infiltrating lymphocytes in breast cancer patients with different molecular subtypes: a meta-analysis. BMC Cancer (2020) 20(1):1150. doi: 10.1186/s12885-020-07654-y
62. Zimmerli D, Brambillasca CS, Talens F, Bhin J, Linstra R, Romanens L, et al. MYC promotes immune-suppression in triple-negative breast cancer via inhibition of interferon signaling. Nat Commun (2022) 13(1):6579. doi: 10.1038/s41467-022-34000-6
63. Gao C, Li H, Liu C, Xu X, Zhuang J, Zhou C, et al. Tumor mutation burden and immune invasion characteristics in triple negative breast cancer: Genome high-throughput data analysis. Front Immunol (2021) 12:650491. doi: 10.3389/fimmu.2021.650491
64. Cheng J, Ding X, Xu S, Zhu B, Jia Q. Gene expression profiling identified TP53(Mut)PIK3CA(Wild) as a potential biomarker for patients with triple-negative breast cancer treated with immune checkpoint inhibitors. Oncol Lett (2020) 19(4):2817–24. doi: 10.3892/ol.2020.11381
Keywords: triple-negative breast cancer, immune checkpoint genes, molecular subtypes, prognosis, nomogram
Citation: Zhang J, Jin H, Pan S, Han C, Sun Q and Han X (2023) Immune checkpoints expression patterns in early-stage triple-negative breast cancer predict prognosis and remodel the tumor immune microenvironment. Front. Immunol. 14:1073550. doi: 10.3389/fimmu.2023.1073550
Received: 18 October 2022; Accepted: 16 January 2023;
Published: 06 February 2023.
Edited by:
Julie Decock, Qatar Biomedical Research Institute, QatarReviewed by:
Daniel Carvajal, Universidad del Desarrollo, ChileBalazs Acs, Karolinska Institutet (KI), Sweden
Copyright © 2023 Zhang, Jin, Pan, Han, Sun and Han. This is an open-access article distributed under the terms of the Creative Commons Attribution License (CC BY). The use, distribution or reproduction in other forums is permitted, provided the original author(s) and the copyright owner(s) are credited and that the original publication in this journal is cited, in accordance with accepted academic practice. No use, distribution or reproduction is permitted which does not comply with these terms.
*Correspondence: Xinghua Han, hxhmail@ustc.edu.cn
†These authors have contributed equally to this work
‡ORCID: Xinghua Han, orcid.org/0000-0002-0632-69552