 Kathryn A. Wierenga
 Frank M. Riemers
 Bart Westendorp
 Jack R. Harkema
 James J. Pestka
- 1Department of Biochemistry and Molecular Biology, Michigan State University, Lansing, MI, United States
- 2Institute for Integrative Toxicology, Michigan State University, Lansing, MI, United States
- 3Department of Biomolecular Health Sciences, Faculty of Veterinary Medicine, Utrecht University, Utrecht, Netherlands
- 4Department of Pathobiology and Diagnostic Investigation, Michigan State University, Lansing, MI, United States
- 5Department of Microbiology and Molecular Genetics, Michigan State University, Lansing, MI, United States
- 6Department of Food Science and Human Nutrition, Michigan State University, Lansing, MI, United States
Preclinical and clinical studies suggest that consumption of long chain omega-3 polyunsaturated fatty acids (PUFAs) reduces severity of chronic inflammatory and autoimmune diseases. While these ameliorative effects are conventionally associated with downregulated expression of proinflammatory cytokine and chemokine genes, our laboratory has recently identified Type 1 interferon (IFN1)-regulated gene expression to be another key target of omega-3 PUFAs. Here we used single cell RNA sequencing (scRNAseq) to gain new mechanistic perspectives on how the omega-3 PUFA docosahexaenoic acid (DHA) influences TLR4-driven proinflammatory and IFN1-regulated gene expression in a novel self-renewing murine fetal liver-derived macrophage (FLM) model. FLMs were cultured with 25 µM DHA or vehicle for 24 h, treated with modest concentration of LPS (20 ng/ml) for 1 and 4 h, and then subjected to scRNAseq using the 10X Chromium System. At 0 h (i.e., in the absence of LPS), DHA increased expression of genes associated with the NRF2 antioxidant response (e.g. Sqstm1, Hmox1, Chchd10) and metal homeostasis (e.g.Mt1, Mt2, Ftl1, Fth1), both of which are consistent with DHA-induced polarization of FLMs to a more anti-inflammatory phenotype. At 1 h post-LPS treatment, DHA inhibited LPS-induced cholesterol synthesis genes (e.g. Scd1, Scd2, Pmvk, Cyp51, Hmgcs1, and Fdps) which potentially could contribute to interference with TLR4-mediated inflammatory signaling. At 4 h post-LPS treatment, LPS-treated FLMs reflected a more robust inflammatory response including upregulation of proinflammatory cytokine (e.g. Il1a, Il1b, Tnf) and chemokine (e.g.Ccl2, Ccl3, Ccl4, Ccl7) genes as well as IFN1-regulated genes (e.g. Irf7, Mx1, Oasl1, Ifit1), many of which were suppressed by DHA. Using single-cell regulatory network inference and clustering (SCENIC) to identify gene expression networks, we found DHA modestly downregulated LPS-induced expression of NF-κB-target genes. Importantly, LPS induced a subset of FLMs simultaneously expressing NF-κB- and IRF7/STAT1/STAT2-target genes that were conspicuously absent in DHA-pretreated FLMs. Thus, DHA potently targeted both the NF-κB and the IFN1 responses. Altogether, scRNAseq generated a valuable dataset that provides new insights into multiple overlapping mechanisms by which DHA may transcriptionally or post-transcriptionally regulate LPS-induced proinflammatory and IFN1-driven responses in macrophages.
Introduction
Macrophages, a highly plastic innate myeloid immune cell population, can be polarized to a range of phenotypes that promote or resolve inflammation (1). Activation of toll-like receptors (TLRs) and cytokine receptors skews macrophages towards a more proinflammatory phenotype (e.g. “M1”) that is commonly observed in chronic inflammatory and autoimmune conditions, such as atherosclerosis (2), obesity (3), rheumatoid arthritis (4), and lupus (5). Contrastingly, skewing macrophages toward a proresolving phenotypes (e.g. “M2”) can initiate repair of damaged tissue, phagocytose and clear dead cells, and suppress the inflammatory response (1). Thus, interventions that suppress macrophage activation or promote their proresolving effects may be able to alleviate chronic inflammation and autoimmune diseases.
Pathogen-derived stimuli are frequently used to activate immune cells to investigate their inflammatory response in vitro and in vivo. Bacterial lipopolysaccharide (LPS), a prototypical pathogen-derived inflammatory trigger, is a component of the gram-negative bacterial cell wall and a potent agonist for the pattern recognition receptor TLR4 in macrophages (6). TLR4 promotes classical activation to the M1 phenotype via multiple signaling pathways that involve MAP kinases, NF-κB, and interferon (IFN) response factors (IRF) that promote time-dependent upregulation of inflammation-linked genes (7, 8). Genes associated with transcriptional machinery are among the first induced because of TLR4 activation, followed by a large repertoire of proinflammatory cytokine, chemokine, and Type 1 interferon (IFN1)-regulated genes. In the absence of prolonged stimulation, TLR4-stimulated inflammation is modest and self-resolving. Thus, induced genes and their protein products peak at specific timepoints, followed by rapid degradation. However, in situations of prolonged and unresolved inflammation, many of these genes may remain elevated, contributing to pathophysiological effects (9, 10). Chronic inflammatory and autoimmune diseases often result from such aberrantly prolonged signaling, making it of paramount importance to identify ways to subdue proinflammatory and IFN1-regulated gene responses and/or hasten their resolution.
Preclinical and clinical studies reveal that dietary or pharmacological intervention with long chain omega-3 polyunsaturated fatty acids (PUFAs) such as docosahexaenoic acid (DHA) and eicosapentaenoic acid (EPA) ameliorate symptoms and reduce biomarkers in inflammatory diseases, including rheumatoid arthritis (11), cardiovascular disease (12, 13), and lupus (14, 15). In vivo, dietary supplementation with omega-3 PUFAs elevates their presence in the phospholipid membranes in individual tissues, red blood cells, and blood lipid pools. There are multiple macrophage-dependent mechanisms by which elevated omega-3 PUFAs may suppress inflammation and promote resolution [reviewed in (16)]. For example, increasing membrane omega-3 PUFAs can influence lipid raft formation, altering aggregation and activation of transmembrane receptors that initiate inflammatory signaling pathways. Another mechanism is interference with NF-κB signaling by intracellular activation of the transcription factor PPARγ or extracellular activation G-coupled protein receptor (GPCRs) such as GPR40 and GPR120. Finally, shifting the balance of lipid metabolites from pro-inflammatory omega-6-derived oxylipins to proresolving omega-3-derived oxylipins, such as the highly bioactive resolvins, maresins, and protectins, promotes an anti-inflammatory phenotype (17).
While investigations employing supplementation of macrophages in vitro with long chain omega-3 PUFAs have provided insight into how these dietary lipids influence inflammatory pathways (16, 18, 19), these mechanistic studies typically have relied on bulk mRNA analyses and often utilized cloned macrophage cell lines. The rationale for this investigation, was to address these limitations by employing single cell RNA sequencing (scRNAseq) in conjunction with a novel, self-renewing fetal liver-derived macrophage (FLM) model (20) to better understand how DHA influences LPS-triggered inflammation-related gene expression of individual macrophages. Our findings yield new perspectives into multiple overlapping mechanisms by which DHA may influence time-dependent TLR4-driven proinflammatory and IFN1-regulated gene responses in macrophages.
Methods
Animals and euthanasia
Experimental protocols were approved by the Institutional Animal Care and Use Committee at MSU (AUF #PROTO201800113). C57BL/6J mice (strain 000664) were obtained from The Jackson Laboratory (Bar Harbor, ME). Mice were given free access to food and water under controlled conditions (humidity: 40–55%; lighting: 12-h light/dark cycles; and temperature: 24 ± 2°C) (21). Mice were bred and livers were excised from murine fetuses at 14-18 gestational days (20). Dams were euthanized by CO2 inhalation for 10 min to ensure death to neonates, which are resistant to anoxia. Cervical dislocation was used as a secondary form of death for the dam. Fetuses were immediately removed, and loss of maternal blood supply served as a secondary form of death for the fetuses.
Generation and maintenance of FLM cultures
FLMs were generated and maintained using a modification of the method described by Fejer and coworkers (20). Briefly, fetal livers were dissociated into a single cell suspension in sterile phosphate buffered saline (PBS), filtered through a 70-micron filter, and centrifuged at 220 xg for 5 minutes. Cells were washed twice with sterile PBS, resuspended in modified Roswell Park Memorial Institute (mRPMI) Medium (Thermo Fisher) containing 10% fetal bovine serum (FBS, Thermo Fisher), 1% penicillin-streptomycin (P/S, Thermo Fisher) and 30 ng/mL murine granulocyte-monocyte colony stimulating factor (mGM-CSF, Peprotech), and plated in 10-cm treated culture dishes (1 liver/dish). The following day, half of the media was replaced with fresh mRPMI. Media was refreshed in this manner every 2 to 3 d, until an adherent monolayer was achieved within 1 to 2 wk. At this time, cells were either frozen for cryostorage or passaged for experiments. Initially, FLMs cultured under these conditions have an ovoid morphology and proliferate slowly, but after approximately 5 to 10 passages, cells become spindleloid and proliferate rapidly. FLMs used for experiments in this study were between passage 10 and 20.
For fatty acid incorporation studies, DHA (NuChek Prep, Elysian, MN) was prepared as a 3:1 complex with fatty-acid free bovine serum albumin (BSA, Millipore Sigma, Burlington, MA) (18, 22). Cells were then incubated for 24 h in serum-reduced mRPMI medium (0.25% FBS, 1% P/S, 30 ng/mL mGM-CSF) with 25 µM DHA + 8.3 µM BSA or with 8.3 µM BSA as vehicle. The serum concentration was reduced to maximize DHA’s incorporation into the phospholipid membrane by removing competing fatty acids present in serum.
For TLR4 stimulation, a stock solution of LPS (Salmonella enterica serotype typhimurium containing <1% protein impurities, Millipore Sigma) was prepared in sterile PBS. The solution was thoroughly vortexed and sonicated before use, and dilutions were prepared in serum-reduced mRPMI medium. Cells were stimulated with 20 ng/mL LPS, which was chosen based on a time course and dose response that showed sufficient expression of a few key inflammatory genes with this dose of LPS at 1 and 4 h (Figure S1).
Single cell isolation, library preparation, and sequencing
The overall experimental design for deriving scRNAseq samples is depicted in Figure 1A. Briefly, FLMs were seeded in 6-well plates at -48 h in complete media. At -24 h, media was changed to contain 25 μM DHA or vehicle (Veh, 8.3 μM BSA) and 0.25% FBS. At time 0 h (24 h after DHA supplementation), cells were treated with 20 ng/mL LPS. Treatment conditions were as follows: i) Con (control, collected at -24 h); ii) Veh.LPS.0 (treated with 8.3 μM BSA, collected at 0 h); iii) DHA.LPS.0 (treated with 25 μM DHA + 8.3 μM BSA, collected at 0 h); iv) Veh.LPS.1 (treated with 8.3 μM BSA, collected 1 h post-LPS); v) DHA.LPS.1 (treated with 25 μM DHA + 8.3 μM BSA, collected at 1 h post-LPS); vi) Veh.LPS.4 (treated with 8.3 μM BSA, collected 4 h post-LPS), and vii) DHA.LPS.4 (treated with 25 μM DHA + 8.3 μM BSA, collected at 4 h post-LPS). Sample start times were staggered to allow collection of all samples simultaneously, after the indicated treatment times. Cells were lifted from 6-well plates using Accutase® (Millipore Sigma) and washed twice with ice cold sterile PBS to remove residual enzyme. Cell viability immediately after lifting and prior to single cell isolation was assessed by Trypan Blue exclusion test. All treatment groups had a viability of >90%. Single cells were isolated and RNA libraries prepared using the 10x Chromium SingleCell 3′ RNAseq kit (v3 Chemistry, 10X Genomics), per the manufacturer’s instructions. Sample quality control was performed at the Michigan State University Genomics Core followed by sequencing at Novogene. Libraries were sequenced on an Illumina Novaseq using S4 chemistry, obtaining >100K reads/cell. Reads were demultiplexed and subsequently counted with the Cell Ranger v2.1.1 (23) mkfastq and count pipeline respectively.
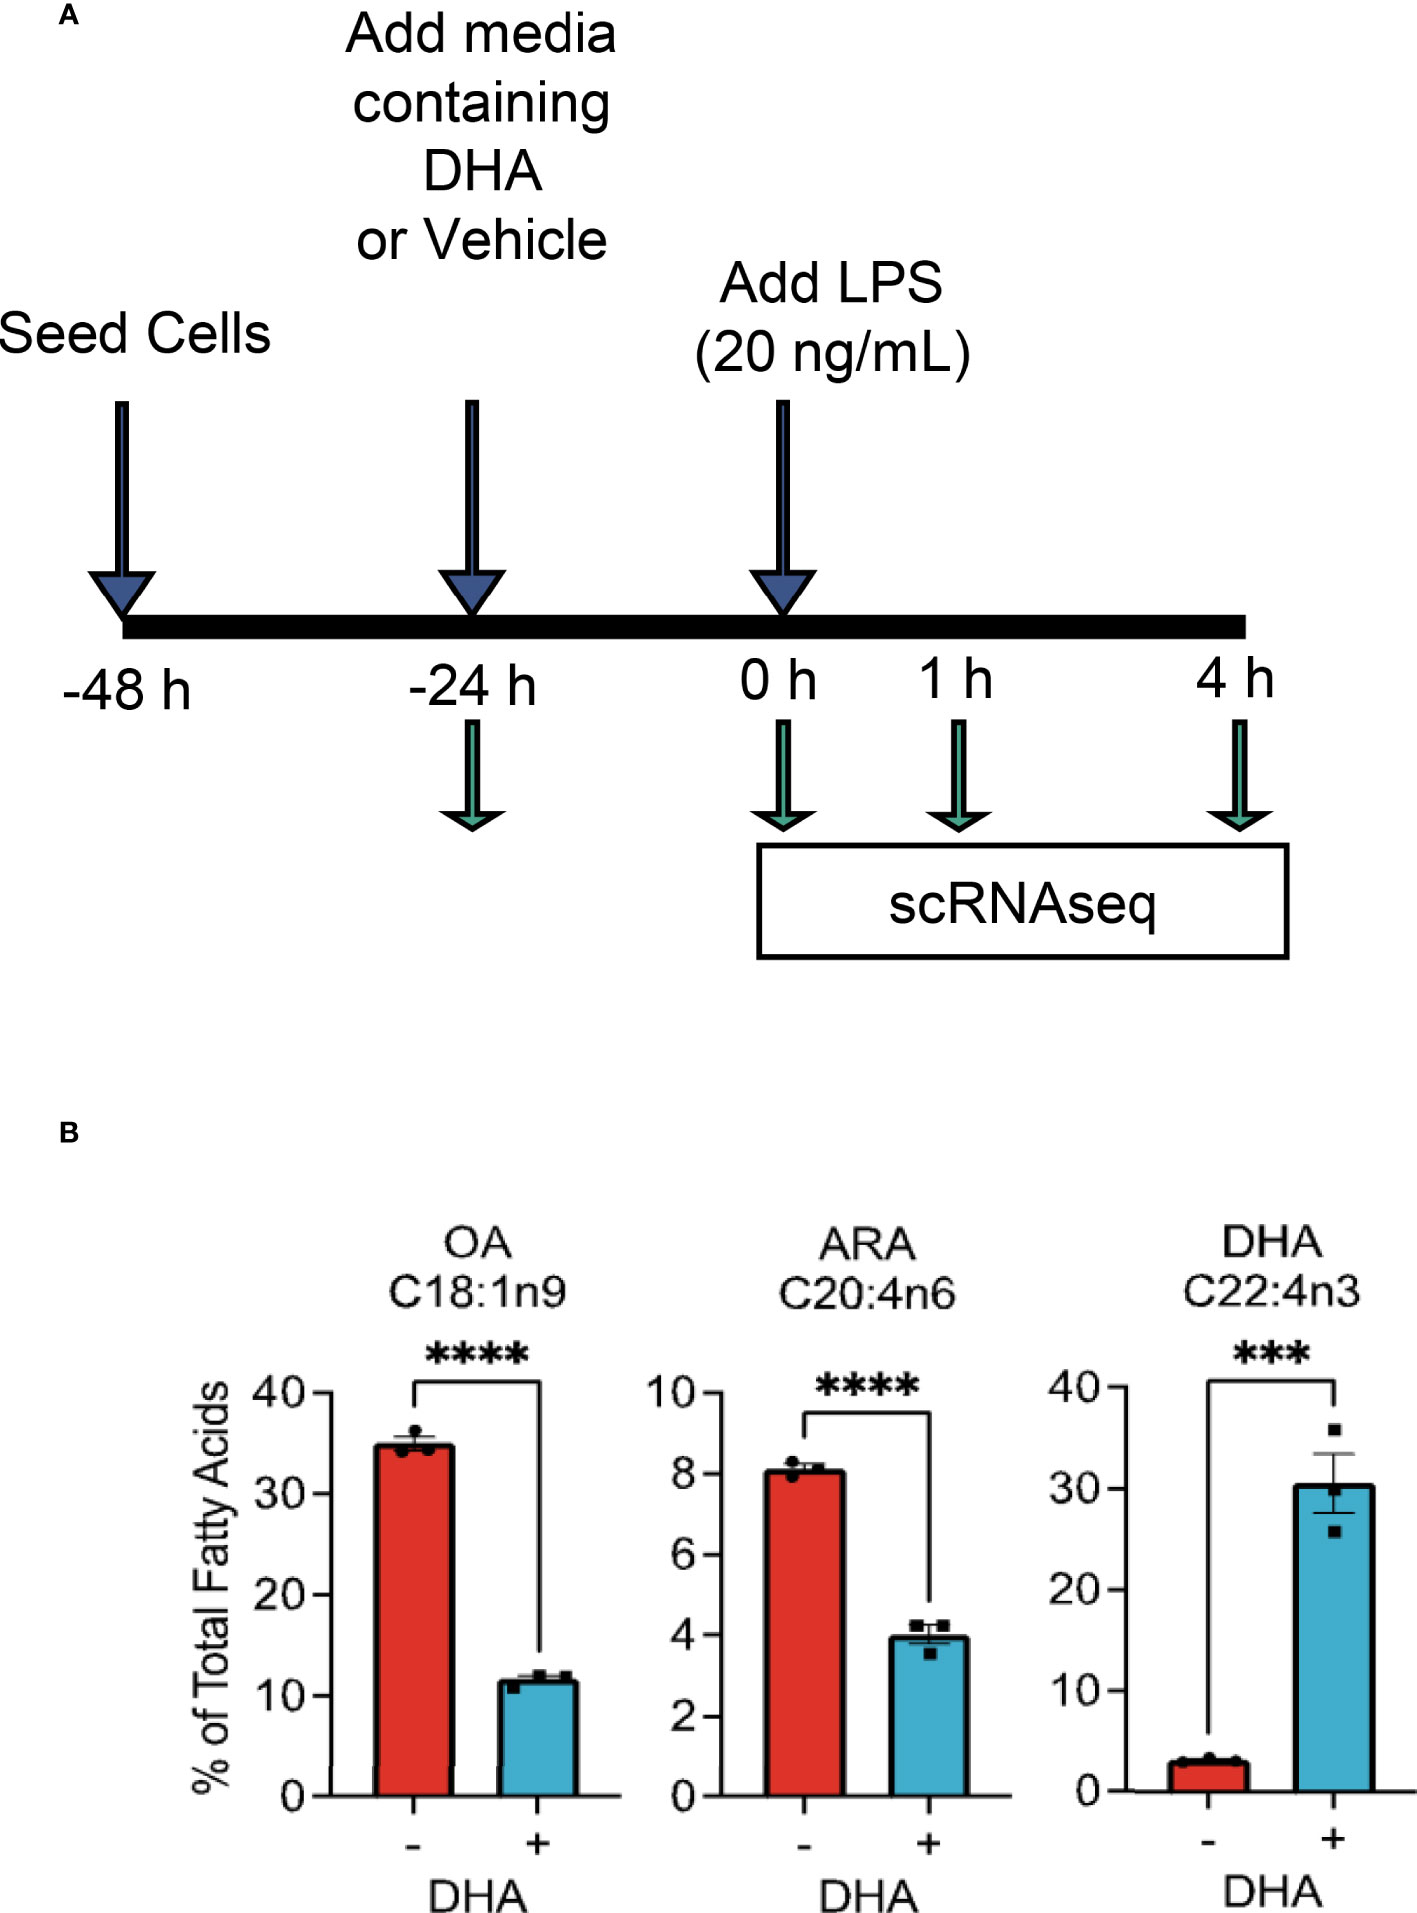
Figure 1 Experimental design for scRNAseq and DHA incorporation into FLMs. (A) FLMs were seeded in 6 well plates at -48 h in mRPMI medium containing 10% FBS. At -24h, medium was replaced with mRPMI containing 0.25% FBS with either DHA or Veh. At time 0 h (24h after DHA supplementation), cells were treated with 20 ng/mL LPS. Sample start times were staggered to allow collection of all samples simultaneously, after the indicated treatment times. (B) DHA supplementation results in increased DHA levels in the phospholipid membrane at the expense of oleic acid and arachidonic acid. Cells treated with DHA or Veh for 24 h were collected in methanol and analyzed by GC-FID at OmegaQuant LLC. Fatty acid levels expressed as a percent of all fatty acids measured. Asterisks indicate significant differences (****p<0.0001, ***p<0.001) between Veh (-) and DHA (+) treatment groups, as assessed by Student’s t-tests.
Seurat analysis
Data were analyzed further with Seurat package v3.1.1 (24) in RStudio-server v1.3.959-1 (25) using R v3.06 (26). After importing the raw counts they were filtered to remove low quality cells (Figures S2A, B). Only cells with fewer than 20% mitochondrial genes and over 20000 unique UMI reads mapping to at least 2000 unique genes were included. The remaining cells were then subjected to normalization with the Seurat SCTransform function. Subsequently, the dimensionality of the data was reduced using a Principal Component Analysis (PCA). Clusters were identified using the FindClusters function in Seurat, which were visualized using the Uniform Manifold Approximation and Projection (UMAP) technique.
SCENIC analysis
Single-cell regulatory network inference and clustering (SCENIC) was used to detect which transcription factor programs were most strongly affected by DHA in 4 h LPS-treated cells (27). Briefly, the SCENIC workflow consists of three steps: 1) the GENIE3 package is used to identify genes co-expressed with transcription factors, 2) the RcisTarget package is used to perform cis-regulatory motif analyses of co-expressed genes to identify potential binding targets for the transcription factor in question, and 3) the AUCell package is used to assign a score to each cell based on the activity of the regulon, which is the network of genes likely driven by an individual transcription factor.
Heatmaps
Heatmaps were generated using the pheatmap package in R Studio (28), based on scaled gene expression data or regulon AUC values for individual cells. Ward’s criteria were used as the clustering method. The “cutree_columns” function was used to break the heatmap into clusters. No scaling was applied as the input values were already scaled for individual cells and regulons.
Bulk qPCR
For confirmatory bulk PCR studies, cells were treated in 12-well plates with 25 μM DHA/8.3 μM BSA or Veh (8.3 μM BSA) for 24 h and 20 ng/mL LPS for 1 and 4 h. Approximately 5x10⁵ cells were collected for RNA extraction and gene expression analysis carried out as previously described (18, 29). Gene expression was calculated as the relative copy number (18, 30).
Western blotting
NF-κB Western blotting was carried out as reported previously (18). Briefly, whole cell lysates were isolated, with Halt™ Protease and Phosphatase inhibitors (Thermo Fisher) included in RIPA buffer (Thermo Fisher) during lysis. Nuclear and cytoplasmic extracts were prepared using a Nuclear Extract kit (Active Motif). Protein was quantified using a Pierce™ BCA protein assay (Thermo Fisher), after which all samples were adjusted to the same concentration. Samples were loaded in lanes of pre-cast 4-20% Mini-Protean TGX Protein Gels (Bio-Rad) and electrophoresis performed at 100V for 90 min in a BioRad mini-PROTEAN tetra vertical electrophoresis chamber. Proteins were transferred to a low fluorescence nitrocellulose membrane (Bio-Rad) using the Bio-Rad TransBlot Turbo System, per the manufacturer’s instructions. Antibody binding was performed using an iBind Flex apparatus per the manufacturer’s instructions. The following primary antibodies used at the indicated dilution: Rabbit anti-Actin (Cell Signaling Technologies, 1:4000), NF-κB (CST, 1:1000), phospho-NF-κB (CST, 1:1000), IκB (CST, 1:1000), phospho-IKB kinase (CST, 1:1000). The following Licor (Lincoln, Nebraska) near infrared fluorescent secondary antibodies were used: IRDye® 680LT (1:4000) and IRDye® 800CW (1:3000). Blots were read using a Licor Odyssey Imaging System.
Fatty acid analyses
To measure phospholipid fatty acid content, cell pellets were stored in 100% methanol at -80°C until analysis by gas chromatography (GC) with flame ionization detection at OmegaQuant, LLC. Cell pellets were transferred to screw-cap glass vials containing 1,2-ditricosanoyl-sn-glycero-3-phosphocholine (di-C23:0 PL) (Avanti Polar Lipids, USA) as an internal standard followed by a modified Folch extraction. A portion of the organic layer was spotted on a TLC plate developed with 8:2:0.15 (hexane:ethyl ether:acidic acid) to separate the lipid fractions. After the TLC plate was dry the phospholipid band was scrapped into a screw-cap glass vial with methanol containing 14% boron trifluoride (Sigma-Aldrich, St. Louis, MO). The vial was briefly vortexed and heated to 100˚C for 10 minutes. After cooling, HPLC grade water and hexane (EMD Chemicals, USA) were added sequentially, the tubes were recapped, vortexed and centrifuged promote phase separation. GC of the hexane layer was carried out using a GC2010 Gas Chromatograph (Shimadzu Corporation, Columbia, MD) equipped with a SP2560, 100-m fused silica capillary column (0.25 mm internal diameter, 0.2 μm film thickness; Supelco, Bellefonte, PA).
Fatty acids were identified by comparison with a standard mixture of fatty acids (GLC 782, NuCheck Prep) and an internal standard (C23:0 FAME, NuCheck Prep). The di-C23:0 PL was used to calculate recovery efficiency of the assay and applied to all fatty acids. The following 24 fatty acids (by class) were identified: saturated (14:0, 16:0, 18:0, 20:0, 22:0 24:0); cis monounsaturated (16:1, 18:1, 20:1, 24:1); trans (16:1, 18:1, 18:2), cis n-6 polyunsaturated (18:2, 18:3, 20:2, 20:3, 20:4, 22:4, 22:5); cis n-3 polyunsaturated (18:3, 20:5, 22:5, 22:6). Fatty acid composition was expressed as a percent of total identified fatty acids and concentrations as µg/vial of cell pellets.
Data visualization and statistics
Data were plotted in R Studio version 1.1.442 using ggplot2 (31) and in GraphPad Prism version 9.1.0 (San Diego, California, USA, www.graphpad.com). Non-parametric versions of statistical tests were used where appropriate, as noted in figure legends.
Results and discussion
DHA supplementation increases DHA in FLM membrane
We selected the dose of 25 µM DHA based on previous findings in RAW264.7 murine macrophages, where this dose effectively protected these cells from cell death and IL-1 cytokine release following NLRP3 inflammasome activation (18). This fatty acid supplementation protocol resulted in a 10-fold increase incorporation of DHA into the phospholipid fraction of FLMs at 0 h before LPS activation with concurrent reductions of oleic acid, a monounsaturated fatty acid, and arachidonic acid, an omega-6 PUFA (Figure 1B and Table 1). These results are consistent with our previous findings (18), suggesting similar incorporation efficiency in RAW264.7 macrophages and self-renewing FLMs.
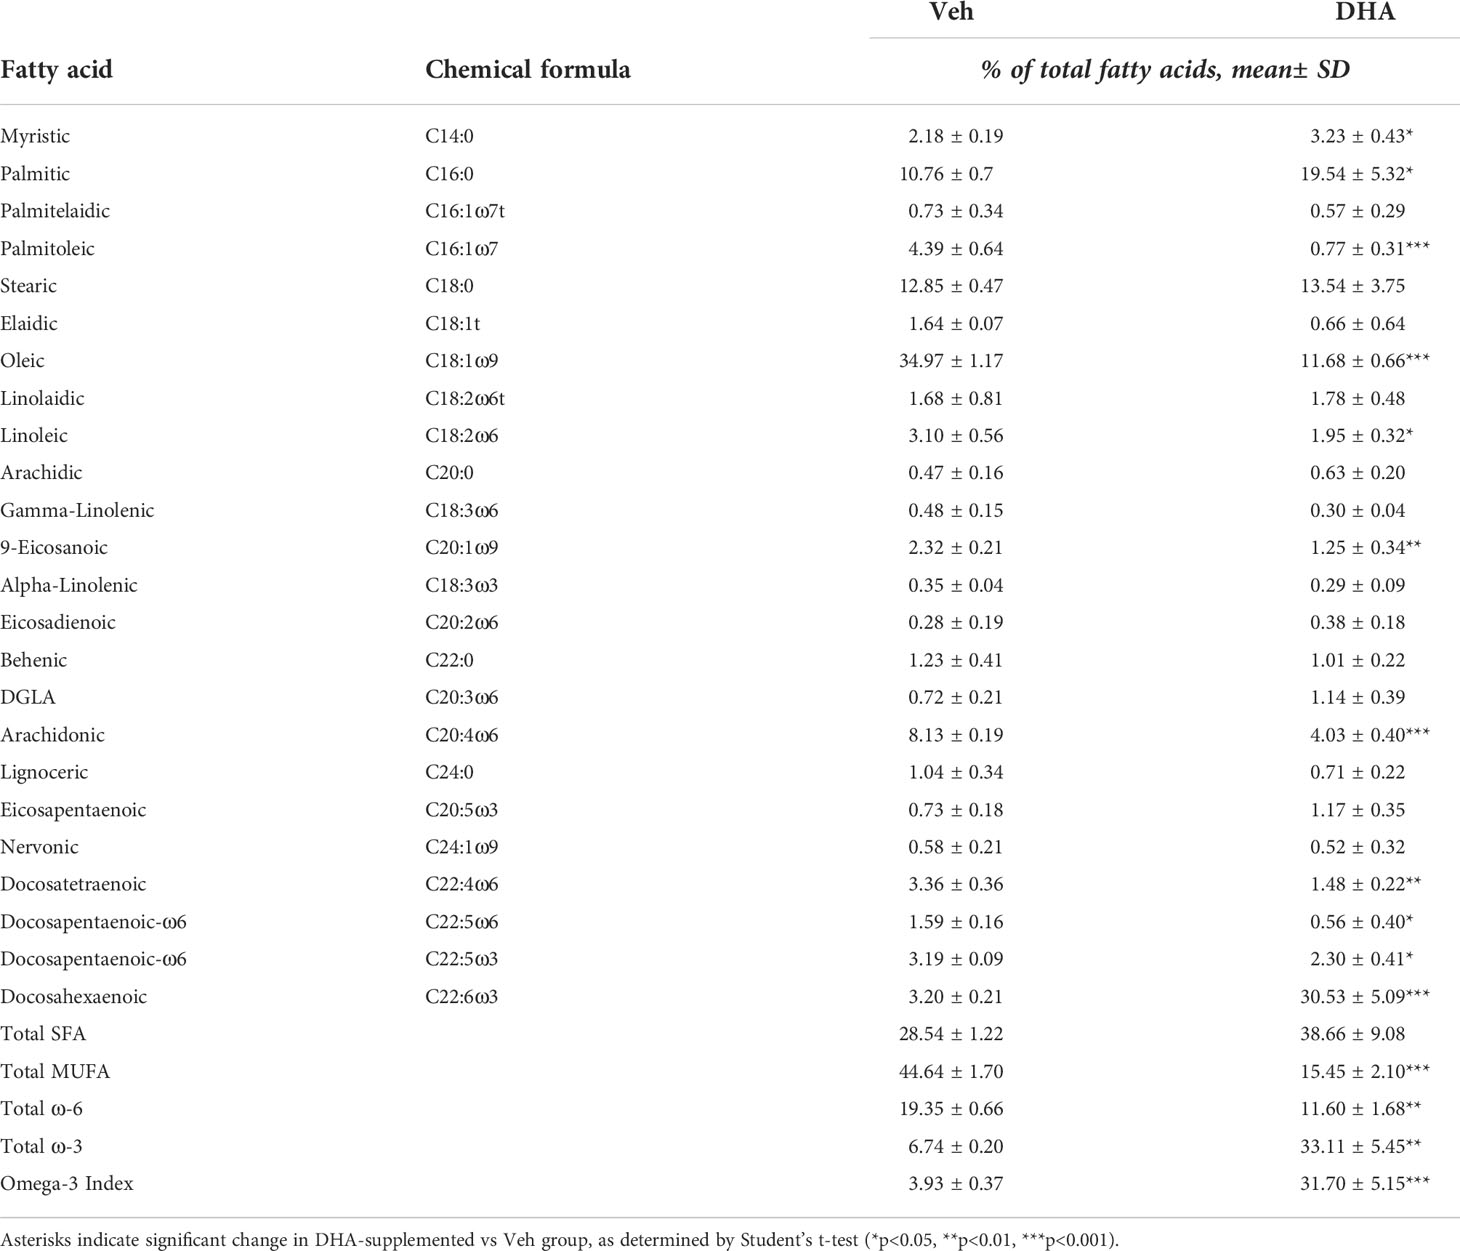
Table 1 Fatty acid composition of cells treated with Veh (BSA, 8.3 μM) or DHA-BSA complex (25 μM DHA, 8.3 μM BSA).
Clustering is driven by LPS treatment and cell cycle phase
Seurat identified ten distinct clusters of cells, which visually separated into four time-associated groups (Figure S3A) When individual cells were colored according to treatment group, it was evident that culturing for 24 h with reduced serum resulted in a separation from the control group at 0 h (Figure S3B). Cells treated with and without LPS for 1 or 4 h separated from one another in the UMAP projection. Veh- and DHA-treated cells clustered closely together. Hence, serum reduction and LPS treatment had a greater effect on the gene expression profile than DHA supplementation. Within each of the four main clusters, cells separated based on cell cycle phase, as assigned using the Seurat CellCycleScoring tool (Figure S3C).
Due to the robust transcriptional differences resulting from serum reduction and from cell cycle phase, we chose to create a new Seurat object including only FLMs cultured with reduced serum and where cell cycle genes were regressed out (Figure 2A). Cells still clustered based on cell cycle phase, but to a lesser extent than in the original Seurat object (Figure 2B). The number of cycling cells was reduced with DHA treatment in the absence of LPS and in the 1 h LPS treatment group. Treatment with LPS for 4 h substantially reduced the number of cycling cells (Figure 2C).
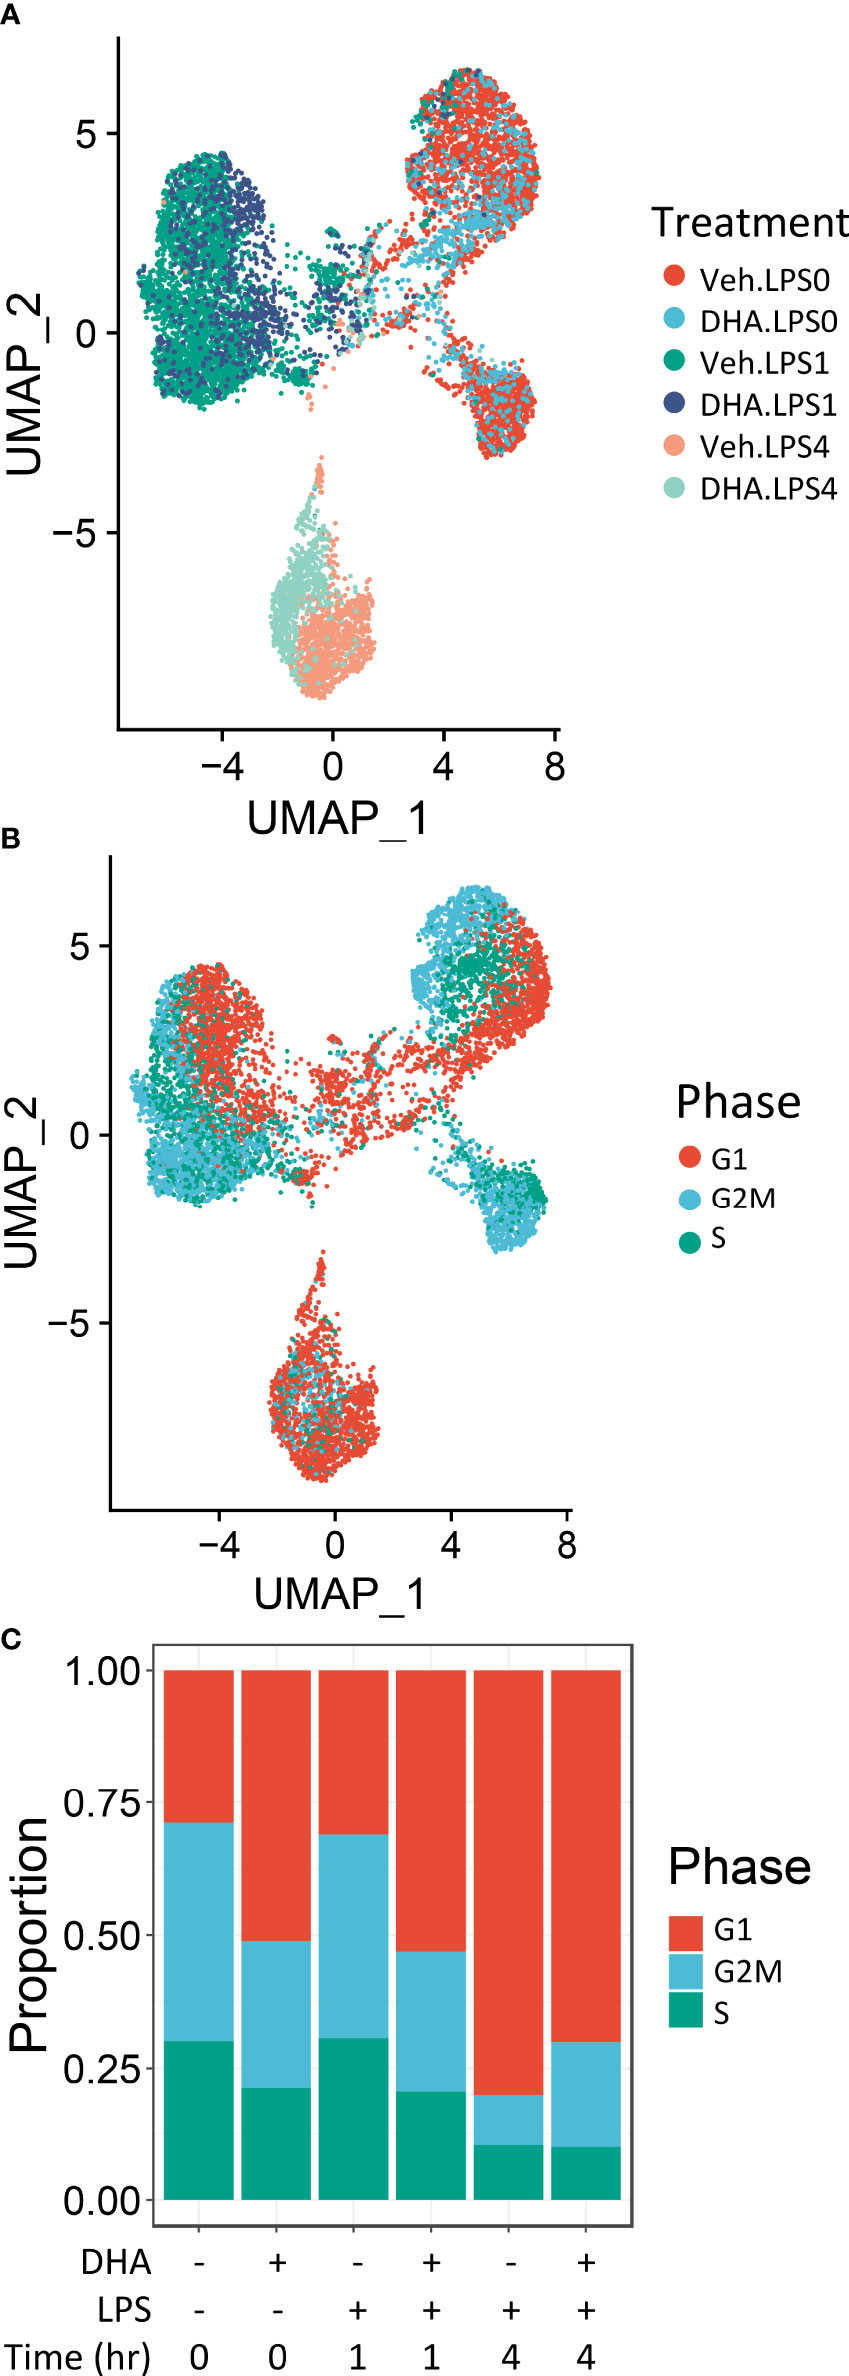
Figure 2 Cells cluster according to the presence and duration of LPS treatment. (A) Uniform manifold approximation and projection (UMAP) clustering revealed 3 distinct clusters of cells representing cells that received no LPS treatment cells treated for 1 h, and cells treated for 4h. (B) Distinct subclusters are present for cells in the G1, S and G2 phases of the cell cycle, as identified by Seurat CellCycleScoring function. (C) Treatment with DHA and with LPS influence the proportion of cells in each phase of the cell cycle.
FLMs retain macrophage-specific phenotype
Sequencing data confirmed expression of macrophage-identifying genes in most cells in all clusters indicating that the FLM model maintained a macrophage-specific phenotype (Figure 3). Highly prominent was lineage-determining transcription factor PU.1 (Spi1), which is critical in macrophage and monocyte development (32). PU.1 is considered to be a pioneer transcription factor that binds to closed chromatin and prime promoter-distal enhancers. Other macrophage-defining genes that were similarly expressed strongly across all clusters included Itgam, Fcer1g, Tyrobp, Cd68, and Cd14 (33–35). The demonstration that macrophage-identifying genes are present in most cells across all time and treatment clusters supports the contention that self-renewing FLMs are a robust macrophage model.
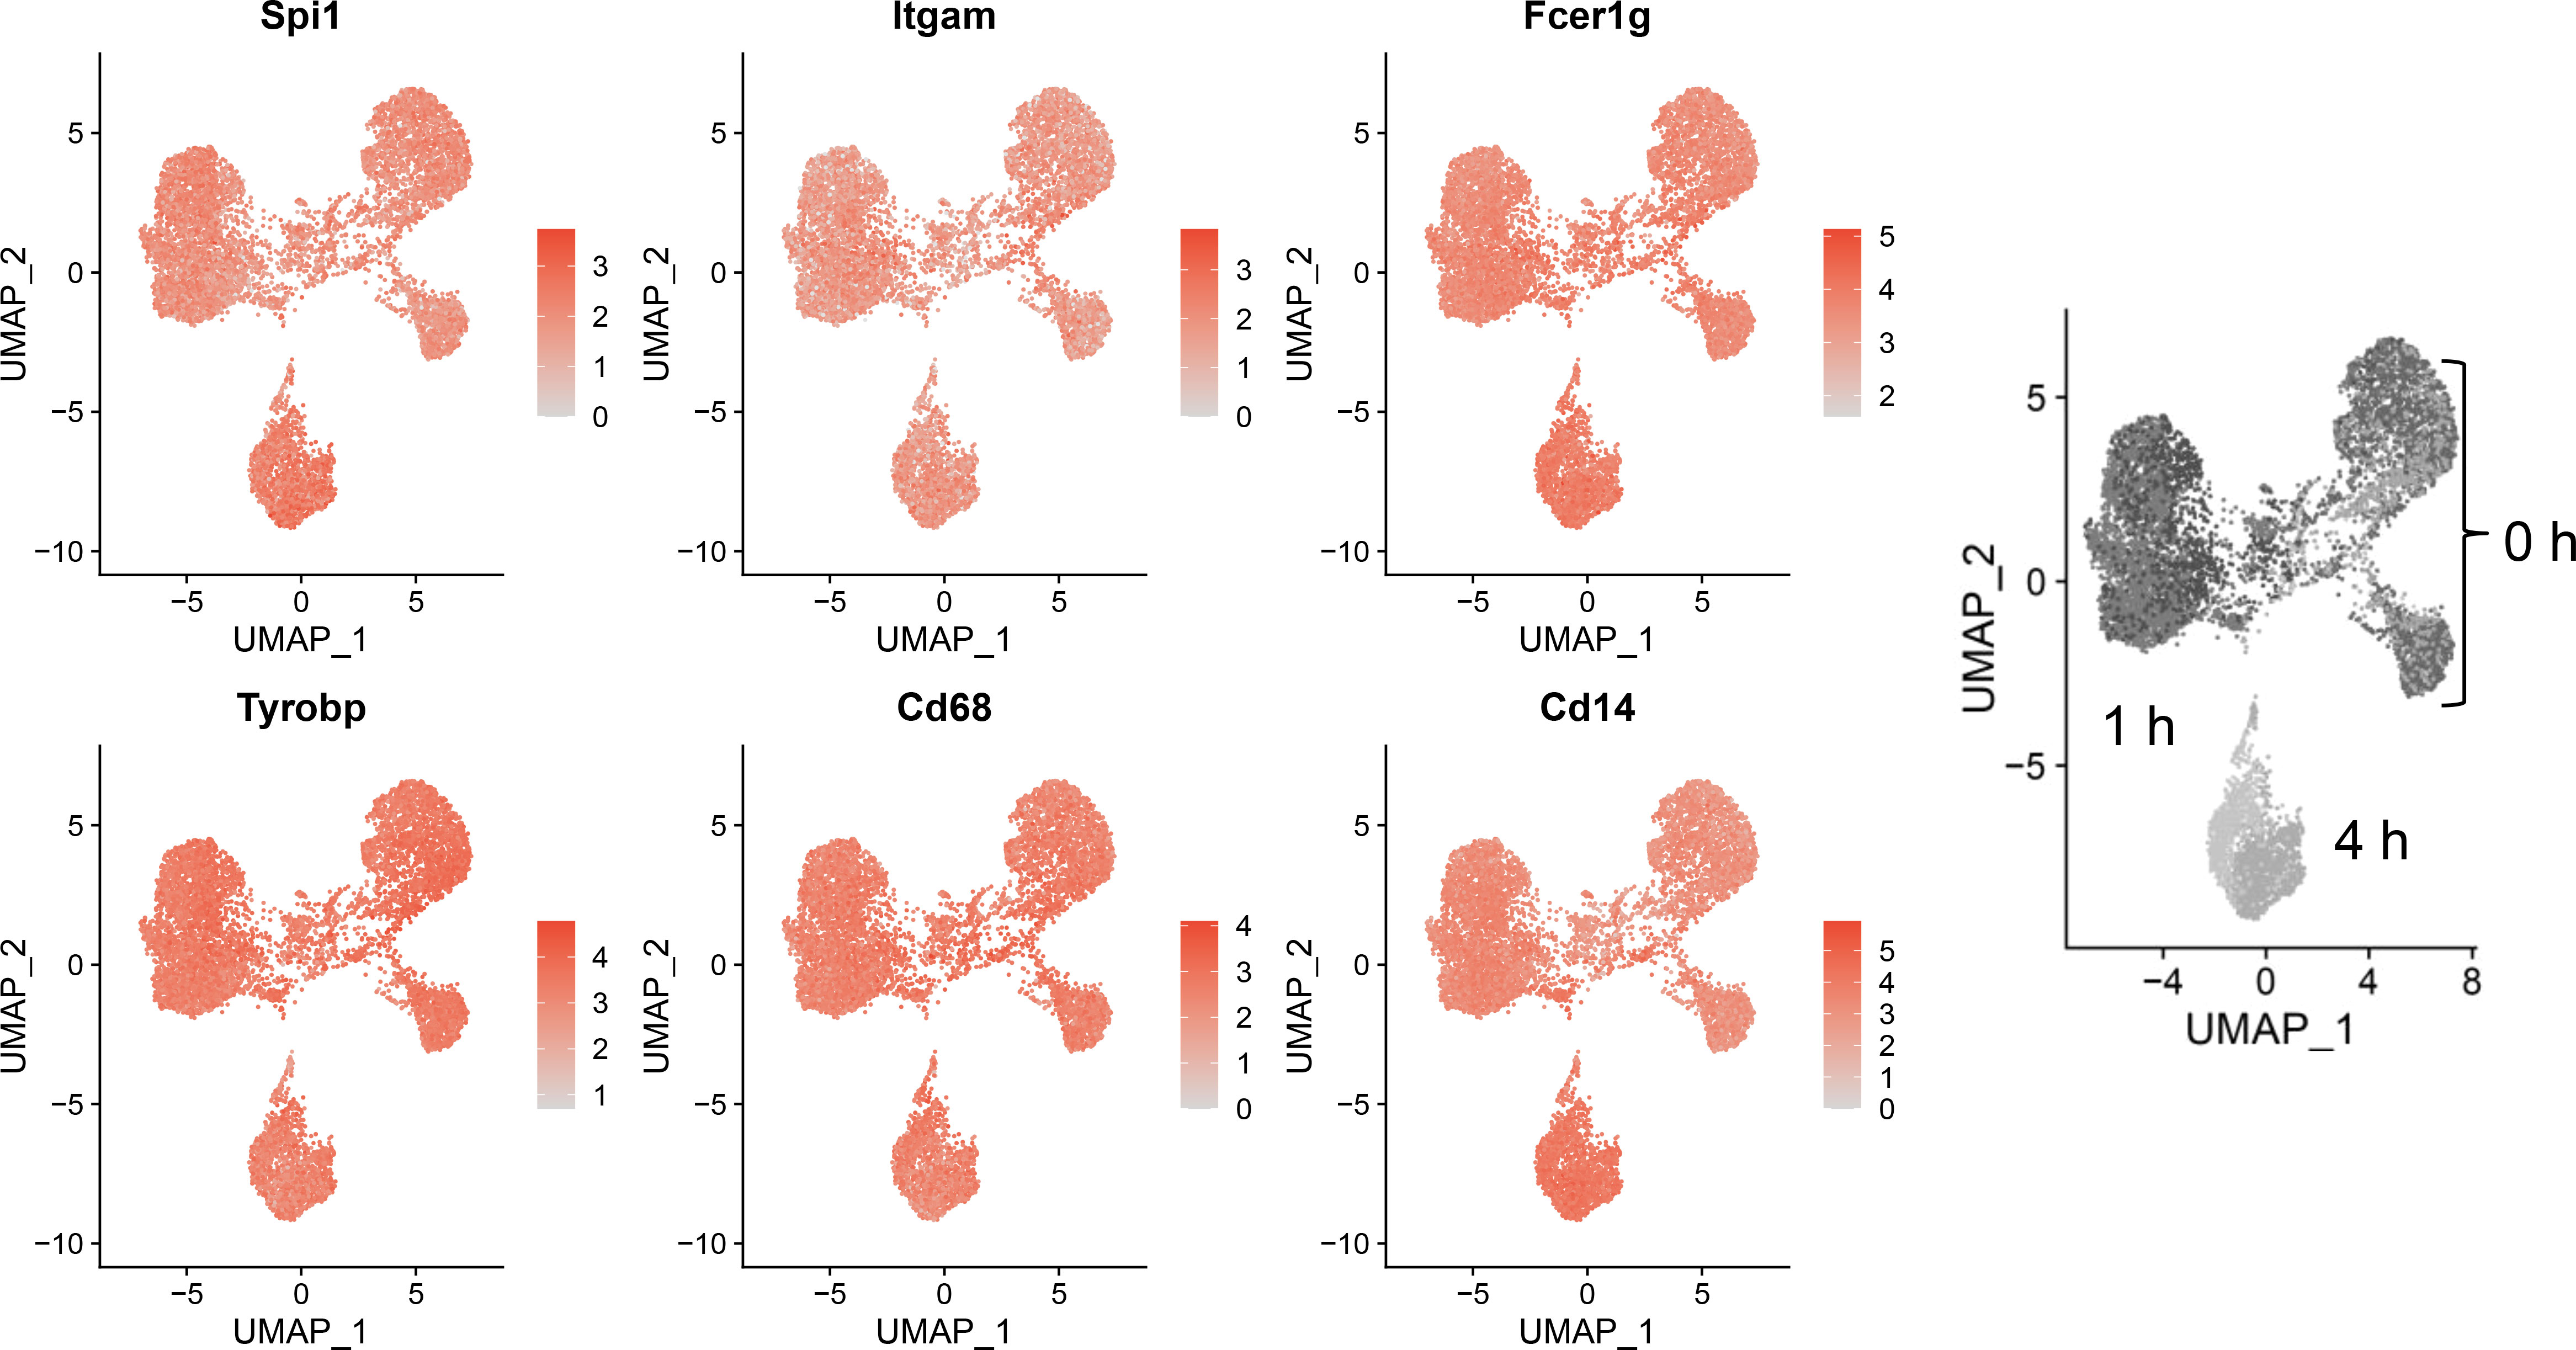
Figure 3 Self-renewing FLMs consistently express macrophage-specific genes across all times and treatments. Normalized expression values of individual macrophage-specific genes are overlayed on all cells are plotted using the Seurat FeaturePlot function. Macrophage-identifying genes are present in most cells in all time and treatment clusters indicating robustness of the self-renewing FLM model. Gray-scale image on right derived from (Figure 2A) indicates timepoints represented in clusters.
DHA influences expression of genes involved in the antioxidant response, lipid and cholesterol metabolism, proliferation, metal homeostasis, and immune modulation at 0 h
We identified 35 differentially expressed genes in the DHA treatment group compared to the Veh treatment group at 0 h (no LPS treatment) (Figure 4A). Of these, 11 were downregulated and 24 were upregulated. GO analysis only returned pathways that overlapped with 2 or 3 of the differently expressed genes, which made it difficult to determine the relevance of these results. We therefore chose to forego the GO analysis and instead performed literature searches to identify the cellular pathways involved with the differentially expressed genes.
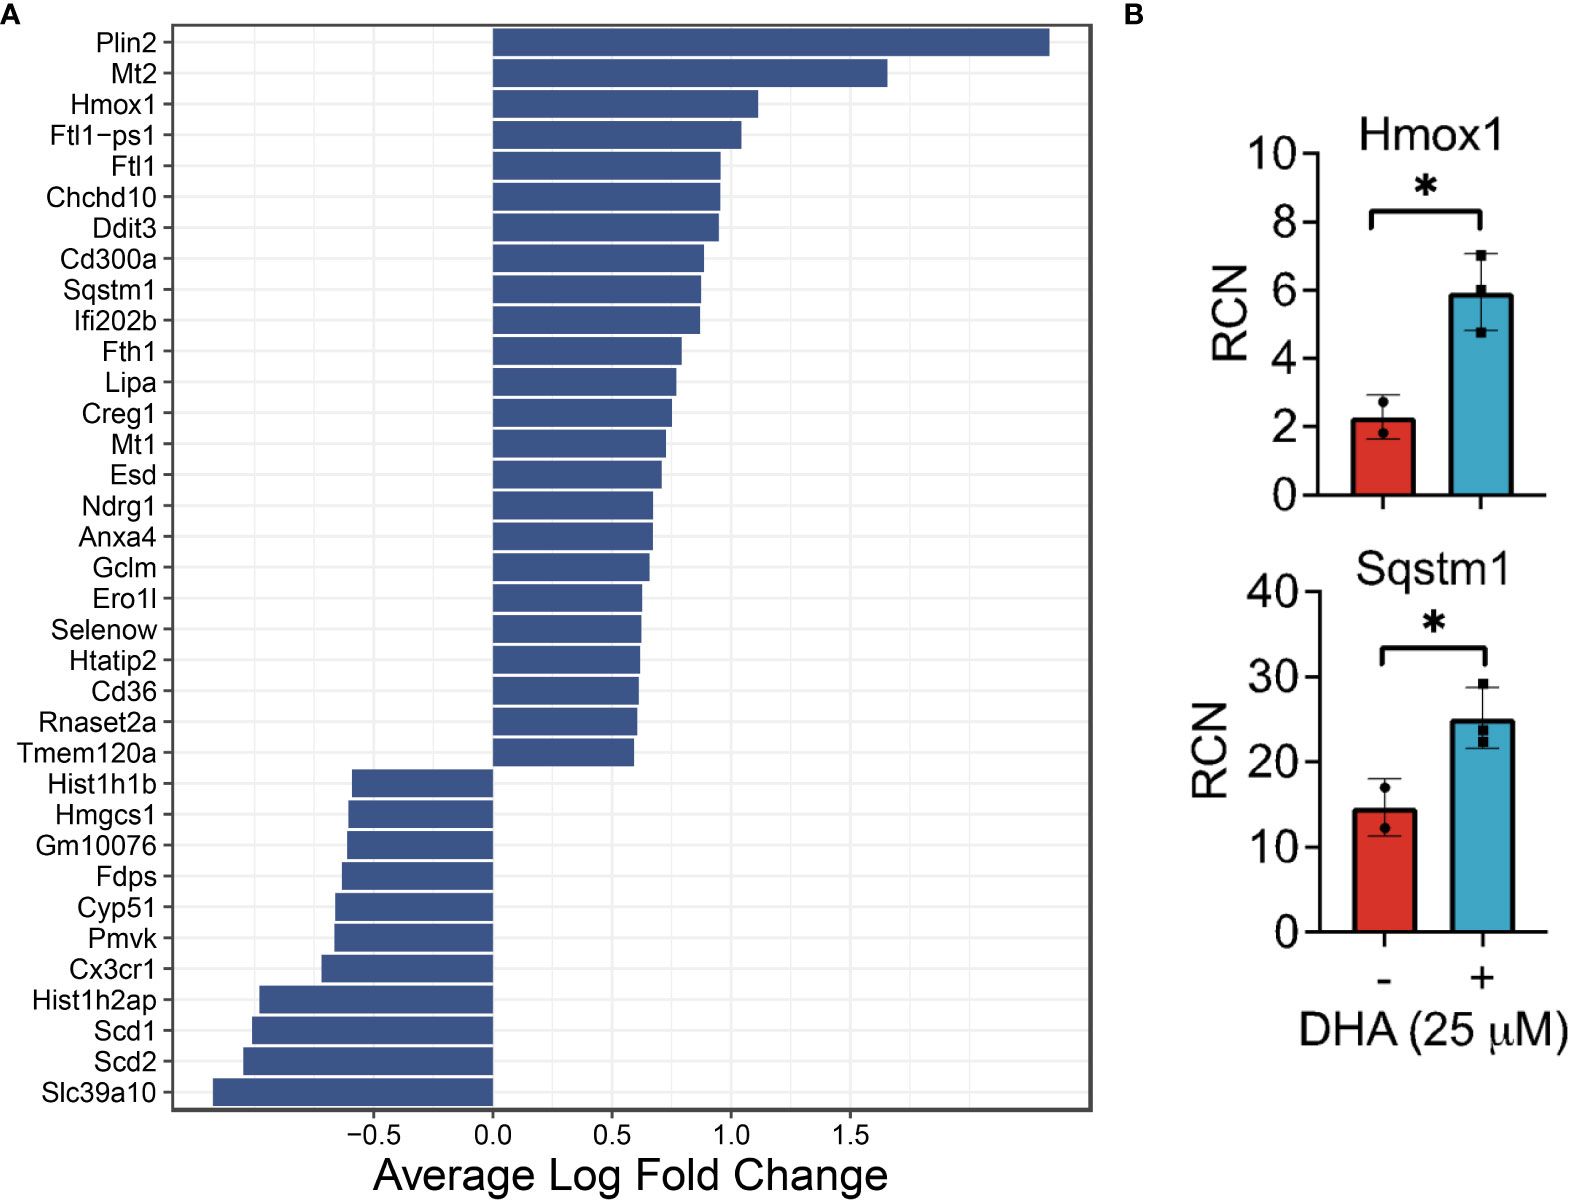
Figure 4 DHA influences expression of genes in FLMs involved in lipid uptake/metabolism (Cd36, Plin2, Lipa), antioxidant response (Sqstm1, Hmox1, Chchd10), metal homeostasis (Mt1, Mt2, Ftl1, Fth1) and immune regulation (Ifi202b, Cd300a, Anxa4) at 0h. (A) Differentially expressed genes were identified using the Seurat FindMarkers function, with thresholds set to select genes with >1.5-fold change (Adjusted p-value < 0.001) in gene expression and genes expressed in at least half in the Veh.LPS.0 or DHA.LPS.0 groups. (B) Expression of Hmox1 and Sqstm1, two genes induced by DHA treatment, was confirmed using bulk qPCR of samples treated in parallel with treatments for single cell isolation. Asterisks indicated significant differences *p<0.05) between Veh (-) and DHA (+) groups, as assessed by Student’s t-tests.
DHA augmented expression of multiple genes that play roles in the antioxidant response and known to be induced by NRF2, including Cd36, Sqstm1, Hmox1, Ftl1, Fth1, and Gclm (36, 37). Bulk qPCR confirmed expression of Hmox1 and Sqstm1, which encode the proteins heme-oxygenase-1 and sequestisome-1 and play roles in reducing reactive oxygen species and promoting autophagosome formation, respectively (38, 39) (Figure 4B). Augmented expression of NRF2-mediated genes is consistent with findings in other in vitro macrophage models and in preclinical animal studies employing omega-3 PUFA supplementation or endogenous omega-3 PUFA production promoted by expression of the Fat1 transgene (40–44). Many NRF2 targets are important for detoxifying and countering oxidative stress within the cell, thus activation of this pathway has been posited as a key mechanism by which omega-3 PUFAs counter inflammatory stimuli. This mechanism is believed to involve ROS-induced non-enzymatic omega-3 PUFA oxidation products which form adducts with Kelch-like ECH-associated protein 1 (KEAP1) (45). While unmodified KEAP1 sequesters NRF2 in the cytoplasm, its adduction permits release of NRF2 into the cytoplasm thereby promoting expression of antioxidant genes. Thus, FLMs could be used in the future to track intracellular movement of KEAP1 and NRF2 in the presence and absence of DHA and other omega-3 PUFAs.
DHA also augmented genes involved in lipid uptake and synthesis, including Cd36 (a scavenger receptor involved in lipid uptake), Plin2 (associated with lipid droplet formation), and Lipa (lipase involved in lysosomal degradation of lipids) (Figure 4A). In contrast, DHA-treated cells had lower expression levels of genes involved in cholesterol synthesis (Scd1, Scd2, Pmvk, Cyp51, Hmgcs1, Fdps). Changes to cholesterol synthesis may be in response to changes to membrane fluidity that occur with omega-3 PUFA incorporation into phospholipids (46).
It was further notable that DHA reduced expression of histone genes (Hist1h1b, Hist1h2ap), which is associated with a decline in DNA synthesis (47), and increased the apoptotic transcription factor Ddit3, which is consistent with the observed decrease in cycling cells (Figure 4A). Previous studies have shown that treatment with high concentrations of DHA may induce apoptosis in vitro in breast cancer cells, likely through exaggerated activation of the pathways observed in this study (48). We conclude that, in our model, while DHA treatment did reduce cell proliferation, the concentration was not high enough to trigger excess cell death by apoptosis.
DHA increased expression of genes associated with metal homeostasis (Mt1, Mt2, Ftl1, Fth1) (Figure 4A). Metallothionines (Mt1, Mt2) have been implicated in reducing inflammation in chronic inflammatory disease, but their mechanism of action is unclear (49). Ferritin light chain (Ftl1) has been shown to reduce NF-κB activation in Raw 264.7 macrophages (50).
Other differentially expressed genes (Figure 4A) have functions that are less well-described, though many are implicated in pathways involved in oxidative stress, cell proliferation, and the immune response. For example, it has been shown that mutations in Chchd10 are associated with impaired mitochondrial genome maintenance following oxidative stress (51). Ifi202b (also known as p202) suppresses IFN gene signaling by binding to dsDNA and preventing its access to nucleic acid sensors in the cell (52). CD300a is an inhibitory receptor expressed on many immune cell populations (53). Ndrg1 acts as a tumor suppressor in some cancers and a tumor promoter in others (54). We also observed increased expression of Anxa4, which was shown to inhibit adenylate cyclase 5 (55) and to be upregulated in human and mouse M2-polarized macrophages in vitro (56).
Altogether, the DHA-mediated changes in gene expression observed at 0 h are consistent with a putative shift in macrophage phenotype that would make FLMs more resilient against subsequent inflammatory triggers.
LPS-induced cellular pathways promoting transcription precede inflammatory gene expression
Analysis with Seurat FindMarkers revealed 88 differentially expressed genes (>2-fold) after 1 h LPS treatment and 391 differentially expressed genes (>2-fold) with 4 h LPS treatment, with 51 genes shared between the two timepoints (Figure 5A). Among the genes differentially expressed at 1 h, 81 were upregulated and 7 were downregulated; and among the genes differentially expressed at 4 h, 201 were upregulated and 190 were downregulated.
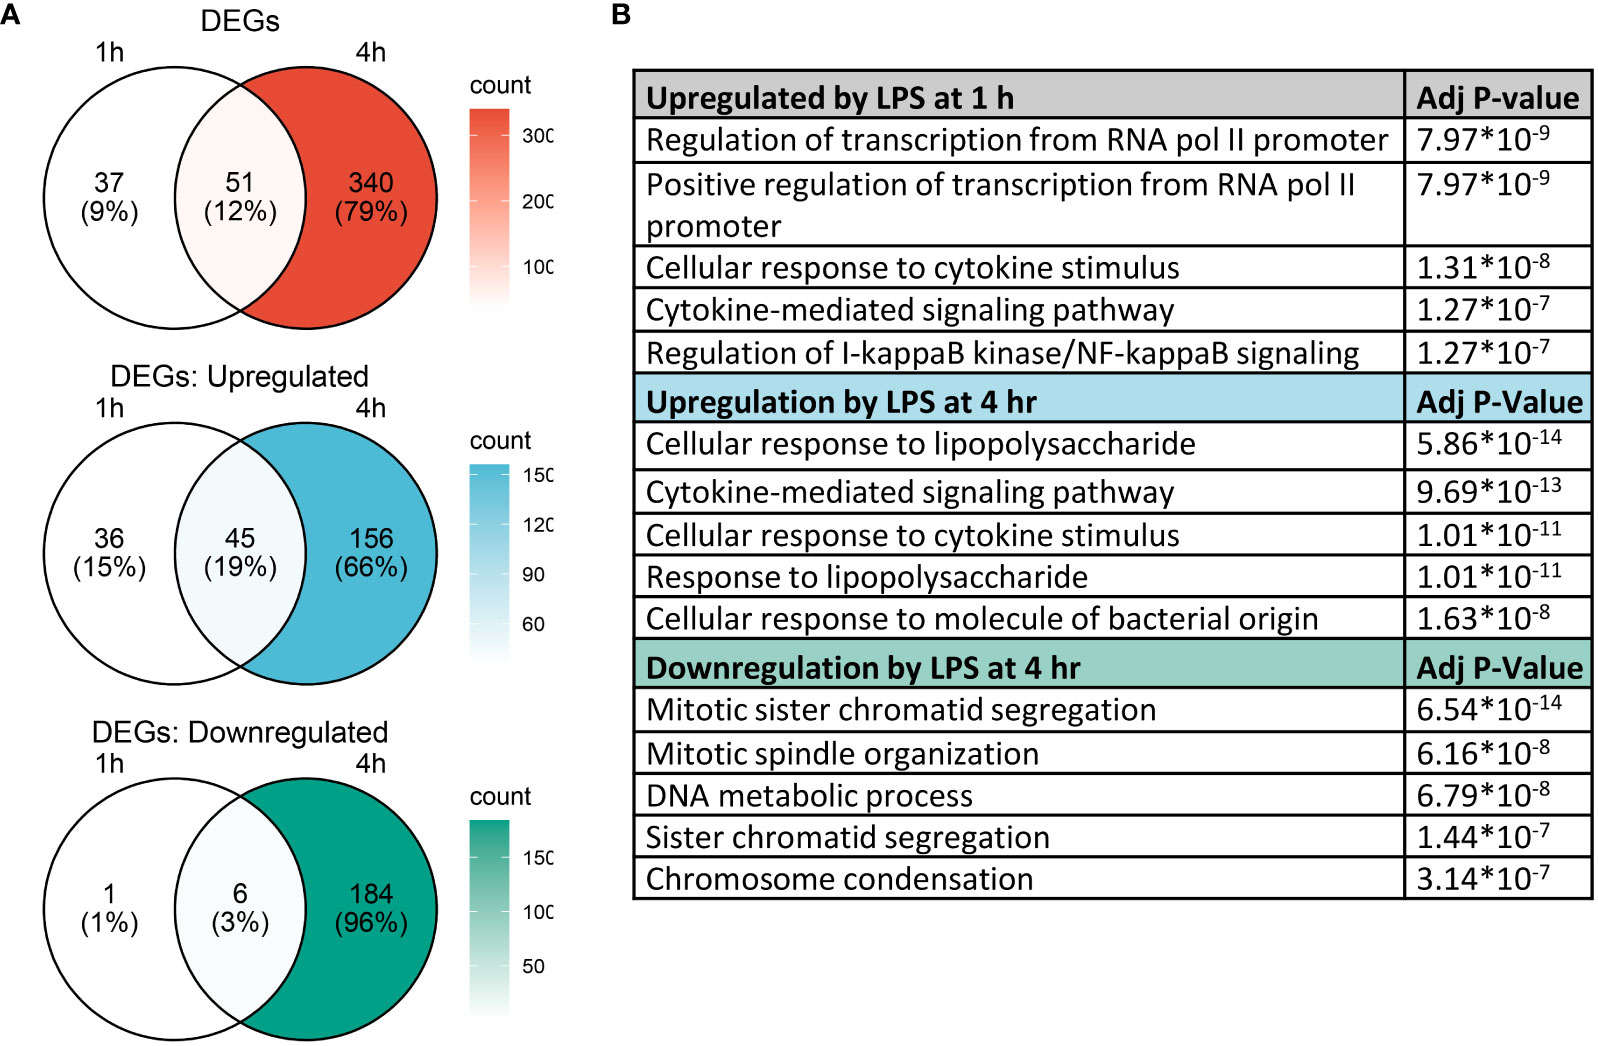
Figure 5 Gene expression changes induced by LPS in FLMs at 1 and 4h. (A) Differentially expressed genes (DEGs) were identified using the Seurat FindMarkers function, with thresholds set to select genes with >2-fold change in gene expression and genes expressed in at least half of either group being compared. Venn diagrams of DEGs at 1h only (left circle), 4h only (right circle), and at both timepoints (intersection) were generated to visualize the quantity of DEGs in each group. (B) The Enrichr database was used to identify GO Biological Process terms for the indicated groups of genes. Shown are the five most enriched pathways upregulated by LPS after 1 and 4 h or downregulated by LPS after 4 h, as determined by the size of the adjusted p-value.
We used the Enrichr database (57) to identify GO Biological Process terms associated with differentially expressed genes (Figure 5B). Genes upregulated at 1 h were enriched in pathways involved in regulating transcription as well as inflammatory pathways, like cellular response to cytokine stimulus and response to lipopolysaccharide. This suggests that at 1 h, many genes were setting the stage for the more robust transcriptional response subsequently observed at 4 h. Indeed, at 4 h, most upregulated genes are involved in inflammatory signaling pathways, while downregulated genes are involved in cell proliferation.
We generated heatmaps to visualize the expression pattern among individual cells for genes upregulated by LPS (Figure 6A, additional details in figure legend). Cells were annotated by treatment (colored horizontal lines above heatmap). As in the UMAP plots, unbiased clustering of cells resulted in near-perfect separation by LPS treatment group. Genes for which expression decreased from 1 h to 4 h post-LPS treatment include those involved in negative feedback of inflammatory signaling (Dusp2, Nfkbiz, Zfp36), transcription factors (Egr1, Ier2, Junb), and genes involved in promoting inflammatory signaling (Nlrp3, Tnf, Traf) (Figures 6A, B). Many other genes induced at 4 h have low or no expression at 1 h and code for cytokines or were proteins involved in the inflammatory response, such as Ccl2 (MCP-1), Ccl3 (MIP-1a), and Il1b (IL-1β).
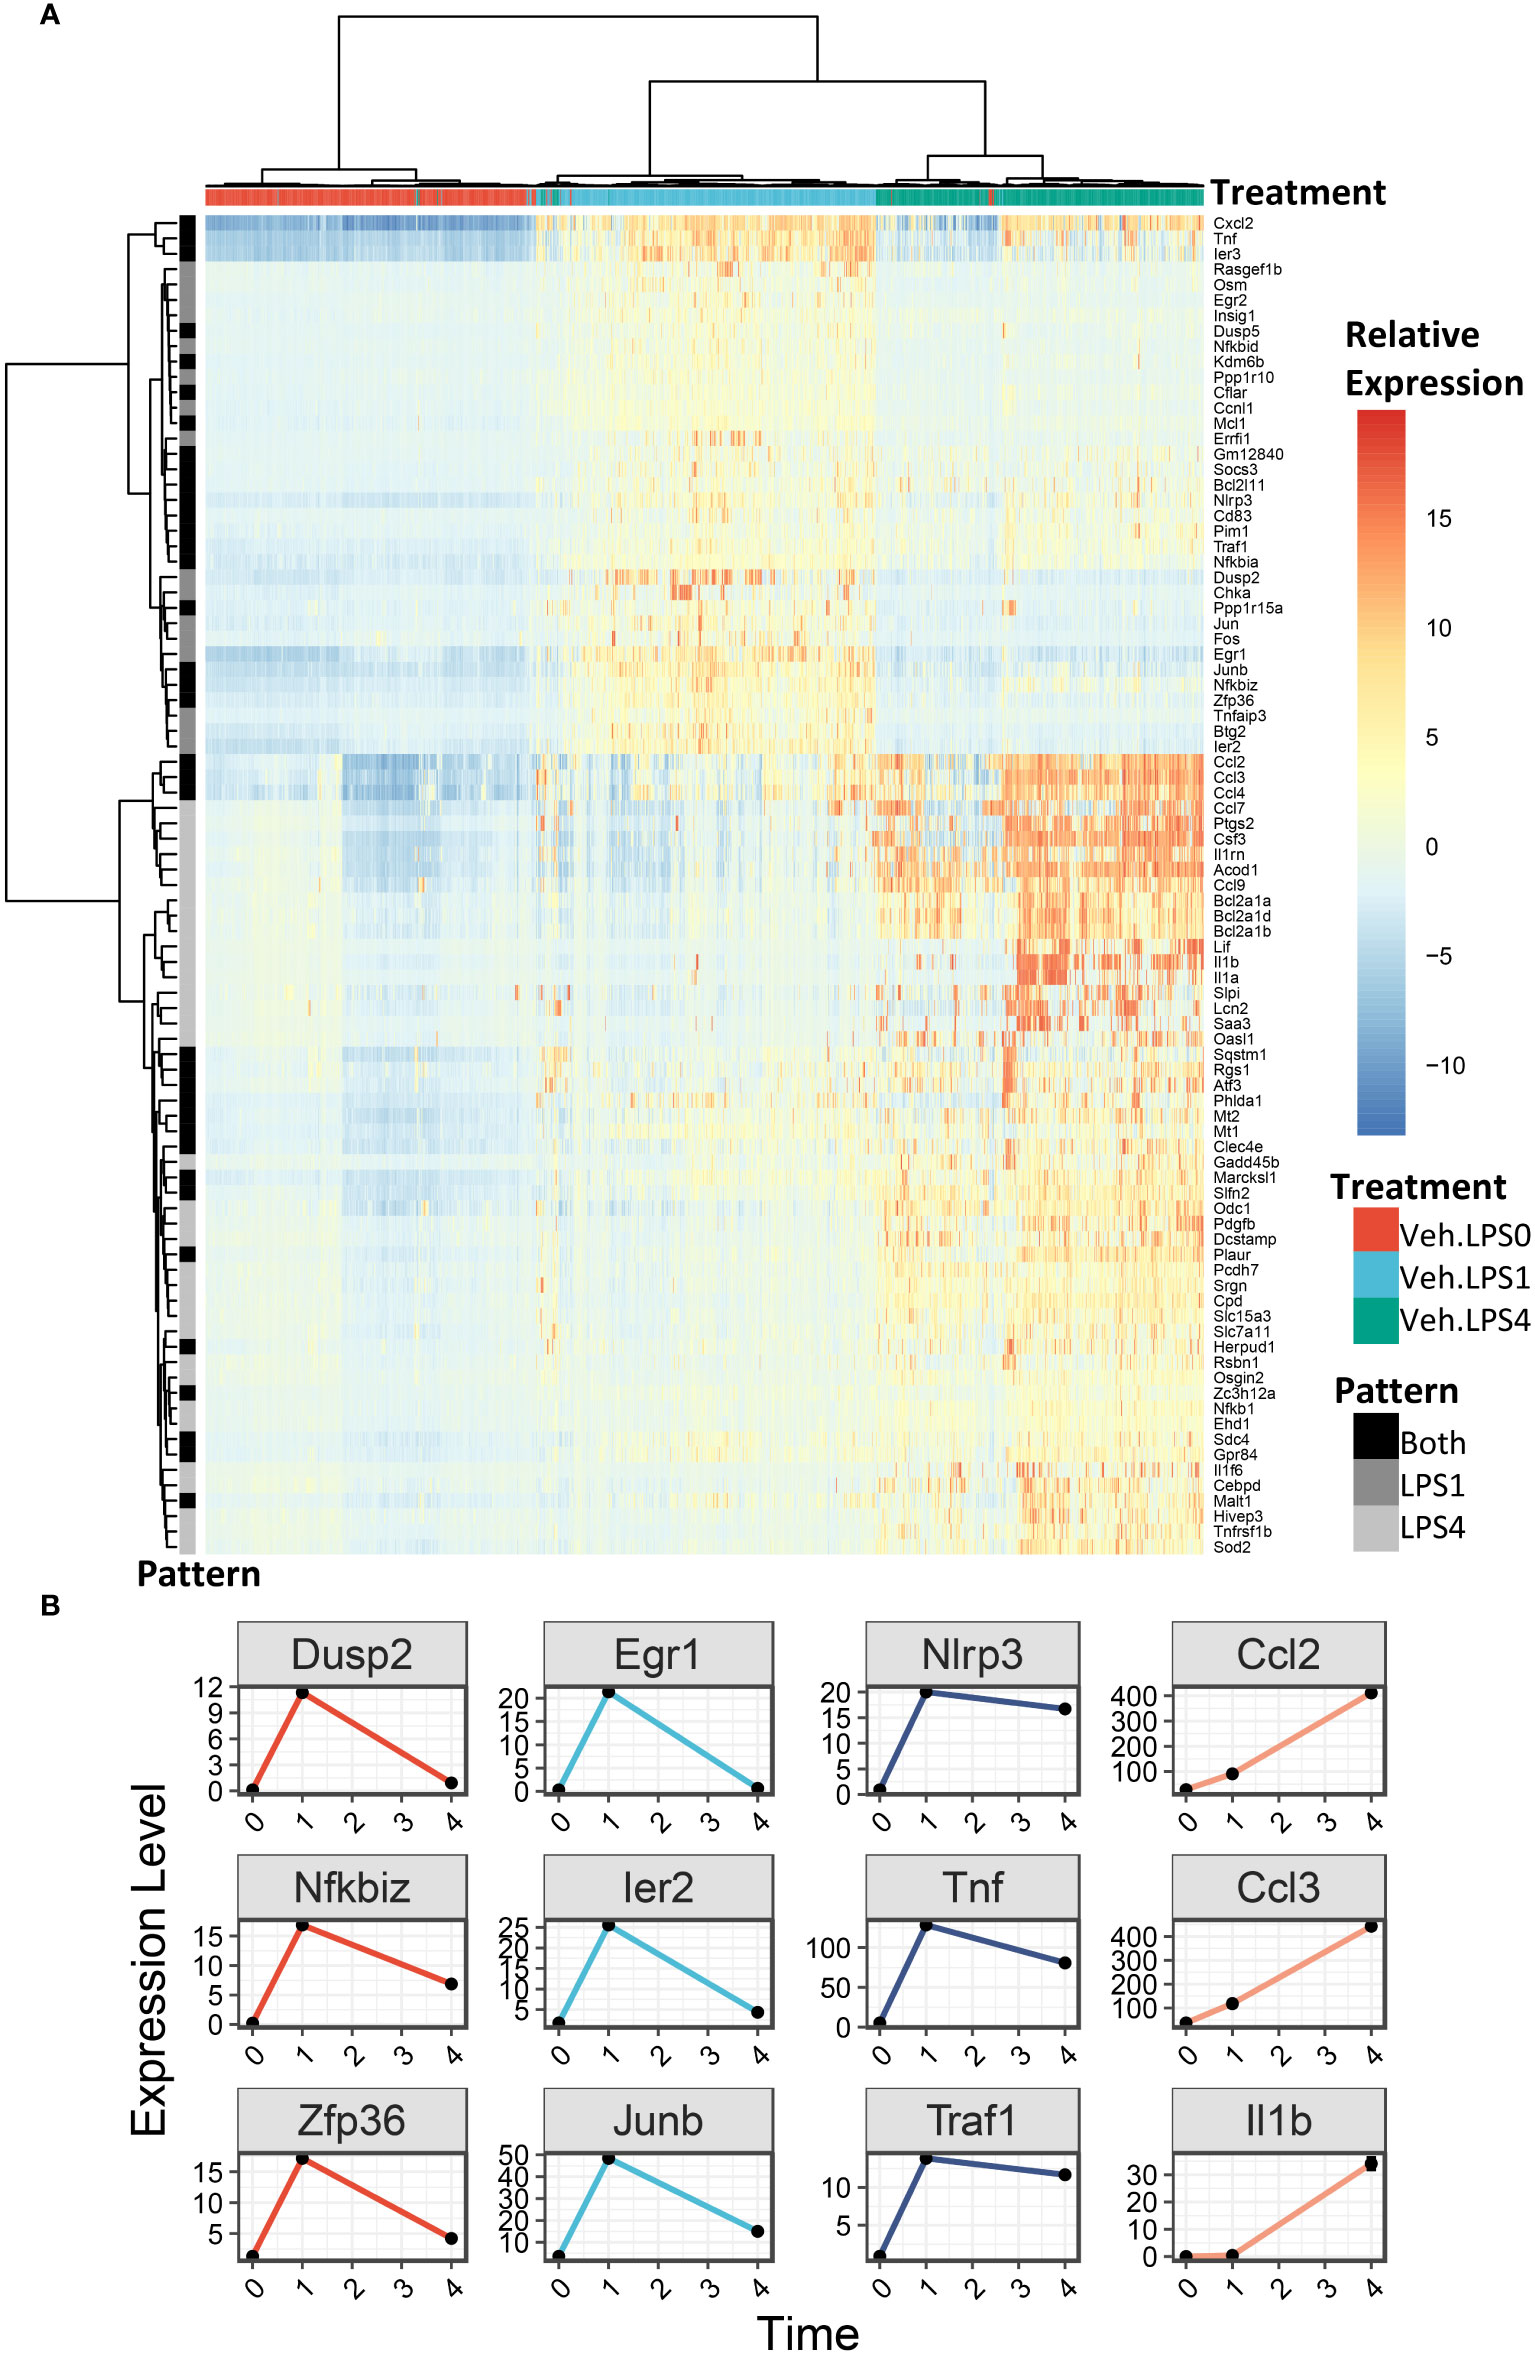
Figure 6 LPS robustly upregulates gene expression in FLMs after 1 and 4h. (A) 500 cells were randomly selected from the Veh.0, Veh.LPS.1, and Veh.LPS.4 groups and genes upregulated >6-fold were used to generate a heatmap using pheatmap with the “ward.d” clustering method. The normalized SCT values were plotted without scaling the heatmap. Cells were annotated according to their treatment group. (B) Plots showing the expression of individual LPS-induced genes at the 0, 1, and 4 h timepoint.
DHA suppresses genes involved in cholesterol metabolism at 1 h post-LPS exposure
For analysis of DHA effects at 1 h post-LPS treatment, we reduced the threshold for identifying differentially expressed genes to >1.5 fold to capture the nuanced effects of DHA more thoroughly. Following 1 h LPS treatment, 156 genes were induced and DHA significantly suppressed 11 of these (Figure 7A). More than half of the suppressed genes were involved in cholesterol synthesis, including Cyp51, Hmgcs, Hmgcr, Insig, Ldlr, Sc5d, and Idi1 (Figure 7B). This is consistent with recent studies investigating the role of lipid metabolism in macrophages, where it has been shown that LPS-induced cholesterol synthesis promotes macrophage activation (58, 59). These findings are also consonant with our observation that DHA suppresses cholesterol synthesis genes in FLMs in the absence of inflammatory stimulus at 0 h (Figure 4A).
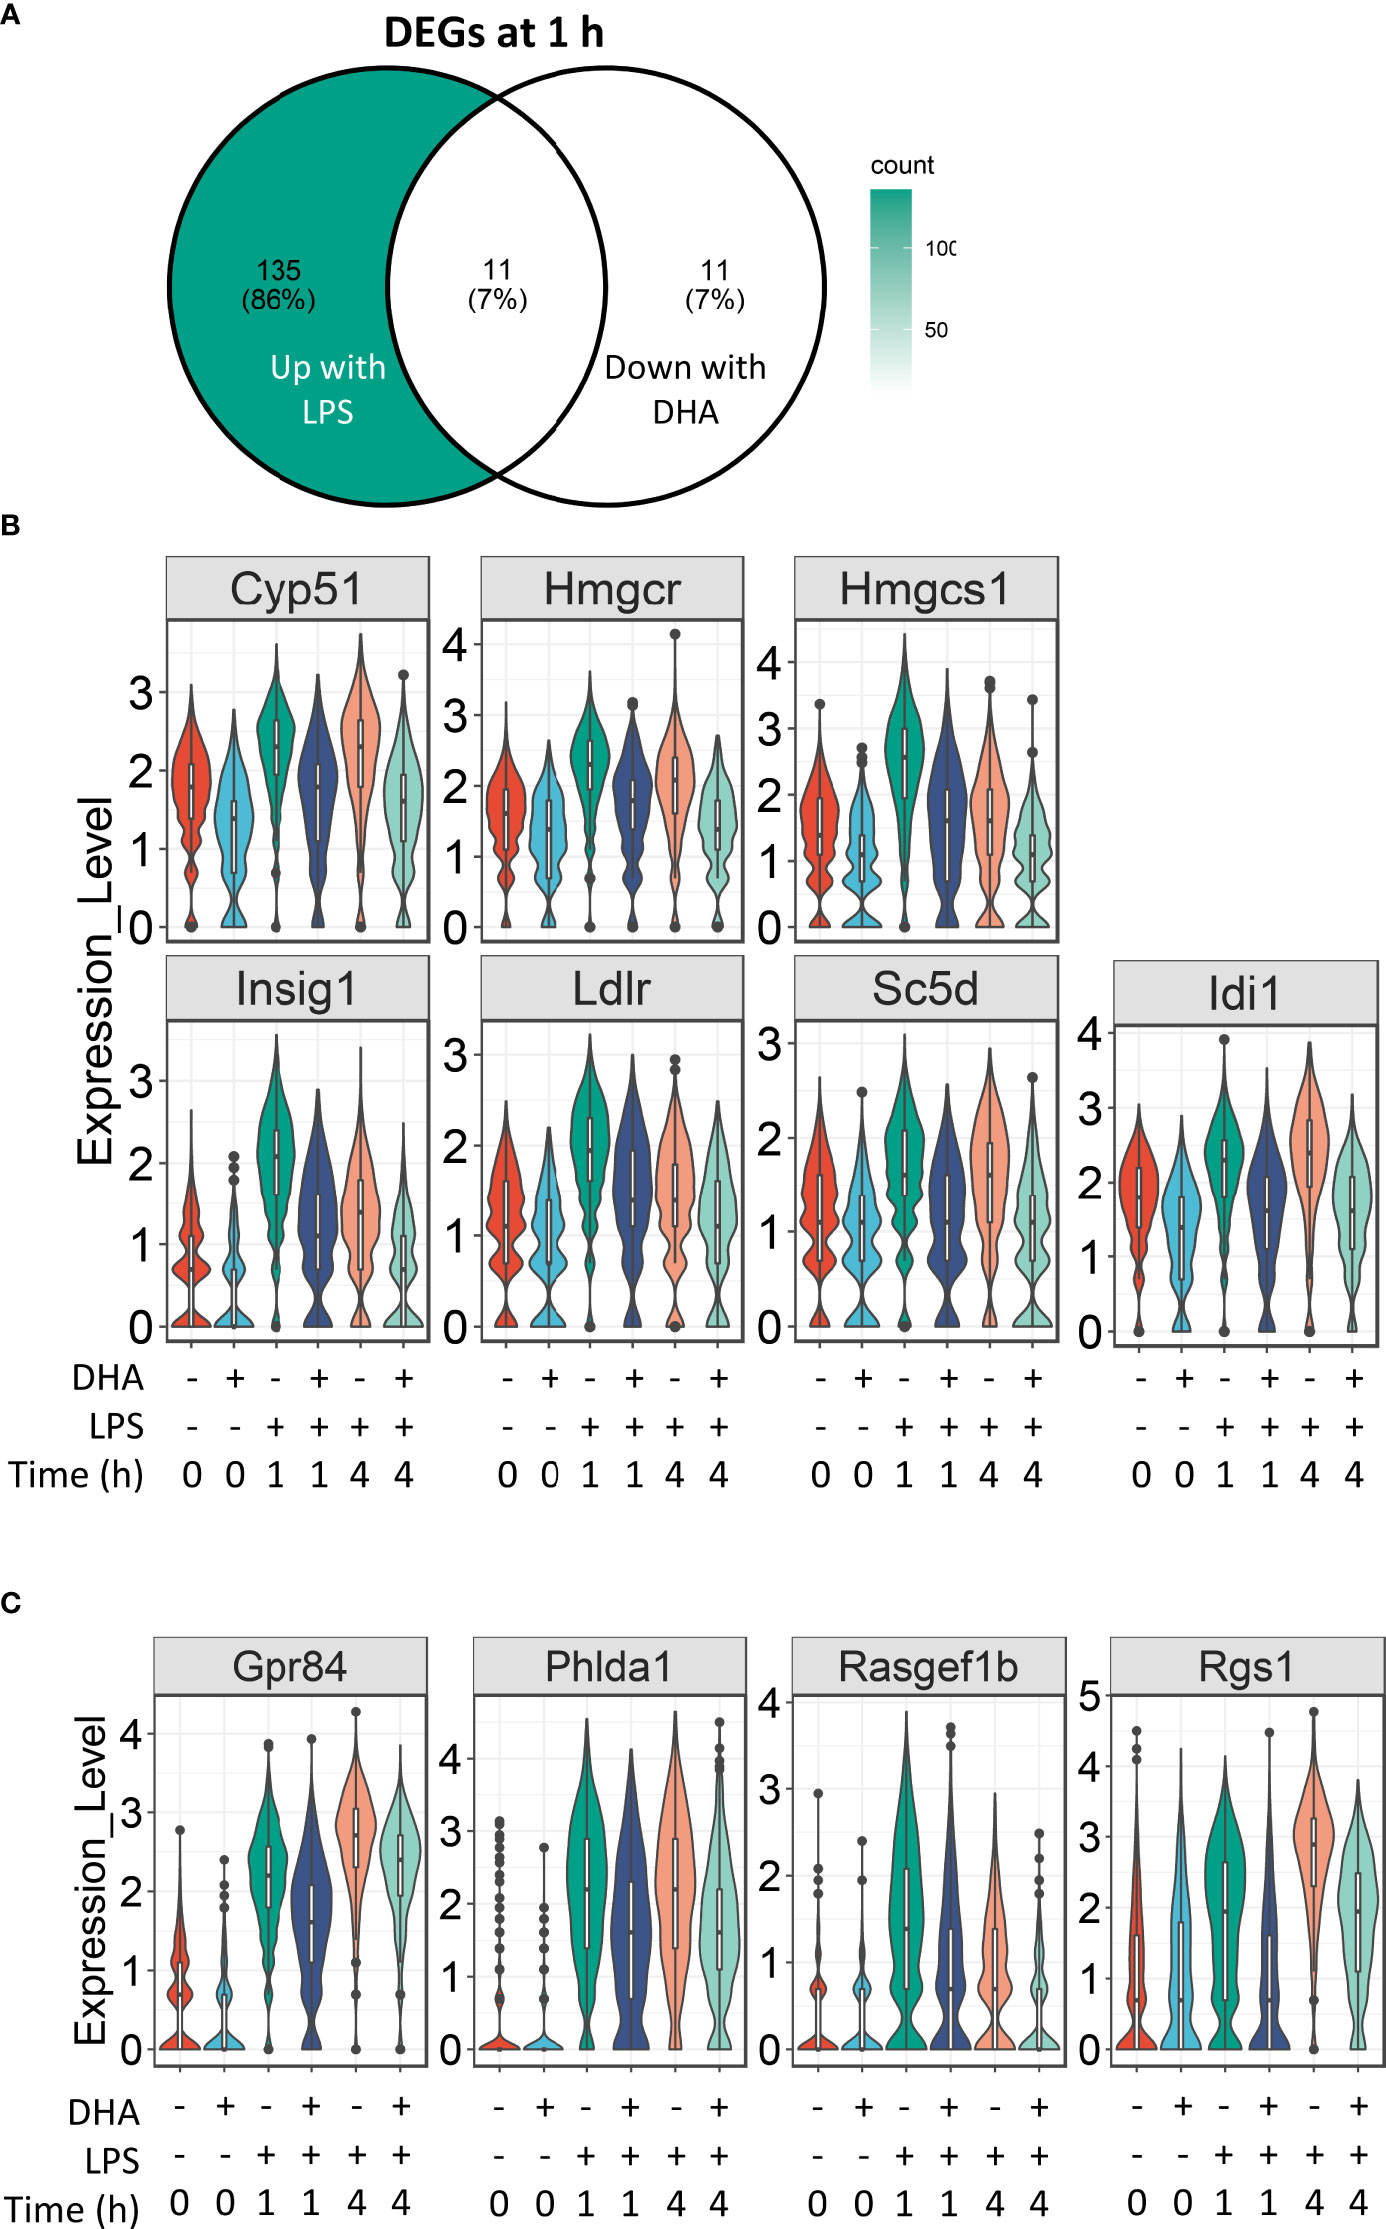
Figure 7 DHA suppresses expression of genes associated with cholesterol metabolism and inflammatory signaling pathways at 1 h post-LPS treatment. (A) Differentially expressed genes (DEGs) were identified by using the Seurat FindMarkers function, with thresholds set to select genes with >1.5-fold change in gene expression and genes expressed in at least 25% of groups being compared. DEGs in the “Down with DHA” circle of the Venn diagram are downregulated in DHA.LPS.1 relative to Veh.LPS.1 and DEGs in the “Up with LPS” circle of the Venn diagram are upregulated in Veh.LPS.1 relative to Veh. The intersection represents LPS-induced genes suppressed by DHA at 1h. (B) 7 of the 11 LPS-induced genes suppressed by DHA involve the cholesterol synthesis pathway. (C) Other LPS-induced genes suppressed by DHA at 1 h are also suppressed by DHA at 4 h.
Our results suggest that DHA and LPS have opposing roles in cholesterol synthesis, revealing another potential mechanism by which DHA suppresses inflammatory signaling. While it is known that inhibition of cholesterol biosynthesis with statins can suppress inflammation, the specific effects on macrophages are less well understood (60). All the genes suppressed by DHA at 1 h post-LPS treatment are targets of the transcription factors SREBP1a and SRBP1c (61–63), which have been shown to be inhibited by DHA supplementation in vitro and in vivo (64, 65). An increase in intracellular cholesterol fosters TLR4 signaling by providing structure for lipid rafts, which promote aggregation of TLR4 receptor with its co-receptor CD14 (59, 66). Cholesterol depletion has also been shown to inhibit GPCR endocytosis (67). It is therefore tempting to speculate that this may also be the case for TLR4 endocytosis, which could explain decreased IRF signaling in DHA-treated cells (described further below).
The remaining genes induced after 1 h LPS treatment and suppressed by DHA are Gpr84, a GPCR known to be involved in activating inflammatory pathways in macrophages (68), Phlda1, which is highly expressed in inflammatory macrophages from atherosclerotic plaques (69), and Rasgef1b and Rgs1, which are involved in G-protein signaling (Figure 7C).
DHA suppresses inflammatory signaling pathways at 4 h post-LPS exposure
Following 4 h LPS treatment, 466 genes were induced by 1.5-fold or more (Figure 8A). Of the LPS-induced genes, 58 were suppressed by DHA (by at least 1.5-fold). We identified GO Biological Processes for the differentially expressed genes that were 1) increased by LPS, 2) increased in LPS and suppressed by DHA, and 3) decreased by DHA (Figure 8B). As observed at 1 h, DHA significantly suppressed many genes associated with cholesterol synthesis. LPS-induced genes that were suppressed by DHA were enriched for pathways such “cytokine mediated signaling pathway” and “cellular response to type I interferon”. Assessment of selected genes annotated as “cellular response to LPS” and “cytokine-mediated signaling pathway” show that DHA robustly suppressed certain genes while only mildly suppressing, or having no effect, on others (Figures 8C, D). The group of genes annotated as “cellular response to LPS” contained chemokines (Ccl2, Ccl3), cytokines (Tgfb1), and other genes promoting proinflammatory signaling pathways (Nfkb1, Cd14, Tnfrsf1b, Nlrp3). LPS also upregulates many genes that counteract inflammation by degrading mRNA coding inflammatory cytokines (Zfp36) or inhibiting inflammatory signaling pathways (Tnip3, Tnip1, Nfkbil3). Many of the genes annotated as “cytokine-mediated signaling pathway” are involved in or induced by IFN1 signaling (Irf7, Irf9, Isg15, Xaf1). We further confirmed DHA suppression of representative IFN1-regulated genes observed in scRNAseq using bulk qPCR (Figure 9).
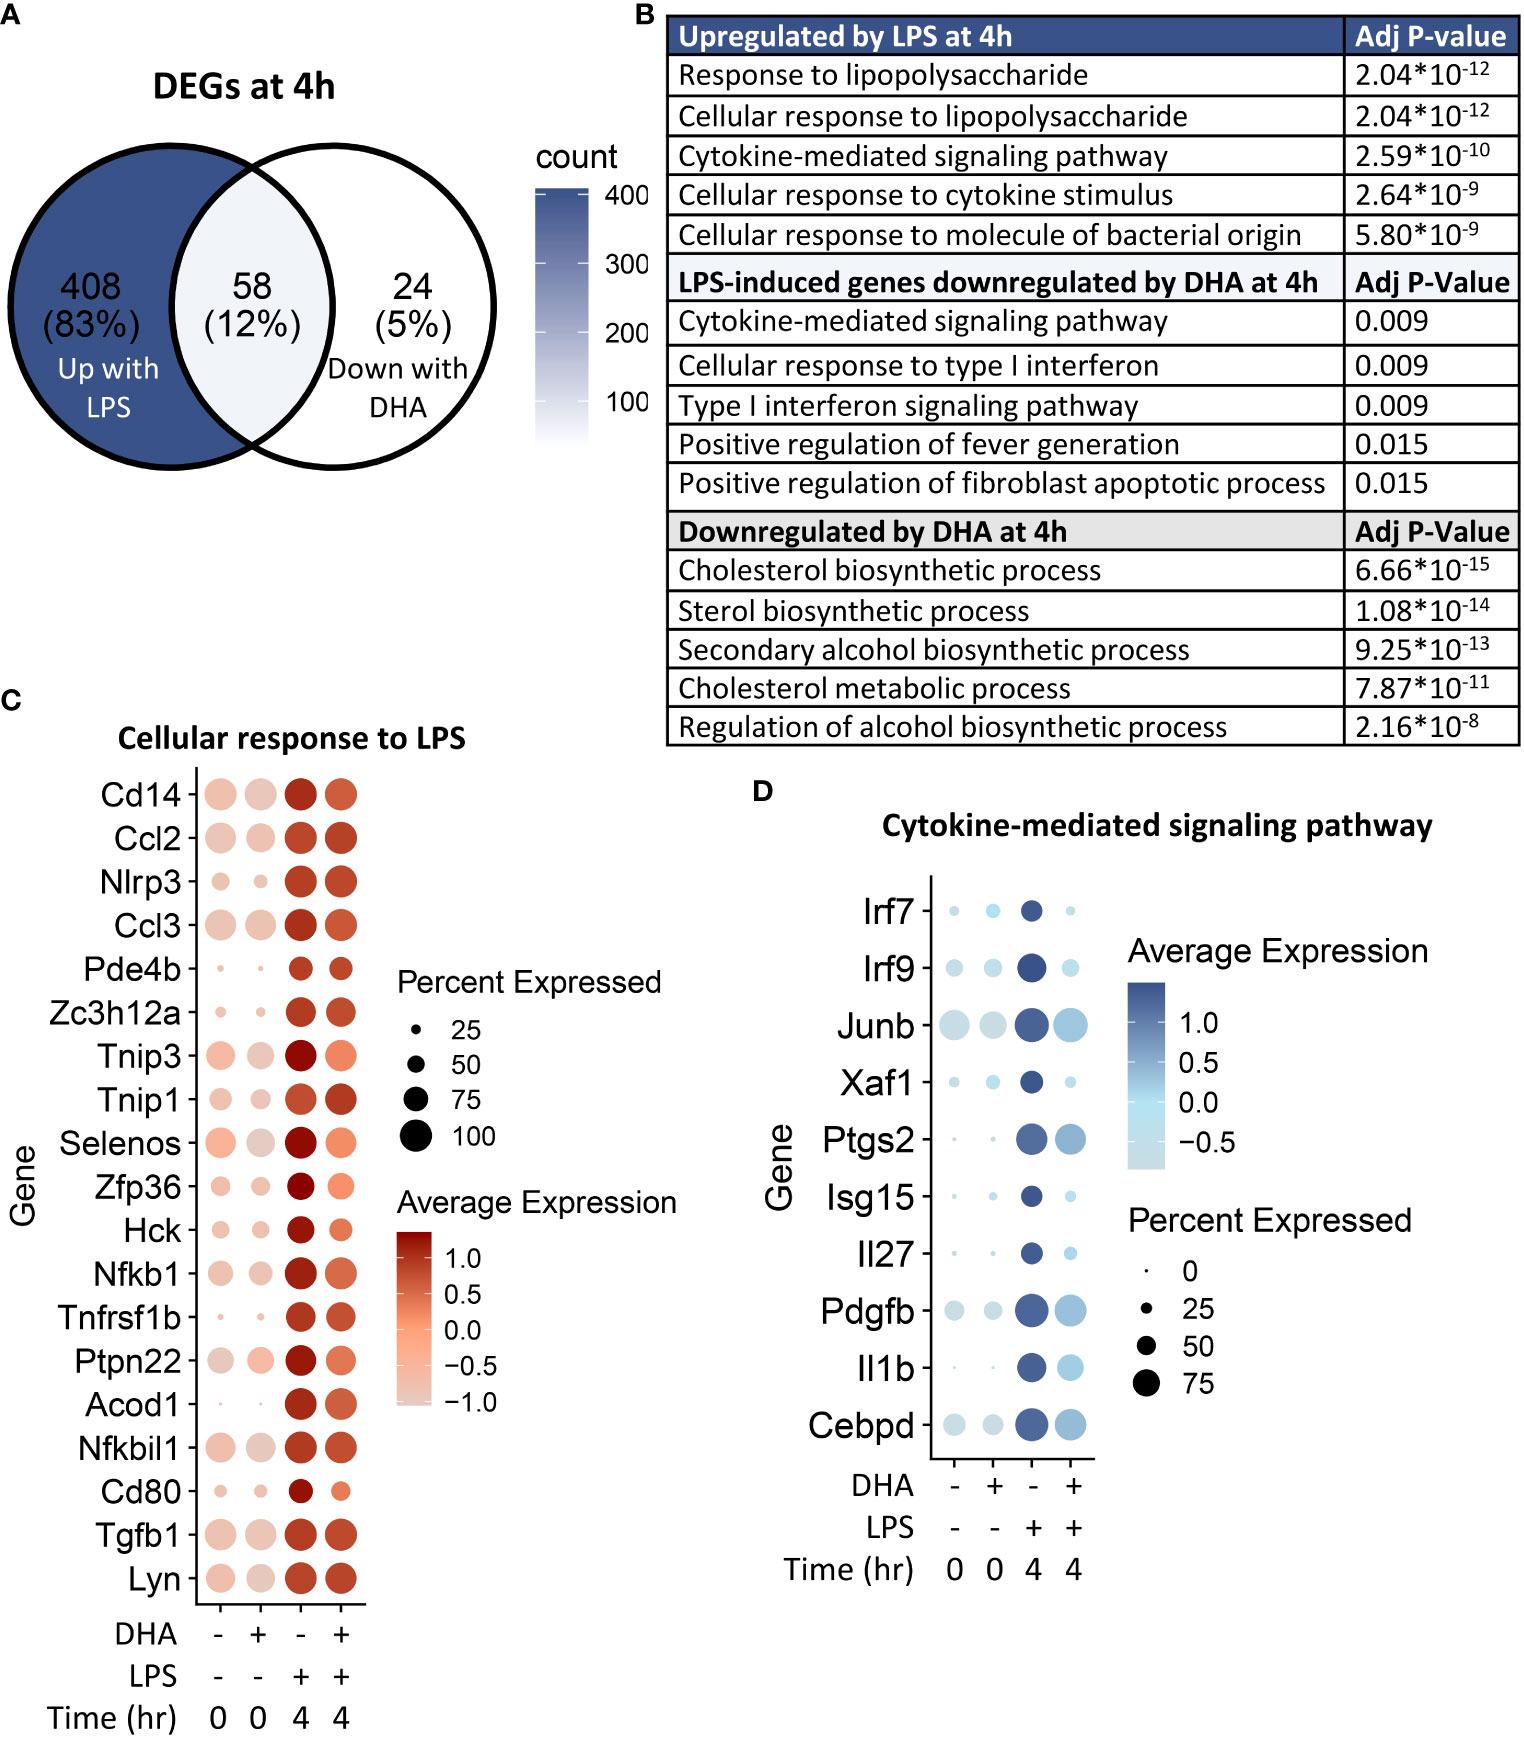
Figure 8 DHA inhibits inflammatory signaling pathways at 4 h post-LPS treatment. (A) Differentially expressed genes (DEGs) were identified by using the Seurat FindMarkers function, with thresholds set to select genes with >1.5-fold change in gene expression and genes expressed in at least 25% of groups being compared. DEGs in the “Down with DHA” circle of the Venn diagram are downregulated in DHA.LPS.4 relative to Veh.LPS.4 and DEGs in the “Up with LPS” circle of the Venn diagram are upregulated in Veh.LPS.4 relative to Veh. The intersection represents LPS-induced genes suppressed by DHA at 1h. (B) The Enrichr database was used to identify GO Biological Process terms for the indicated groups of genes. Shown are the five most enriched pathways are shown, as determined by the size of the adjusted p-value. (C) Selected input genes enriched in the “Cellular response to LPS” and (D) “Cytokine-mediated signaling pathway” GO terms are depicted using the Seurat DotPlot feature, where the size of the dot indicates the percent of cells expressing the gene and the depth of the dot color indicates the average expression of the gene across the cells in which it is expressed.
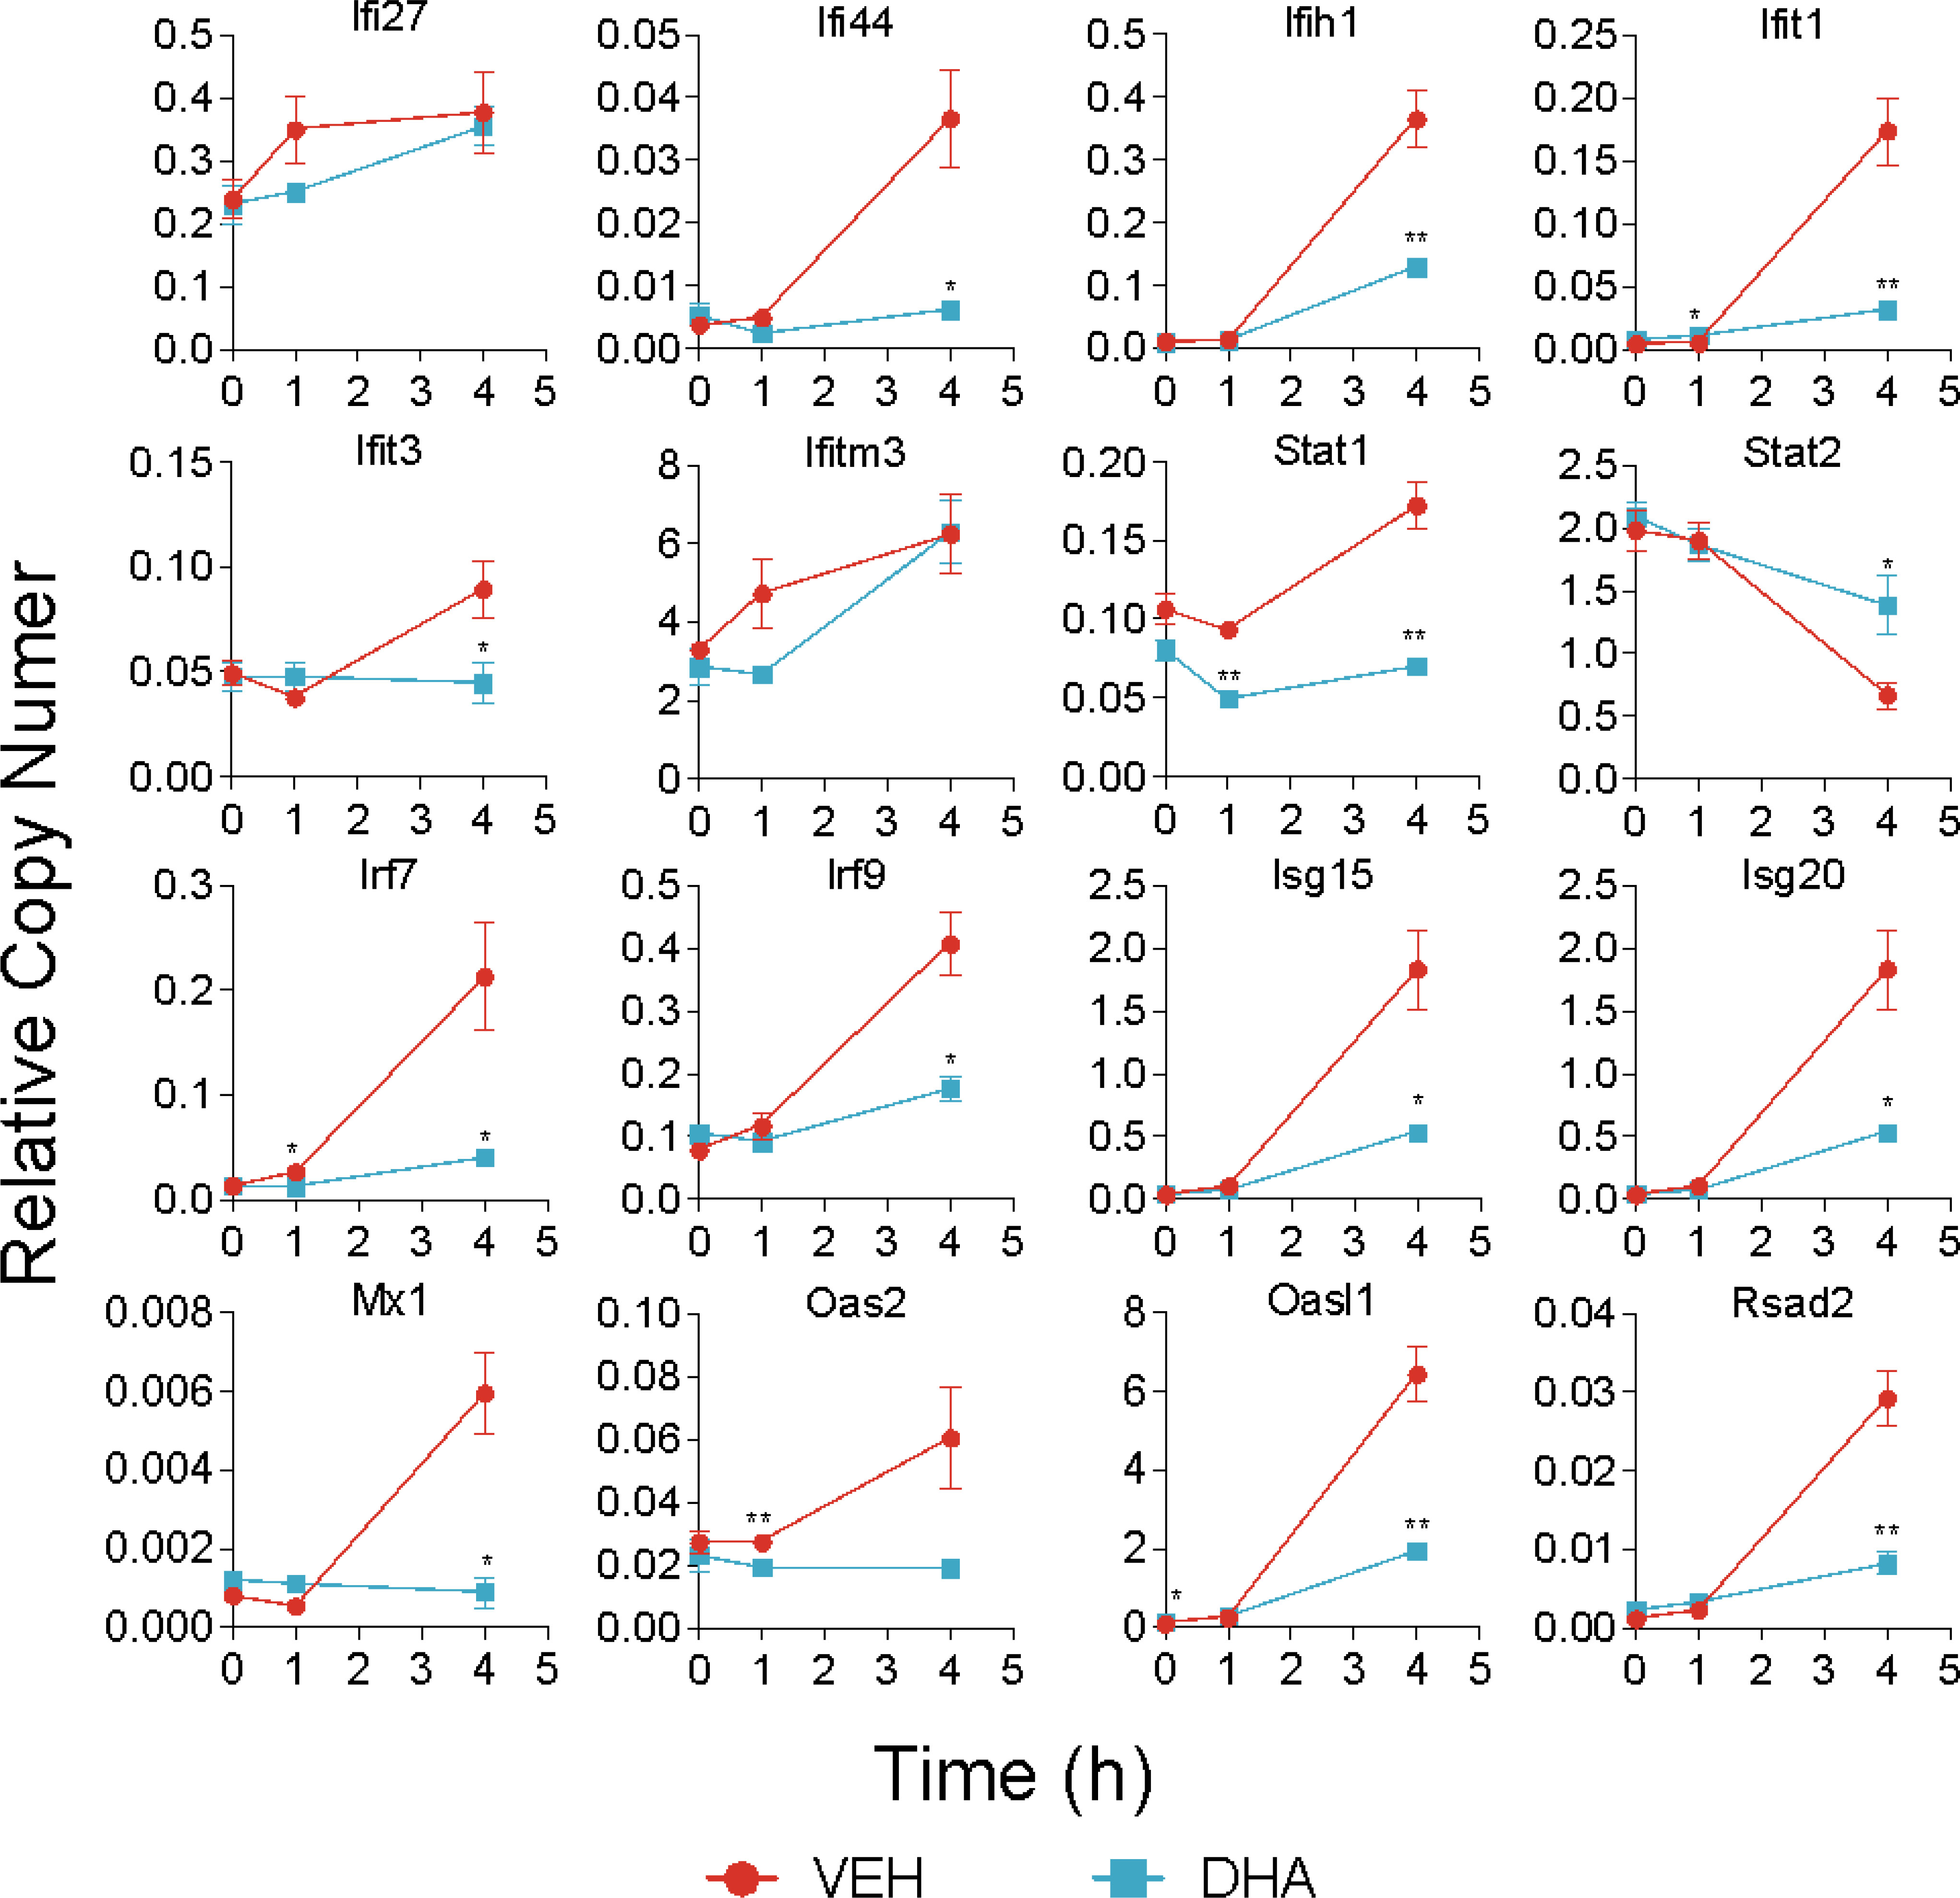
Figure 9 DHA suppresses expression of selected IFN1-regulated genes. A panel of IFN1-regulated genes was investigated by bulk qPCR in samples treated with LPS for 1 and 4 h. Cells were pre-treated with DHA or Veh for 24 h prior to LPS treatment. Asterisks indicate significant differences (*p<0.05, **p<0.01) between the DHA and Veh groups, n=3.
Distinct subsets of LPS-treated cells are driven by NF-κB and Irf signaling
To identify in an unbiased manner which transcription factor programs (regulons) were most strongly induced by 4 h LPS treatment, we determined regulon scores for individual cells using the SCENIC workflow in R (27). Regulons consist of a group of co-expressed genes known to be induced by the same transcription factor, whose expression is also increased with expression of the target genes. Regulons that were significantly different between Veh and DHA at 4 h following LPS treatment, included transcription factors involved in NF-κB signaling (Nfkb1 and Rel) and IFN signaling (Irf7, Stat1, and Stat2) (Figure 10A). The Nfbk1 and Rel genes encode NF-κB family members p50 and c-Rel, respectively. The NF-κB p50 subunit dimerizes with the NF-κB p65 subunit, forming the most abundant of the Rel/NF-κB heterodimers (70, 71). DHA suppressed the Rel and NF-κB regulons at 4 h, though not completely (Figure 10B). Although the Irf7, Stat1, and Stat2 regulons were increased to a lesser extent than the Rel and NF-κB regulons, they were almost completely ablated by DHA. When investigating the regulon scores for individual cells, UMAP clustering identified that a cluster of cells with high expression of genes in the Irf7, Stat1, and Stat2 regulons among cells treated with LPS for 4h. This is distinct from the pattern of NF-κB and Rel expression, which is more homogenously expressed in LPS-treated cells (Figure 10C). Most cells in the region with the highest Irf7, Stat1, and Stat2 regulon scores were Veh.LPS cells, confirming that treatment with DHA inhibits the induction of these gene expression programs.
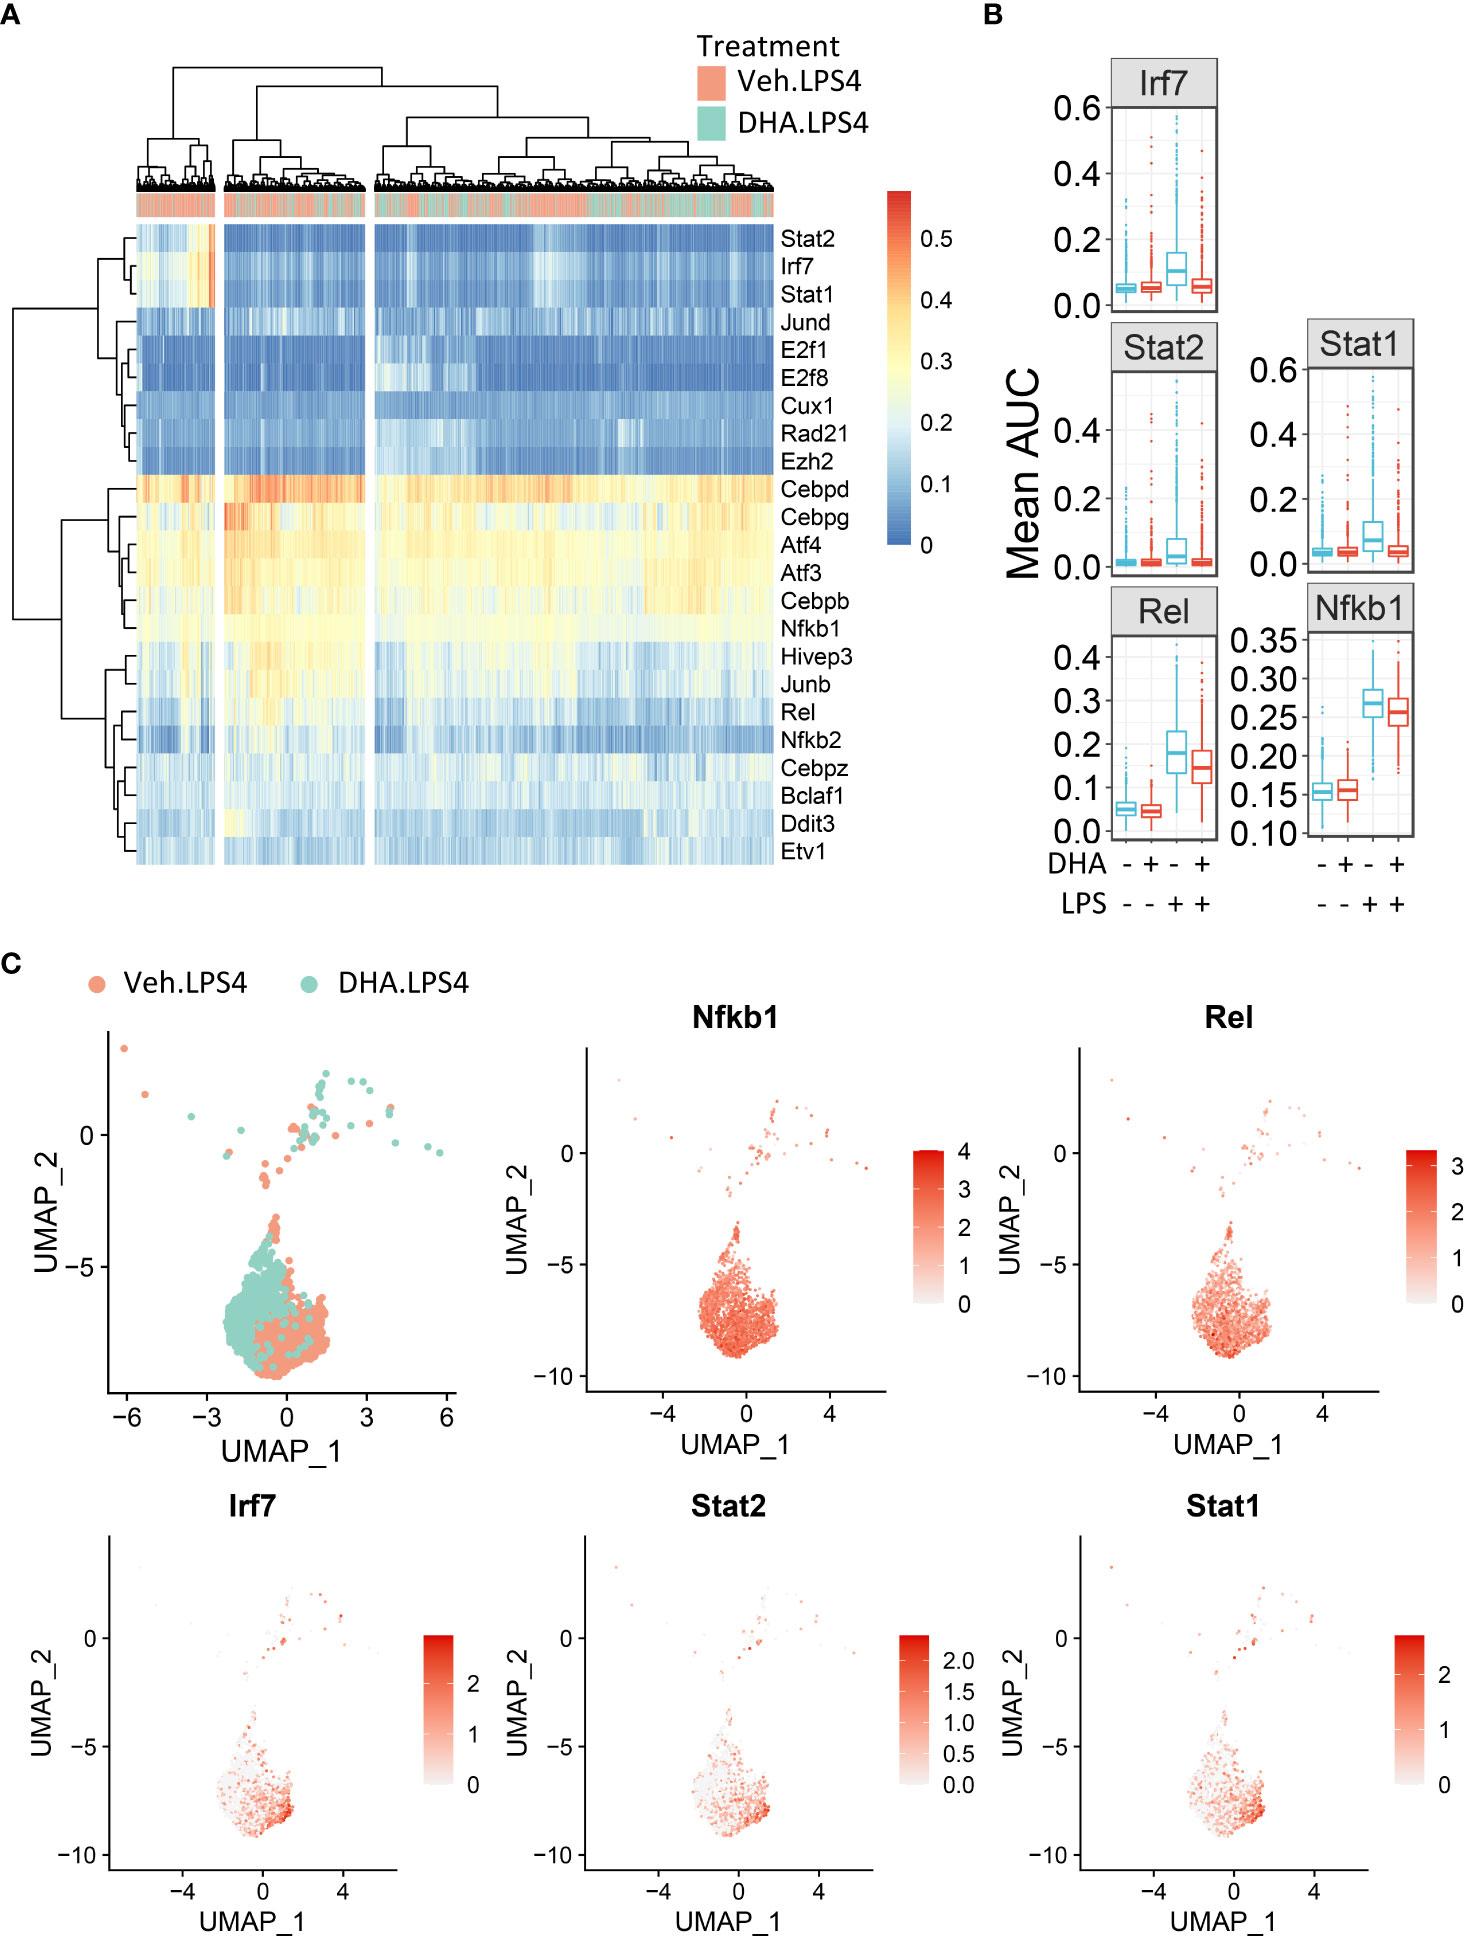
Figure 10 FLMs with high IFN1-regulated gene expression cluster together. (A) Regulon scores for cells in each group were generated using the SCENIC workflow. Regulons were selected that were significantly different between Veh.LPS.4 and DHA.LPS.4. Cells in the Veh.LPS.4 and DHA.LPS.4 treatment groups (as indicated by the horizontal bar above the heatmap) were analyzed for selected regulons. Clustering was performed using Ward’s method in the pheatmap tool in R Studio. The regulon AUC values were directly plotted without scaling the heatmap. (B) Boxplots for regulon scores were generated to identify differences between treatment groups. Irf7, Stat1, Stat2, NF-κB, and Rel regulons were increased by LPS at 4 hr. DHA reduced the regulon scores for NF-κB and Rel regulons and completely suppressed scores for Irf7, Stat1, and Stat2 regulons scores. (C) The Seurat FeaturePlot function was used to color cells from Veh.LPS.4 and DHA.LPS.4 treatment groups according to Irf7, Stat1, Stat2, Rel, and NF-κB1 regulon expression.
Previously published bulk mRNA studies described early, middle, and late time-dependent gene expression patterns in macrophages treated with LPS (7, 8, 72, 73). These studies assessed timepoints that extended beyond 4 h and found that many inflammatory cytokines and chemokines peak at 4 h whereas induction of most IFN regulated genes occurs slightly later. Differential activation of LPS-triggered genes can be explained by divergent signaling pathways induced by TLR4 activation, which have been comprehensively described (6, 74). Briefly, TLR4 activation induces signaling cascades initiating with the adapter protein MyD88 or the heterodimer TRIF/TRAM. MyD88-dependent signaling results in activation of the kinase transforming growth factor β-activated kinase 1 (TAK1) which phosphorylates IκB kinase (IKK) α/β. IKKα/β phosphorylates IκB. This frees the transcription factor NF-κB to translocate to the nucleus. Using Western blotting, we confirmed that LPS induced, and DHA suppressed this pathway in our FLM model (Figure S4).
The observations presented herein suggest that DHA impedes progression of TLR4-triggered IFN activation, a process that occurs more slowly than TLR4-triggered NF-κB activation. LPS binding can also induce endocytosis of the TLR4 receptor complex, resulting in a cascade of TRIF/TRAM and TBK1/IKKi activation, which phosphorylate IRF3 and IRF7. Phosphorylated IRF3 and IRF7 then translocate to the nucleus where they initiate I IFN1 signaling (75). Sheikh and coworkers (76) demonstrated that LPS-induced IFN1-regulated gene expression is critically dependent on intermediary IFN-β production and autocrine signaling through type I IFN receptors. Consistent with this possibility, we found Ifnar1 and Ifnar2 are homogenously expressed at a high level in the FLMs across the time clusters (Figure 11A) and that modest Ifnb1 expression is detectable in some FLMs in the Veh/LPS 4 h group but not the DHA/LPS 4 h group (Figure 11B). The moderate response is likely due to the early timepoint at which the cells were collected and the limited sensitivity of scRNAseq for detecting low abundance transcripts. STAT1 and STAT2 are not directly activated by LPS, but instead are activated by IFNα/β receptor signaling. Though SCENIC predicted STAT1/2 activation, we conclude that this is due to the high degree of target gene overlap between these transcription factors and IRF7 (Figure 11C). Expression of genes predicted to be solely STAT1 or STAT2 is very low compared to IRF7-specific-target genes, supporting the argument that at 4 h LPS, IRF7 is the primary transcription factor driving this phenotype (Figure 11D). Thus, we predict that STAT1/2 activation would follow shortly after this timepoint due to release of IFNβ.
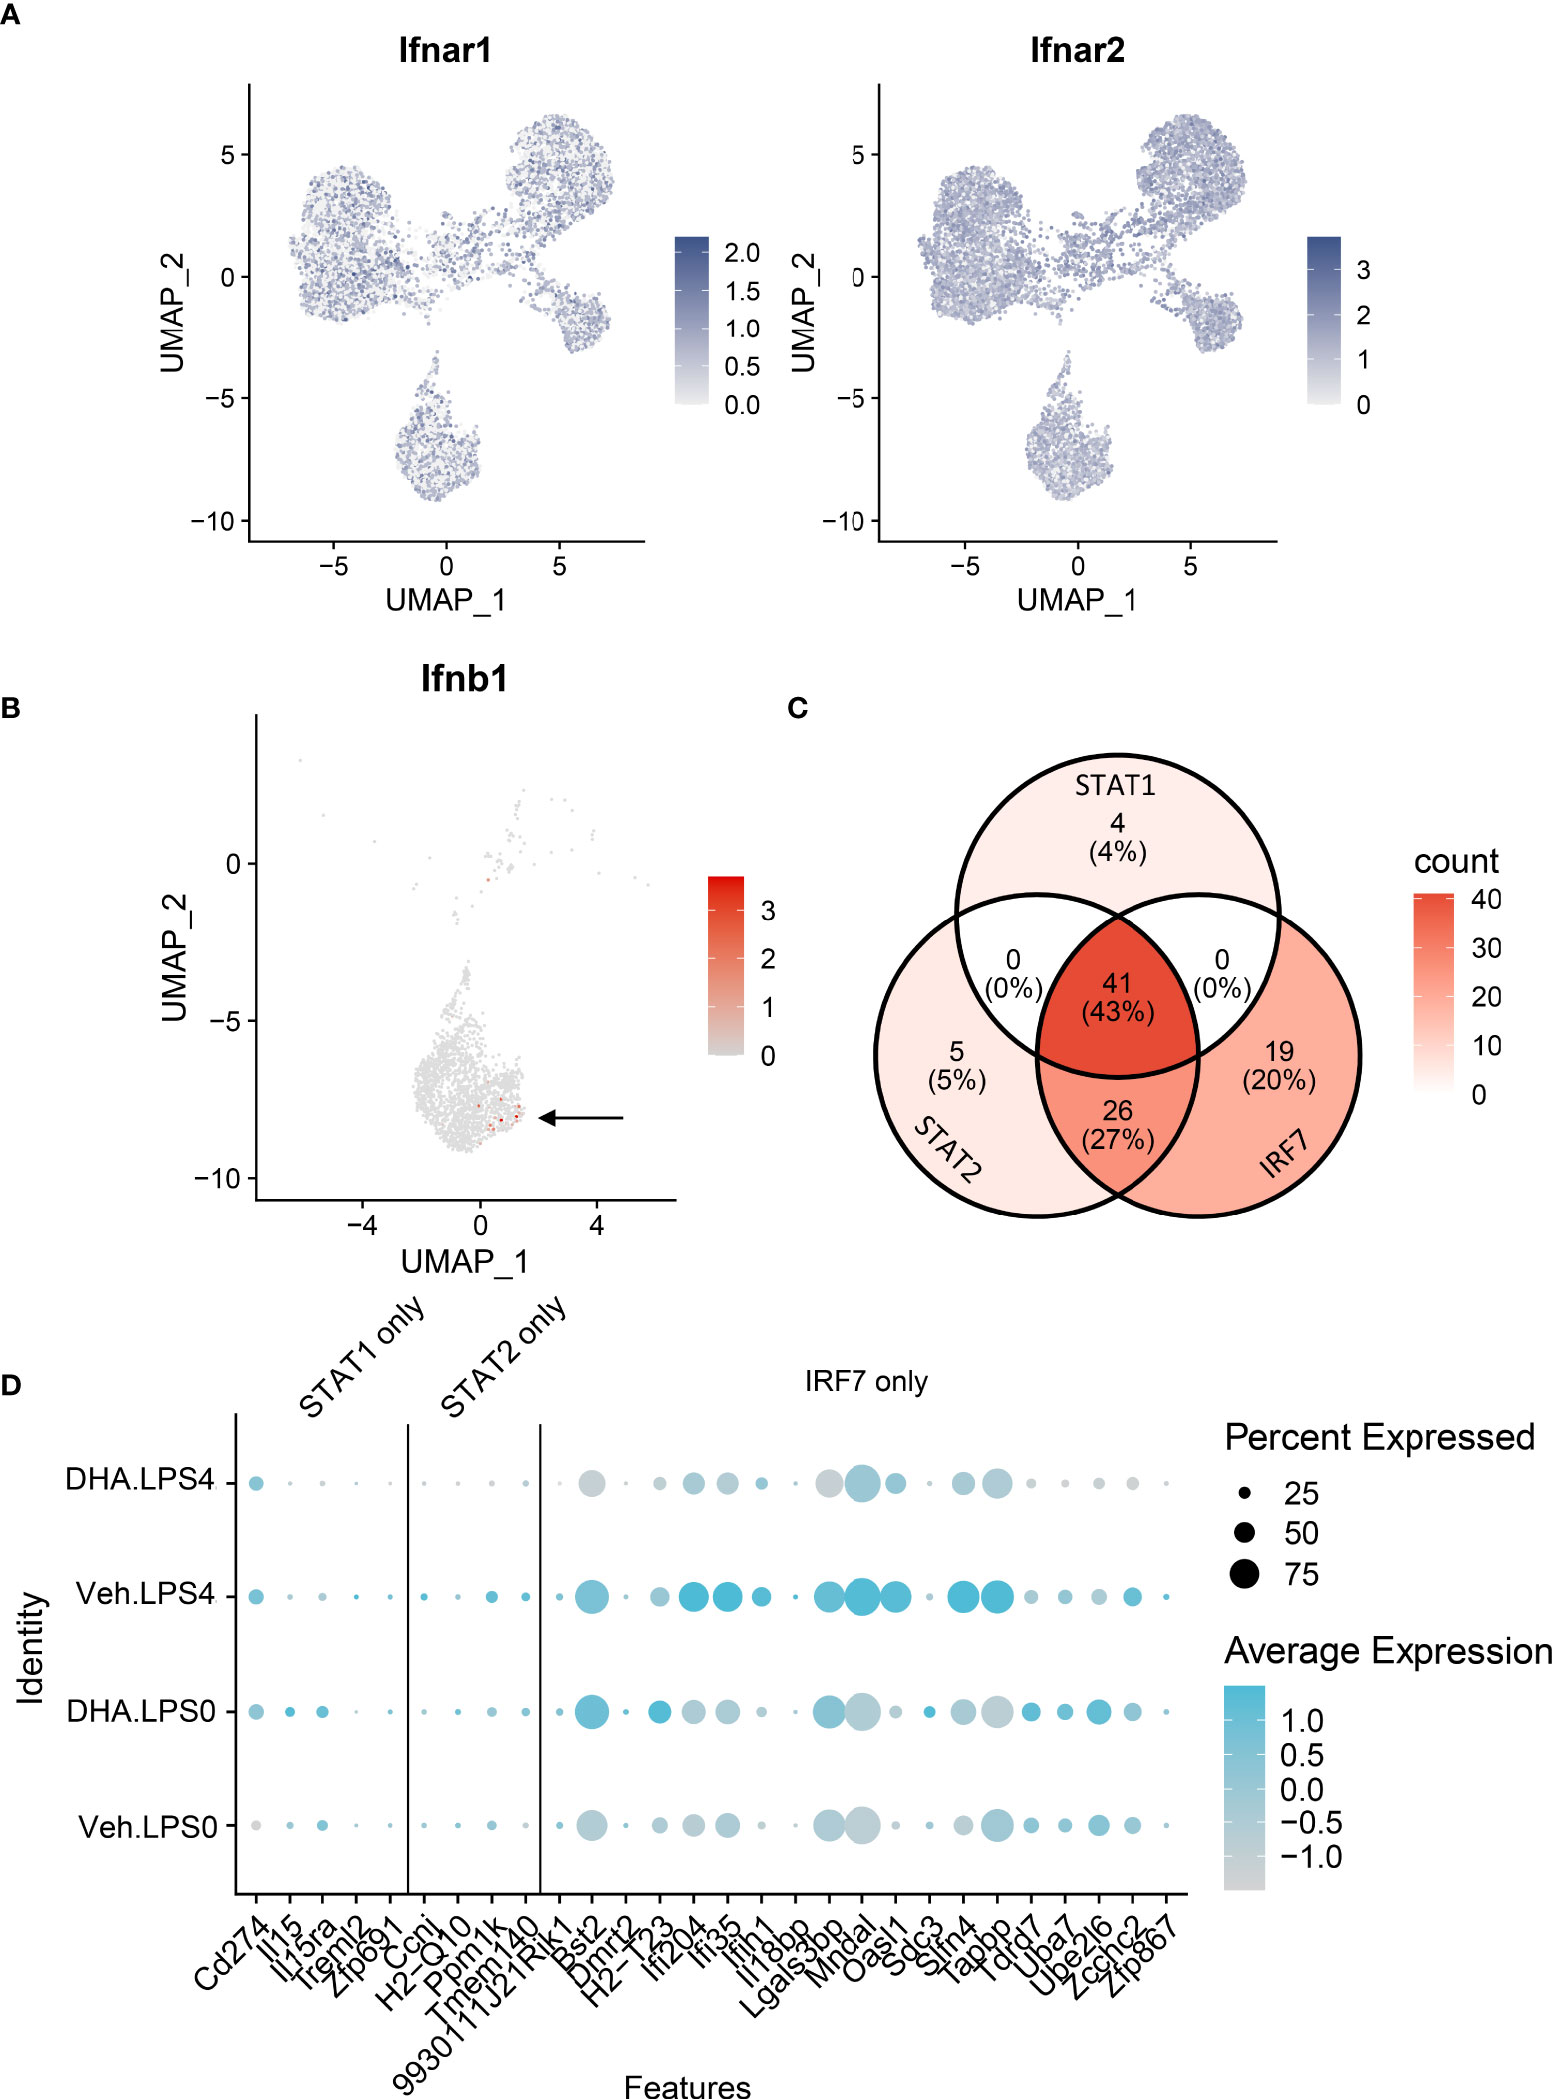
Figure 11 IFN1-regulated gene expression at 4 h post-LPS is driven by IRF rather than STAT activity. (A) Ifnar1 and Ifnar2 are homogenously expressed at a high level in the FLMs across the time clusters. (B) A small number of cells express Ifnb (arrow), and it is limited primarily to Veh-treated cells. (C) The majority of the genes identified in the STAT1 and STAT2 regulons are also IRF7 targets. (D) Genes driven by IRF7 alone are more highly expressed than genes driven by either STAT1 or STAT2 alone. Genes are presented using the Seurat DotPlot function, where the size of the dot indicates the percent of cells expressing the gene and the depth of the dot color indicates the average expression of the gene across the cells in which it is expressed.
The observation that DHA suppresses TLR4-driven IFN1-regulated gene responses is of high translational relevance. Upregulated IFN1 responses contribute to the development of multiple forms of autoimmunity including lupus, systemic sclerosis, Sjogren’s syndrome (77). Indeed, successful clinical trials of anifrolumab, an anti-IFNAR monoclonal antibody (78), led to its approval by the USFDA in 2021 for lupus treatment (79). Relatedly, in a prior in vivo study, we observed that DHA supplementation significantly reduces IFN1-regulated gene expression in lupus-prone mice induced by exposure to the autoimmune trigger crystalline silica (80). It is particularly notable that many of the same IFN1-regulated genes identified in vivo were significantly enhanced here by LPS at 4 h and suppressed by DHA. Intriguingly, in both our in vivo and in vitro experiments, DHA suppresses the IFN1 pathway more strongly than other inflammatory pathways including NF-κB signaling. While Kobayashi and coworkers similarly found that the omega-3 fatty acids suppressed IFN1 gene expression in imiquimod (IMQ)-induced murine lupus (81), the underlying molecular mechanisms are unclear. Further investigations into how DHA preferentially suppresses could lead to novel therapies to effectively target this potent inflammatory response in autoimmune disease.
Limitations
This exploratory study had several limitations that will necessitate additional expanded experimentation. First, extending the time window for LPS treatment could provide greater insight into the pathways most effectively targeted by DHA. Also, even though we identified that upstream inflammatory pathways (i.e., NF-κB signaling) were influenced by DHA supplementation, there is further need to confirm the effects on other key proteins associated with additional pathways identified, or on resultant metabolites produced (i.e., cholesterol metabolism). Furthermore, while the use of SCENIC analysis to identify regulons allows us to infer transcription factor activity based on concordant upregulation of the transcription factor and its putative target genes, this approach cannot prove activation of transcription factors of interest. Additional experiments would need to be performed to confirm the activation of NRF2, IRF7, STAT1, and STAT2. Finally, although the in vitro macrophage model used here is similar to an inflammatory monocyte-derived macrophage, it might not precisely mimic tissue-specific macrophage populations observed in vivo. Thus, many of the pathways identified here need to be confirmed in tissue-relevant models such as alveolar-like macrophages derived by culturing fetal liver cells with GM-CSF and TGF-β (82).
Conclusions
As an innate immune population, macrophages act as sentinels to signal the presence of foreign molecules while simultaneously functioning to destroy or sequester invading microbes or injurious particles. Cytokines released by macrophages modulate phenotype and function of incoming immune cells, influencing the inflammatory response and setting the stage for an adaptive immune response. Sets of genes are upregulated in conjunction with each other at specified times, triggering a sequence of responses in the cell and extracellular milieu. Here we used scRNAseq to discern how DHA influences LPS-induced gene expression in FLMs, a primary, heterogeneous self-renewing macrophage model. This strategy allowed us to capture heterogeneity within a single population of treated cells, with groups of cells within the same LPS treatment group showing different patterns of inflammatory gene expression. As depicted in Figure 12, analyzing cells at different timepoints following LPS treatment permitted us to identify putative anti-inflammatory transcriptional mechanisms sequentially influenced by DHA in the absence of inflammatory stimuli (0 h), immediately following an inflammatory stimulus (1 h), and in the early stages of the inflammatory response (4 h). First, we found that DHA promoted basal antioxidant NRF2-target gene expression. Second, our analyses further uncovered cholesterol synthesis as a potential metabolic pathway differentially modulated by DHA and LPS that may be central to DHA-mediated suppression of TLR4-dependent signaling. Third, we observed that DHA suppresses IFN-driven genes in addition to NF-κB-driven genes, which provides a new perspective on how the multifaceted TLR4-induced signaling pathway is influenced by DHA. Employing scRNAseq enabled us to ascertain that IFN-driven genes are not homogenously expressed in a population of LPS-treated cells, which reveal a role for DHA in blocking or slowing cellular pathways that promote IFN signaling. Taken together, our findings herald lines of future research to investigate precision nutritional intervention with omega-3 PUFAs to combat chronic inflammation and progression of autoimmune disease.
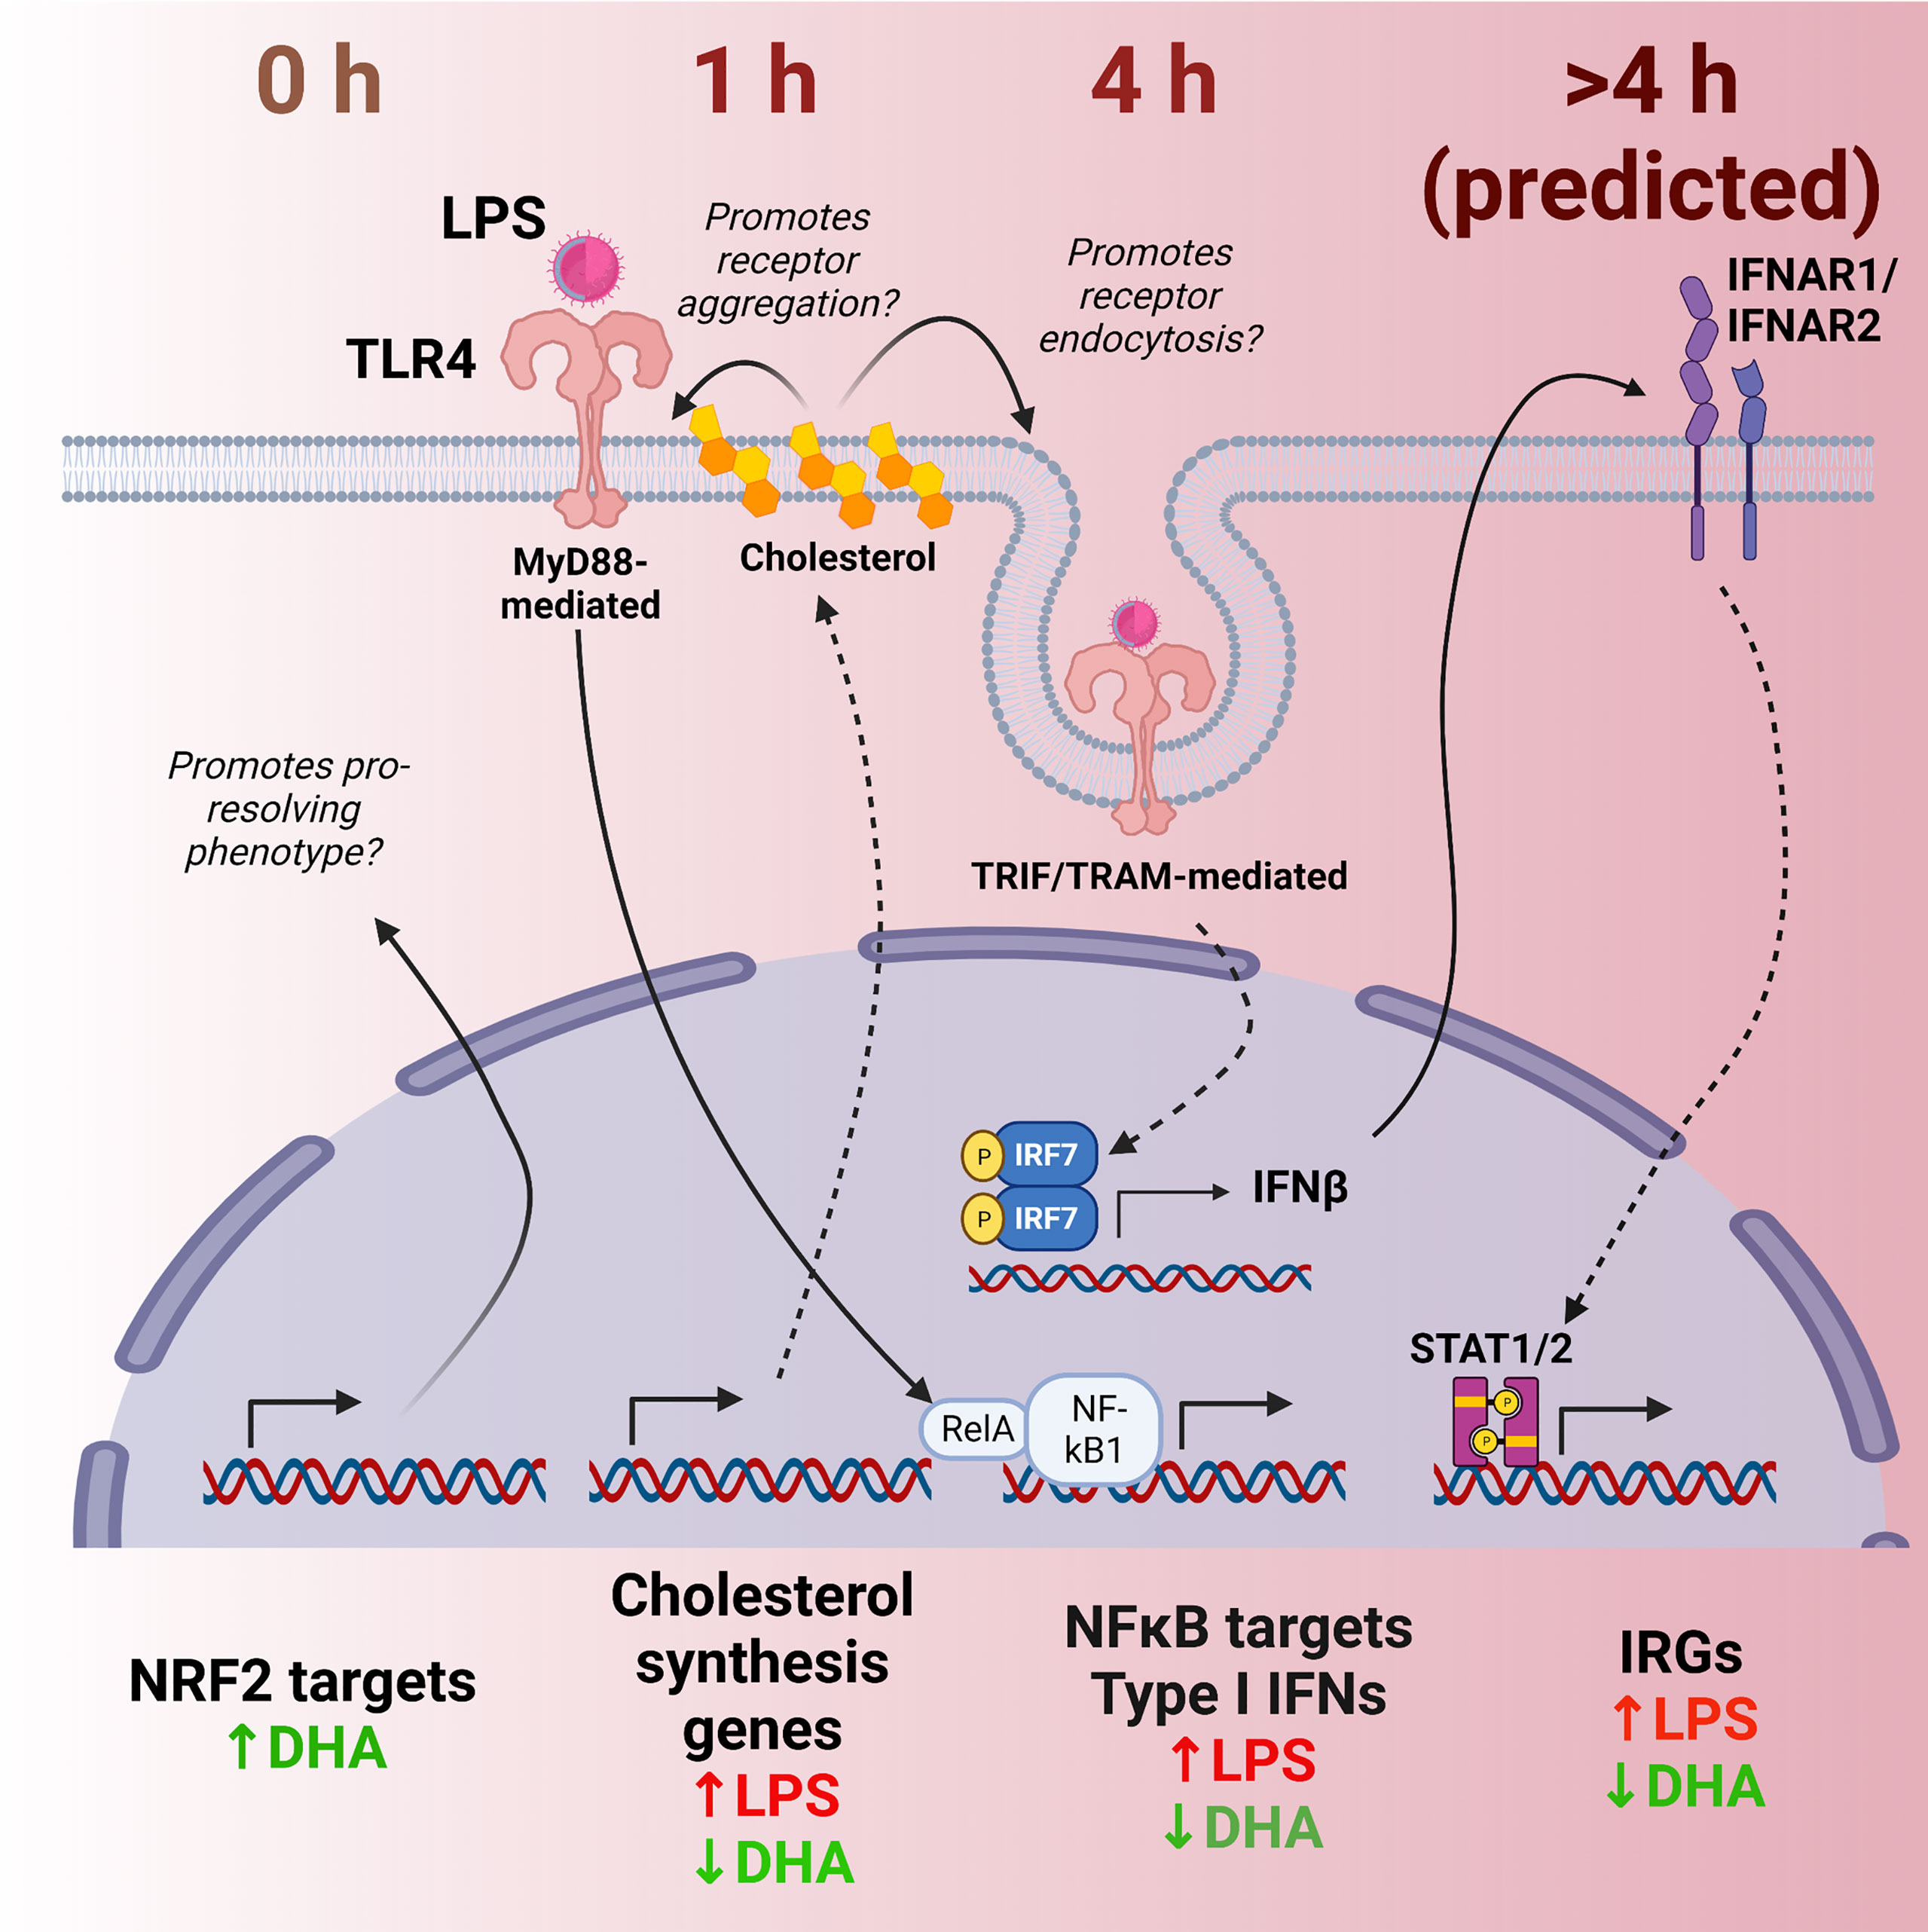
Figure 12 Putative model for DHA suppression of LPS-induced proinflammatory and IFN1-regulated gene expression in the macrophage. Time-dependent transcriptional changes elicited by DHA and/or LPS reveal multiple potential mechanisms by which DHA may counteract the inflammatory response to LPS. First, at 0 h (in the absence of LPS), DHA triggers expression of NRF2 target genes, which may promote a pro-resolving macrophage phenotype. At 1 h following LPS exposure, DHA suppresses LPS-triggered cholesterol genes, which may prevent cholesterol-mediated facilitation of further TLR4 signaling. At 4h following LPS exposure, DHA downregulates NF-κB-target and IFN1-regulated gene (IRGs) including IFN-β, likely preventing robust induction of further IFN-response at ≥ 4h.
Data availability statement
The data presented in the study are deposited in the NCBI GEO repository, accession number GSE207902.
Ethics statement
The protocol for FLM isolation was reviewed and approved by Michigan State University Institutional Animal Care and Use Committee.
Author contributions
KW: initial study design, data analysis/interpretation, figure preparation, manuscript preparation, project funding. FR, BW: data curation, data analysis/interpretation, figure preparation, manuscript preparation. JH: initial study design, project funding, manuscript preparation. JP: initial study design, manuscript preparation, supervision, project funding. All authors contributed to the article and approved the submitted version.
Funding
This research was funded by NIH ES027353 (JP), NIH F31ES030593 (KW), NIH T32ES007255 (KW), Lupus Foundation of America (JP, KW), USDA National Institute of Food and Agriculture Hatch Projects 1020129, (JP), the Dr. Robert and Carol Deibel Family Endowment (JP), ZonMW grant no. 91116011 (BW) and the Dr. Albert C. and Lois E. Dehn Endowment in Veterinary Medicine (JH).
Acknowledgments
We would like to thank Anthony Bach and Dr. Norb Kaminiski for their assistance with isolation of single cells and preparation of Illumina sequencing libraries.
Conflict of interest
The authors declare that the research was conducted in the absence of any commercial or financial relationships that could be construed as a potential conflict of interest.
Publisher’s note
All claims expressed in this article are solely those of the authors and do not necessarily represent those of their affiliated organizations, or those of the publisher, the editors and the reviewers. Any product that may be evaluated in this article, or claim that may be made by its manufacturer, is not guaranteed or endorsed by the publisher.
Supplementary material
The Supplementary Material for this article can be found online at: https://www.frontiersin.org/articles/10.3389/fimmu.2022.993614/full#supplementary-material
References
1. Murray PJ. Macrophage polarization. Annu Rev Physiol (2017) 79(1):541–66. doi: 10.1146/annurev-physiol-022516-034339
2. Yang S, Yuan HQ, Hao YM, Ren Z, Qu SL, Liu LS, et al. Macrophage polarization in atherosclerosis. Clin Chim Acta (2020) 501:142–6. doi: 10.1016/j.cca.2019.10.034
3. Lumeng CN, Bodzin JL, Saltiel AR. Obesity induces a phenotypic switch in adipose tissue macrophage polarization. J Clin Invest (2007) 117(1):175–84. doi: 10.1172/JCI29881
4. Udalova IA, Mantovani A, Feldmann M. Macrophage heterogeneity in the context of rheumatoid arthritis. Nat Rev Rheum (2016) 12(8):472–85. doi: 10.1038/nrrheum.2016.91
5. Herrada AA, Escobedo N, Iruretagoyena M, Valenzuela RA, Burgos PI, Cuitino L, et al. Innate immune cells’ contribution to systemic lupus erythematosus. Front Immunol (2019) 10:772. doi: 10.3389/fimmu.2019.00772
6. Palsson-McDermott EM, O’Neill LA. Signal transduction by the lipopolysaccharide receptor, toll-like receptor-4. Immunology (2004) 113(2):153–62. doi: 10.1111/j.1365-2567.2004.01976.x
7. Baillie JK, Arner E, Daub C, De Hoon M, Itoh M, Kawaji H, et al. Analysis of the human monocyte-derived macrophage transcriptome and response to lipopolysaccharide provides new insights into genetic aetiology of inflammatory bowel disease. PloS Genet (2017) 13(3):e1006641. doi: 10.1371/journal.pgen.1006641
8. Nilsson R, Bajic VB, Suzuki H, di Bernardo D, Bjorkegren J, Katayama S, et al. Transcriptional network dynamics in macrophage activation. Genomics (2006) 88(2):133–42. doi: 10.1016/j.ygeno.2006.03.022
9. Lawrence T, Gilroy DW. Chronic inflammation: A failure of resolution? Int J Exp Pathol (2007) 88(2):85–94. doi: 10.1111/j.1365-2613.2006.00507.x
10. Barnig C, Bezema T, Calder PC, Charloux A, Frossard N, Garssen J, et al. Activation of resolution pathways to prevent and fight chronic inflammation: Lessons from asthma and inflammatory bowel disease. Front Immunol (2019) 10:1699. doi: 10.3389/fimmu.2019.01699
11. Adam O, Beringer C, Kless T, Lemmen C, Adam A, Wiseman M, et al. Anti-inflammatory effects of a low arachidonic acid diet and fish oil in patients with rheumatoid arthritis. Rheum Int (2003) 23(1):27–36. doi: 10.1007/s00296-002-0234-7
12. O’Keefe EL, Harris WS, DiNicolantonio JJ, Elagizi A, Milani RV, Lavie CJ, et al. Sea Change for marine omega-3s: Randomized trials show fish oil reduces cardiovascular events. Mayo Clin Proc (2019) 94(12):2524–33. doi: 10.1016/j.mayocp.2019.04.027
13. Harris WS, Von Schacky C. The omega-3 index: A new risk factor for death from coronary heart disease? Prev Med (2004) 39(1):212–20. doi: 10.1016/j.ypmed.2004.02.030
14. Wierenga KA, Strakovsky RS, Benninghoff AD, Rajasinghe LD, Lock AL, Harkema JR, et al. Requisite omega-3 hufa biomarker thresholds for preventing murine lupus flaring. Front Immunol (2020) 11:1796. doi: 10.3389/fimmu.2020.01796
15. Akbar U, Yang M, Kurian D, Mohan C. Omega-3 fatty acids in rheumatic diseases: A critical review. J Clin Rheum (2017) 23(6):330–9. doi: 10.1097/RHU.0000000000000563
16. Calder PC. Omega-3 fatty acids and inflammatory processes: From molecules to man. Biochem Soc Trans (2017) 45(5):1105–15. doi: 10.1042/BST20160474
17. Ostermann AI, West AL, Schoenfeld K, Browning LM, Walker CG, Jebb SA, et al. Plasma oxylipins respond in a linear dose-response manner with increased intake of epa and dha: Results from a randomized controlled trial in healthy humans. Am J Clin Nutr (2019) 109(5):1251–63. doi: 10.1093/ajcn/nqz016
18. Wierenga KA, Wee J, Gilley KN, Rajasinghe LD, Bates MA, Gavrilin MA, et al. Docosahexaenoic acid suppresses silica-induced inflammasome activation and il-1 cytokine release by interfering with priming signal. Front Immunol (2019) 10:2130. doi: 10.3389/fimmu.2019.02130
19. Gutierrez S, Svahn SL, Johansson ME. Effects of omega-3 fatty acids on immune cells. Int J Mol Sci (2019) 20(20):5028. doi: 10.3390/ijms20205028
20. Fejer G, Wegner MD, Gyory I, Cohen I, Engelhard P, Voronov E, et al. Nontransformed, gm-Csf-Dependent macrophage lines are a unique model to study tissue macrophage functions. Proc Natl Acad Sci USA (2013) 110(24):E2191–8. doi: 10.1073/pnas.1302877110
21. Bates MA, Akbari P, Gilley KN, Wagner JG, Li N, Kopec AK, et al. Dietary docosahexaenoic acid prevents silica-induced development of pulmonary ectopic germinal centers and glomerulonephritis in the lupus-prone Nzbwf1 mouse. Front Immunol (2018) 9:2002. doi: 10.3389/fimmu.2018.02002
22. Wiesenfeld PW, Babu US, O’Donnell MW. Effect of long-chain fatty acids in the culture medium on fatty acid composition of wehi-3 and J774a.1 cells. Comp Biochem Physiol B-Biochem Mol Biol (2001) 128(1):123–34. doi: 10.1016/s1096-4959(00)00305-5
23. Zheng GX, Terry JM, Belgrader P, Ryvkin P, Bent ZW, Wilson R, et al. Massively parallel digital transcriptional profiling of single cells. Nat Commun (2017) 8:14049. doi: 10.1038/ncomms14049
24. Stuart T, Butler A, Hoffman P, Hafemeister C, Papalexi E, Mauck WM 3rd, et al. Comprehensive integration of single-cell data. Cell (2019) 177(7):1888–902.e21. doi: 10.1016/j.cell.2019.05.031
25. StudioTeam R. Rstudio: Integrated development environment for r Boston, MA (2021). Available at: http://www.rstudio.com/http://www.rstudio.com/.
26. CoreTeam R. R: A language and environment for statistical computing. (Vienna, Austria:R Foundation for Statistical Computing) (2021). Available at: https://www.R-project.org/https://www.R-project.org/.
27. Aibar S, Gonzalez-Blas CB, Moerman T, Huynh-Thu VA, Imrichova H, Hulselmans G, et al. Scenic: Single-cell regulatory network inference and clustering. Nat Methods (2017) 14(11):1083–6. doi: 10.1038/nmeth.4463
28. Kolde R. Pheatmap: Pretty heatmaps. r package version 1.0.12 (2019). Available at: https://CRAN.R-project.org/package=pheatmaphttps://CRAN.R-project.org/package=pheatmap.
29. Gilley KN, Wierenga KA, Chauhuan PS, Wagner JG, Lewandowski RP, Ross EA, et al. Influence of total Western diet on docosahexaenoic acid suppression of silica-triggered lupus flaring in Nzbwf1 mice. PloS One (2020) 15(5):e0233183. doi: 10.1371/journal.pone.0233183
30. Fahy RJ, Exline MC, Gavrilin MA, Bhatt NY, Besecker BY, Sarkar A, et al. Inflammasome mrna expression in human monocytes during early septic shock. Am J Respir Crit Care Med (2008) 177(9):983–8. doi: 10.1164/rccm.200703-418OC
32. Kurotaki D, Sasaki H, Tamura T. Transcriptional control of monocyte and macrophage development. Int Immunol (2017) 29(3):97–107. doi: 10.1093/intimm/dxx016
33. Gordon S, Pluddemann A, Martinez Estrada F. Macrophage heterogeneity in tissues: Phenotypic diversity and functions. Immunol Rev (2014) 262(1):36–55. doi: 10.1111/imr.12223
34. Dang D, Taheri S, Das S, Ghosh P, Prince LS, Sahoo D. Computational approach to identifying universal macrophage biomarkers. Front Physiol (2020) 11:275. doi: 10.3389/fphys.2020.00275
35. Schittenhelm L, Hilkens CM, Morrison VL. Beta2 integrins as regulators of dendritic cell, monocyte, and macrophage function. Front Immunol (2017) 8:1866. doi: 10.3389/fimmu.2017.01866
36. Grajchen E, Wouters E, van de Haterd B, Haidar M, Hardonniere K, Dierckx T, et al. Cd36-mediated uptake of myelin debris by macrophages and microglia reduces neuroinflammation. J Neuroinflamm (2020) 17(1):224. doi: 10.1186/s12974-020-01899-x
37. Tonelli C, Chio IIC, Tuveson DA. Transcriptional regulation by Nrf2. Antioxid Redox Signal (2018) 29(17):1727–45. doi: 10.1089/ars.2017.7342
38. Jain A, Lamark T, Sjottem E, Larsen KB, Awuh JA, Overvatn A, et al. P62/Sqstm1 is a target gene for transcription factor Nrf2 and creates a positive feedback loop by inducing antioxidant response element-driven gene transcription. J Biol Chem (2010) 285(29):22576–91. doi: 10.1074/jbc.M110.118976
39. Gozzelino R, Jeney V, Soares MP. Mechanisms of cell protection by heme oxygenase-1. Annu Rev Pharmacol Toxicol (2010) 50:323–54. doi: 10.1146/annurev.pharmtox.010909.105600
40. Drolet J, Buchner-Duby B, Stykel MG, Coackley C, Kang JX, Ma DWL, et al. Docosahexanoic acid signals through the Nrf2-Nqo1 pathway to maintain redox balance and promote neurite outgrowth. Mol Biol Cell (2021) 32(7):511–20. doi: 10.1091/mbc.E20-09-0599
41. Meital LT, Windsor MT, Perissiou M, Schulze K, Magee R, Kuballa A, et al. Omega-3 fatty acids decrease oxidative stress and inflammation in macrophages from patients with small abdominal aortic aneurysm. Sci Rep (2019) 9(1):12978. doi: 10.1038/s41598-019-49362-z
42. Tatsumi Y, Kato A, Sango K, Himeno T, Kondo M, Kato Y, et al. Omega-3 polyunsaturated fatty acids exert anti-oxidant effects through the nuclear factor (Erythroid-derived 2)-related factor 2 pathway in immortalized mouse schwann cells. J Diabetes Investig (2019) 10(3):602–12. doi: 10.1111/jdi.12931
43. Wang H, Khor TO, Saw CL, Lin W, Wu T, Huang Y, et al. Role of Nrf2 in suppressing lps-induced inflammation in mouse peritoneal macrophages by polyunsaturated fatty acids docosahexaenoic acid and eicosapentaenoic acid. Mol Pharm (2010) 7(6):2185–93. doi: 10.1021/mp100199m
44. Yum HW, Park J, Park HJ, Shin JW, Cho YY, Kim SJ, et al. Endogenous omega-3 fatty acid production by fat-1 transgene and topically applied docosahexaenoic acid protect against uvb-induced mouse skin carcinogenesis. Sci Rep (2017) 7(1):11658. doi: 10.1038/s41598-017-11443-2
45. Gao L, Wang J, Sekhar KR, Yin H, Yared NF, Schneider SN, et al. Novel n-3 fatty acid oxidation products activate Nrf2 by destabilizing the association between Keap1 and Cullin3. J Biol Chem (2007) 282(4):2529–37. doi: 10.1074/jbc.M607622200
46. Stillwell W, Wassall SR. Docosahexaenoic acid: Membrane properties of a unique fatty acid. Chem Phys Lipids (2003) 126(1):1–27. doi: 10.1016/s0009-3084(03)00101-4
47. Rajagopalan H, Lengauer C. Hcdc4 and genetic instability in cancer. Cell Cycle (2004) 3(6):693–4. doi: 10.4161/cc.3.6.940
48. Chenais B, Cornec M, Dumont S, Marchand J, Blanckaert V. Transcriptomic response of breast cancer cells mda-Mb-231 to docosahexaenoic acid: Downregulation of lipid and cholesterol metabolism genes and upregulation of genes of the pro-apoptotic er-stress pathway. Int J Environ Res Public Health (2020) 17(10):3746. doi: 10.3390/ijerph17103746
49. Dai H, Wang L, Li L, Huang Z, Ye L. Metallothionein 1: A new spotlight on inflammatory diseases. Front Immunol (2021) 12:739918. doi: 10.3389/fimmu.2021.739918
50. Fan Y, Zhang J, Cai L, Wang S, Liu C, Zhang Y, et al. The effect of anti-inflammatory properties of ferritin light chain on lipopolysaccharide-induced inflammatory response in murine macrophages. Biochim Biophys Acta (2014) 1843(11):2775–83. doi: 10.1016/j.bbamcr.2014.06.015
51. Genin EC, Plutino M, Bannwarth S, Villa E, Cisneros-Barroso E, Roy M, et al. Chchd10 mutations promote loss of mitochondrial cristae junctions with impaired mitochondrial genome maintenance and inhibition of apoptosis. EMBO Mol Med (2016) 8(1):58–72. doi: 10.15252/emmm.201505496
52. Roberts TL, Idris A, Dunn JA, Kelly GM, Burnton CM, Hodgson S, et al. Hin-200 proteins regulate caspase activation in response to foreign cytoplasmic DNA. Science (2009) 323(5917):1057–60. doi: 10.1126/science.1169841
53. Zenarruzabeitia O, Vitalle J, Eguizabal C, Simhadri VR, Borrego F. The biology and disease relevance of Cd300a, an inhibitory receptor for phosphatidylserine and phosphatidylethanolamine. J Immunol (2015) 194(11):5053–60. doi: 10.4049/jimmunol.1500304
54. Watari K, Shibata T, Nabeshima H, Shinoda A, Fukunaga Y, Kawahara A, et al. Impaired differentiation of macrophage lineage cells attenuates bone remodeling and inflammatory angiogenesis in Ndrg1 deficient mice. Sci Rep (2016) 6:19470. doi: 10.1038/srep19470
55. Heinick A, Husser X, Himmler K, Kirchhefer U, Nunes F, Schulte JS, et al. Annexin A4 is a novel direct regulator of adenylyl cyclase type 5. FASEB J (2015) 29(9):3773–87. doi: 10.1096/fj.14-269837
56. Martinez FO, Helming L, Milde R, Varin A, Melgert BN, Draijer C, et al. Genetic programs expressed in resting and il-4 alternatively activated mouse and human macrophages: Similarities and differences. Blood (2013) 121(9):e57–69. doi: 10.1182/blood-2012-06-436212
57. Chen EY, Tan CM, Kou Y, Duan Q, Wang Z, Meirelles GV, et al. Enrichr: Interactive and collaborative Html5 gene list enrichment analysis tool. BMC Bioinf (2013) 14:128. doi: 10.1186/1471-2105-14-128
58. Dennis EA, Deems RA, Harkewicz R, Quehenberger O, Brown HA, Milne SB, et al. A mouse macrophage lipidome. J Biol Chem (2010) 285(51):39976–85. doi: 10.1074/jbc.M110.182915
59. Carroll RG, Zaslona Z, Galvan-Pena S, Koppe EL, Sevin DC, Angiari S, et al. An unexpected link between fatty acid synthase and cholesterol synthesis in proinflammatory macrophage activation. J Biol Chem (2018) 293(15):5509–21. doi: 10.1074/jbc.RA118.001921
60. Sheridan A, Wheeler-Jones CPD, Gage MC. The immunomodulatory effects of statins on macrophages. Immuno (2022) 2(2):317–43. doi: 10.3390/immuno2020021
61. Reed BD, Charos AE, Szekely AM, Weissman SM, Snyder M. Genome-wide occupancy of Srebp1 and its partners nfy and Sp1 reveals novel functional roles and combinatorial regulation of distinct classes of genes. PloS Genet (2008) 4(7):e1000133. doi: 10.1371/journal.pgen.1000133
62. Gong Y, Lee JN, Lee PC, Goldstein JL, Brown MS, Ye J. Sterol-regulated ubiquitination and degradation of insig-1 creates a convergent mechanism for feedback control of cholesterol synthesis and uptake. Cell Metab (2006) 3(1):15–24. doi: 10.1016/j.cmet.2005.11.014
63. Streicher R, Kotzka J, Muller-Wieland D, Siemeister G, Munck M, Avci H, et al. Srebp-1 mediates activation of the low density lipoprotein receptor promoter by insulin and insulin-like growth factor-I. J Biol Chem (1996) 271(12):7128–33. doi: 10.1074/jbc.271.12.7128
64. Huang LH, Chung HY, Su HM. Docosahexaenoic acid reduces sterol regulatory element binding protein-1 and fatty acid synthase expression and inhibits cell proliferation by inhibiting pakt signaling in a human breast cancer mcf-7 cell line. BMC Cancer (2017) 17(1):890. doi: 10.1186/s12885-017-3936-7
65. Hishikawa D, Yanagida K, Nagata K, Kanatani A, Iizuka Y, Hamano F, et al. Hepatic levels of dha-containing phospholipids instruct Srebp1-mediated synthesis and systemic delivery of polyunsaturated fatty acids. iScience (2020) 23(9):101495. doi: 10.1016/j.isci.2020.101495
66. Zhu X, Owen JS, Wilson MD, Li H, Griffiths GL, Thomas MJ, et al. Macrophage Abca1 reduces Myd88-dependent toll-like receptor trafficking to lipid rafts by reduction of lipid raft cholesterol. J Lipid Res (2010) 51(11):3196–206. doi: 10.1194/jlr.M006486
67. Kumar GA, Chattopadhyay A. Membrane cholesterol regulates endocytosis and trafficking of the Serotonin1a receptor: Insights from acute cholesterol depletion. Biochim Biophys Acta Mol Cell Biol Lipids (2021) 1866(4):158882. doi: 10.1016/j.bbalip.2021.158882
68. Recio C, Lucy D, Purvis GSD, Iveson P, Zeboudj L, Iqbal AJ, et al. Activation of the immune-metabolic receptor Gpr84 enhances inflammation and phagocytosis in macrophages. Front Immunol (2018) 9:1419. doi: 10.3389/fimmu.2018.01419
69. Cochain C, Vafadarnejad E, Arampatzi P, Pelisek J, Winkels H, Ley K, et al. Single-cell rna-seq reveals the transcriptional landscape and heterogeneity of aortic macrophages in murine atherosclerosis. Circ Res (2018) 122(12):1661–74. doi: 10.1161/CIRCRESAHA.117.312509
70. Zhang Q, Lenardo MJ, Baltimore D. 30 years of nf-kappab: A blossoming of relevance to human pathobiology. Cell (2017) 168(1-2):37–57. doi: 10.1016/j.cell.2016.12.012
71. Yu H, Lin L, Zhang Z, Zhang H, Hu H. Targeting nf-kappab pathway for the therapy of diseases: Mechanism and clinical study. Signal Transduct Target Ther (2020) 5(1):209. doi: 10.1038/s41392-020-00312-6
72. Pridans C, Irvine KM, Davis GM, Lefevre L, Bush SJ, Hume DA. Transcriptomic analysis of rat macrophages. Front Immunol (2020) 11:594594. doi: 10.3389/fimmu.2020.594594
73. Bush SJ, McCulloch MEB, Lisowski ZM, Muriuki C, Clark EL, Young R, et al. Species-specificity of transcriptional regulation and the response to lipopolysaccharide in mammalian macrophages. Front Cell Dev Biol (2020) 8:661. doi: 10.3389/fcell.2020.00661
74. Kawasaki T, Kawai T. Toll-like receptor signaling pathways. Front Immunol (2014) 5:461. doi: 10.3389/fimmu.2014.00461
75. Sin WX, Yeong JP, Lim TJF, Su IH, Connolly JE, Chin KC. Irf-7 mediates type I ifn responses in endotoxin-challenged mice. Front Immunol (2020) 11:640. doi: 10.3389/fimmu.2020.00640
76. Sheikh F, Dickensheets H, Gamero AM, Vogel SN, Donnelly RP. An essential role for ifn-beta in the induction of ifn-stimulated gene expression by lps in macrophages. J Leukoc Biol (2014) 96(4):591–600. doi: 10.1189/jlb.2A0414-191R
77. Fernandez-Ruiz R, Niewold TB. Type I interferons in autoimmunity. J Invest Dermatol (2022) 142(3 Pt B):793–803. doi: 10.1016/j.jid.2021.11.031
78. Loncharich MF, Anderson CW. Interferon inhibition for lupus with anifrolumab: Critical appraisal of the evidence leading to fda approval. ACR Open Rheum (2022) 4(6):486–91. doi: 10.1002/acr2.11414
79. Mullard A. Fda approves astrazeneca’s anifrolumab for lupus. Nat Rev Drug Discovery (2021) 20(9):658. doi: 10.1038/d41573-021-00139-y
80. Benninghoff AD, Bates MA, Chauhan PS, Wierenga KA, Gilley KN, Holian A, et al. Docosahexaenoic acid consumption impedes early interferon- and chemokine-related gene expression while suppressing silica-triggered flaring of murine lupus. Front Immunol (2019) 10:2851. doi: 10.3389/fimmu.2019.02851
81. Kobayashi A, Ito A, Shirakawa I, Tamura A, Tomono S, Shindou H, et al. Dietary supplementation with eicosapentaenoic acid inhibits plasma cell differentiation and attenuates lupus autoimmunity. Front Immunol (2021) 12:650856. doi: 10.3389/fimmu.2021.650856
Keywords: inflammatory gene expression, omega-3 polyunsaturated fatty acids, cholesterol metabolism, TLR4 signaling, NF-κB, IFN signaling, macrophage, scRNAseq
Citation: Wierenga KA, Riemers FM, Westendorp B, Harkema JR and Pestka JJ (2022) Single cell analysis of docosahexaenoic acid suppression of sequential LPS-induced proinflammatory and interferon-regulated gene expression in the macrophage. Front. Immunol. 13:993614. doi: 10.3389/fimmu.2022.993614
Received: 13 July 2022; Accepted: 22 September 2022;
Published: 03 November 2022.
Edited by:
Ronan Lordan, University of Pennsylvania, United StatesReviewed by:
Philip Calder, University of Southampton, United KingdomMourad Aribi, University of Abou Bekr Belkaïd, Algeria
Amruta Naik, University of Pennsylvania, United States
Copyright © 2022 Wierenga, Riemers, Westendorp, Harkema and Pestka. This is an open-access article distributed under the terms of the Creative Commons Attribution License (CC BY). The use, distribution or reproduction in other forums is permitted, provided the original author(s) and the copyright owner(s) are credited and that the original publication in this journal is cited, in accordance with accepted academic practice. No use, distribution or reproduction is permitted which does not comply with these terms.
*Correspondence: Kathryn A. Wierenga, k.a.wierenga-royer@uu.nl; James J. Pestka, pestka@msu.edu