 Shuailong Li
 Isa Wernersbach1
 Michael K. E. Schäfer
- 1Department of Anesthesiology, University Medical Center, Johannes Gutenberg-University Mainz, Mainz, Germany
- 2Cell Biology Unit, University Medical Center, Johannes Gutenberg-University Mainz, Mainz, Germany
- 3Departments of Biology and Physics, Wilkes University, Wilkes Barre, PA, United States
- 4Focus Program Translational Neurosciences (FTN), Johannes Gutenberg-University Mainz, Mainz, Germany
- 5Research Center for Immunotherapy (FZI), University Medical Center, Johannes Gutenberg-University Mainz, Mainz, Germany
Microglia are phagocytosis-competent CNS cells comprising a spectrum of subtypes with beneficial and/or detrimental functions in acute and chronic neurodegenerative disorders. The heterogeneity of microglia suggests differences in phagocytic activity and phenotype plasticity between microglia subtypes. To study these issues, primary murine glial cultures were cultivated in the presence of serum, different growth factors and cytokines to obtain M0-like, M1-like, and M2-like microglia as confirmed by morphology, M1/M2 gene marker expression, and nitric oxide assay. Single-cell analysis after 3 hours of phagocytosis of E.coli particles or IgG-opsonized beads showed equal internalization by M0-like microglia, whereas M1-like microglia preferably internalized E.coli particles and M2-like microglia preferably internalized IgG beads, suggesting subtype-specific preferences for different phagocytosis substrates. Time-lapse live-cells imaging over 16 hours revealed further differences between microglia subtypes in phagocytosis preference and internalization dynamics. M0- and, more efficiently, M1-like microglia continuously internalized E.coli particles for 16 hours, whereas M2-like microglia discontinued internalization after approximately 8 hours. IgG beads were continuously internalized by M0- and M1-like microglia but strikingly less by M2-like microglia. M2-like microglia initially showed continuous internalization similar to M0-like microglia but again discontinuation of internalization after 8 hours suggesting that the time of substrate exposure differently affect microglia subtypes. After prolonged exposure to E.coli particles or IgG beads for 5 days all microglia subtypes showed increased internalization of E.coli particles compared to IgG beads, increased nitric oxide release and up-regulation of M1 gene markers, irrespectively of the phagocytosis substrate, suggesting phenotype plasticity. In summary, microglia subtypes show substrate- and time-dependent phagocytosis preferences and phenotype plasticity. The results suggest that prolonged phagocytosis substrate exposure enhances M1-like profiles and M2-M1 repolarization of microglia. Similar processes may also take place in conditions of acute and chronic brain insults when microglia encounter different types of phagocytic substrates.
Introduction
Microglia are central nervous system (CNS) resident cells that originate from fetal macrophages and play an essential role in innate immune responses and CNS homeostasis, both in the healthy and diseased brain (1, 2). Furthermore, it has become clear that microglia can be efficiently targeted by genetic and pharmacological tools (3). As a result, they are considered suitable targets for modulating CNS diseases (4).
Traditionally, two opposing phenotypes of activated microglia, M1-and M2-like, have been described as pro-and anti-inflammatory subtypes analogously to macrophages (5). However, pathological conditions induce different phenotypes of microglia that are unique and distinct from other macrophage cell types, more diverse than an M1/M2 classification, and more heterogeneous than previously anticipated (2, 6–9). This is reflected by the various roles of microglia in CNS homeostasis, comprising beneficial and detrimental actions in CNS diseases after a bacterial infection or acute injuries such as traumatic brain injury and stroke (5, 10–12).
In vitro stimulation of microglia with individual growth factors and cytokines can induce M1-like and M2-like microglia with distinct phenotypes and functional properties (8). This also applies to phagocytosis, the main established functional feature of microglia in development, homeostasis, and pathology (13). For example, M2-like microglia induced by anti-inflammatory cytokines IL-4 and IL-10 show overall higher activity in phagocytosis of microbeads than M1-like microglia generated by the pro-inflammatory cytokine IFN-γ (14). Phagocytosis of zymosan, a yeast cell wall component, is increased in IL-4-induced M2-like microglia compared to bacterial endotoxin lipopolysaccharide LPS-induced M1-like microglia (15). M2-like microglia induced by IL-4, IL-13, and IL-10 were also more efficient than LPS/IFN-γ-induced M1-like microglia in the phagocytosis of myelin (16). Likewise, M2-like microglia induced by stem cell factor (SCF) show increased phagocytosis of FITC-IgG opsonized beads compared to GM-CSF-induced M1-like microglia (17). However, other studies reported that GM-CSF-induced M1-like microglia had significantly higher phagocytic activities for FITC-IgG beads than IL-4-induced M2-like microglia (8). Controversial results were also obtained for the phagocytosis of amyloid-β (Aβ). While microglia pretreated with the M1-like-inducing bacterial endotoxin lipopolysaccharide (LPS) display enhanced phagocytosis (18), pro-inflammatory cytokines known to promote an M1-like phenotype inhibited Aβ phagocytosis (19). More recently, treatment of primary mouse microglia either with LPS or synthetic double-stranded RNA poly(I: C) was shown to differently affect phagocytosis of synaptosomes, E.coli particles, or IgG beads (20). Microglia also phagocytose stressed or apoptotic neurons which contributes to brain pathology after ischemic injury (21).The receptor tyrosine kinases Axl and Mertk control the phagocytic specialization of microglia, for example for apoptotic cells generated during neurogenesis (22). Comparative studies on phagocytosis of neurons by different microglia subtypes are scarce. It was shown that LPS- or Aβ-mediated pro-inflammatory stimulation of BV2 microglia induced neuronal loss and death by phagocytosis of neurons (23), while fractalkine (CX3CL1), which promotes M2 polarization (24), increased the phagocytosis of apoptotic neuron-like SY5Y cells via Milk Fat Globule Factor-E8 MFG-E8 (25). Overall, these and other studies using distinct microglia subtypes show differences in phagocytic activity in vitro but few studies directly compared different microglia subtypes.
In addition, only a few studies have also shown that phagocytosis of specific substrates is associated with changes in microglia phenotypes. For instance, pathogenic oligomeric Aβ shows a more potent induction of M1-like microglia than the fibrillar form (26). Somewhat controversial data were provided for microglia phenotype plasticity after myelin phagocytosis. Myelin enhanced the M1-like profile and dampened the M2-like profile of primary rat microglia (27) but also induced a switch of M1-like microglia to an M2-like state (28). The latter finding may relate to the up-regulation of the scavenger receptor CD36 in macrophages/microglia after myelin phagocytosis (29). Another study using E.coli particles, cell debris or Aβ as phagocytosis substrates showed that E.coli particles but not the other substrates encountered by microglia triggered secretion of the pathophysiologically relevant matrix metalloproteinase MMP-9 (1). Furthermore, interaction with apoptotic neurons shifts microglia toward distinct remodeling states (30), which share features with disease-associated microglia (31). Finally, phagocytosis of astrocyte- or neuron-derived exosomes may influence microglia polarization due to the transcellular transfer of miRNAs (32, 33)
Taken together, microglia play various roles in innate immune responses, CNS homeostasis and disease, which likely reflect both their heterogeneity and plasticity. However, while their function extends well beyond removing pathogens, dead cells and cell debris, there is still little knowledge about the relationships between microglia subtypes, different types of phagocytic substrates and phenotype plasticity. To address this, we performed in vitro experiments with distinct microglia subtypes subjected to phagocytosis assays for different time periods using two types of phagocytic substrates, E.coli particles and IgG-opsonized beads, followed by immunocytochemistry, gene expression analyses, nitric oxide assays, and time-lapse live-cell imaging.
Methods and materials
Approval of animal experiments
Newborn mice to obtain primary glia were handled in accordance with the institutional guidelines of the Johannes Gutenberg University Mainz, and Rhineland-Palatine, Germany.
Primary mixed glial culture and differentiation of microglia subtypes
Mixed glial cultures were prepared from cerebral cortices of 1-5 days-old C57BL/6 mice sacrificed by decapitation. Brains were extracted, the meninges were carefully removed, and the cerebral cortex was dissected under a stereomicroscope. Cells were dissociated using the Neural Tissue Dissociation Kit-P according to the manufacturer`s protocol (#130-092-628; Miltenyi Biotec). 3x10⁵ cells/ml were seeded into T25 cell culture flasks in Dulbecco’s modified Eagle medium (DMEM; Life Technologies, Carlsbad) containing 10% fetal calf serum (FCS, Life Technologies, Carlsbad), 1% penicillin/streptomycin (P/S, 100 U/ml, Life Technologies, USA) and cultured at 37°C in a humidified atmosphere of 5% CO2 and 95% air (Heraeus® HERAcell® CO2 Incubators, Thermo Fisher Scientific, DE). The cultures were maintained for 14 days in vitro (div) and the medium was changed every 3 days. Next, cells were detached using Trypsin/EDTA solution (Sigma, Steinheim) and dissociated in medium (DMEM/10% FCS/1% P/S) and 6-7x10⁴ cells per well were seeded in 24-well plates onto Poly-D-Lysine-coated (0.1% PDL Sigma, Steinheim) glass coverslips (13 mm, SCHOTT, Mainz). For the differentiation of microglia subtypes, cells were incubated in medium (DMEM/10% FCS/1% P/S) supplemented with granulocyte colony-stimulating factor and interferon-gamma (GM-CSF: 20 ng/ml; IFNy: 40 ng/ml, PeproTech GmbH, Hamburg), or macrophage colony-stimulating factor and interleukin-4 (M-CSF, IL-4; 20 ng/ml each, PeproTech GmbH, Hamburg) for 7 div to obtain M1-, or M2-like microglia, respectively. Non-supplemented medium was used to obtain M0-like microglia. Medium was replaced by fresh (non-) supplemented medium at 3 div and 7 div. Different treatment conditions of each experiment were run in parallel on the same 24-well plates.
Immunocytochemistry and morphological assessment
For immunocytochemistry and morphological assessment of microglia subtypes, cultures were fixed with 4% paraformaldehyde (PFA) for 10 min, blocked (5% normal goat serum, 0.5% BSA, 0.1% Triton X-100 in PBS) for 1 h at room temperature (RT), and incubated with primary antibodies specific to Iba1, MHC-II, and MRC1 (Supplementary Table 1) overnight at 4°C. The next day, cells were washed with PBS, incubated with fluorophore-conjugated secondary antibodies (Supplementary Table 1) for 1 h at RT, washed, and mounted. Images were taken using a confocal laser scanning microscope (LSM5 Exciter; Carl Zeiss DE) with equal acquisition parameters for different microglia subtypes from five independent cell culture preparations (n=5, biological replicates) and five regions of interest (ROIs, n=5) from each coverslip. Morphological parameters (cell size and circularity) of single cells (20-30 cells per ROI) were analyzed using ImageJ (NIH Image, RRID: SCR_003070) with appropriate threshold settings based on anti-Iba1 immunostaining in a blinded and unbiased fashion and data were expressed as mean values from biological replicates (n=5).
Nitric oxide assay
The Griess assay was used for colorimetric detection of NO2− anions which is proportional to nitric oxide (NO) production (34). 200 μL of cell culture supernatants were mixed with 50 μl of 1% sulfanilic acid (Sigma Cat#S9251). Then, 50 μl of 0.1% N-(1-naphthyl) ethylenediamine dihydrochloride (Sigma-Aldrich; Cat#222488) was added, and the absorbance at 540 nm was detected after 10 min using a microplate reader (Sunrise™, Tecan, Switzerland). The nitrite concentration in each sample was interpolated from a standard curve generated from a series of NaNO2 samples (Sigma, Cat#237213) of known concentration.
Quantitative PCR
The cell culture medium was removed, the cells were rinsed once with PBS, and the RNeasy and QuantiScript Reverse Transcription Kits (Qiagen) were used to extract RNA and transcribe mRNA into cDNA according to the manufacturer’s instructions. The cDNA was amplified and quantified by real-time detection of SYBR Green (Thermo Scientific) with oligonucleotide primers (Supplementary Table 2) purchased from Eurofins using the Light Cycler 480 (Roche). For absolute quantification, a target-specific standard curve was generated and the copy numbers of target genes were normalized to the copy numbers of the reference gene Ppia (Cyclophilin A) essentially as described (35, 36).
Phagocytosis assays
Phagocytosis assays were performed using the Red E.coli Phagocytosis Assay Kit (PromoKine, Cat#PK-CA577-K964) or the Phagocytosis Assay Kit (IgG FITC complex, Cayman Chemicals, Cat#500290). Phagocytosis substrates were added at dilutions of 1:50 for Red E.coli or 1:100 IgG-FITC beads for 3 h or 5 days, respectively, and processed for immunocytochemistry using anti-Iba1or qPCR as described above. To determine the number of microglia with phagocytosis activity, ImageJ was used to outline Iba1-immunolabelled cells followed by counting the number of cells containing Red E.coli particles or IgG-FITC beads above a constant threshold level and the percentage of microglia subtypes containing Red E.coli or IgG-FITC beads was calculated. To determine microglia phagocytosis capacity in single cells (25 cells per condition), the relative occupancy of Iba1 immunostaining by the fluorescent phagocytosis substrates was calculated. Images were taken in a blinded and unbiased fashion and data were expressed as mean values ± SEM from independent experiments (biological replicates, n=5).
For time-lapse live imaging of microglial cells, primary mixed glial cultures were detached with Trypsin/EDTA solution and 3x10⁵ cells per well were seeded onto 8-well slides (μ-slide, Ibidi GmbH, Germany). Cells were treated with growth factors and cytokines for 7 div as described above to obtain M0-, M1- and M2-like microglia subtypes. A Leica TSP8 confocal laser scanning microscope (Leica Microsystems, Mannheim, Germany) equipped with an incubator module (20% O2, 5% CO2, and 75% N2, at 37°C) (Oko Labs, Italy) and a motorized position stage were used for time-lapse live imaging experiments. Since CD68 is not involved in binding bacterial/viral pathogens, innate, inflammatory or humoral immune responses (37), we performed live immunolabelling of microglia with rat anti-mouse CD68-BV421 (dilution: 1:125, clone FA-11, BD biosciences, RRID: AB_2744447). The antibody was applied 30 minutes before the random selection of 5 regions of interest (ROI) per condition, followed by the separate addition of the phagocytosis substrates (Rhodamine-E.coli: 1:50. IgG-FITC beads: 1:100). The multi-position confocal images were acquired at an interval of 12 mins over 16 hours using a 20x (0.75 NA) planapochromat objective with differential interference contrast imaging. The automated quantification was based on fluorescent particle tracking of the E. coli-rhodamine or IgG-FITC substrates in single cells labelled with BV421-anti-CD68 using Imaris software (version 9.3.1, BitPlane, Zurich, Switzerland). A total of 1-3 x 10³ cells were acquired from 5 ROIs of each condition over the 16-hours live imaging period in each of two independent experiments.
Statistical analysis
Data analyses were performed with GraphPad Prism® (RRID: SCR_002798). Data outliers were identified and removed using ROUT’s test followed by the Shapiro-Wilk test to determine data distribution as specified in the figure legends. Comparisons between two groups were performed dependent on data distribution by Student’s t-test or Mann-Whitney-U test. Multiple comparisons were performed dependent on data distribution by one-way ANOVA (post-hoc correction Holm-Šídák) or Kruskal-Wallis test (post-hoc correction Dunnett), if F achieved the necessary level of statistical significance p<0.05. Data are expressed as mean ± SEM. Individual data points represent biological replicates or means from biological replicates as specified in figure legends, p*<0.05, p**<0.01, p***<0.001, p****<0.0001.
Results
Microglia subtypes differ in morphology, expression of M1/M2 markers and metabolism
Neural cells were isolated from the cerebral cortex of 3-5 days-old newborn mice, cultivated for 14 days, dissociated and further cultivated in 24 well plates for 7 days in medium (DMEM/10% FCS/1% P/S) containing GM-CSF/IFNy or M-CSF/IL-4 to stimulate proliferation and polarization of microglia into M1-like or M2-like phenotypes, respectively. Heat-inactivated serum was present in all conditions to mimic pathophysiological conditions of BBB breakdown (38, 39) but to prevent complement-enhanced phagocytosis (40). Cultures without the addition of growth factors and cytokines yielded M0-like microglia. First, anti-Iba1 immunostaining to compare microglia morphology between microglia revealed a smaller cell size of M1- than M2-like microglia and a higher circularity of M1-like microglia compared to M0- and M2-like microglia (Figures 1A–C). We next assessed the extent of differentiation towards the M1- or M2-like microglia subtype using triple-immunostainings with antibodies specific to the pan-microglia marker Iba1, the M1 marker MHC2, and the M2 marker MRC1 (Figure 1D). We found that Iba1+/MHC2+ cells showed the highest abundance in M1-like microglia (Figure 1E, 66.00% ± 3.797%, SEM), an intermediate abundance in M0-like microglia (Figure 1E, 34.12% ± 3.797%, SEM), and the lowest abundance in M2-like microglia (Figure 1E, 17.65% ± 3.797%, ± SEM). Conversely, the abundance of Iba1+/MRC1+ cells was highest in M2-like microglia (Figure 1F, 78% ± 2.195%, SEM), intermediate in M0-like microglia (Figure 1F, 27.52% ± 2.195%, SEM), and almost absent in M1-like microglia (Fig, 1F, 1.651% ± 2.195%, SEM).
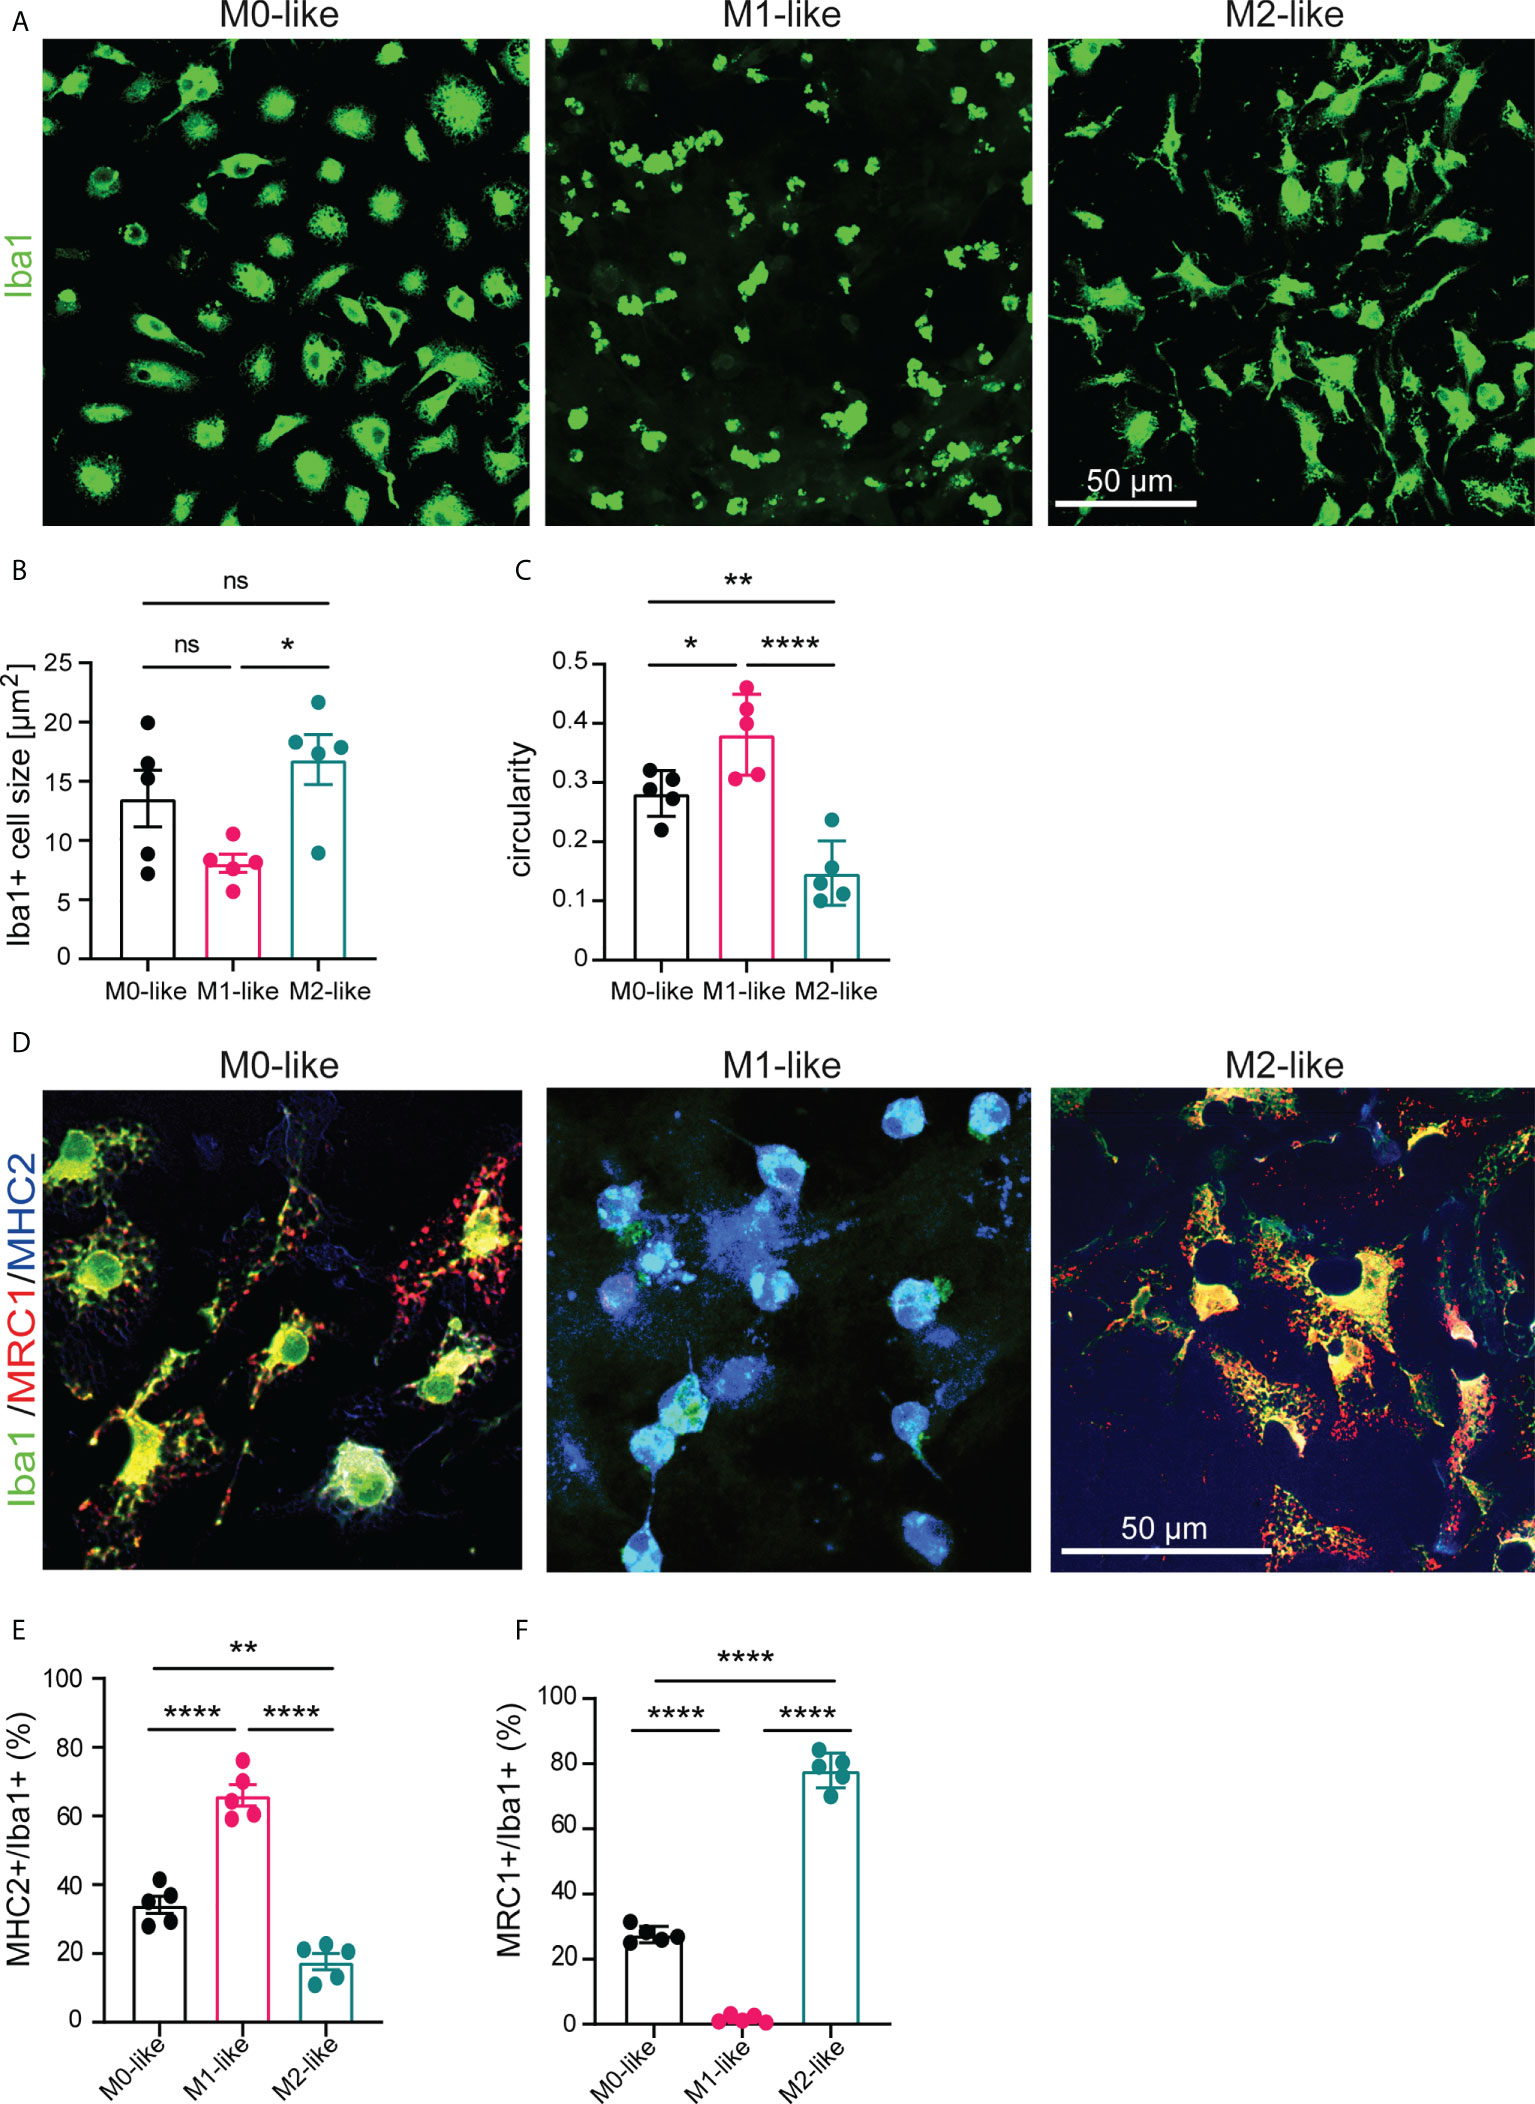
Figure 1 Microglia subtypes differ in morphology and expression of M1/M2 protein markers. (A) Confocal images showing anti-Iba1 immunostaining of M0-, M1-, and M2-like microglia subtypes in primary glia cultures at 7 div, cultivated the presence of serum and/or growth factors and cytokines (GM-CSF/IFNγ for M1-like or M-CSF/IL-4 for M2-like) (B) Histograms showing differences in mean cell size and (C) circularity of microglia subtypes. (D) Confocal images showing triple-immunostaining using antibodies specific to the pan-marker Iba1, the M1-marker MHC2, or the M2-marker MRC1. M1- or M2-like microglia show increased expression of MHC2 or MRC1, respectively. (E, F) Histograms showing the percentage of Iba1+ microglia expressing MHC2 or MRC1 as determined by cell counts after triple immunostaining using antibodies specific to Iba1, MHC2, or MRC1. Data are expressed as mean ± SEM (n = 5, independent biological replicates are shown) and were tested for significant differences by one-way ANOVA (post-hoc correction Holm-Šídák) or Kruskal-Wallis test (post-hoc correction Dunnett), *p < 0.05, **p < 0.01, ****p < 0.0001 ns, not significant.
To examine whether microglia subtypes showed corresponding gene expression levels, we performed qPCR using primers specific for the established microglia markers Aif1 (encoding for Iba1), Mhc2 and Nos2 (M1 marker) as well as Arg1 and Mrc1 (M2 marker). In agreement with previous studies using purified microglia (41, 42), Nos2 and Mhc2 were highly expressed in cultures containing M1-like microglia, whereas Arg1 and Mrc1 were highly expressed in cultures containing M2-like microglia (Figures 2A–E).
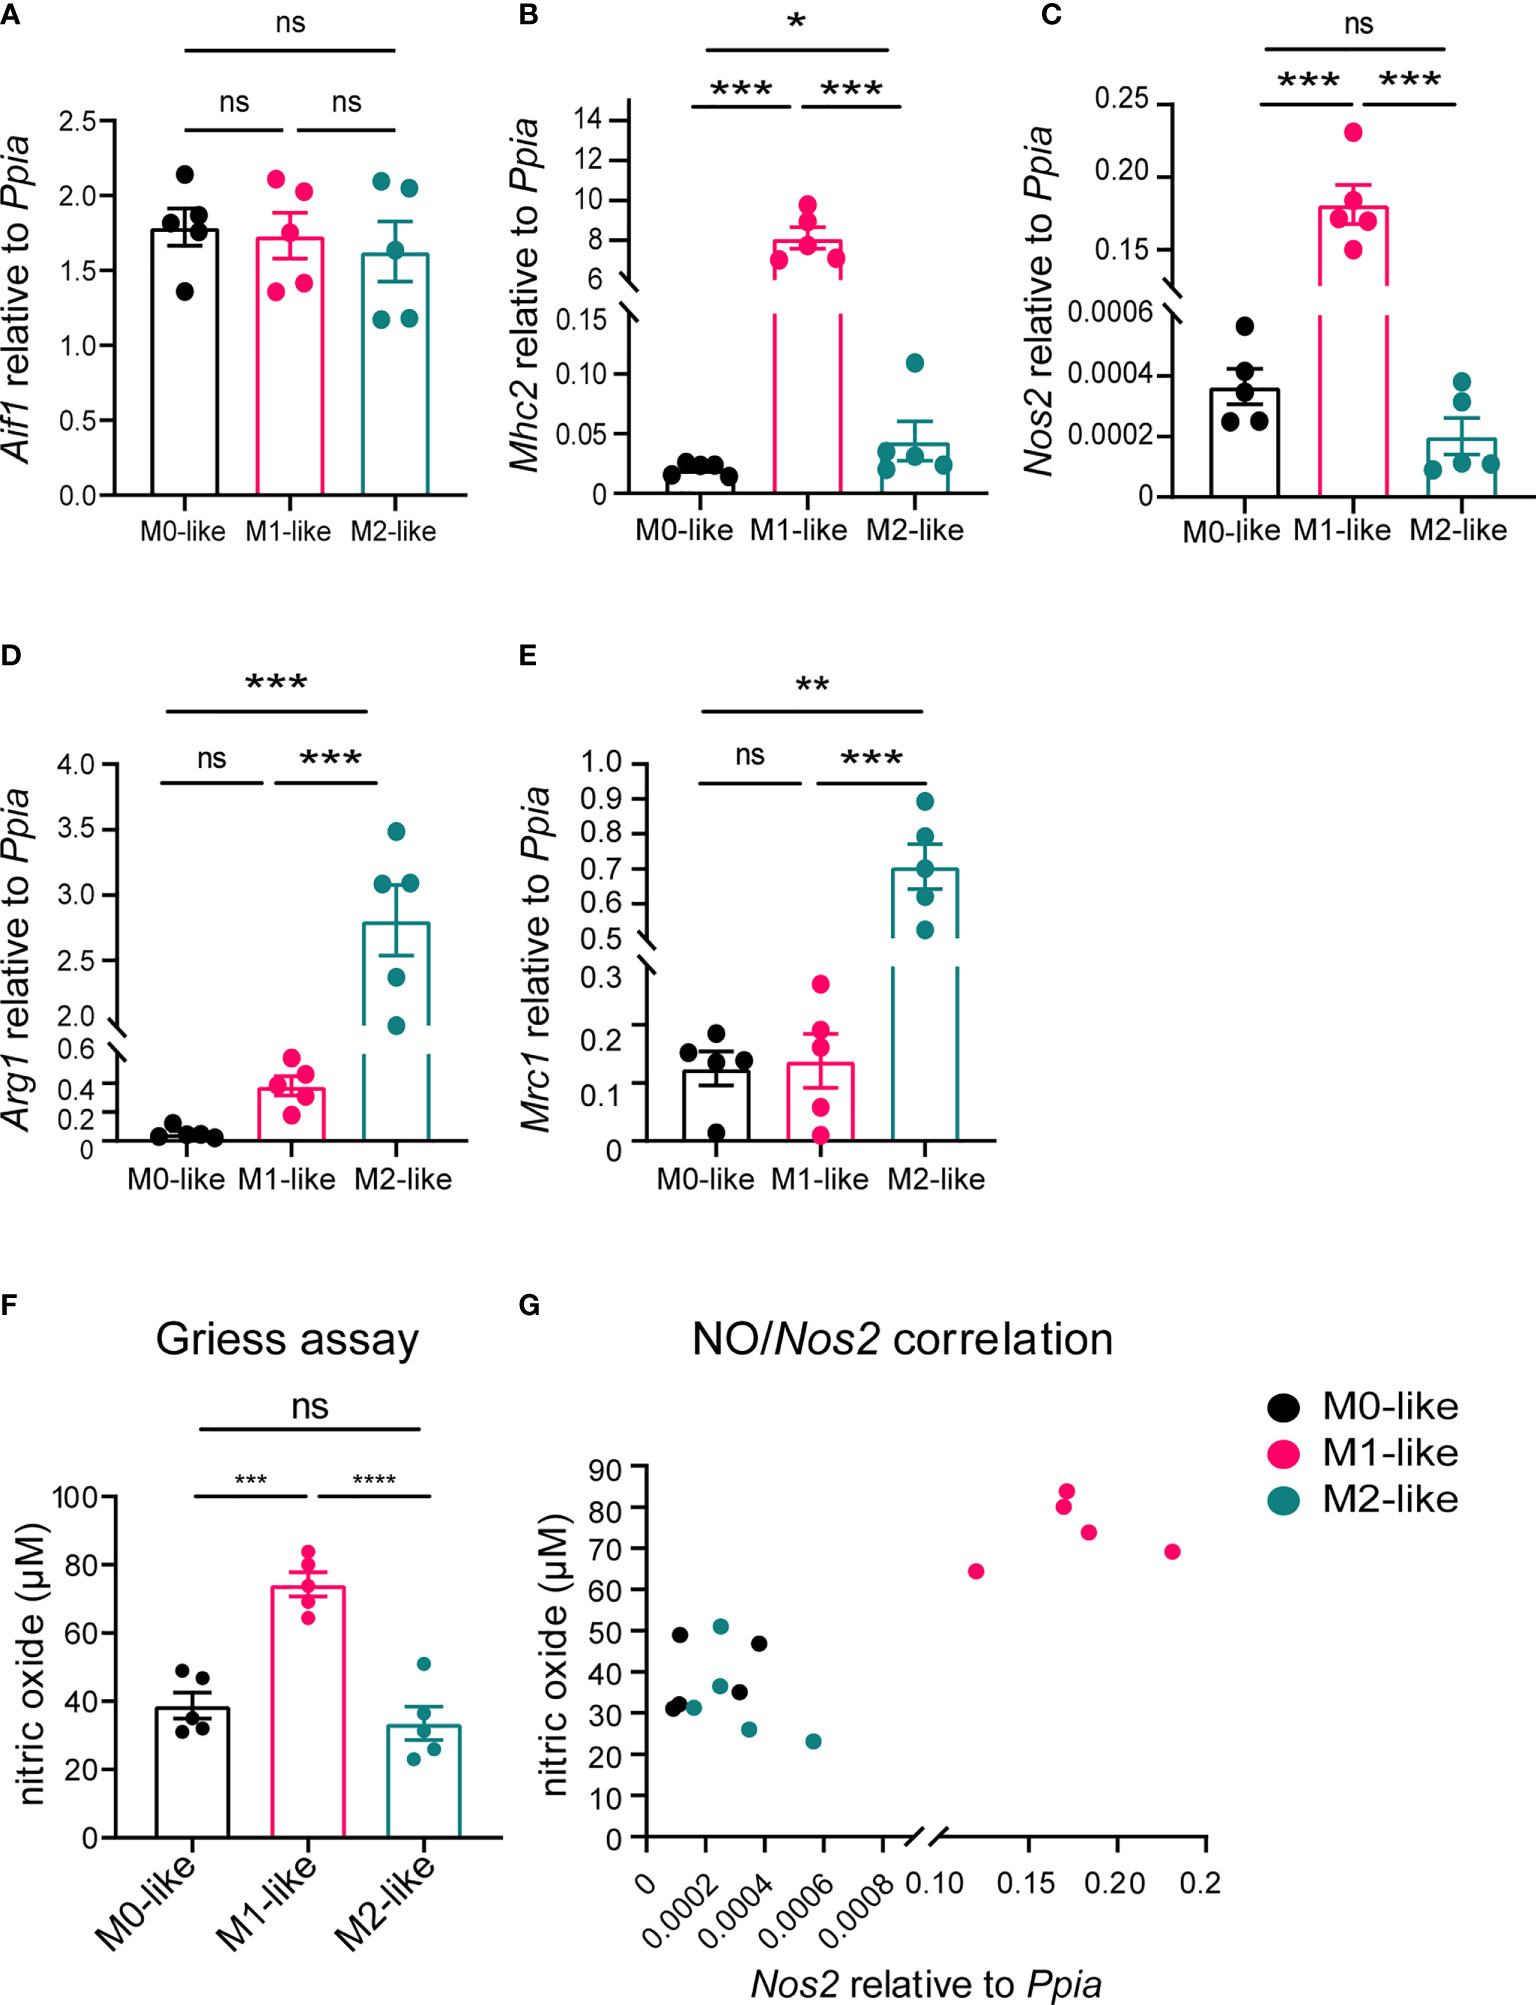
Figure 2 Microglia subtypes differ in M1/M2 gene marker expression and metabolism. (A–E) Gene expression analyses of the pan-marker Aif1, M1-markers Mhc2, Nos2 and M2 markers Arg1, and Mrc1 demonstrating differential expression by microglia subtypes. Ppia was used as a reference gene. (F) Alterations in cellular arginine metabolism were detected by colorimetric Griess assay, with M1-like microglia releasing significantly more NO than M0- or M2-like microglia. (G) Scatter plot showing positive correlation between NO and Nos2 expression (non-parametric Spearman correlation, r = 0.8842, p < 0.0001). Values are expressed are mean ± SEM from 5 individual experiments (biological replicates), one-way ANOVA (post-hoc correction Holm-Šídák), *p < 0.05, **p < 0.01, ***p < 0.001, ****p < 0.0001. ns, not significant.
To verify that our differentiation protocol induced subtype-specific alterations in cell metabolism, i.e., arginine metabolism, we determined nitrite levels in cell culture supernatants as a measure for the release NO. Cultures containing M1-like microglia released significantly more NO than those containing M0- or M2-like microglia (Figure 2F), and the NO release was correlated with the Nos2 expression (Figure 2G). Taken together, these results confirmed the differentiation of M0-, M1-, and M2-like microglia in our primary mixed glia model.
M1- and M2-like microglia show substrate-specific phagocytosis preference and capacities
We next examined phagocytosis activity and capacity of M0-, M1-, and M2-like microglia in mixed glial cultures. Cells were incubated for 3 h in the presence of two phagocytic substrates, rhodamine-E. coli particles or IgG-FITC beads, and then processed for anti-Iba1 immunocytochemistry and confocal microscopy (Figures 3A–C).
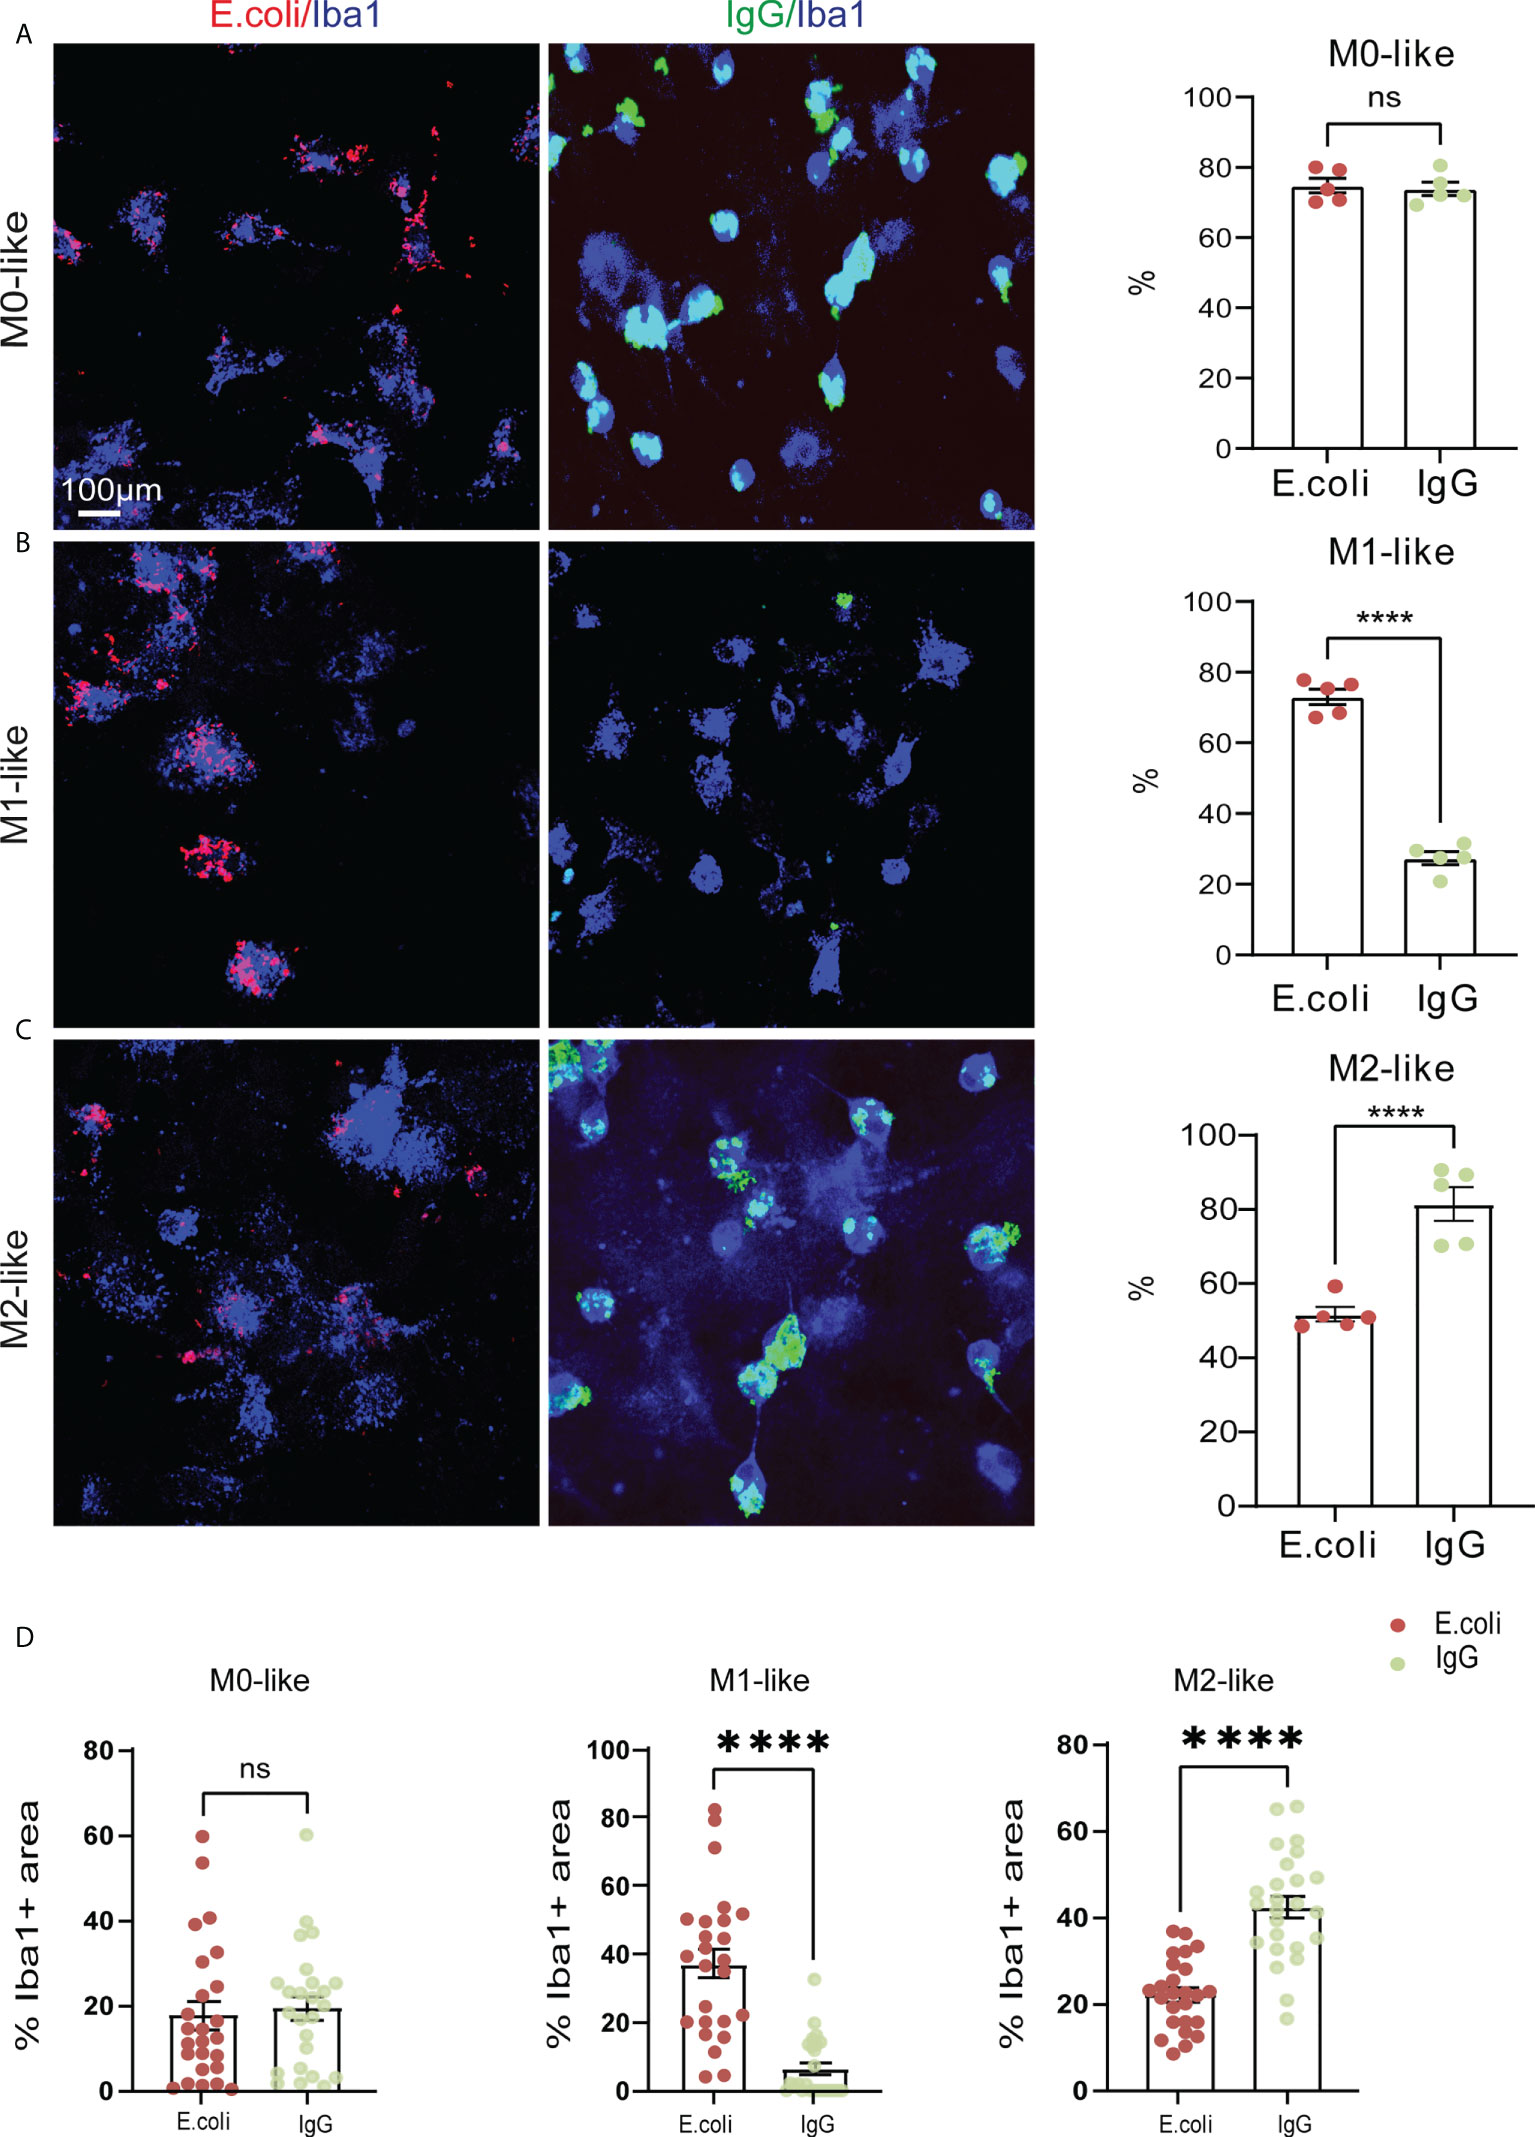
Figure 3 M1- and M2-like microglia show substrate-specific phagocytosis preference and capacities. (A–C) Confocal images showing anti-Iba1 immunostaining of M0-, M1- or M2-like microglia subtypes along with rhodamine-E.coli particles (red, E.coli) or IgG-FITC beads (green, IgG) after 3 hours of phagocytosis substrate exposure. Histograms showing percentage of microglia with internalized E.coli particles or IgG beads. M0-like microglia showed no phagocytosis preference, whereas M1- and M2-like microglia showed opposing phagocytosis preferences for E.coli particles or IgG beads, respectively. (D) Co-localization analyses showing the relative occupancy of Iba1 immunostained cell areas by E.coli particles or IgG beads. M1- and M2-like microglia displayed opposing phagocytosis capacities for E.coli particles or IgG beads, respectively. Data are expressed as mean ± SEM from 5 independent biological replicates (A–C) or 5 cells from each of 5 independent biological replicate (D). Data are means ± SEM. ****p < 0.0001, ns, not significant, Student’s t-test.
Determining the percentage of Iba1+ M0-like microglia containing E. coli particles or IgG-beads revealed that approximately 75% of M0-like microglia showed phagocytic activity, regardless of substrate identity (Figure 3A E.coli: 74.32% ± 2.85%; IgG: 73.86% ± 2.85%, SEM). In contrast, the percentage of M1-like microglia containing E.coli particles was higher than the percentage of M1-like microglia containing IgG-beads (Figure 3B, E.coli: 73.06% ± 2.84%; IgG: 27.37% ± 2.84%, SEM). However, we observed opposing internalization ratios for M2-like microglia. The percentage of M2-like microglia containing IgG-beads was increased compared to the percentage of M2-like microglia containing E.coli particles (Figure 3C, E.coli: 81.49% ± 4.92%; IgG: 51.74% ± 4.96%, SEM).
To assess the phagocytic capacity of the microglia subtypes, we determined the relative occupancy of the Iba1-immunostained cell area by either E.coli-rhodamine or IgG-FITC beads in individual microglia. In M0-like microglia, no differences were observed in the cell area occupancy between E.coli-rhodamine and IgG-FITC beads, both of which show a cell area occupancy of less than 20% (Figure 3D, E.coli: 17.68% ± 3.15%; IgG: 19.37% ± 2.97, SEM). In M1-like microglia, the cell area occupancy by E.coli-rhodamine was about 35% of the cell area, and the occupancy by IgG-FITC was less than 10% (Figure 3D, E.coli: 37.12% ± 2.31%; IgG: 6.57% ± 2.07%, SEM). In contrast, M2-like microglia displayed a cell area occupancy by E.coli-rhodamine of about 20%, whereas the occupancy by IgG-FITC was more than 40% (Figure 3D, E.coli: 22.16% ± 0.95%; IgG: 42.53% ± 2.18%, SEM). Together, these results indicated that M1- and M2-like microglia subtypes show substrate-specific phagocytosis activities.
Microglia subtypes show substrate-specific phagocytosis capacities and dynamics over 16 hours
Our experiments to study differences in phagocytosis by microglia subtypes after fixative treatment and immunocytochemistry at a predetermined time point did not allow examination of microglial phagocytosis continuously over time. Therefore, we performed multicolour time-lapse live imaging for 16 hours. To identify microglia, we added BV421-fluorophore-conjugated anti-CD68 to the cultures 30 min before the imaging experiments started with the addition of E.coli-rhodamine particles or IgG-FITC beads. The subsequent analysis was based on fluorescent particle tracking of the E.coli-rhodamine or IgG-FITC substrates in single cells labelled with BV421-anti-CD68 and expressed as the mean number of particles per ROI using Imaris software (see methods for details).
Images taken shortly after the addition of E.coli-rhodamine particles at 0 h and 16 h after their addition indicated high phagocytosis rates of this substrate by M0- and M1-like microglia over time (Figure 4A. Higher magnifications demonstrated the internalization of E.coli particles into vesicle-like structures and substantial intracellular accumulation of the particles at 16 h (Figure 4B). However, M2-like microglia showed less internalized E.coli particles than M0- or M1-like microglia (Figures 4A, B), suggesting reduced phagocytosis rates over the 16 hours period
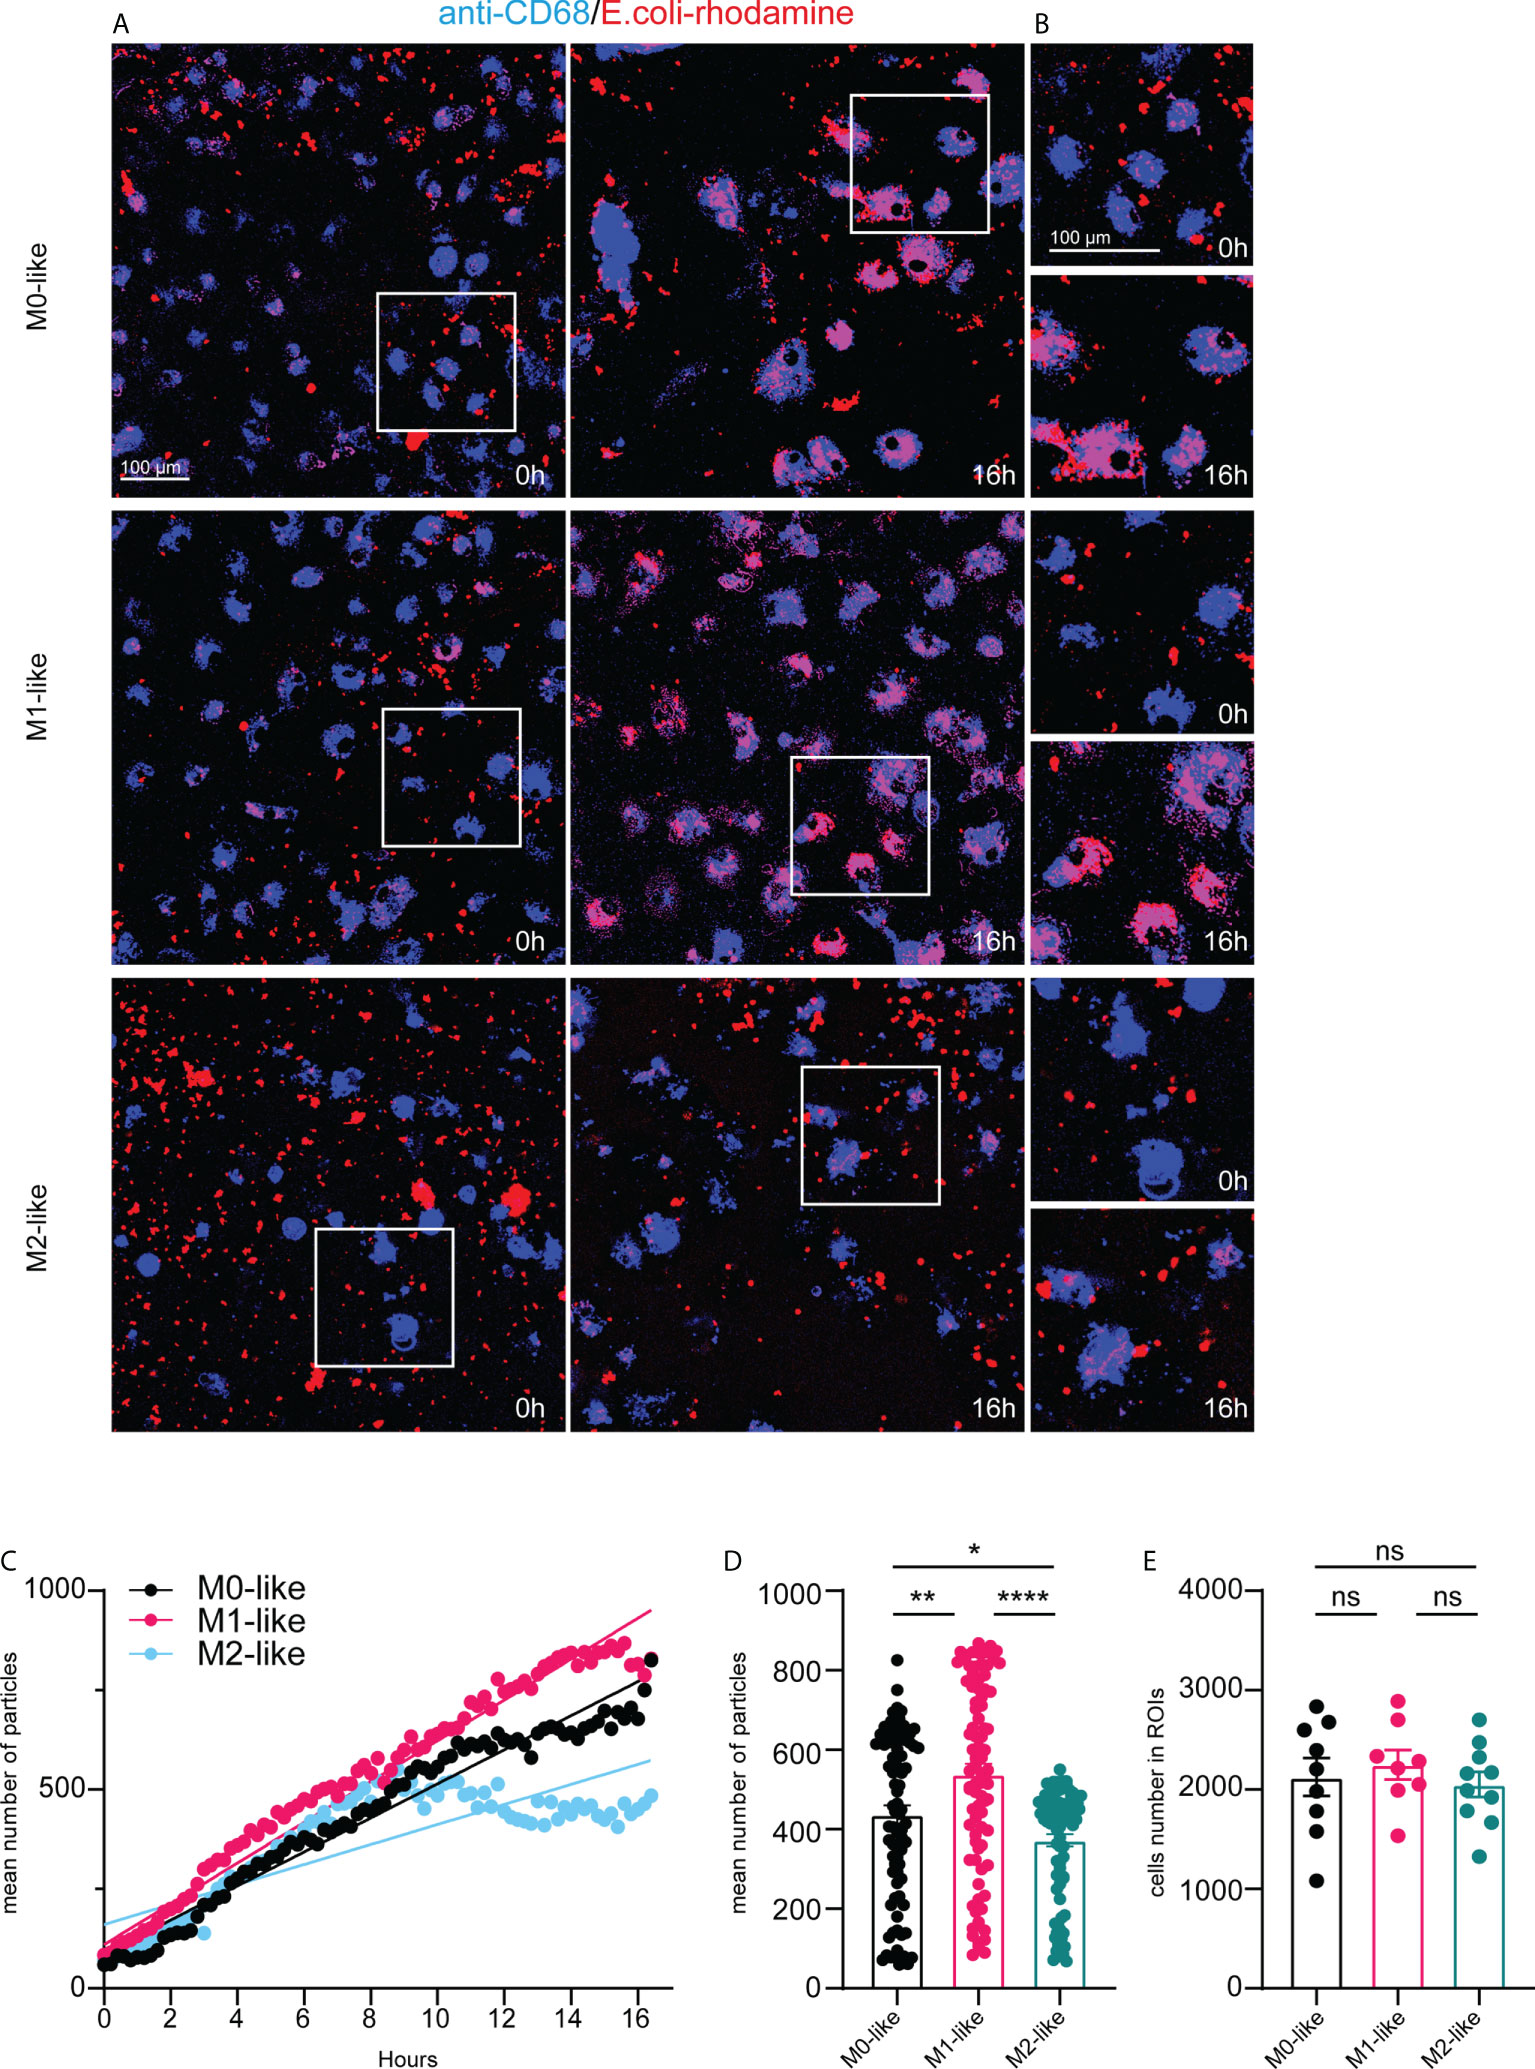
Figure 4 Microglia subtypes show substrate-specific phagocytosis capacities and dynamics for E.coli particles over 16 hours (A) Single frame images and (B) image enlargements from live imaging movies of anti-CD68 live-immunolabelled microglia (blue) after addition of E.coli-rhodamine particles (red) at time-points 0h and 16h, scale bar, 100µm. Note pronounced E.coli particle accumulation in M0- and M1- but not in M2-like microglia at 16h after addition of E.coli particles. (C) Time-series plot showing the mean number of E. coli-rhodamine particles internalized (averaged from 8-10 ROIs for each time interval) by microglia subtypes over 16 hours. Simple linear regression calculation indicate different slopes of phagocytic capacities of M0- (black) (r2: 0,6902, p < 0,0001), M1- (pink) (r2: 0,5364, p < 0,0001), and M2-like (cyan) (r2: 0,3691, p < 0,0001), respectively. Note that M2-like microglia discontinued internalization at about 9 hours after addition of E.coli particles. (D) Mean number of internalized particles over 16 hours (averaged from 8-10 ROIs for each time interval). (E) Number of imaged anti-CD68 immunolabelled microglia encountering E.coli particles over 16 hours. Data are expressed as means ± SEM, one-way ANOVA (post-hoc correction Holm-Šídák test, *p < 0.05, **p < 0.01, ****p < 0.0001. ns, not significant.
E.coli particle tracking in CD68+ microglia revealed that M0- and M1-like microglia continuously internalized E.coli particles over 16 h. However, internalization by M1-like microglia occurred more steadily (Figure 4C). M2-like microglia showed internalization rates similar to M0- and M1-like subtypes until approximately 8 h after adding E.coli particles, but then discontinued internalization (Figure 4C). These differences were also evident when comparing the mean number of internalized E.coli particles (averaged from 3-5 ROIs for each time interval) over 16 h (Figure 4D, M0: 445.3 ± 25.80, SEM; M1: 531.9 ± 31.49, SEM; M2: 400.8 ± 18.05, SEM). The mean particle number was significantly higher in M1-like microglia than in M0-like or M2-like microglia, and M0-like microglia showed overall higher internalization than M2-like microglia (Figure 4D). These differences were independent of the number of imaged CD68+ cells encountering E.coli particles over the 16 h imaging period (Figure 4E, M0: 2126 ± 191.7, SEM, M1: 2250 ± 148.9, SEM, M2: 2052 ± 127.8, SEM), which further confirms that the differences between the mean particle numbers per ROI reflect differences at the single cell level.
Images were taken shortly and 16 h after the addition of IgG-FITC beads to microglia subtypes, suggesting that the phagocytosis of IgG-FITC beads by M0- and M2-like microglia was more efficient than by M1-like microglia (Figure 5A).Furthermore, higher magnifications demonstrated the vesicle-like appearance of IgG beads and pronounced accumulation in M0- and M2-like microglia and relatively low accumulation in M1-like microglia (Figure 5B).
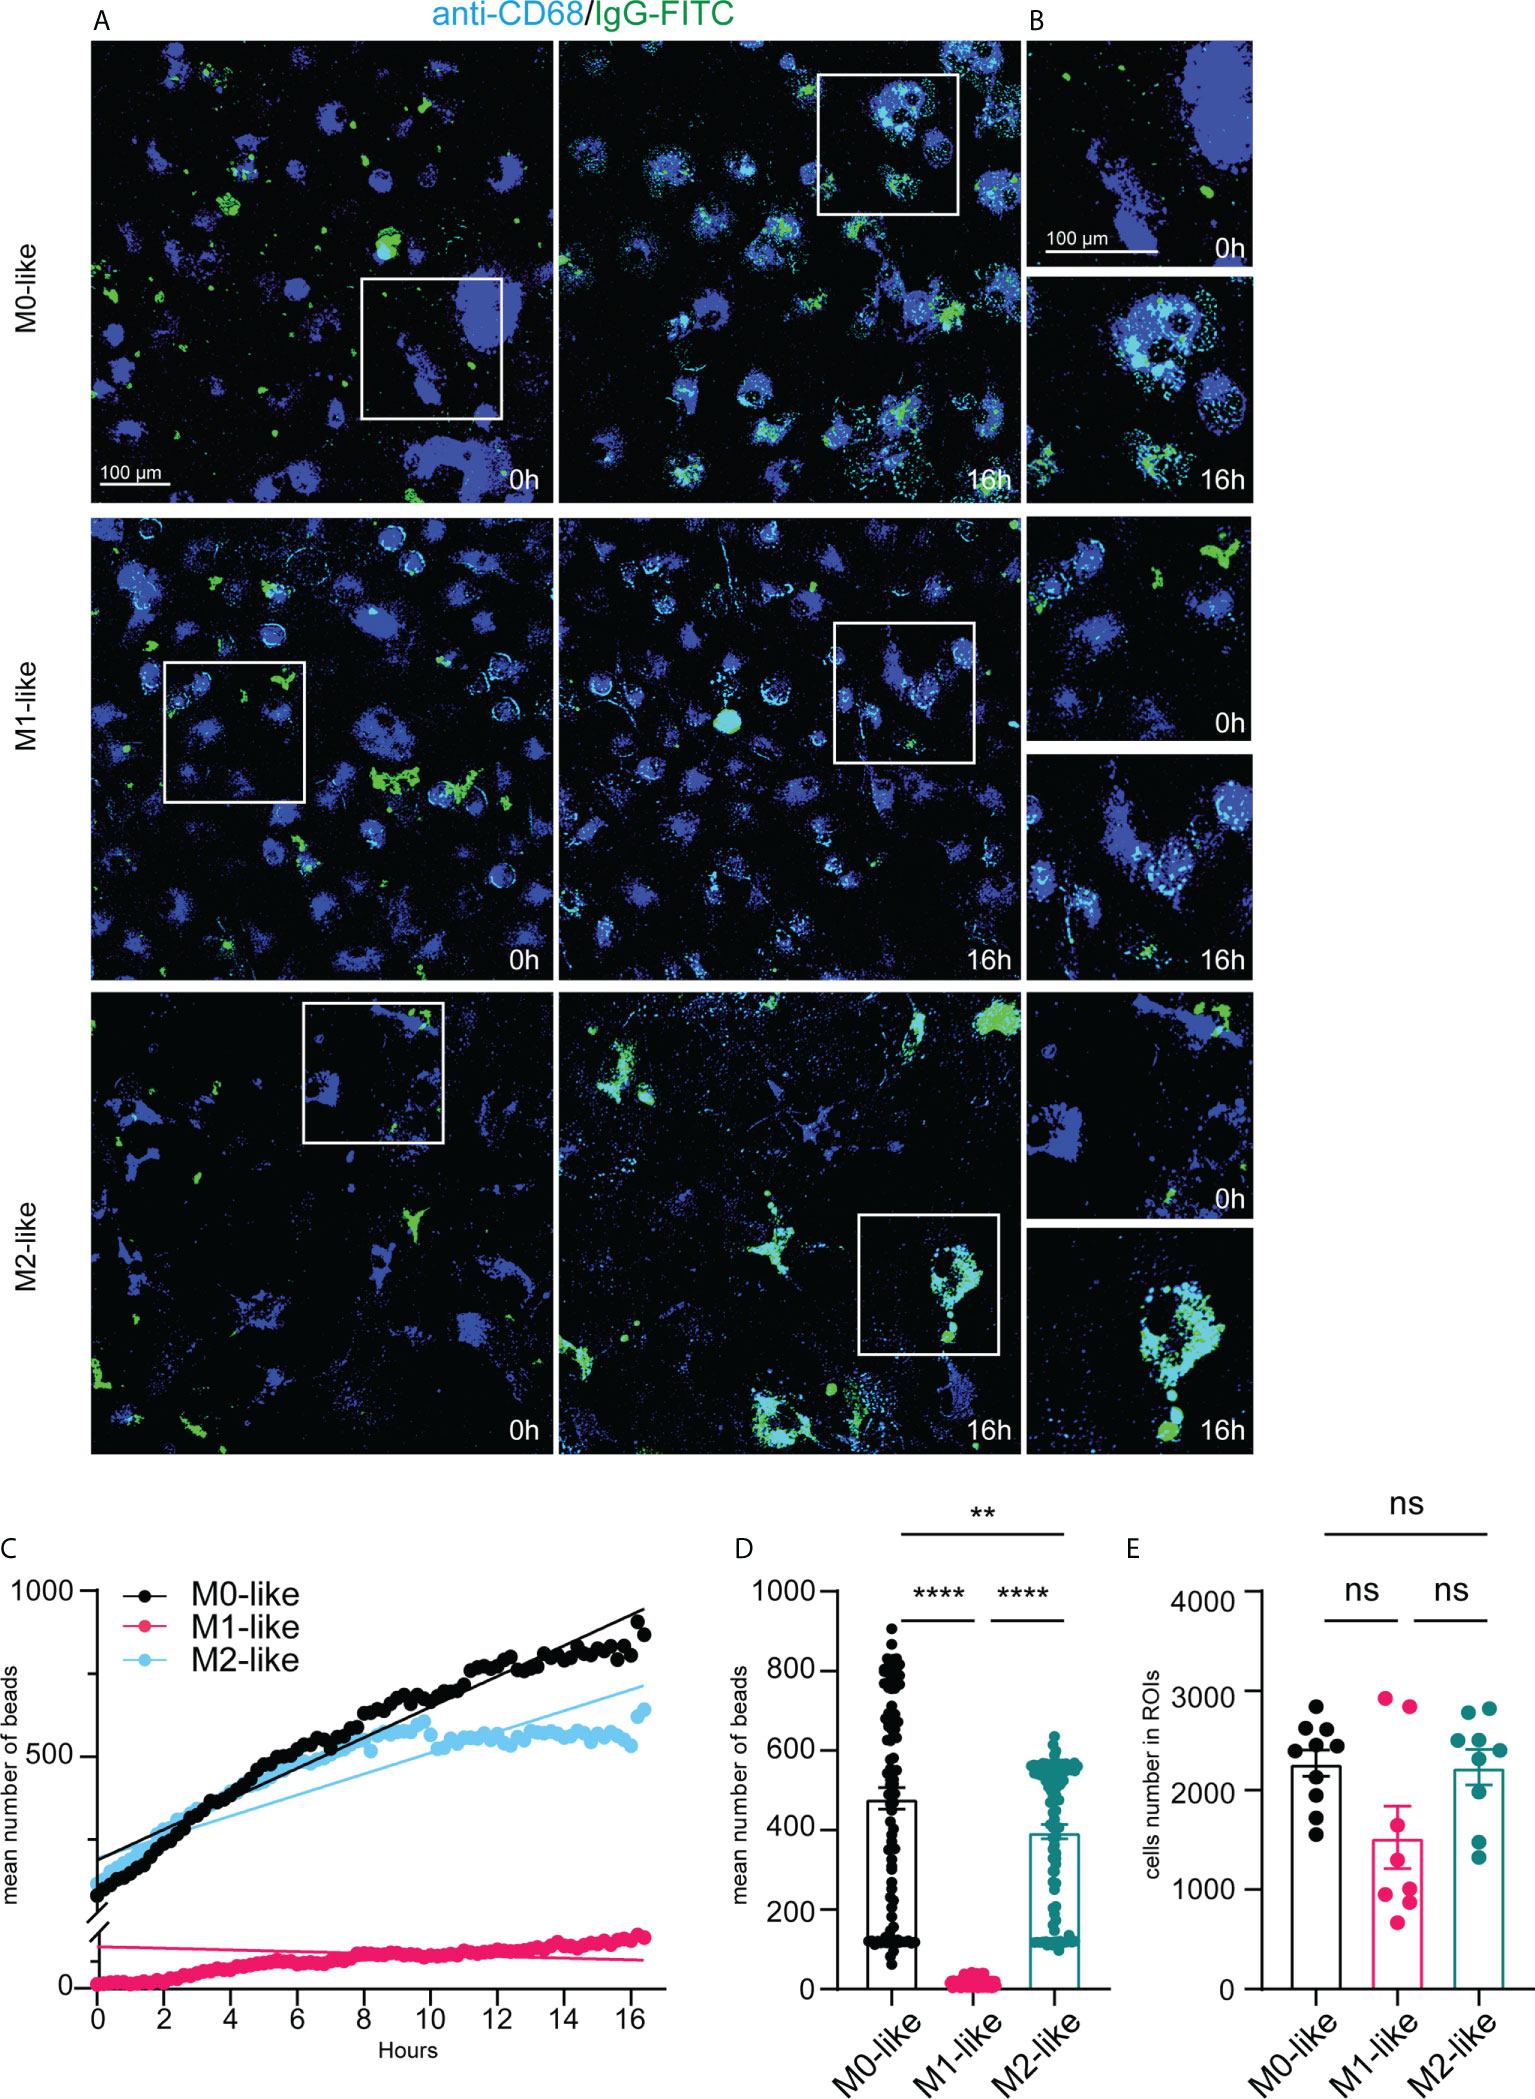
Figure 5 Microglia subtypes show different phagocytosis capacities and dynamics for IgG-FITC beads over 16 hours. (A) Single frame images and (B) image enlargements from live imaging movies of anti-CD68 live-immunolabelled microglia (blue) after addition of IgG-FITC beads (green) at time-points 0h and 16 h, scale bar, 100µm. Note pronounced IgG bead accumulation in M0- and M2- but not in M1-like microglia at 16h after addition of E.coli particles. (C) Time-series plot showing the mean number of IgG beads internalized (averaged from 8-10 ROIs for each time interval) by microglia subtypes over 16 hours. Simple linear regression calculation indicate different slopes of phagocytic capacities of M0- (black) (r2: 0,1637, p < 0,0001), M1- (pink) (r2: 0,2733, p < 0,0001), and M2-like (cyan) (r2: 0,07045, p < 0,0001), respectively. Note that M2-like microglia discontinued internalization at about 9 hours after addition of IgG-FITC beads. (D) Mean number of internalized particles over 16 hours (averaged from 8-10 ROIs for each time interval). (E) Number of imaged anti-CD68 immunolabelled microglia encountering IgG-FITC beads over 16 hours. Data are expressed as means ± SEM, one-way ANOVA (post-hoc correction Holm-Šídák test, ****p < 0.0001. ns, not significant.
IgG bead tracking in CD68+ microglia over 16 hours revealed different internalization rates and dynamics by microglia subtypes. M1-like microglia showed continuous internalization but internalized overall, clearly fewer IgG beads than M0- or M2-like microglia (Figure 5C). M0-like microglia showed an almost steady increase of IgG bead internalization over 16 h. M2-like microglia initially showed continuous internalization, but discontinuation of internalization occurred approximately 8 hours after adding the phagocytosis substrate (Figure 5C). The low phagocytosis activity of M1-like microglia was also reflected by a significantly reduced mean number of internalized beads (averaged from 4-5 ROIs for each 12 min interval) over 16 h, whereas no significant differences were observed between M0-like and M1-like microglia (Figure 5D, M0: 443.2 ± 24.81, SEM; M1: 87.27 ± 5.238, SEM, M2: 364.2 ± 17.27, SEM). The number of microglia subtype cells encountering the substrate was statistically not different, albeit the mean number of M1-like cells was lower than in the other conditions (Figure 5E, M0: 2273 ± 132.8, SEM, M1: 1532 ± 282.0, SEM, M2: 2231 ± 217.3, SEM).
Altogether, the results indicate that microglia subtypes display substrate-specific phagocytosis over time.
Microglia subtypes show M1-like features after prolonged phagocytosis substrate exposure
The phagocytic activity of microglia in neurological conditions may exceed well beyond the time-course examined in our live imaging experiments. To mimic this situation, we subjected microglia to prolonged exposure to phagocytosis substrate for 5 days. Determining the percentage of Iba1+ microglia containing E.coli particles after 5 days revealed that approximately 75% of all microglia subtypes showed phagocytosis activity (Figures 6A–C, M0: 74.28% ± 4.39%, SEM, M1: 80.6% ± 3.76%, SEM, M2: 72.81% ± 5.4%, SEM). However, the percentage of Iba1+ cells containing IgG beads was significantly lower (Figures 6A–C, M0: 27.58% ± 4.16%, SEM, M1: 27.56% ± 6.13%, SEM, M2: 27.55% ± 4.01%, SEM). Analysis of colorimetric NO assays and qPCR results showed that NO release and Nos2 mRNA expression correlated for all microglia subtypes and that both increased relative to the control microglia subtypes not exposed to phagocytosis substrates (Figure 6D). Next, the relative occupancy of the Iba1-immunostained cell area by either E.coli-rhodamine or IgG-FITC beads was determined. We found that all microglia subtypes encountering the phagocytosis substrates showed a higher phagocytosis capacity for E.coli than for IgG beads (Figures 6E–G, E.coli: M0: 32.02% ± 4.2%, SEM, M1: 39.22% ± 3.19%, SEM, M2: 37.63% ± 4.06%, SEM; IgG: M0: 6.903% ± 1.9%, SEM, M1: 20.04% ± 2.04%, SEM, M2: 9.307% ± 2.32%, SEM).
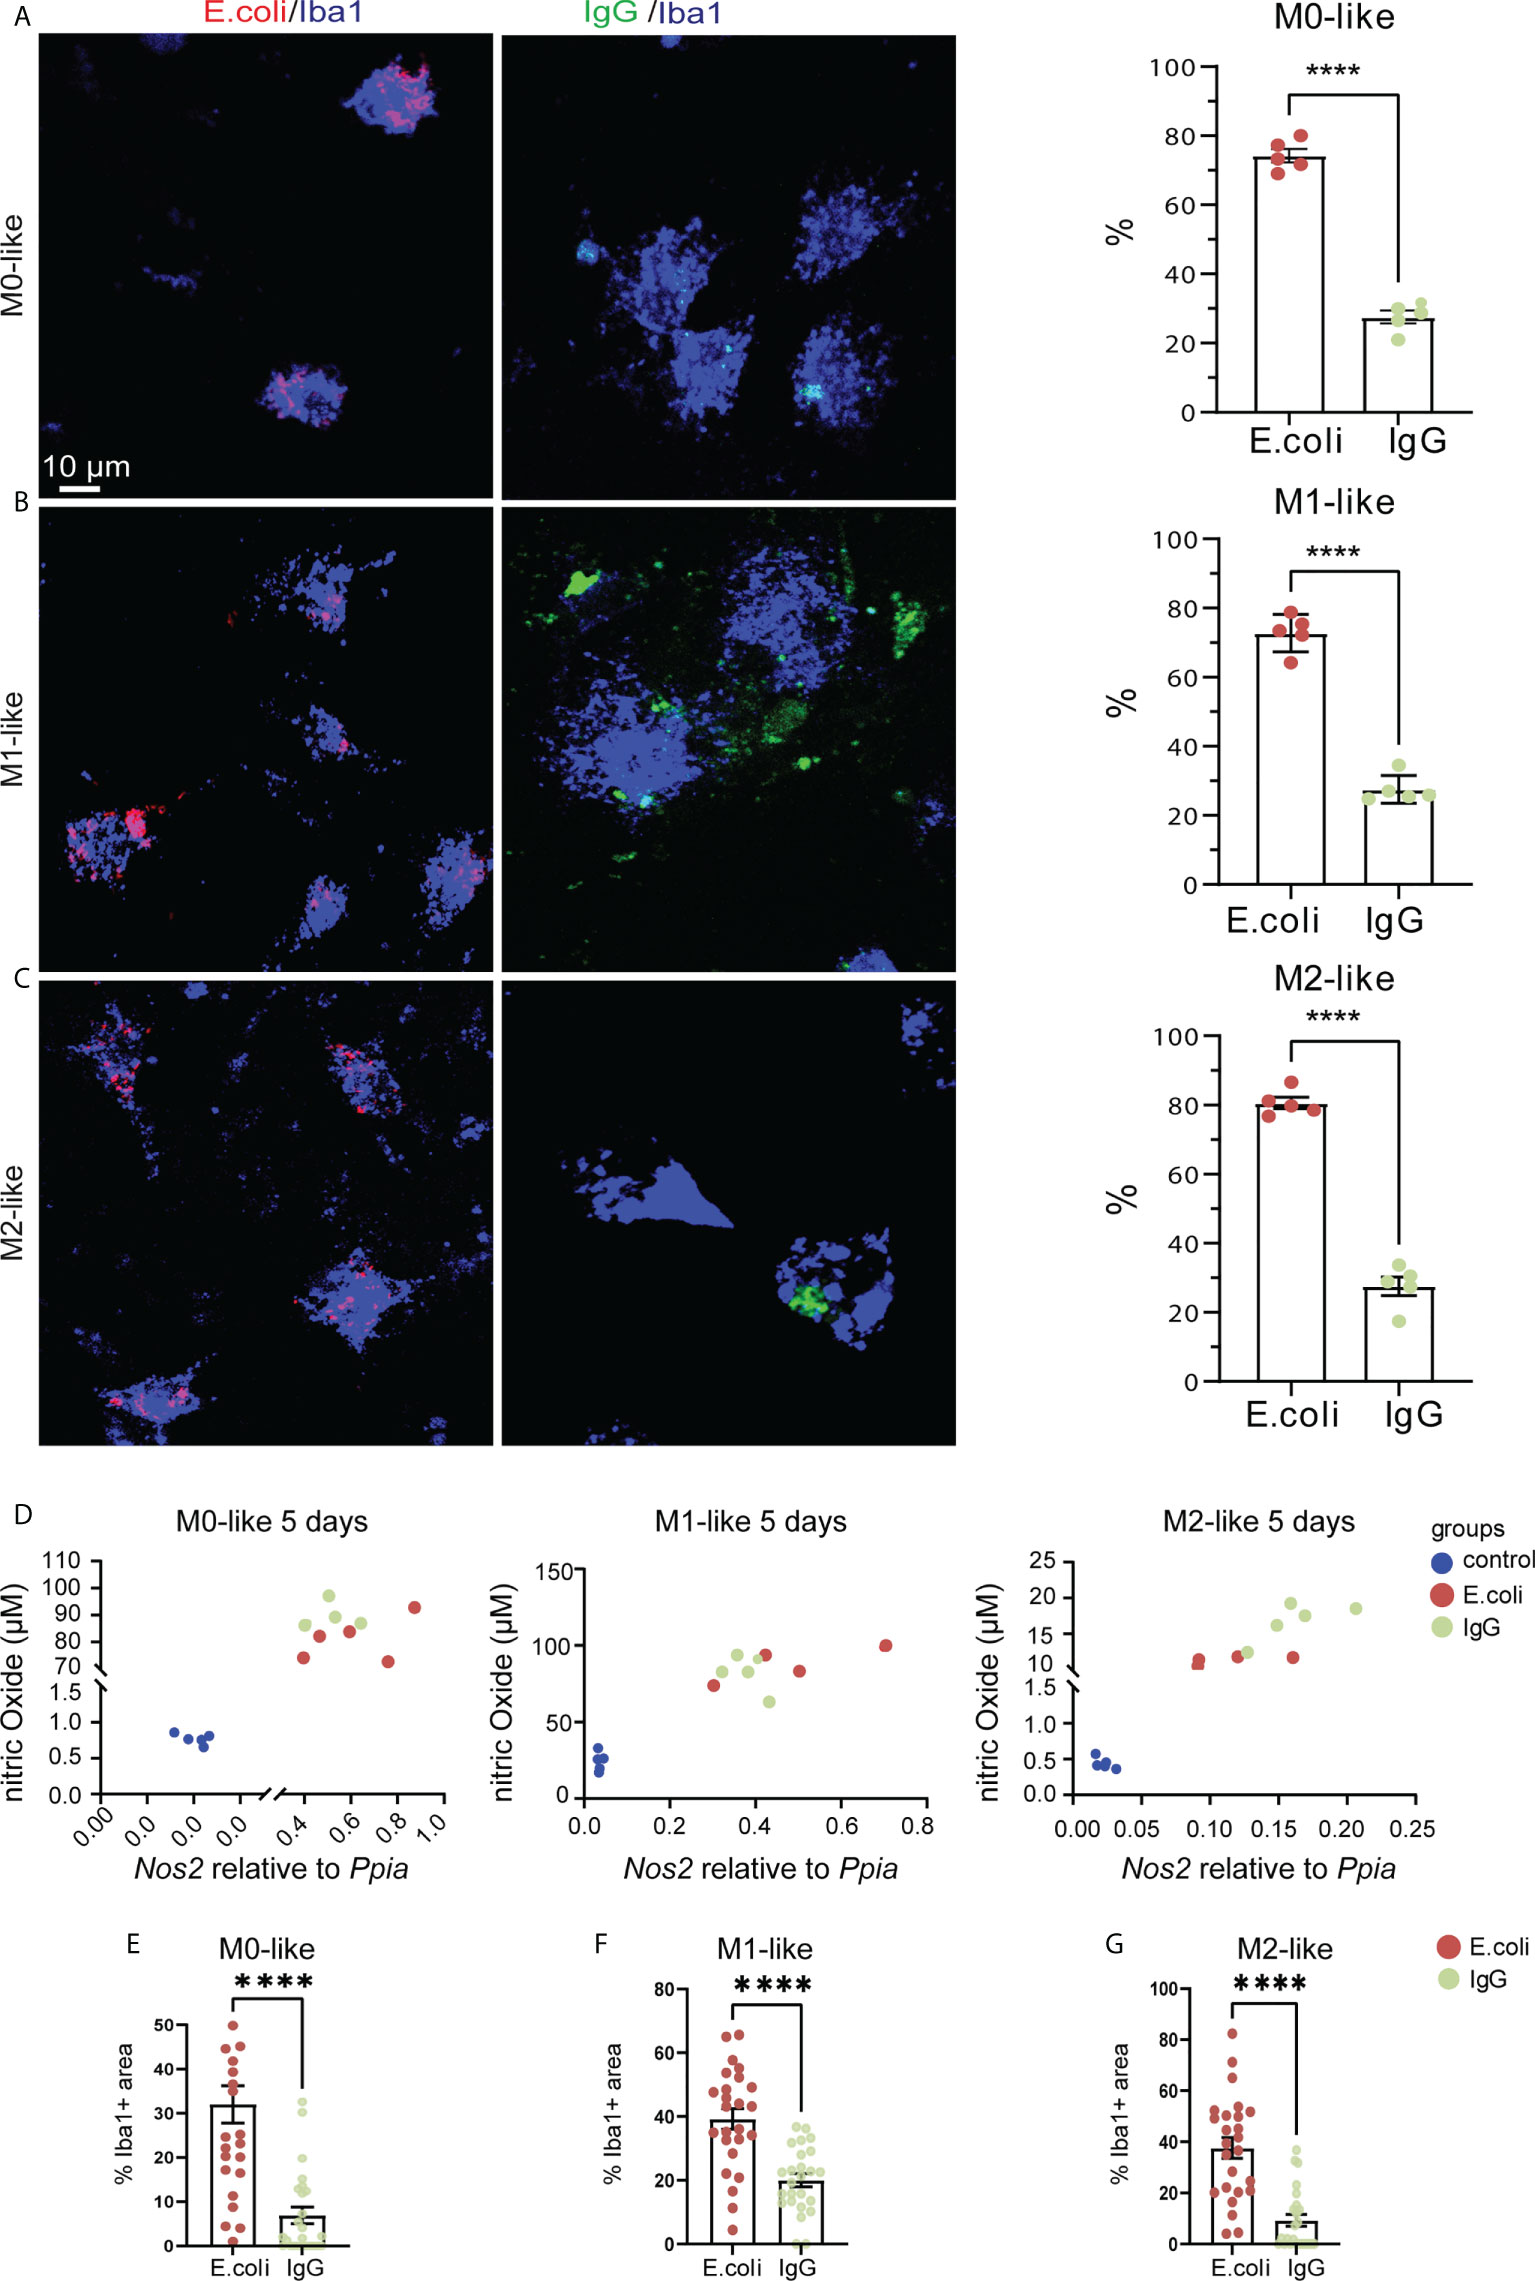
Figure 6 Microglia subtypes show M1-like features after prolonged phagocytosis substrate exposure (A–C) Confocal images showing anti-Iba1 immunostaining of M0-, M1- or M2-like microglia subtypes along with rhodamine-E.coli particles (red, E.coli) or IgG-FITC beads (green, IgG) after 5 days of phagocytosis substrate exposure. Histograms showing percentage of microglia with internalized E.coli particles or IgG beads. Microglia subtypes showed phagocytosis preference for E.coli particles rather than IgG beads. (D) Scatter plots showing similar correlation (non-parametric Spearman correlation) between NO levels and Nos2 gene expression for M0- (r = 0.6536, p=0.0099), M1- (r = 0.8214, p = 0.0003), and M2-like (r = 0.8857, p < 0.0001) microglia. Ppia was used as a reference gene. (E–G) Co-localization analyses showing the relative occupancy of Iba1 immunostained cell areas by E.coli particles or IgG beads. Microglia subtypes showed phagocytosis preference for E.coli particles rather than IgG beads. Data are expressed as mean ± SEM from 5 independent biological replicates (A–C) or 4-6 cells from each of 5 independent biological replicate (D). Data are means ± SEM. ****p < 0.0001, ns, not significant, Student’s t-test.
Since this result was in stark contrast to the substrate preferences of microglia subtypes observed in our experiments after 3 h of substrate exposure, we tested whether changes in microglial subtype identity might have contributed to this result. We determined gene expression levels of microglia subtype markers by qPCR using primers specific for Aif (Iba1), Mhc2, Nos2, Arg1 and Mrc1 (Figure 7). In M0-like microglia cultures, the M1-like markers Mhc2 and Nos2 were both strongly up-regulated after 5 days of exposure both to E.coli particles or IgG beads as compared to M0-like cells cultured without phagocytic substrate (Figures 7B, C), while the pan-microglia marker Aif1 was not significantly different between the three conditions (Figure 7A). Determination of M2-like marker expression revealed up-regulation of Mrc1 after IgG bead exposure and Arg1 expression did not alter in response to substrate exposure (Figures 7D, E). In M1-like microglia, we found decreased Aif1 expression but increased expression of M1-like markers Mhc2 and Nos2 after E.coli particle exposure as well as increased Nos2 expression after IgG bead exposure (Figures 7F–H). No significant differences were found for Arg1 or Mrc1 expression (Figures 7I, J). In M2-like microglia, both E.coli particles and IgG beads caused up-regulation of M1-like markers Mhc2 and Nos2 (Figures 7L, M). M2-marker Arg1 was down-regulated after E.coli exposure and Mrc1 was downregulated both after E.coli particle and IgG bead exposure as compared to M2-like cells cultured without phagocytosis substrates (Figures 7N, O).
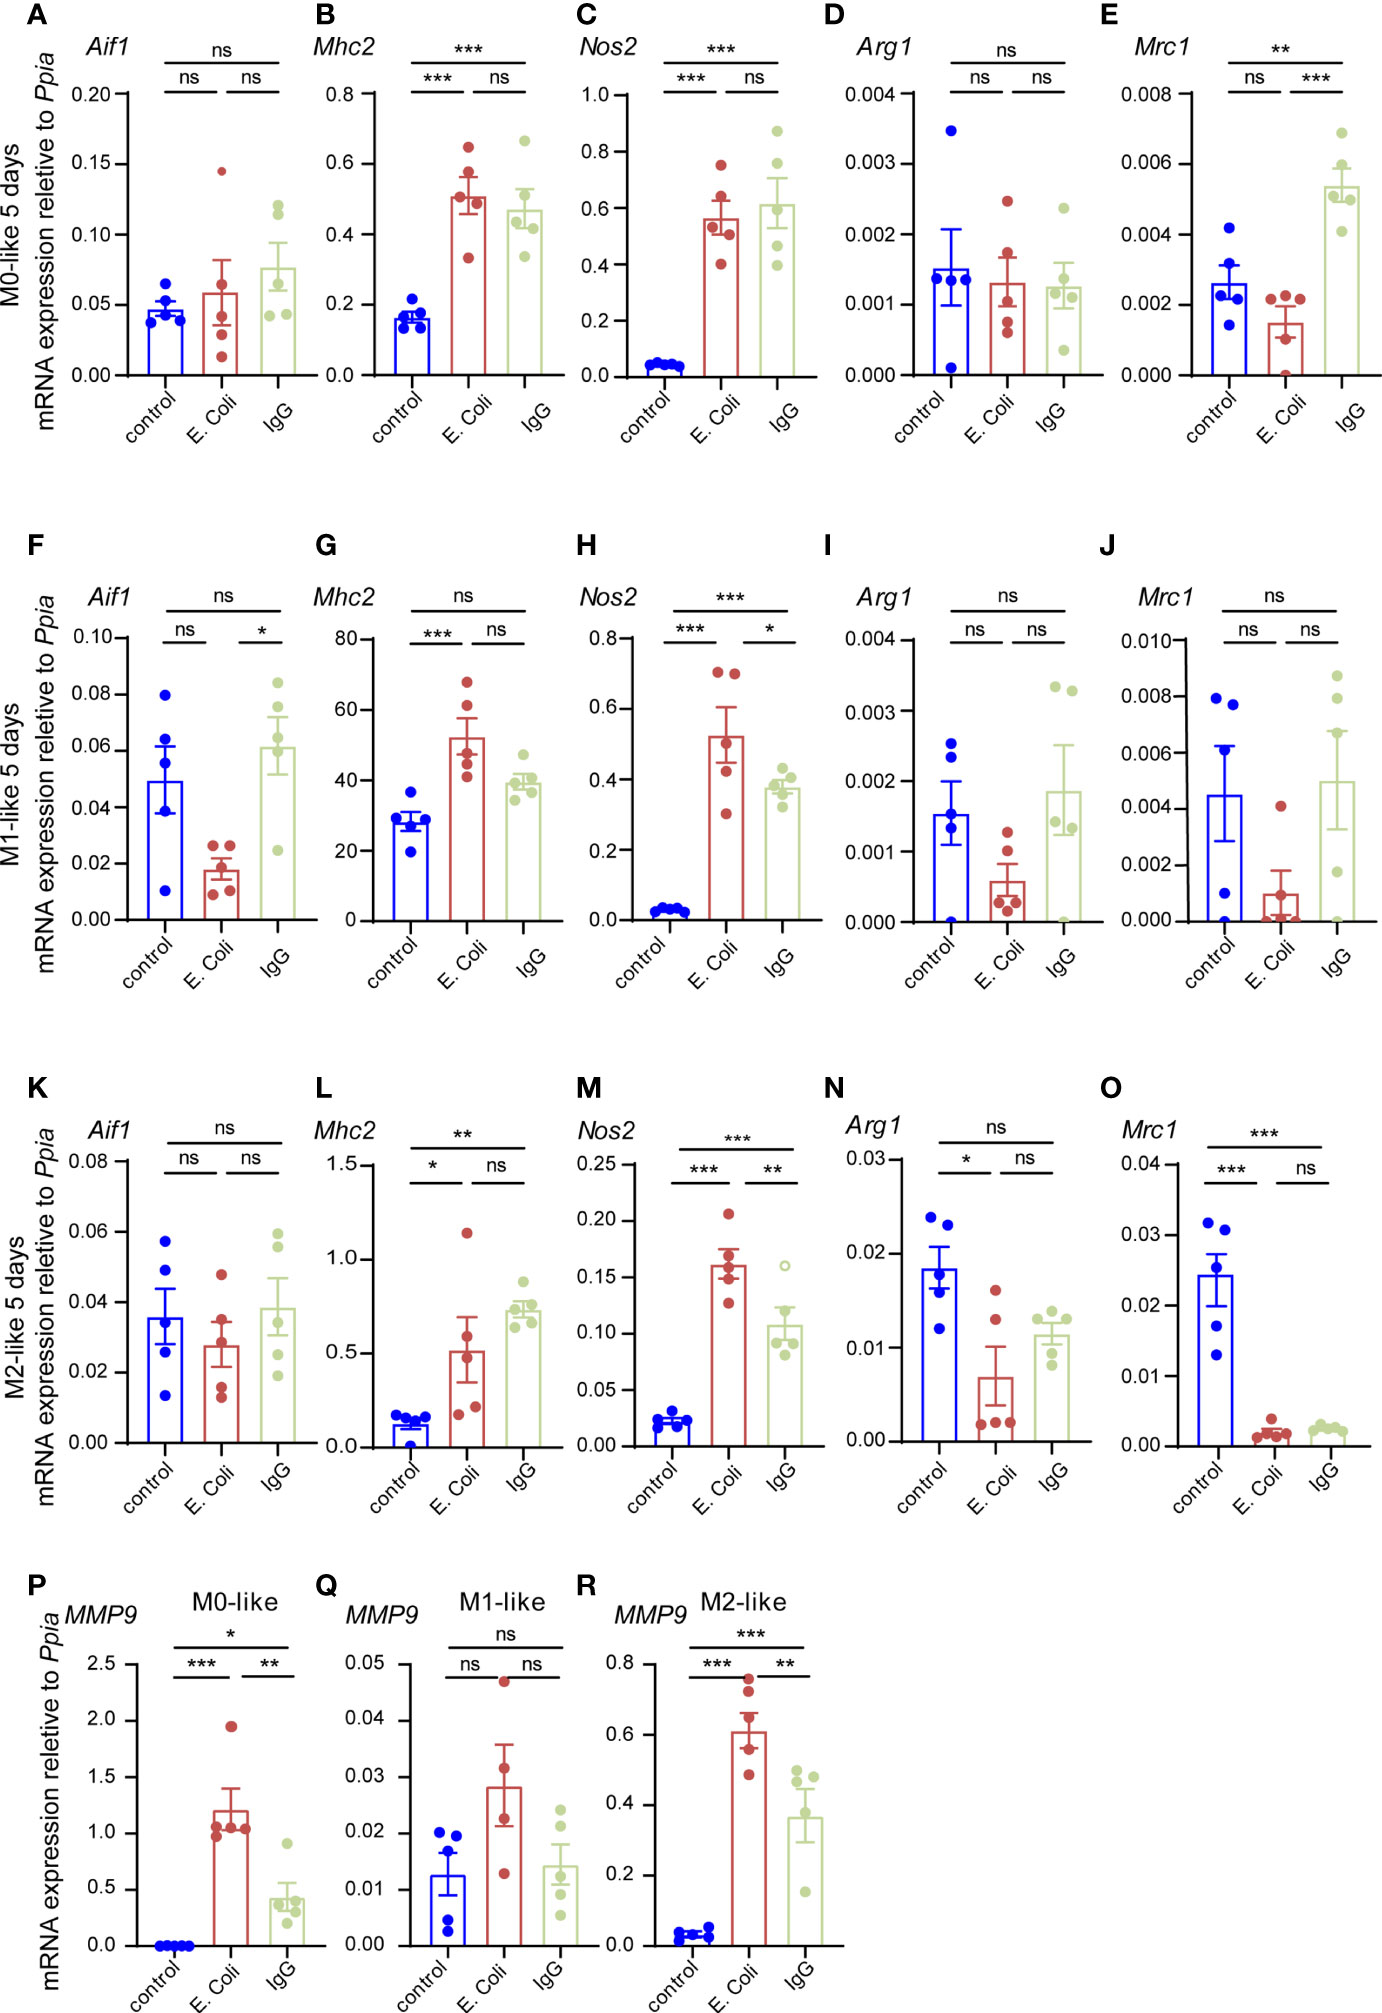
Figure 7 Microglia subtypes show M1-like gene expression after prolonged phagocytosis substrate exposure (A–R) Gene expression analyses of microglia subtypes after prolonged phagocytosis substrate exposure (E.coli-rhodamine particles, IgG-FITC beads) for the pan-marker Aif1, M1-markers Mhc2, Nos2 and M2 markers Arg1, Mrc1 as well as the glia activation marker Mmp9. Ppia was used as a reference gene. (A–E) In M0-like microglia, conditions with E.coli particles or IgG beads show up-regulation of M1 markers Mhc2 and Nos2 as well as up-regulation of M2 marker Mrc1 as compared to M0-like microglia not exposed to phagocytosis substrate (control). (F–J) In M1-like microglia, conditions with E.coli particles show downregulation of microglia pan-marker Aif1 and up-regulation of M1 markers Mhc2 and Nos2 but down-regulation of M2 markers Arg1 and Mrc1 and conditions with IgG show up-regulation of Nos2 as compared to M1-like microglia not exposed to phagocytosis substrate (control). (K–O) In M2-like microglia, conditions with E.coli particles or IgG beads show up-regulation of M1 markers Mhc2 and Nos2 as compared to M2-like microglia not exposed to phagocytosis substrate (control). Down-regulation of M2 marker Arg1 was observed in conditions with E.coli particles as well as down-regulation of Mrc1 in conditions with E.coli particles or IgG beads as compared to M2-like microglia not exposed to phagocytosis substrate (control). (P–R) The glia activation marker Mmp9 was up-regulated in M0- and M2-like microglia both in conditions with E.coli particles of IgG beads as compared to microglia subtypes not exposed to phagocytosis substrate (control). Multiple comparisons were performed dependent on data distribution by one-way Anova (post-hoc correction Holm-Šídák) or Kruskal-Wallis test (post-hoc correction Dunnett), if F achieved the necessary level of statistical significance p < 0.05. Data points are shown for biological replicates and expressed as mean ± SEM, p* ≤ 0.05, p** ≤ 0.01, p*** ≤ 0.001.
Thus, microglia subtypes subjected to prolonged exposure to phagocytosis substrate for 5 days displayed changes in M1/M2 marker gene expression indicating a shift towards M1-like phenotypes. Recently, it was shown that phagocytosis of E.coli particles by M0-like microglia leads to delayed release of the matrix metalloproteinase MMP-9 (43) suggesting that Mmp9 gene expression may serve as a marker for microglia plasticity in response to phagocytosis substrate exposure. Indeed, Mmp9 expression was up-regulated in M0- and M2-like microglia after 5 days exposure to E.coli particles or IgG beads as compared to control cultures without phagocytosis substrate. However, Mmp9 expression did not increased significantly in M1-like microglia (Figures 7P–R) suggesting that Mmp9 gene expression was stronger induced in microglia undergoing shifts towards a M1-like phenotype.
Discussion
This study examined phagocytosis efficiencies of M0-, M1-, and M2-like microglia for E.coli particles and IgG-opsonized beads over different time periods in vitro. These substrates were chosen due to their pathological relevance, their common use in phagocytosis research and better detection and quantification properties compared to soluble fluorophore-conjugated molecules. Cell cultivation and phagocytosis assays were carried out in the presence of serum to mimic pathophysiological conditions of BBB breakdown such as meningitis, trauma or stroke (38, 39). We found that microglia subtypes differ in phagocytosis efficiencies for the two types of substrates in a time-dependent manner and long-term substrate exposure enhanced or induced M1-like profiles of M0-, M1-, and M2-like microglia, respectively. Our results suggest that phagocytosis substrates can trigger phenotype plasticity of microglia including M2 to M1 repolarization which may also take place in neurological conditions when microglia encounter different types of phagocytic substrates.
In general, our results showing substrate-specific phagocytosis efficiencies of distinct microglia subtypes are consistent with previous in vitro studies examining phagocytosis of diverse substrates such as zymosan, IgG-opsonized beads or Aβ by M1- and M2-like microglia (44–48). The prevailing view is that M2-like microglia show higher phagocytic activity than M1-like microglia. However, there are also conflicting observations on the phagocytic preference and efficiency of different microglia subtypes suggesting a context dependency (8, 14, 19, 20, 49, 50).
In the present study, when microglia were exposed to E.coli particles or IgG beads for 3 hours, we found that a higher proportion of M1-like than M2-like microglia phagocytose E.coli particles. This result is in agreement with findings that M1-like microglia, showing augmented release of NO and expression of pro-inflammatory cytokines, more efficiently phagocytose pathogenic bacteria than unstimulated microglia, but M2-like microglia were not examined (51, 52). Studies comparing in vitro phagocytosis dynamics between different microglia subtypes over time are scarce (53). Therefore, we conducted live imaging experiments over 16 hours in anticipation of gaining new insights. Similar to the 3 h exposure time, M1-like microglia internalized more E.coli particles over 16 h than M2-like microglia, and vice versa, M2-like microglia internalized more IgG beads than M1-like microglia. The strongest differences in substrate preference were found for M1-like microglia, which clearly preferred E.coli particles over IgG beads. This result supports and extends the aforementioned findings that M1-like microglia show high efficiency in the phagocytosis of pathogenic bacteria, which holds potential for novel therapeutic approaches e.g. in bacterial meningoencephalitis and sepsis (51, 52, 54, 55). In this context, factors have been identified, i.e. palmitoylethanolamide and activin A, to enhance phagocytosis of E.coli by M1-like microglia while preventing excessive and potentially harmful release of NO and pro-inflammatory cytokines (56–58). Interestingly, similar mechanisms may underlie therapeutic benefit after treatment of Alzheimer`s Disease model mice with the non-pyrogenic LPS-derivative monophosphoryl lipid A (59), which promotes phagocytosis of Aβ after 3 h of substrate exposure by pretreated microglia in vitro (18). To expand existing research, live cell imaging of microglia over a longer observation time might be useful to characterize this and other phagocytosis-enhancing drugs in terms of optimal stimulation protocols to achieve sufficient phagocytosis activity.
We further found that M2-like microglia internalized IgG beads more efficiently than M1-like microglia. These results are in line with previous studies showing efficient phagocytosis of substrates from other sources than E.coli by M2-like microglia (14–16). Likewise, M2-like microglia induced by SCF show increased phagocytosis of FITC-IgG opsonized beads as compared to GM-CSF-induced M1-like microglia (17, 48). However, we found time-dependent changes in substrate internalization of M2-like microglia, almost discontinuing both E.coli particle and IgG bead phagocytosis approximately 8 h after addition of the phagocytosis substrates. We have not addressed the question of whether stalled phagocytosis activity by M2-like microglia is a transient or permanent effect beyond the 16 h live imaging period. Interestingly, biphasic phagocytosis activities have been reported for bone marrow-derived macrophages with peaks at 4 h and 24 h and an intervening period of no internalization (60), but the underlying mechanisms are elusive. Rate-limiting factors reported for phagocytosis comprise scavenger receptors, Fcγ and/or complement receptors, the myosin/actin network, second messengers such as phosphoinoside, but also physical and metabolic constraints might play a role (61–64). Further studies using genetic, pharmacological and single-cell transcriptomics approaches are required to modulate key factors of phagocytosis and elucidate the molecular mechanisms underlying this and other observations of our study.
We found that after prolonged substrate exposure for 5 days all microglia subtypes showed a higher preference for E.coli particles than IgG beads. Notably, prolonged exposure resulted in increased expression of the M1 markers Mhc2 and Nos2 irrespectively of the substrate. Gene expression changes after prolonged IgG bead exposure were similar to those after prolonged E.coli particle exposure and in support of a shift towards M1-like phenotypes. These results suggest that phagocytosis associated with the cellular environment can be considered a key factor in the phenotype transformation of microglia. Indeed, it has become clear that phagocytosis is not an isolated cellular response and may represent a source of cellular heterogeneity and plasticity in different tissues (65). Compelling evidence was provided that this is also true for microglia in the CNS. Regional changes in epigenetic regulation of microglia transcriptomes have been connected to the basal phagocytic activity of microglia (66) and phagocytosis-induced transcriptional changes were demonstrated to support the long-term maintenance of hippocampal neurogenesis in mice (67). However, in mouse models of acute or chronic neurodegeneration, phagocytosis of apoptotic cells caused a microglia phenotype shift from a homeostatic to a neurodegenerative phenotype (68). Our results suggest that shifts towards pro-inflammatory M1-like phenotypes occur irrespectively of the pre-established microglia subtype thereby providing another piece of evidence for high microglia plasticity in response to environmental factors. We did not explore whether the presence or phagocytosis of E.coli particles or IgG beads were decisive for this phenotype shift but we favor the possibility that both phagocytosis, the environmental presence of substrate as well as the duration of substrate exposure is critical. Indeed, experimental evidence from macrophages shows time-dependent phenotypic switches in response to LPS (69). Dynamic changes in pro-inflammatory cytokine gene expression were also observed in M1-like microglia after myelin phagocytosis (70) and chronic myelin phagocytosis induces a disease-associated transcriptional state in microglia (71). Another non-mutually exclusive possibility is that increased pro-inflammatory cytokine expression mediates feedback loops that enhance or drive a phenotype shift towards M1-like profiles (72–75).
The same could apply to the metalloproteinase MMP-9, which is expressed by LPS-activated microglia in primary neuron-glia cultures (76) and secreted in a delayed manner by primary microglia in response to phagocytosis of E.coli particles (43). In support of a role of MMP-9 in microglia responses after phagocytosis, we found robust up-regulation of Mmp9 expression after long-term substrate exposure for 5 div. Interestingly, Mmp9 up-regulation was found in cultures showing shifts towards the M1-like phenotype whereas no up-regulation was observed in cultures of pre-differentiated M1-like cells. This finding suggests that MMP-9 may serve as a marker for microglia plasticity including M2 to M1 repolarization, consistent with observations on the positive regulation of MMP-9 expression by M1-like phenotype inducers IL-1, TNFα, and LPS and negative regulation by the M2-like phenotype inducers IL-4 and IL-10 (77). In addition, paracrine/autocrine loops involving MMP-9 have been suggested to amplify microglia activation, whereas deletion of MMP-9 maintained microglia in a resting phenotype in an animal model of spinal cord injury (78). These findings suggest a broader functional spectrum of MMP-9 and other matrix metalloproteinases (MMPs) released by microglia beyond established physiological roles in synaptic plasticity and extracellular matrix modeling (79) or pathological roles in neuroinflammation or gliomas, for example (77, 80, 81).
Our results further support the hypothesis that M1/M2 microglia can shift between functional phenotypes depending upon environmental signals, here E.coli particles or IgG beads. Similar processes may also take place in conditions of acute and chronic brain insults when microglia encounter different types of phagocytic substrates. Indeed, M2-like to M1-like shifts in microglia populations were also observed in models of ischemic stroke (82, 83), spinal cord injury (28), and traumatic brain injury (84, 85). Furthermore, phagocytosis by microglia can play an important role in chronic neurodegeneration as well as neurodevelopmental and neuropsychiatric disorders (86–88). Reprogramming patient-derived cells to microglia-like cells and testing for their phenotype plasticity and phagocytosis function may help to gain insights into pathological mechanisms. For example, schizophrenia patient-derived microglia-like cells show higher rates of synaptic phagocytosis and elimination and targeting microglia by the immunomodulatory drug minocycline reduced abnormal synapse elimination by phagocytosis (89). Interestingly, minocycline was proposed to act via inhibition of MMPs in the autism spectrum disorder fragile X syndrome (90) suggesting that better understanding the role of MMPs for microglia activation, phenotype plasticity, and phagocytic function may provide novel immunomodulatory treatment options.
Some limitations of this study should be considered. Our in vitro approach does not reproduce the brain environment, and many factors influencing microglial morphology, polarization and function are absent. To partially compensate for these limitations, we used primary glia cultures containing a substantial number of astrocytes in combination with microglia-specific immunolabelling as well as microglia-specific qPCR assays. The presence of astrocytes under the different experimental conditions likely influenced microglia responses as compared to pure microglia cultures since astrocytes modulate microglia polarization, activation and function. Conversely, activated microglia can trigger changes in the inflammatory profile of astrocytes both in vitro and in vivo (91, 92). As LPS-activated microglia can induce a neurotoxic A1 astrocyte phenotype (92), prolonged exposure of the primary glial cultures to E.coli particles affects microglia but also astrocytes. Therefore, further studies are required to examine possible alterations in astrocytes and their influence on microglia under the experimental conditions of our study. Another limitation in this study is the use of two different phagocytic substrates and fluorophore conjugates, which likely undergo different lysosomal processing and fluorescent decay after phagosomal acidification. This may particularly play a role for the long-term experiments and the results of the phagocytic uptake should be interpreted with caution. Importantly, regardless of this limitation, data on gene expression and nitric oxide levels demonstrate microglia plasticity and phenotype shifts after long-term substrate exposure. Finally, non-defined serum proteins in the, however heat-inactivated, culture media can trigger microglia activation as well as phagocytosis by microglia (38, 39, 93, 94). As indicated by previous findings, serum-derived IgG likely influenced phagocytosis by microglia in the present studies. It has been also shown that the opsonization of E.coli with human serum or murine IgG increases the phagocytic ability of macrophages to clear E.coli (60). However, given that the presence of serum mimics neuropathological conditions involving BBB damage in our in vitro model, the findings of this study may more closely resemble pathological in vivo conditions.
Data availability statement
The raw data supporting the conclusions of this article will be made available by the authors, without undue reservation.
Ethics statement
Ethical review and approval were not required for the animal study because we used newborn mice as a source for primary neurons which does not require an ethical review. Newborn mice to obtain primary glia were handled in accordance with the institutional guidelines of the Johannes Gutenberg University Mainz, and Rhineland-Palatine, Germany.
Author contributions
MS conceptualized and designed the study. SL performed the experiments, data collection, and analysis. IW assisted in experiments and data analysis. GH conducted microscopy methodology and advice on data analysis and interpretation. All authors contributed to the manuscript writing and approved the submitted version.
Funding
SL is financially supported by the China Scholarship Council.
Acknowledgments
Data shown in this manuscript are part of the doctoral thesis of SL presented to the Johannes Gutenberg-University Mainz. We gratefully acknowledge the excellent technical assistance of Dana Pieter and Tobias Hirnet.
Conflict of interest
The authors declare that the research was conducted in the absence of any commercial or financial relationships that could be construed as a potential conflict of interest.
Publisher’s note
All claims expressed in this article are solely those of the authors and do not necessarily represent those of their affiliated organizations, or those of the publisher, the editors and the reviewers. Any product that may be evaluated in this article, or claim that may be made by its manufacturer, is not guaranteed or endorsed by the publisher.
Supplementary material
The Supplementary Material for this article can be found online at: https://www.frontiersin.org/articles/10.3389/fimmu.2022.945485/full#supplementary-material
References
1. Norden DM, Fenn AM, Dugan A, Godbout JP. TGFβ produced by IL-10 redirected astrocytes attenuates microglial activation. Glia. (2014) 62(6):881–95. doi: 10.1002/glia.22647
2. Butovsky O, Weiner HL. Microglial signatures and their role in health and disease. Nat Rev Neurosci (2018) 19(10):622–35. doi: 10.1038/s41583-018-0057-5
3. Waisman A, Ginhoux F, Greter M, Bruttger J. Homeostasis of microglia in the adult brain: Review of novel microglia depletion systems. Trends Immunol (2015) 36(10):625–36. doi: 10.1016/j.it.2015.08.005
4. Prinz M, Masuda T, Wheeler MA, Quintana FJ. Microglia and central nervous system-associated macrophages-from origin to disease modulation. Annu Rev Immunol (2021) 39:251–77. doi: 10.1146/annurev-immunol-093019-110159
5. Loane DJ, Kumar A. Microglia in the TBI brain: The good, the bad, and the dysregulated. Exp Neurol (2016) 275(Pt 3Pt 3):316–27. doi: 10.1016/j.expneurol.2015.08.018
6. Akhmetzyanova E, Kletenkov K, Mukhamedshina Y, Rizvanov A. Different approaches to modulation of microglia phenotypes after spinal cord injury. Front Syst Neurosci (2019) 13. doi: 10.3389/fnsys.2019.00037
7. Giunti D, Parodi B, Cordano C, Uccelli A, Kerlero de Rosbo N. Can we switch microglia's phenotype to foster neuroprotection? focus on multiple sclerosis. Immunology (2014) 141(3):328–39. doi: 10.1111/imm.12177
8. Celorrio M, Abellanas MA, Rhodes J, Goodwin V, Moritz J, Vadivelu S, et al. Gut microbial dysbiosis after traumatic brain injury modulates the immune response and impairs neurogenesis. Acta neuropathol Commun (2021) 9(1):40. doi: 10.1186/s40478-021-01137-2
9. Márquez-Ropero M, Benito E, Plaza-Zabala A, Sierra A. Microglial corpse clearance: Lessons from macrophages. Front Immunol (2020) 11. doi: 10.3389/fimmu.2020.00506
10. Zhang F, Parayath NN, Ene CI, Stephan SB, Koehne AL, Coon ME, et al. Genetic programming of macrophages to perform anti-tumor functions using targeted mRNA nanocarriers. Nat Commun (2019) 10(1):3974. doi: 10.1038/s41467-019-11911-5
11. Wang Q, Yao H, Liu W, Ya B, Cheng H, Xing Z, et al. Microglia polarization in alzheimer's disease: Mechanisms and a potential therapeutic target. Front Aging Neurosci (2021) 13:772717. doi: 10.3389/fnagi.2021.772717
12. Thorsdottir S, Henriques-Normark B, Iovino F. The role of microglia in bacterial meningitis: Inflammatory response, experimental models and new neuroprotective therapeutic strategies. Front Microbiol (2019) 10:576–. doi: 10.3389/fmicb.2019.00576
13. Shemer A, Erny D, Jung S, Prinz M. Microglia plasticity during health and disease: An immunological perspective. Trends Immunol (2015) 36(10):614–24. doi: 10.1016/j.it.2015.08.003
14. Yi S, Jiang X, Tang X, Li Y, Xiao C, Zhang J, et al. IL-4 and IL-10 promotes phagocytic activity of microglia by up-regulation of TREM2. Cytotechnology (2020) 72(4):589–602. doi: 10.1007/s10616-020-00409-4
15. Mossad O, Erny D. The microbiota-microglia axis in central nervous system disorders. Brain Pathol (Zurich Switzerland) (2020) 30(6):1159–77. doi: 10.1111/bpa.12908
16. Healy LM, Perron G, Won SY, Michell-Robinson MA, Rezk A, Ludwin SK, et al. MerTK is a functional regulator of myelin phagocytosis by human myeloid cells. J Immunol (2016) 196(8):3375–84. doi: 10.4049/jimmunol.1502562
17. Braniste V, Al-Asmakh M, Kowal C, Anuar F, Abbaspour A, Tóth M, et al. The gut microbiota influences blood-brain barrier permeability in mice. Sci Transl Med (2014) 6(263):263ra158–263ra158. doi: 10.1126/scitranslmed.3009759
18. Kobayashi Y, Inagawa H, Kohchi C, Okazaki K, Zhang R, Soma G. Effect of lipopolysaccharide derived from pantoea agglomerans on the phagocytic activity of amyloid β by primary murine microglial cells. Anticancer Res (2016) 36(7):3693–8.
19. Koenigsknecht-Talboo J, Landreth GE. Microglial phagocytosis induced by fibrillar beta-amyloid and IgGs are differentially regulated by proinflammatory cytokines. J Neurosci (2005) 25(36):8240–9. doi: 10.1523/JNEUROSCI.1808-05.2005
20. He Y, Taylor N, Yao X, Bhattacharya A. Mouse primary microglia respond differently to LPS and poly(I:C) in vitro. Sci Rep (2021) 11(1):10447. doi: 10.1038/s41598-021-89777-1
21. Neher JJ, Emmrich JV, Fricker M, Mander PK, Théry C, Brown GC. Phagocytosis executes delayed neuronal death after focal brain ischemia. Proc Natl Acad Sci USA (2013) 110(43):E4098–107. doi: 10.1073/pnas.1308679110
22. Fourgeaud L, Través PG, Tufail Y, Leal-Bailey H, Lew ED, Burrola PG, et al. TAM receptors regulate multiple features of microglial physiology. Nature. (2016) 532(7598):240–4. doi: 10.1038/nature17630
23. Fricker M, Oliva-Martín MJ, Brown GC. Primary phagocytosis of viable neurons by microglia activated with LPS or aβ is dependent on calreticulin/LRP phagocytic signalling. J Neuroinflamm (2012) 9(1):196. doi: 10.1186/1742-2094-9-196
24. Lauro C, Chece G, Monaco L, Antonangeli F, Peruzzi G, Rinaldo S, et al. Fractalkine modulates microglia metabolism in brain ischemia. Front Cell Neurosci (2019) 13:414. doi: 10.3389/fncel.2019.00414
25. Fuller AD, Van Eldik LJ. MFG-E8 regulates microglial phagocytosis of apoptotic neurons. J Neuroimmune Pharmacol (2008) 3(4):246–56. doi: 10.1007/s11481-008-9118-2
26. Michelucci A, Heurtaux T, Grandbarbe L, Morga E, Heuschling P. Characterization of the microglial phenotype under specific pro-inflammatory and anti-inflammatory conditions: Effects of oligomeric and fibrillar amyloid-beta. J Neuroimmunol (2009) 210(1-2):3–12. doi: 10.1016/j.jneuroim.2009.02.003
27. Siddiqui TA, Lively S, Schlichter LC. Complex molecular and functional outcomes of single versus sequential cytokine stimulation of rat microglia. J Neuroinflamm (2016) 13(1):66. doi: 10.1186/s12974-016-0531-9
28. Kroner A, Greenhalgh AD, Zarruk JG, Passos Dos Santos R, Gaestel M, David S. TNF and increased intracellular iron alter macrophage polarization to a detrimental M1 phenotype in the injured spinal cord. Neuron. (2014) 83(5):1098–116. doi: 10.1016/j.neuron.2014.07.027
29. Grajchen E, Wouters E, van de Haterd B, Haidar M, Hardonnière K, Dierckx T, et al. CD36-mediated uptake of myelin debris by macrophages and microglia reduces neuroinflammation. J Neuroinflam (2020) 17(1):224–. doi: 10.1186/s12974-020-01899-x
30. Anderson SR, Roberts JM, Ghena N, Irvin EA, Schwakopf J, Cooperstein IB, et al. Neuronal apoptosis drives remodeling states of microglia and shifts in survival pathway dependence. Elife. (2022) 11:e76564. doi: 10.7554/eLife.76564
31. Anderson SR, Roberts JM, Zhang J, Steele MR, Romero CO, Bosco A, et al. Developmental apoptosis promotes a disease-related gene signature and independence from CSF1R signaling in retinal microglia. Cell Rep (2019) 27(7):2002–13.e5. doi: 10.1016/j.celrep.2019.04.062
32. Wei J, Pan X, Pei Z, Wang W, Qiu W, Shi Z, et al. The beta-lactam antibiotic, ceftriaxone, provides neuroprotective potential via anti-excitotoxicity and anti-inflammation response in a rat model of traumatic brain injury. J Trauma acute Care surg (2012) 73(3):654–60. doi: 10.1097/TA.0b013e31825133c0
33. Kielian T, Esen N, Liu S, Phulwani NK, Syed MM, Phillips N, et al. Minocycline modulates neuroinflammation independently of its antimicrobial activity in staphylococcus aureus-induced brain abscess. Am J pathol (2007) 171(4):1199–214. doi: 10.2353/ajpath.2007.070231
34. Bryan NS, Grisham MB. Methods to detect nitric oxide and its metabolites in biological samples. Free Radic Biol Med (2007) 43(5):645–57. doi: 10.1016/j.freeradbiomed.2007.04.026
35. Larionov A, Krause A, Miller W. A standard curve based method for relative real time PCR data processing. BMC Bioinf (2005) 6:62. doi: 10.1186/1471-2105-6-62
36. Timaru-Kast R, Gotthardt P, Luh C, Huang C, Hummel R, Schäfer MKE, et al. Angiotensin II receptor 1 blockage limits brain damage and improves functional outcome after brain injury in aged animals despite age-dependent reduction in AT1 expression. Front Aging Neurosci (2019) 11:63. doi: 10.3389/fnagi.2019.00063
37. Chistiakov DA, Killingsworth MC, Myasoedova VA, Orekhov AN, Bobryshev YV. CD68/macrosialin: not just a histochemical marker. Lab Invest (2017) 97(1):4–13. doi: 10.1038/labinvest.2016.116
38. Bohlen CJ, Bennett FC, Tucker AF, Collins HY, Mulinyawe SB, Barres BA. Diverse requirements for microglial survival, specification, and function revealed by defined-medium cultures. Neuron. (2017) 94(4):759–73.e8. doi: 10.1016/j.neuron.2017.04.043
39. Jolivel V, Brun S, Binamé F, Benyounes J, Taleb O, Bagnard D, et al. Microglial cell morphology and phagocytic activity are critically regulated by the neurosteroid allopregnanolone: A possible role in neuroprotection. Cells. (2021) 10(3):698. doi: 10.3390/cells10030698
40. Rosales C, Uribe-Querol E. Phagocytosis: A fundamental process in immunity. BioMed Res Int (2017) 2017:9042851. doi: 10.1155/2017/9042851
41. Chhor V, Le Charpentier T, Lebon S, Oré M-V, Celador IL, Josserand J, et al. Characterization of phenotype markers and neuronotoxic potential of polarised primary microglia in vitro. Brain Behavior Immunity (2013) 32:70–85. doi: 10.1016/j.bbi.2013.02.005
42. Nikodemova M, Watters JJ, Jackson SJ, Yang SK, Duncan ID. Minocycline down-regulates MHC II expression in microglia and macrophages through inhibition of IRF-1 and protein kinase c (PKC)alpha/betaII. J Biol Chem (2007) 282(20):15208–16. doi: 10.1074/jbc.M611907200
43. Hamanaka G, Kubo T, Ohtomo R, Takase H, Reyes-Bricio E, Oribe S, et al. Microglial responses after phagocytosis: Escherichia coli bioparticles, but not cell debris or amyloid beta, induce matrix metalloproteinase-9 secretion in cultured rat primary microglial cells. Glia. (2020) 68(7):1435–44. doi: 10.1002/glia.23791
44. Yang Z, Kuboyama T, Tohda C. Naringenin promotes microglial M2 polarization and aβ degradation enzyme expression. Phytother Res (2019) 33(4):1114–21. doi: 10.1002/ptr.6305
45. Harrigan TJ, Abdullaev IF, Jourd'heuil D, Mongin AA. Activation of microglia with zymosan promotes excitatory amino acid release via volume-regulated anion channels: the role of NADPH oxidases. J Neurochem (2008) 106(6):2449–62. doi: 10.1111/j.1471-4159.2008.05553.x
46. Xie L, Zhang N, Zhang Q, Li C, Sandhu AF, Iii GW, et al. Inflammatory factors and amyloid β-induced microglial polarization promote inflammatory crosstalk with astrocytes. Aging (Albany NY) (2020) 12(22):22538–49. doi: 10.18632/aging.103663
47. Wang Y, Zhu T, Wang M, Zhang F, Zhang G, Zhao J, et al. Icariin attenuates M1 activation of microglia and aβ plaque accumulation in the hippocampus and prefrontal cortex by up-regulating PPARγ in Restraint/Isolation-stressed APP/PS1 mice. Front Neurosci (2019) 13:291. doi: 10.3389/fnins.2019.00291
48. Terashima T, Nakae Y, Katagi M, Okano J, Suzuki Y, Kojima H. Stem cell factor induces polarization of microglia to the neuroprotective phenotype in vitro. Heliyon. (2018) 4(10):e00837. doi: 10.1016/j.heliyon.2018.e00837
49. Vay SU, Flitsch LJ, Rabenstein M, Rogall R, Blaschke S, Kleinhaus J, et al. The plasticity of primary microglia and their multifaceted effects on endogenous neural stem cells in vitro and in vivo. J Neuroinflamm (2018) 15(1):226. doi: 10.1186/s12974-018-1261-y
50. Cherry JD, Olschowka JA, O'Banion MK. Neuroinflammation and M2 microglia: the good, the bad, and the inflamed. J Neuroinflamm (2014) 11:98. doi: 10.1186/1742-2094-11-98
51. Nau R, Ribes S, Djukic M, Eiffert H. Strategies to increase the activity of microglia as efficient protectors of the brain against infections. Front Cell Neurosci (2014) 8:138. doi: 10.3389/fncel.2014.00138
52. Redlich S, Ribes S, Schütze S, Eiffert H, Nau R. Toll-like receptor stimulation increases phagocytosis of cryptococcus neoformans by microglial cells. J Neuroinflamm (2013) 10:71. doi: 10.1186/1742-2094-10-71
53. Andoh M, Koyama R. Assessing microglial dynamics by live imaging. Front Immunol (2021) 12:617564. doi: 10.3389/fimmu.2021.617564
54. Kim J, Kim JH, Do JY, Lee JY, Yanai R, Lee IK, et al. Key role of microglial matrix metalloproteinases in choroidal neovascularization. Front Cell Neurosci (2021) 15:638098. doi: 10.3389/fncel.2021.638098
55. Barichello T, Generoso JS, Simões LR, Goularte JA, Petronilho F, Saigal P, et al. Role of microglial activation in the pathophysiology of bacterial meningitis. Mol Neurobiol (2016) 53(3):1770–81. doi: 10.1007/s12035-015-9107-4
56. Redlich S, Ribes S, Schütze S, Nau R. Palmitoylethanolamide stimulates phagocytosis of escherichia coli K1 by macrophages and increases the resistance of mice against infections. J Neuroinflamm (2014) 11:108. doi: 10.1186/1742-2094-11-108
57. Diesselberg C, Ribes S, Seele J, Kaufmann A, Redlich S, Bunkowski S, et al. Activin a increases phagocytosis of escherichia coli K1 by primary murine microglial cells activated by toll-like receptor agonists. J Neuroinflamm (2018) 15(1):175. doi: 10.1186/s12974-018-1209-2
58. Redlich S, Ribes S, Schütze S, Czesnik D, Nau R. Palmitoylethanolamide stimulates phagocytosis of escherichia coli K1 and streptococcus pneumoniae R6 by microglial cells. J Neuroimmunol (2012) 244(1):32–4. doi: 10.1016/j.jneuroim.2011.12.013
59. Michaud JP, Hallé M, Lampron A, Thériault P, Préfontaine P, Filali M, et al. Toll-like receptor 4 stimulation with the detoxified ligand monophosphoryl lipid a improves alzheimer's disease-related pathology. Proc Natl Acad Sci USA (2013) 110(5):1941–6. doi: 10.1073/pnas.1215165110
60. Kapellos TS, Taylor L, Lee H, Cowley SA, James WS, Iqbal AJ, et al. A novel real time imaging platform to quantify macrophage phagocytosis. Biochem Pharmacol (2016) 116:107–19. doi: 10.1016/j.bcp.2016.07.011
61. Zhang Y, Hoppe AD, Swanson JA. Coordination of fc receptor signaling regulates cellular commitment to phagocytosis. Proc Natl Acad Sci U S A. (2010) 107(45):19332–7. doi: 10.1073/pnas.1008248107
62. Gu BJ, Wiley JS. P2X7 as a scavenger receptor for innate phagocytosis in the brain. Br J Pharmacol (2018) 175(22):4195–208. doi: 10.1111/bph.14470
63. Zent CS, Elliott MR. Maxed out macs: physiologic cell clearance as a function of macrophage phagocytic capacity. FEBS J (2017) 284(7):1021–39. doi: 10.1111/febs.13961
64. Jaumouillé V, Waterman CM. Physical constraints and forces involved in phagocytosis. Front Immunol (2020) 11. doi: 10.3389/fimmu.2020.01097
65. A-Gonzalez N, Quintana JA, García-Silva S, Mazariegos M, González de la Aleja A, Nicolás-Ávila JA, et al. Phagocytosis imprints heterogeneity in tissue-resident macrophages. J Exp Med (2017) 214(5):1281–96. doi: 10.1084/jem.20161375
66. Ayata P, Badimon A, Strasburger HJ, Duff MK, Montgomery SE, Loh YE, et al. Epigenetic regulation of brain region-specific microglia clearance activity. Nat Neurosci (2018) 21(8):1049–60. doi: 10.1038/s41593-018-0192-3
67. Diaz-Aparicio I, Paris I, Sierra-Torre V, Plaza-Zabala A, Rodriguez-Iglesias N, Marquez-Ropero M, et al. Microglia actively remodel adult hippocampal neurogenesis through the phagocytosis secretome. J Neurosci (2020) 40(7):1453–82. doi: 10.1523/JNEUROSCI.0993-19.2019
68. Krasemann S, Madore C, Cialic R, Baufeld C, Calcagno N, El Fatimy R, et al. The TREM2-APOE pathway drives the transcriptional phenotype of dysfunctional microglia in neurodegenerative diseases. Immunity (2017) 47(3):566–81.e9. doi: 10.1016/j.immuni.2017.08.008
69. Zhang W, Zhang Y, He Y, Wang X, Fang Q. Lipopolysaccharide mediates time-dependent macrophage M1/M2 polarization through the Tim-3/Galectin-9 signalling pathway. Exp Cell Res (2019) 376(2):124–32. doi: 10.1016/j.yexcr.2019.02.007
70. Liu Y, Hao W, Letiembre M, Walter S, Kulanga M, Neumann H, et al. Suppression of microglial inflammatory activity by myelin phagocytosis: role of p47-PHOX-mediated generation of reactive oxygen species. J Neurosci (2006) 26(50):12904–13. doi: 10.1523/JNEUROSCI.2531-06.2006
71. Nugent AA, Lin K, van Lengerich B, Lianoglou S, Przybyla L, Davis SS, et al. TREM2 regulates microglial cholesterol metabolism upon chronic phagocytic challenge. Neuron. (2020) 105(5):837–54.e9. doi: 10.1016/j.neuron.2019.12.007
72. Kim S, Son Y. Astrocytes stimulate microglial proliferation and M2 polarization In vitro through crosstalk between astrocytes and microglia. Int J Mol Sci (2021) 22(16):8800. doi: 10.3390/ijms22168800
73. Guo S, Wang H, Yin Y. Microglia polarization from M1 to M2 in neurodegenerative diseases. Front Aging Neurosci (2022) 14. doi: 10.3389/fnagi.2022.815347
74. Chow JC, Young DW, Golenbock DT, Christ WJ, Gusovsky F. Toll-like receptor-4 mediates lipopolysaccharide-induced signal transduction. J Biol Chem (1999) 274(16):10689–92. doi: 10.1074/jbc.274.16.10689
75. Ribes S, Ebert S, Czesnik D, Regen T, Zeug A, Bukowski S, et al. Toll-like receptor prestimulation increases phagocytosis of escherichia coli DH5alpha and escherichia coli K1 strains by murine microglial cells. Infection immunity (2009) 77(1):557–64. doi: 10.1128/IAI.00903-08
76. Goshi N, Morgan RK, Lein PJ, Seker E. A primary neural cell culture model to study neuron, astrocyte, and microglia interactions in neuroinflammation. J neuroinflamma (2020) 17(1):155. doi: 10.1186/s12974-020-01819-z
77. Könnecke H, Bechmann I. The role of microglia and matrix metalloproteinases involvement in neuroinflammation and gliomas. Clin Dev Immunol (2013) 2013:914104. doi: 10.1155/2013/914104
78. Hansen CN, Fisher LC, Deibert RJ, Jakeman LB, Zhang H, Noble-Haeusslein L, et al. Elevated MMP-9 in the lumbar cord early after thoracic spinal cord injury impedes motor relearning in mice. J Neurosci (2013) 33(32):13101–11. doi: 10.1523/JNEUROSCI.1576-13.2013
79. Crapser JD, Arreola MA, Tsourmas KI, Green KN. Microglia as hackers of the matrix: sculpting synapses and the extracellular space. Cell Mol Immunol (2021) 18(11):2472–88. doi: 10.1038/s41423-021-00751-3
80. Huang Y, Zhang B, Haneke H, Haage V, Lubas M, Yuan Y, et al. Glial cell line-derived neurotrophic factor increases matrix metallopeptidase 9 and 14 expression in microglia and promotes microglia-mediated glioma progression. J Neurosci Res (2021) 99(4):1048–63. doi: 10.1002/jnr.24768
81. Annese V, Herrero MT, Di Pentima M, Gomez A, Lombardi L, Ros CM, et al. Metalloproteinase-9 contributes to inflammatory glia activation and nigro-striatal pathway degeneration in both mouse and monkey models of 1-methyl-4-phenyl-1,2,3,6-tetrahydropyridine (MPTP)-induced parkinsonism. Brain structure Funct (2015) 220(2):703–27. doi: 10.1007/s00429-014-0718-8
82. Hu X, Li P, Guo Y, Wang H, Leak RK, Chen S, et al. Microglia/macrophage polarization dynamics reveal novel mechanism of injury expansion after focal cerebral ischemia. Stroke (2012) 43(11):3063–70. doi: 10.1161/STROKEAHA.112.659656
83. Boddaert J, Bielen K, Jongers B, Manocha E, Yperzeele L, Cras P, et al. CD8 signaling in microglia/macrophage M1 polarization in a rat model of cerebral ischemia. PloS One (2018) 13(1):e0186937. doi: 10.1371/journal.pone.0186937
84. Wang G, Zhang J, Hu X, Zhang L, Mao L, Jiang X, et al. Microglia/macrophage polarization dynamics in white matter after traumatic brain injury. J Cereb Blood Flow Metab (2013) 33(12):1864–74. doi: 10.1038/jcbfm.2013.146
85. Sanchez Mejia RO, Ona VO, Li M, Friedlander RM. Minocycline reduces traumatic brain injury-mediated caspase-1 activation, tissue damage, and neurological dysfunction. Neurosurgery (2001) 48(6):1393–9. doi: 10.1097/00006123-200106000-00051
86. Tay TL, Béchade C, D'Andrea I, St-Pierre MK, Henry MS, Roumier A, et al. Microglia gone rogue: Impacts on psychiatric disorders across the lifespan. Front Mol Neurosci (2017) 10:421. doi: 10.3389/fnmol.2017.00421
87. Zengeler KE, Lukens JR. Innate immunity at the crossroads of healthy brain maturation and neurodevelopmental disorders. Nat Rev Immunol (2021) 21(7):454–68. doi: 10.1038/s41577-020-00487-7
88. Wang K, Li J, Zhang Y, Huang Y, Chen D, Shi Z, et al. Central nervous system diseases related to pathological microglial phagocytosis. CNS Neurosci Ther (2021) 27(5):528–39. doi: 10.1111/cns.13619
89. Sellgren CM, Gracias J, Watmuff B, Biag JD, Thanos JM, Whittredge PB, et al. Increased synapse elimination by microglia in schizophrenia patient-derived models of synaptic pruning. Nat Neurosci (2019) 22(3):374–85. doi: 10.1038/s41593-018-0334-7
90. Siller SS, Broadie K. Matrix metalloproteinases and minocycline: therapeutic avenues for fragile X syndrome. Neural Plast (2012) 2012:124548. doi: 10.1155/2012/124548
91. Damisah EC, Hill RA, Rai A, Chen F, Rothlin CV, Ghosh S, et al. Astrocytes and microglia play orchestrated roles and respect phagocytic territories during neuronal corpse removal in vivo. Sci Advances (2020) 6(26):eaba3239. doi: 10.1126/sciadv.aba3239
92. Liddelow SA, Guttenplan KA, Clarke LE, Bennett FC, Bohlen CJ, Schirmer L, et al. Neurotoxic reactive astrocytes are induced by activated microglia. Nature (2017) 541(7638):481–7. doi: 10.1038/nature21029
93. Jolivel V, Bicker F, Binamé F, Ploen R, Keller S, Gollan R, et al. Perivascular microglia promote blood vessel disintegration in the ischemic penumbra. Acta Neuropathol (2015) 129(2):279–95. doi: 10.1007/s00401-014-1372-1
94. Glushakova OY, Johnson D, Hayes RL. Delayed increases in microvascular pathology after experimental traumatic brain injury are associated with prolonged inflammation, blood-brain barrier disruption, and progressive white matter damage. J Neurotrauma (2014) 31(13):1180–93. doi: 10.1089/neu.2013.3080
Keywords: brain, inflammation, immune response, microglia, phagocytosis, polarization, plasticity, live imaging
Citation: Li S, Wernersbach I, Harms GS and Schäfer MKE (2022) Microglia subtypes show substrate- and time-dependent phagocytosis preferences and phenotype plasticity. Front. Immunol. 13:945485. doi: 10.3389/fimmu.2022.945485
Received: 16 May 2022; Accepted: 04 August 2022;
Published: 29 August 2022.
Edited by:
Pedro A. Reche, Complutense University of Madrid, SpainReviewed by:
Youhei Egami, Kagawa University, JapanRoland Nau, University Medical Center Göttingen, Germany
Akira Monji, Saga University, Japan
Copyright © 2022 Li, Wernersbach, Harms and Schäfer. This is an open-access article distributed under the terms of the Creative Commons Attribution License (CC BY). The use, distribution or reproduction in other forums is permitted, provided the original author(s) and the copyright owner(s) are credited and that the original publication in this journal is cited, in accordance with accepted academic practice. No use, distribution or reproduction is permitted which does not comply with these terms.
*Correspondence: Michael K. E. Schäfer, michael.schaefer@unimedizin-mainz.de