 Guilin Wang1†
 Chen Miao2†
 Lijun Mo1†
 Ulf D. Kahlert3Jinfeng Wu1
 Minglin Ou1Renxiang Huang1Ruifa Feng1*
 Weiyi Pang4*
 Wenjie Shi3,5*
- 1Breast Center, The Second Affiliated Hospital of Guilin Medical University, Guilin, Guangxi, China
- 2Department of Pathology, The First Affiliated Hospital of Nanjing Medical University, Nanjing, China
- 3Molecular and Experimental Surgery,University Clinic for General, Visceral, Vascular and Transplantation Surgery, Faculty of Medicine, Otto-von-Guericke-University, Magdeburg, Germany
- 4Guangxi Key Laboratory of Environmental Exposomics and Entire Lifecycle Heath, Guilin Medical University, Guilin, Guangxi, China
- 5University Hospital for Gynecology, Pius-Hospital, University Medicine Oldenburg, Oldenburg, Germany
Introduction: Immune checkpoint inhibitors (ICIs) have shown promising results for the treatment of multiple cancers. ICIs and related therapies may also be useful for the treatment of thyroid cancer (TC). In TC, Myc binding protein 2 (MYCBP2) is correlated with inflammatory cell infiltration and cancer prognosis. However, the relationship between MYCBP2 expression and ICI efficacy in TC patients is unclear.
Methods: We downloaded data from two TC cohorts, including transcriptomic data and clinical prognosis data. The Tumor Immune Dysfunction and Exclusion (TIDE) algorithm was used to predict the efficacy of ICIs in TC patients. MCPcounter, xCell, and quanTIseq were used to calculate immune cell infiltration scores. Gene set enrichment analysis (GSEA) and single sample GSEA (ssGSEA) were used to evaluate signaling pathway scores. Immunohistochemical (IHC) analysis and clinical follow up was used to identify the MYCBP2 protein expression status in patients and associated with clinical outcome.
Results: A higher proportion of MYCBP2-high TC patients were predicted ICI responders than MYCBP2-low patients. MYCBP2-high patients also had significantly increased infiltration of CD8+ T cells, cytotoxic lymphocytes (CTLs), B cells, natural killer (NK) cells and dendritic cells (DC)s. Compared with MYCBP2-low patients, MYCBP2-high patients had higher expression of genes associated with B cells, CD8+ T cells, macrophages, plasmacytoid dendritic cells (pDCs), antigen processing and presentation, inflammatory stimulation, and interferon (IFN) responses. GSEA and ssGSEA also showed that MYCBP2-high patients had significantly increased activity of inflammatory factors and signaling pathways associated with immune responses.In addiation, Patients in our local cohort with high MYCBP2 expression always had a better prognosis and greater sensitivity to therapy while compared to patients with low MYCBP2 expression after six months clinic follow up.
Conclusions: In this study, we found that MYCBP2 may be a predictive biomarker for ICI efficacy in TC patients. High MYCBP2 expression was associated with significantly enriched immune cell infiltration. MYCBP2 may also be involved in the regulation of signaling pathways associated with anti-tumor immune responses or the production of inflammatory factors.
Introduction
Thyroid cancer (TC) originates from follicular epithelial cells or parafollicular epithelial cells of the thyroid. It is the most common malignant tumor in endocrine system and comprises about 90% of endocrine cancers (1, 2). Although most TCs are relatively inert and can be effectively treated by surgery, radiation,131 and thyroid stimulating hormone (TSH) inhibition therapy, some cases are refractory and eventually lead to disease progression, recurrence, and even death (3). Although targeted therapies such as kinase inhibitors can prolong patient prognosis, the effectiveness of kinase inhibitors is severely limited due to the rapid development of drug resistance and the occurrence of adverse reactions (4–8). In recent years, with increasing use of immune checkpoint inhibitors (ICIs) for anti-cancer therapy, research on the use of ICIs for TC is also rapidly advancing, with the hope of improving the prognosis of TC patients.
Previous research has shown that biomarkers predicting the efficacy of ICIs can help to screen patients and further improve prognoses (9, 10). At present, Programmed Cell Death-Ligand 1 (PD-L1) expression and tumor mutation burden (TMB) are the main markers of ICI effectiveness (9–12). However, these biomarkers also have some disadvantages: thresholds of TMB are different across studies, and PD-L1 detection platforms vary (13–16). Therefore, there is need to identify biomarkers that more comprehensively predict the efficacy of ICIs, allowing for the development of tumor precision medicine.
Myc binding protein 2 (MYCBP2) is a E3 ubiquitin ligase (17). Previous studies have shown that MYCBP is associated with the occurrence and prognosis of lung cancer, gastric cancer, breast cancer, and glioma (18–20). Pierre et al. found that MYCBP2 expression was associated with an M2-like macrophage phenotype in a mouse model (21). Schaid et al. found that MYCBP2 expression was associated with an elevated risk of invasive prostate cancer (22). However, the relationship between MYCBP2 expression and ICI efficacy in TC remains unclear.
In the present study, we downloaded data on a TC cohort from the Gene Expression Omnibus (GEO) database and a thyroid carcinoma (THCA) cohort from the Cancer Genome Atlas (TCGA) database. We used the Tumor Immune Dysfunction and Exclusion (TIDE) algorithm to predict the therapeutic effect of ICIs in TC patients. Next, we evaluated the relationship between MYCBP2 expression and ICI efficacy in TC patients and explored its potential molecular mechanism.
Methods
THCA cohort and ICIs datasets
We downloaded a THCA cohort (GSE138042-THCA) with transcriptomic data from the GEO database (https://www.ncbi.nlm.nih.gov/geo/) (23). We also downloaded another THCA cohort (TCGA-THCA) with gene expression profile data from TCGA database (https://portal.gdc.cancer.gov/) (24). Because the public databases did not publish data on the efficacy of ICIs by THCA, we used the TIDE algorithm (http://tide.dfci.harvard.edu) (25). The transcriptomic data from GSE138042-THCA and TCGA-THCA were used to predict the response of each patient to ICIs, and each patient was categorized as a responder or non-responder. We also downloaded data from an ICI-treated melanoma cohort (26) and an ICI-treated urothelial cancer (UC) (27) cohort, including transcriptomic data and prognostic data from the cbioportal webtools (https://www.cbioportal.org/) (28). Also, we downloaded two datasets related to the mice model treated with the ICIs [GSE146027 (29) and GSE151829 (30)]. We downloaded the expression data and survival data of different cancer types [GSE26304 (31), GSE1456 (32), GSE5327 (33), GSE30929 (34), GSE26939 (35), GSE30219 (36), GSE41271 (37), GSE30219 (36), GSE37745 (38), GSE50081 (39), GSE62452 (40), and GSE16560 (41)] to further validate the relationship between the expression of MYCBP2 and the survival time.
Analysis of tumor immune microenvironment
We downloaded the gene set of immune checkpoint (IC) related molecules and immune related molecules from CAMOIP (http://camoip.net/) (42). We used three immune cell evaluation algorithms (1.MCPcounter, 2.xCell, and 3.quanTIseq) to calculate the immune cell infiltration score of each THCA patient from the expression data (43–45).
Pathway enrichment analysis
We used gene set enrichment analysis (GSEA) to analyze the transcriptomic data of THCA patients and obtained pathway enrichment scores and P values of pathways from the Kyoto Encyclopedia of Genes and Genomes (KEGG) (https://www.kegg.jp/), Reactome (https://reactome.org/), Gene Ontology- Biological Process (GO-BP), Gene Ontology- Cellular Component (GO-CC), and Gene Ontology- Molecular Function (GO-MF) databases (46). We also applied the single sample GSEA (ssGSEA) algorithm to analyze the transcriptomic data of each THCA patient and then obtained the enrichment scores of each patient in the Molecular Signatures Database (MsigDB) database (http://www.gsea-msigdb.org/gsea/downloads.jsp) (47).
Immunohistochemical analysis and clinical follow up
To identify the MYCBP2 protein expression status in patients and associated with clinical outcome. We collect tissues samples from thyroid cancer patients,who accepted surgery operation in Breast Center of The Second Affiliated Hospital of Guilin Medical University, to conduct immunohistochemical analysis and follow up six months to evaluate the prognosis difference between high and low expression groups. Thirty-six tissues from twelve patients, each patient has three tissues obtained from different surgery sections, and these tissues were washed with Phosphate-Buffered Saline (PBS) and then incubated with 3% H2O2 for 10 minutes. Samples were incubated with antibody against MYCBP2 (1 mg/mL diluted 1:200, 27951, Proteintech, CA) at room temperature for two hours. After incubation with polymer enhancer for 20 minutes, the tissue was incubated with polymer enhancer and enzyme-labeled rabbit polymers. Slides were washed with PBS and fresh diaminobenzidine and counterstained with hematoxylin; antigen retrieval was performed using 0.1% HCl, and slides were then dehydrated with ethanol, cleaned with xylene, and fixed with neutral balata. The images were observed and photographed using a fluorescence microscope and visualized under a light microscope at 100× magnification by a blinded observer. Light to dark brown staining indicated a positive result from low to high. The stained areas were analyzed using Image J. Patients who donated samples for IHC also accepted clinical follow up to evaluate the association between MYCBP2 expression and patient outcomes following surgery. All patient and tissue studies were approved by the Ethics Committee of Breast Center of The Second Affiliated Hospital of Guilin Medical University.
Statistical analysis
The Mann-Whitney U test was used to compare differences between the MYCBP2-high and MYCBP2-low groups in continuous variables. Fisher’s exact test was used to compare differences between the two groups in categorical variables. Kaplan-Meier curves were used to visualize differences in overall survival (OS) time between the two groups, and a log rank test was used to calculate the difference in OS time. We used the ggplot2 R package to generate boxplots. Visualization and data analysis for the present study were conducted in Rstudio software (Version 4.1.2). P values were bilateral and P values < 0. 05 were considered statistically significant.
Results
Relationship between MYCBP2 expression and ICI efficacy in THCA
In the present study, we explored the relationship between MYCBP2 expression and ICI efficacy in THCA patients and analyzed potential molecular mechanisms for this relationship (Figure 1A). In the GSE138042-THCA cohort, MYCBP2-high patients receiving ICIs had a higher proportion of predicted responders than MYCBP2-low patients receiving ICIs (evaluated by the TIDE algorithm) (Figure 1B, P < 0. 05). MYCBP2-high patients in TCGA-THCA cohort also had a higher predicted response rate to ICIs (Figure 1C, P < 0. 05). Next, we used the ICI-treated melanoma and urothelial cohorts to further verify the relationship between MYCBP2 expression and prognosis in ICI-treated patients (Figures 1D, E). Figure 1D shows that MYCBP2-high melanoma patients had significantly longer OS time than MYCBP2-low patients (log rank P = 0. 019, HR = 0. 3). Figure 1E shows that MYCBP2-high urothelial cancer patients had a significantly longer OS time than MYCBP2-low patients (log rank P = 0. 041; HR = 0. 59, 95% CI: 0. 35-1). In the mice model, we found that the expression of Mycbp2 was significantly increased in the ICIs-responders compared with ICIs-non-responders (Supplementary Figures 1A, B). Also, in the multiple cancer types, we found that MYCBP2-high patients had significantly prolonged survival time compared with MYCBP2-low patients (Supplementary Table 1, Supplementary Figure 2).
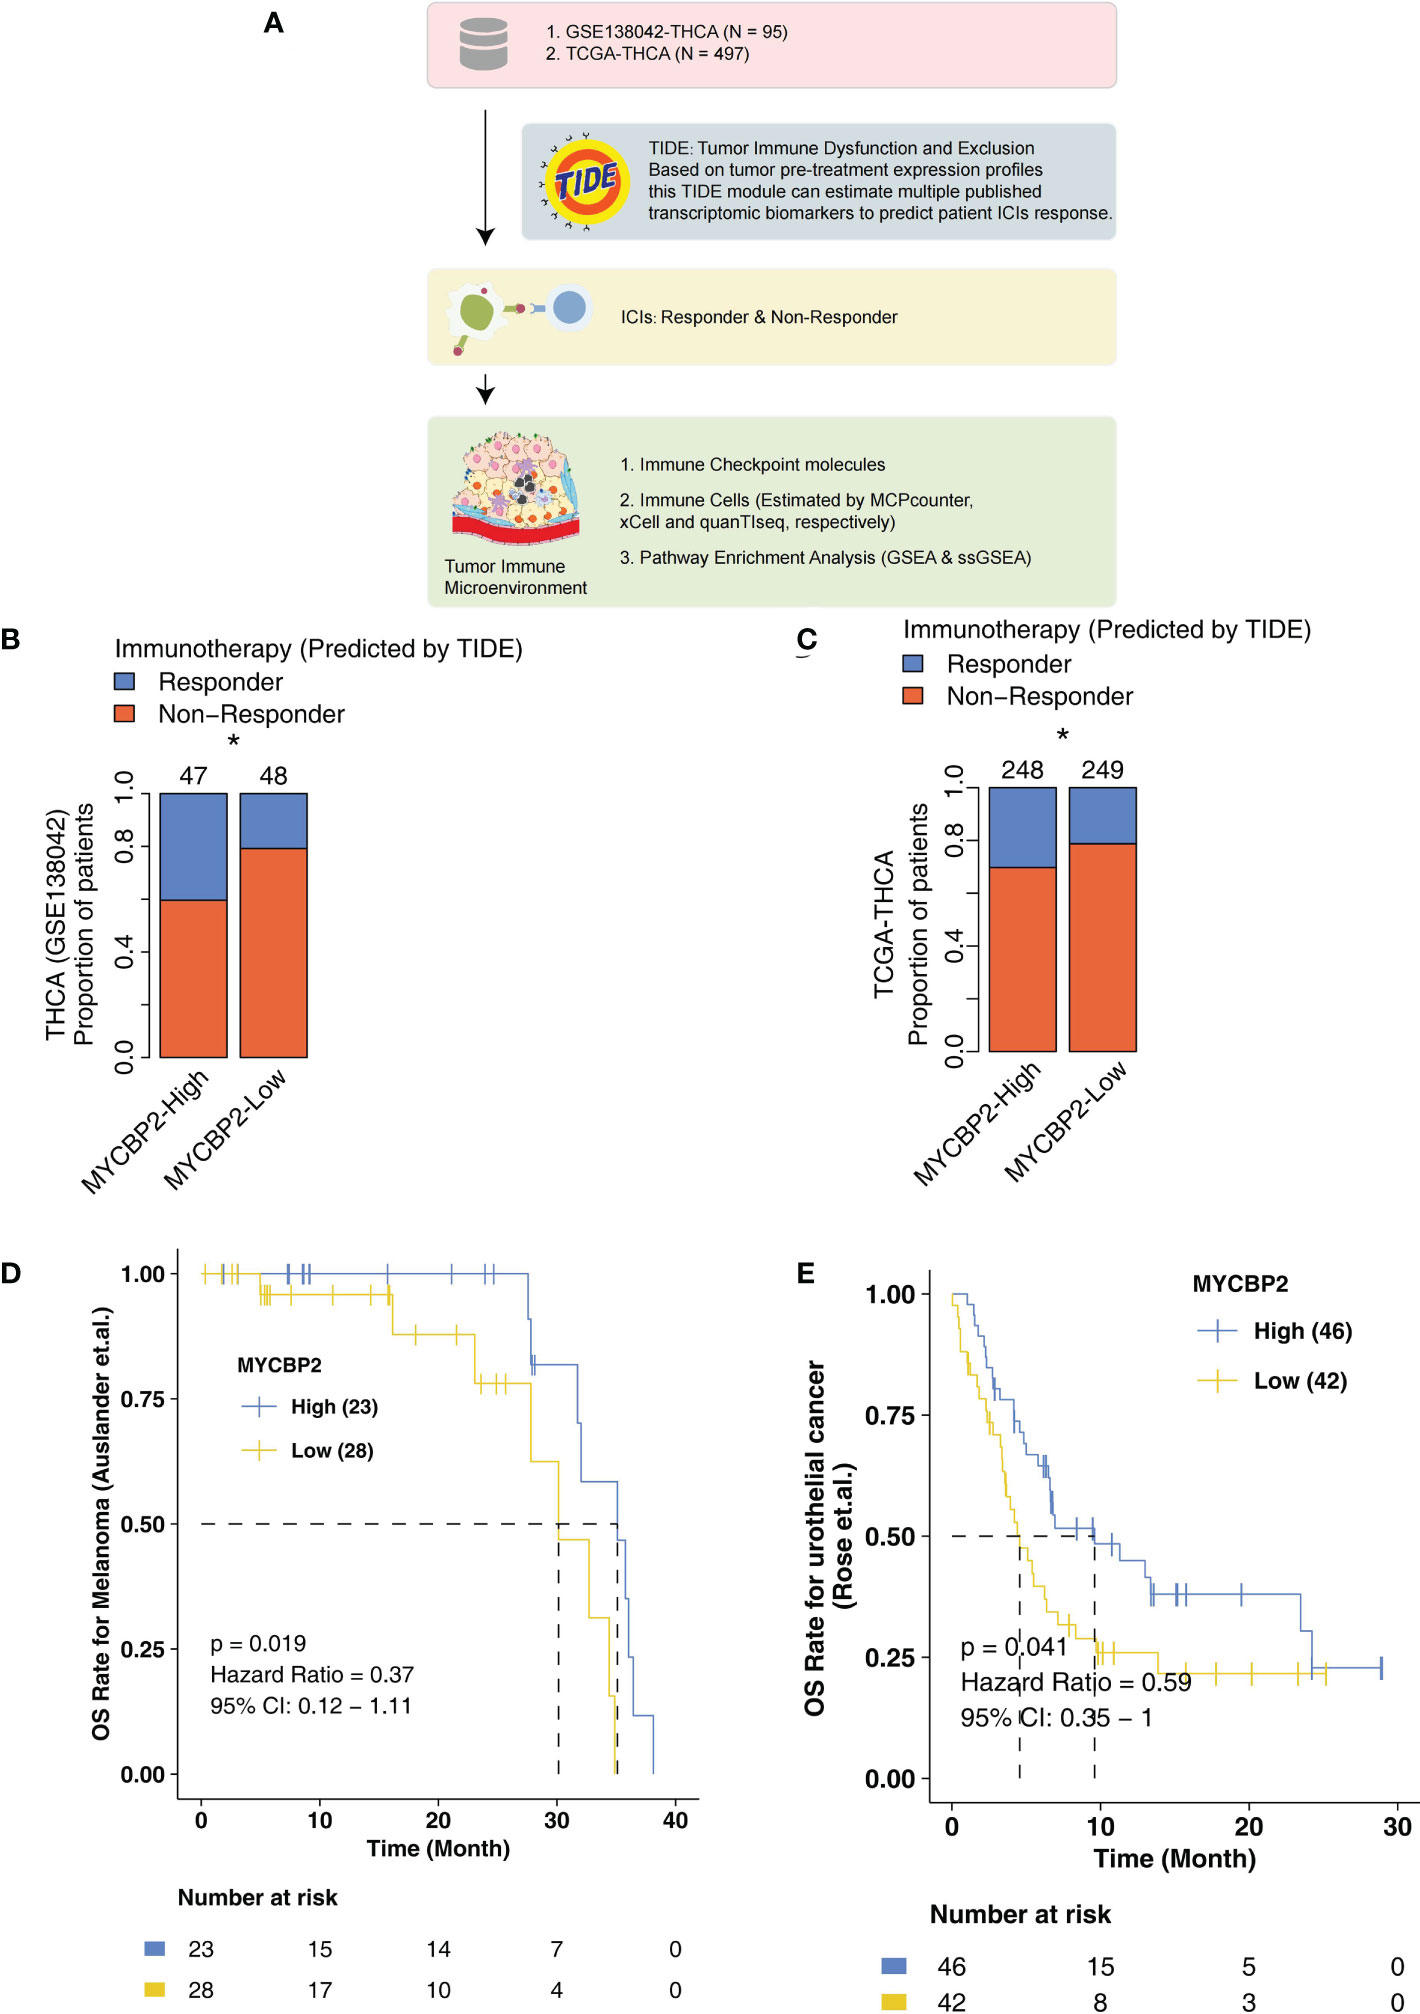
Figure 1 The association between the MYCBP2 expression and ICI efficacy. (A) The overall design of the study. The differences in predicted ICI efficacy between the MYCBP2-High and MYCBP2-Low TC patients in the GSE138042-TC (B) and TCGA-THCA (C) cohorts. KM curve showing the differences in the prognoses of ICI-treated patients between the MYCBP2-High and MYCBP2-Low groups in the melanoma (D) and urothelial cancer (E) cohorts. (*: P < 0.05).
Relationship between MYCBP2 expression, IC-related molecules, and immune related genes
In TCGA-THCA cohort, MYCBP2-high patients had significantly higher expression of IC-related molecules, such as LAG3, IDO1, CTLA4, TIGIT, PD-1 and PDCD1LG2, than MYCBP2-low patients (Figure 2A, P < 0. 05). In the GSE138042-THCA cohort, the heatmap also revealed differences between MYCBP2-high and MYCBP2-low patients in the expression of genes associated with antigen presentation, B cells, CD8+ T cells, macrophages, pDCs, inflammatory stimulation, and IFN responses (Figure 2B). In the TCGA-THCA cohort, these genes were expressed at significantly higher levels in MYCBP2-high patients than in MYCBP2-low patients (Supplementary Figure 3).
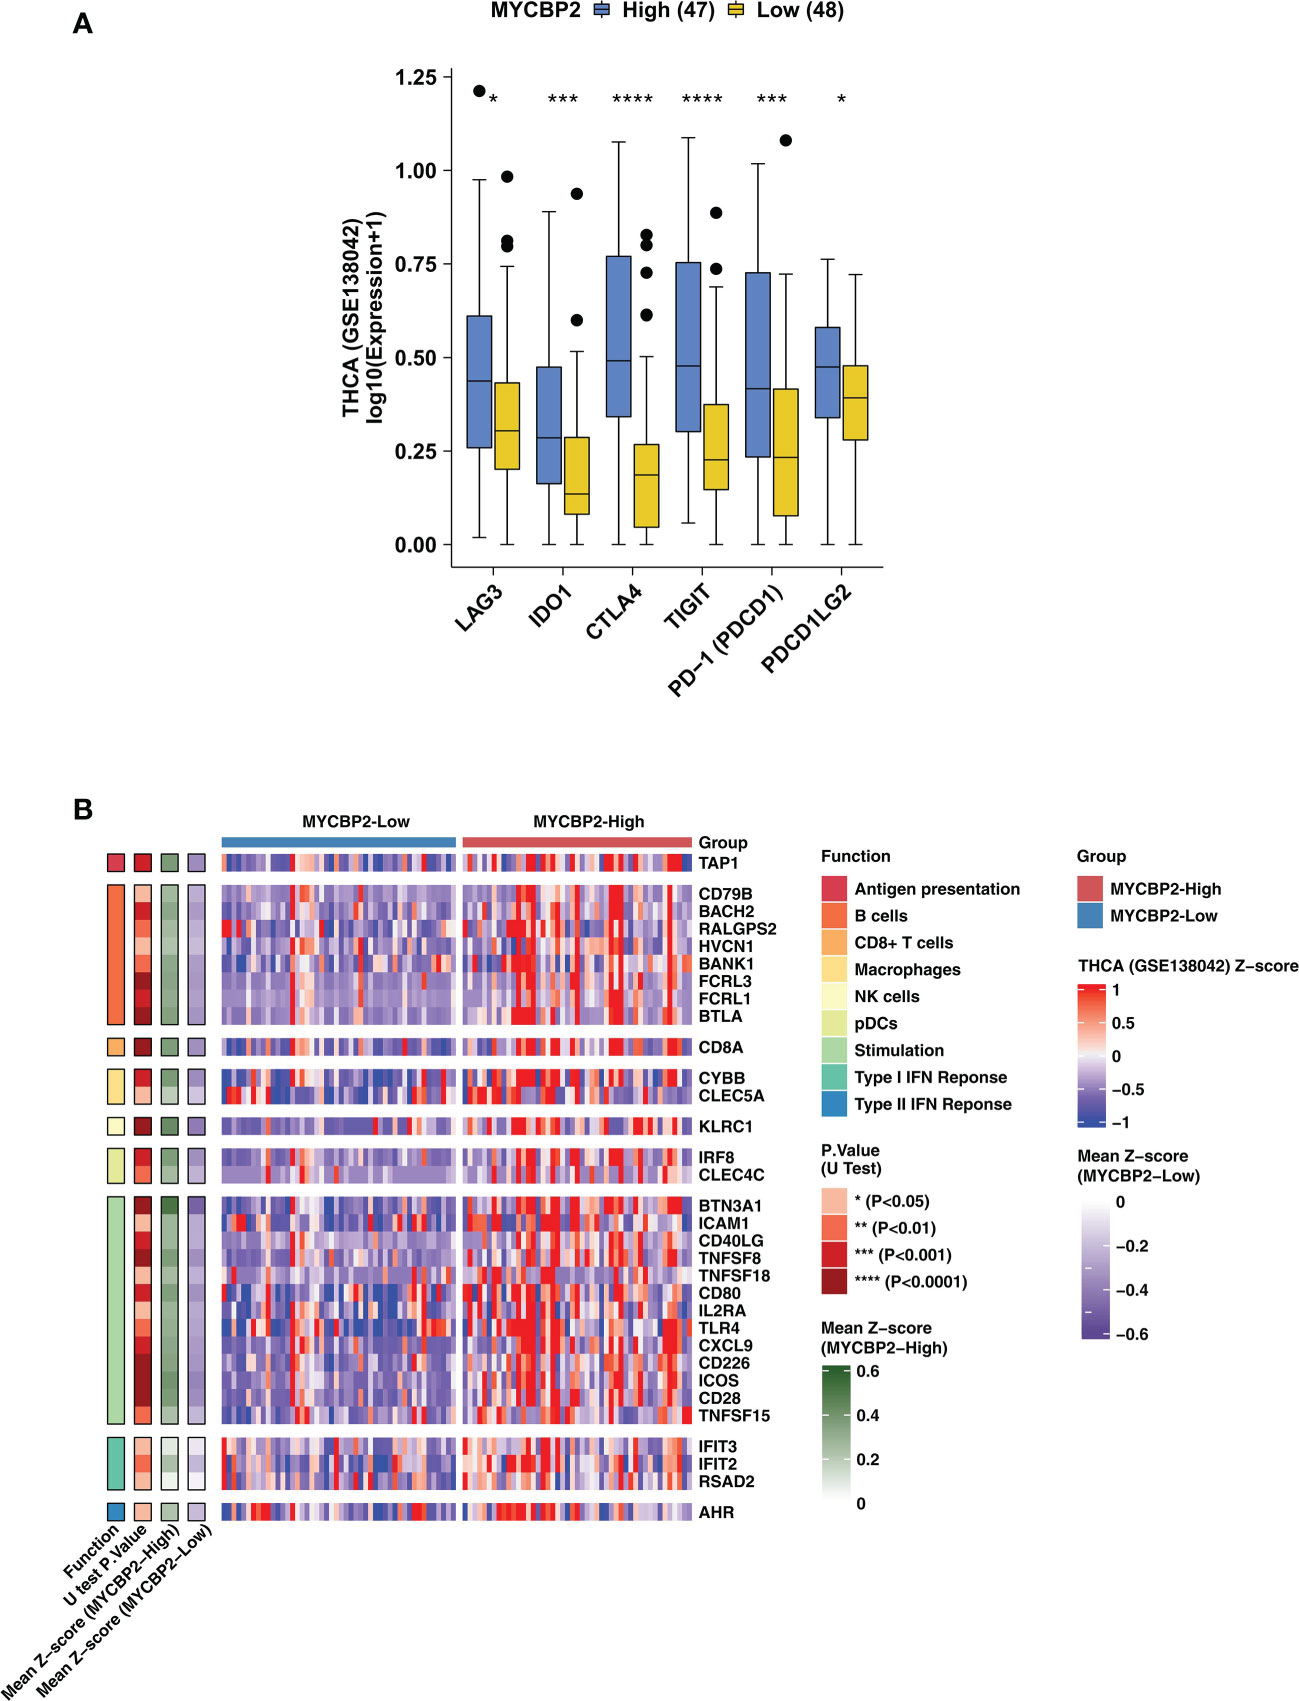
Figure 2 The association between the MYCBP2 expression and immune-related gene expression. (A) Differences in the expression of immune checkpoint molecules between MYCBP2-High and MYCBP2-Low patients in the GSE138042-TC cohort. (B) Heatmap depicting differences the expression of immune-related genes (antigen presentation, B cells, CD8+ T cells, macrophages, NK cells, pDCs, stimulation, and IFN responses) between MYCBP2-High and MYCBP2-Low patients in the GSE138042-TC cohort. (*: P < 0.05; ***: P < 0.001; ****: P < 0.0001).
Relationship between MYCBP2 expression and immune cell infiltration
We used the MCPcounter algorithm to evaluate immune cell infiltration in the TIME of THCA patients (Figures 3A, B). In both the GSE138042-THCA (Figure 3A) and TCGA-THCA (Figure 3B) cohorts, MYCBP2-high patients had significantly higher infiltration of CD8+ T cells, cytotoxic lymphocytes (CTLs), B cells, and NK cells than MYCBP2-low patients. The quanTIseq algorithm was also used to verify immune cell infiltration fractions (Figures 3C, D). Using the quanTIseq algorithm, we found that MYCBP2-high patients had significantly enriched B cells, NK cells, and DCs (Figure 3C: GSE138042-THCA; Figure 3D: TCGA-THCA, all P < 0.05). We also used the xCell algorithm to evaluate the proportions of tumor infiltrating immune cells (Figures 3E, F). Compared with MYCBP2-low patients, MYCBP2-high patients had significantly increased B cells, memory CD4+ T cells, CD8+ T cells, central memory CD8 + T cells (TCMs), and class-switched memory B-cells (Figure 3E: GSE138042-THCA; Figure 3F: TCGA-THCA).
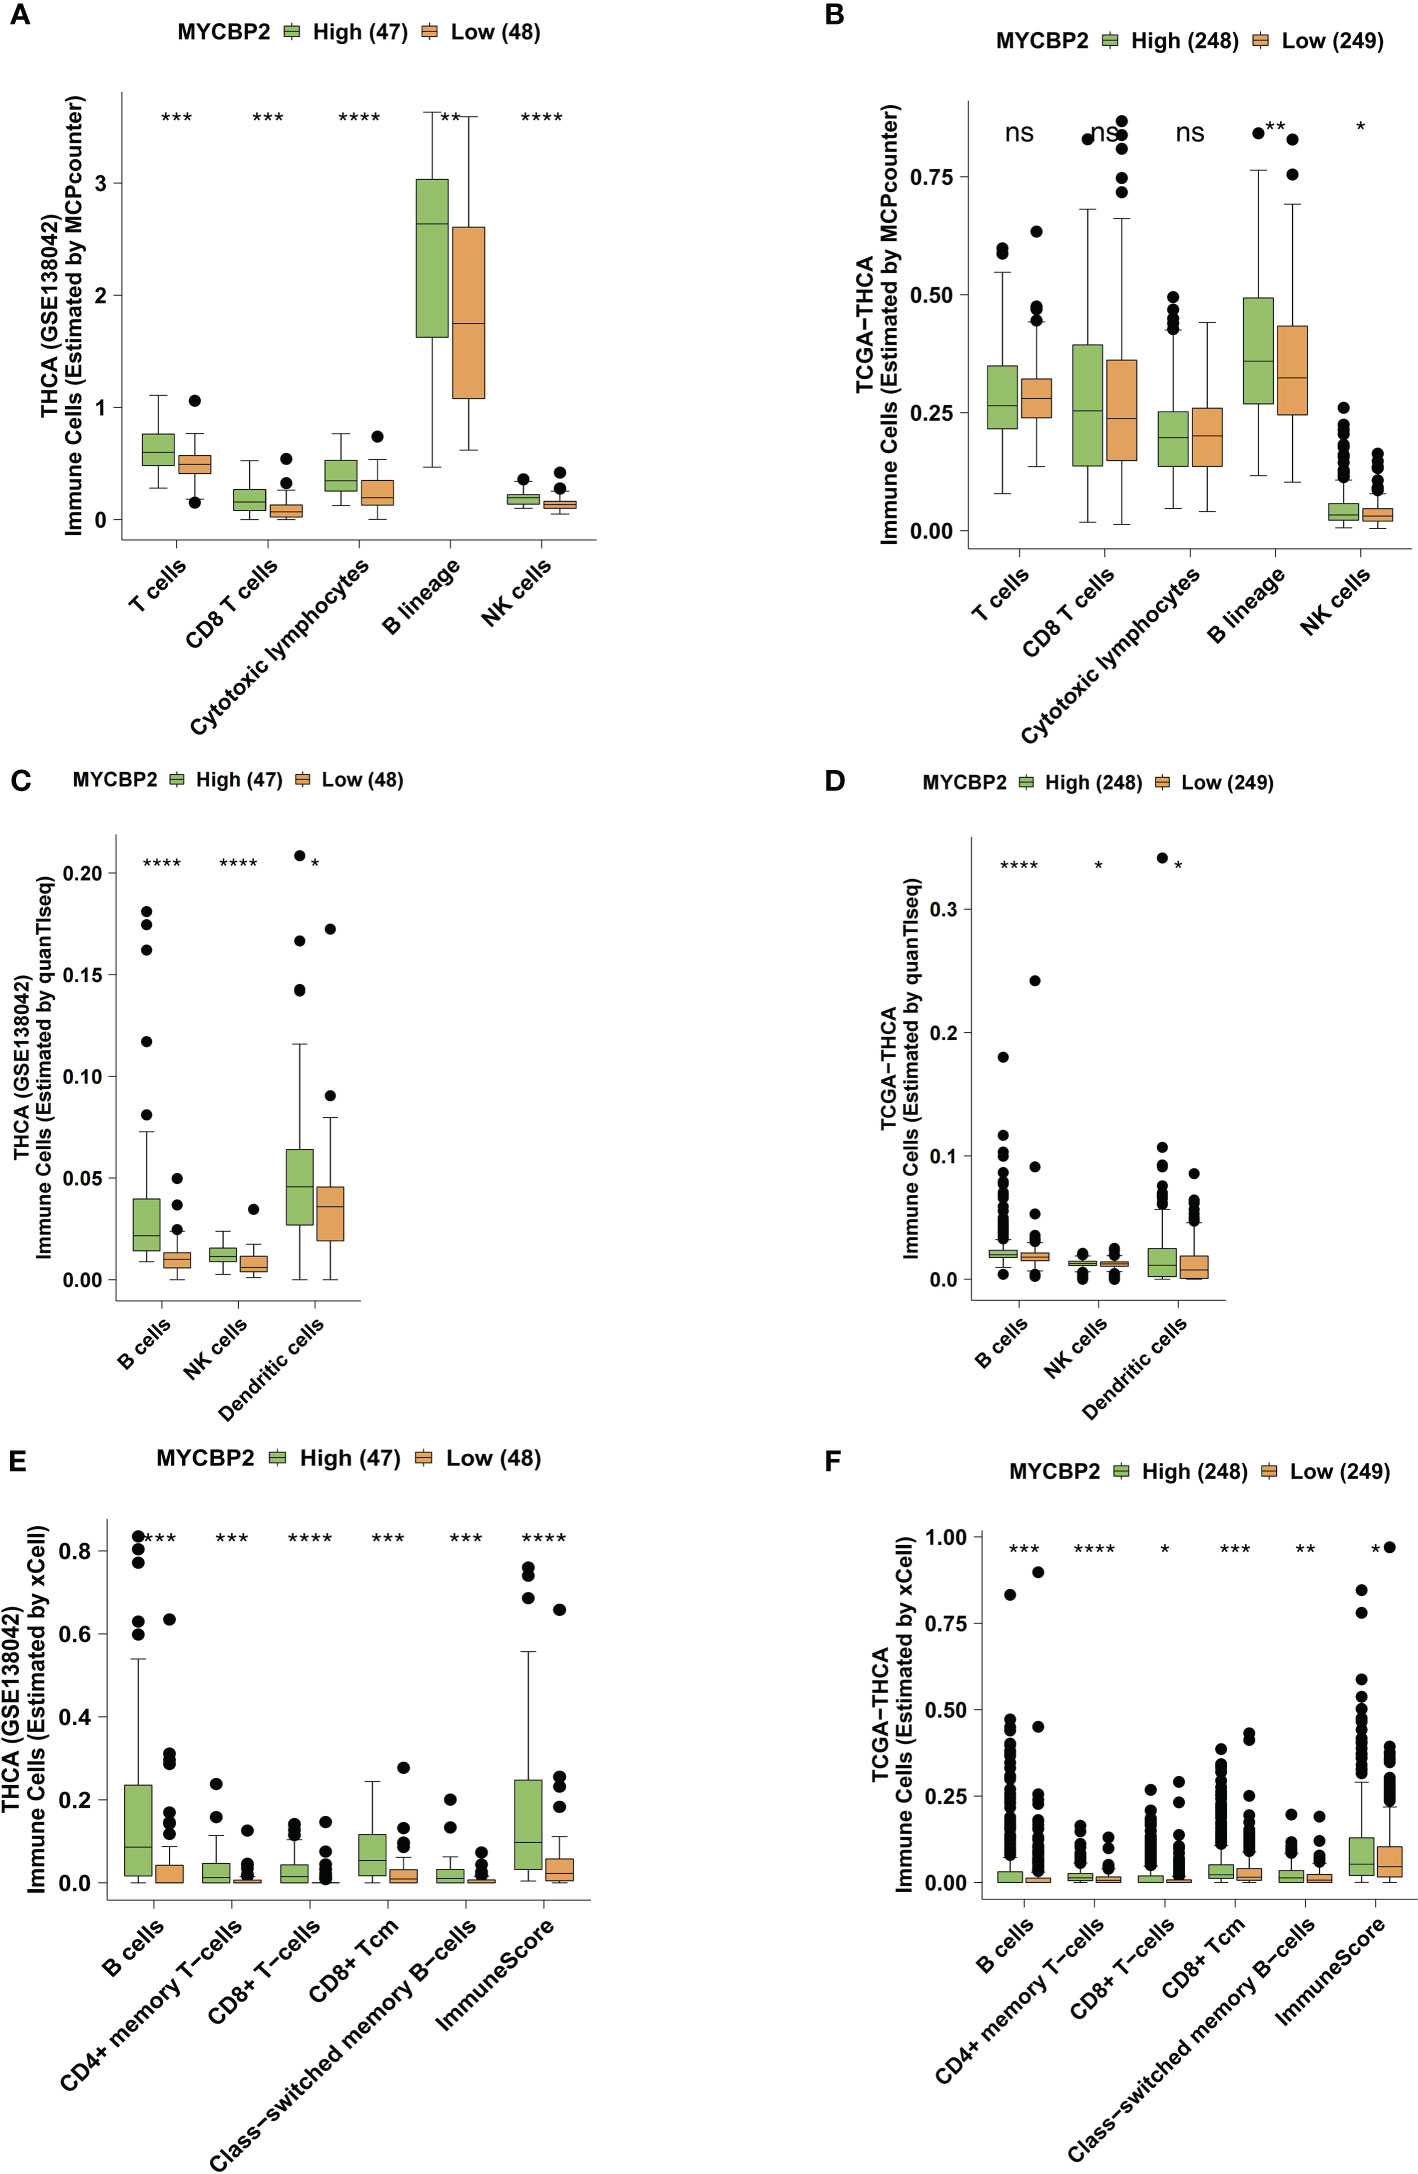
Figure 3 The association between the MYCBP2 expression and immune cell infiltration. Differences in tumor infiltrating immune cells estimated by MCPcounter, between the MYCBP2-High and MYCBP2-Low TC patients in the GSE138042-TC (A) and TCGA-THCA (B) cohorts. Differences in tumor infiltrating immune cells estimated by quanTIseq, between the MYCBP2-High and MYCBP2-Low TC patients in the GSE138042-TC (C) and TCGA-THCA (D) cohorts. Differences in tumor infiltrating immune cells estimated by xCell, between the MYCBP2-High and MYCBP2-Low TC patients in the GSE138042-TC (E) and TCGA-THCA (F) cohorts. (ns: not significant; *: P < 0.05; **: P < 0.01; ***: P < 0.001; ****: P < 0.0001).
Relationship between MYCBP2 expression and immune signaling pathways
We found that MYCBP2-high patients had higher activation of immune signaling pathways than MYCBP2-low patients (Figure 4A: GSE138042-THCA; Figure 4B: TCGA-THCA, ES > 0, P < 0. 05), including pathways regulating cell surface receptor signaling and phagocytosis, Fc receptor signaling, signal transduction, chemokine production, molecular mediators of immune responses, interleukin-12 (IL-12) production, MHC protein complex binding, interleukin-15 (IL-15) signaling, and interleukin-2 (IL-2) family signaling. Signaling pathways related to immune responses and immune cell activation were also significantly upregulated in MYCBP2-high patients, including B cell activation, lymphocyte mediated immunity, leukocyte migration, B cell proliferation, and NK cell mediated cytotoxicity (Figure 4C: GSE138042-THCA; Figure 4D: TCGA-THCA, ES > 0, P < 0. 05). The results of ssGSEA showed that MYCBP2-high patients had higher immune response pathway scores than MYCBP2-low patients, including pathways for MHC class I protein complex binding, DC cytokine production, MHC class IB receptor activity, IL-12 production, lymphocyte mediated immunity, NK cell mediated cytotoxicity, T cell mediated immunity, interleukin-18 (IL-18) production, NK cell mediated immunity, NK cell activation, DC antigen processing and presentation, and IL-15 signaling (Figure 4E: GSE138042-THCA; Figure 4F: TCGA-THCA, P < 0. 05). On the contrary, lipid metabolism related pathways (such as short chain fatty acid metabolism, fatty acid beta oxidation using acyl COA oxidase, and positive regulation of vascular permeability) were significantly downregulated in MYCBP2-high patients compared to MYCBP2-low patients (Figure 4E: GSE138042-THCA; Figure 4F: TCGA-THCA, P < 0. 05).
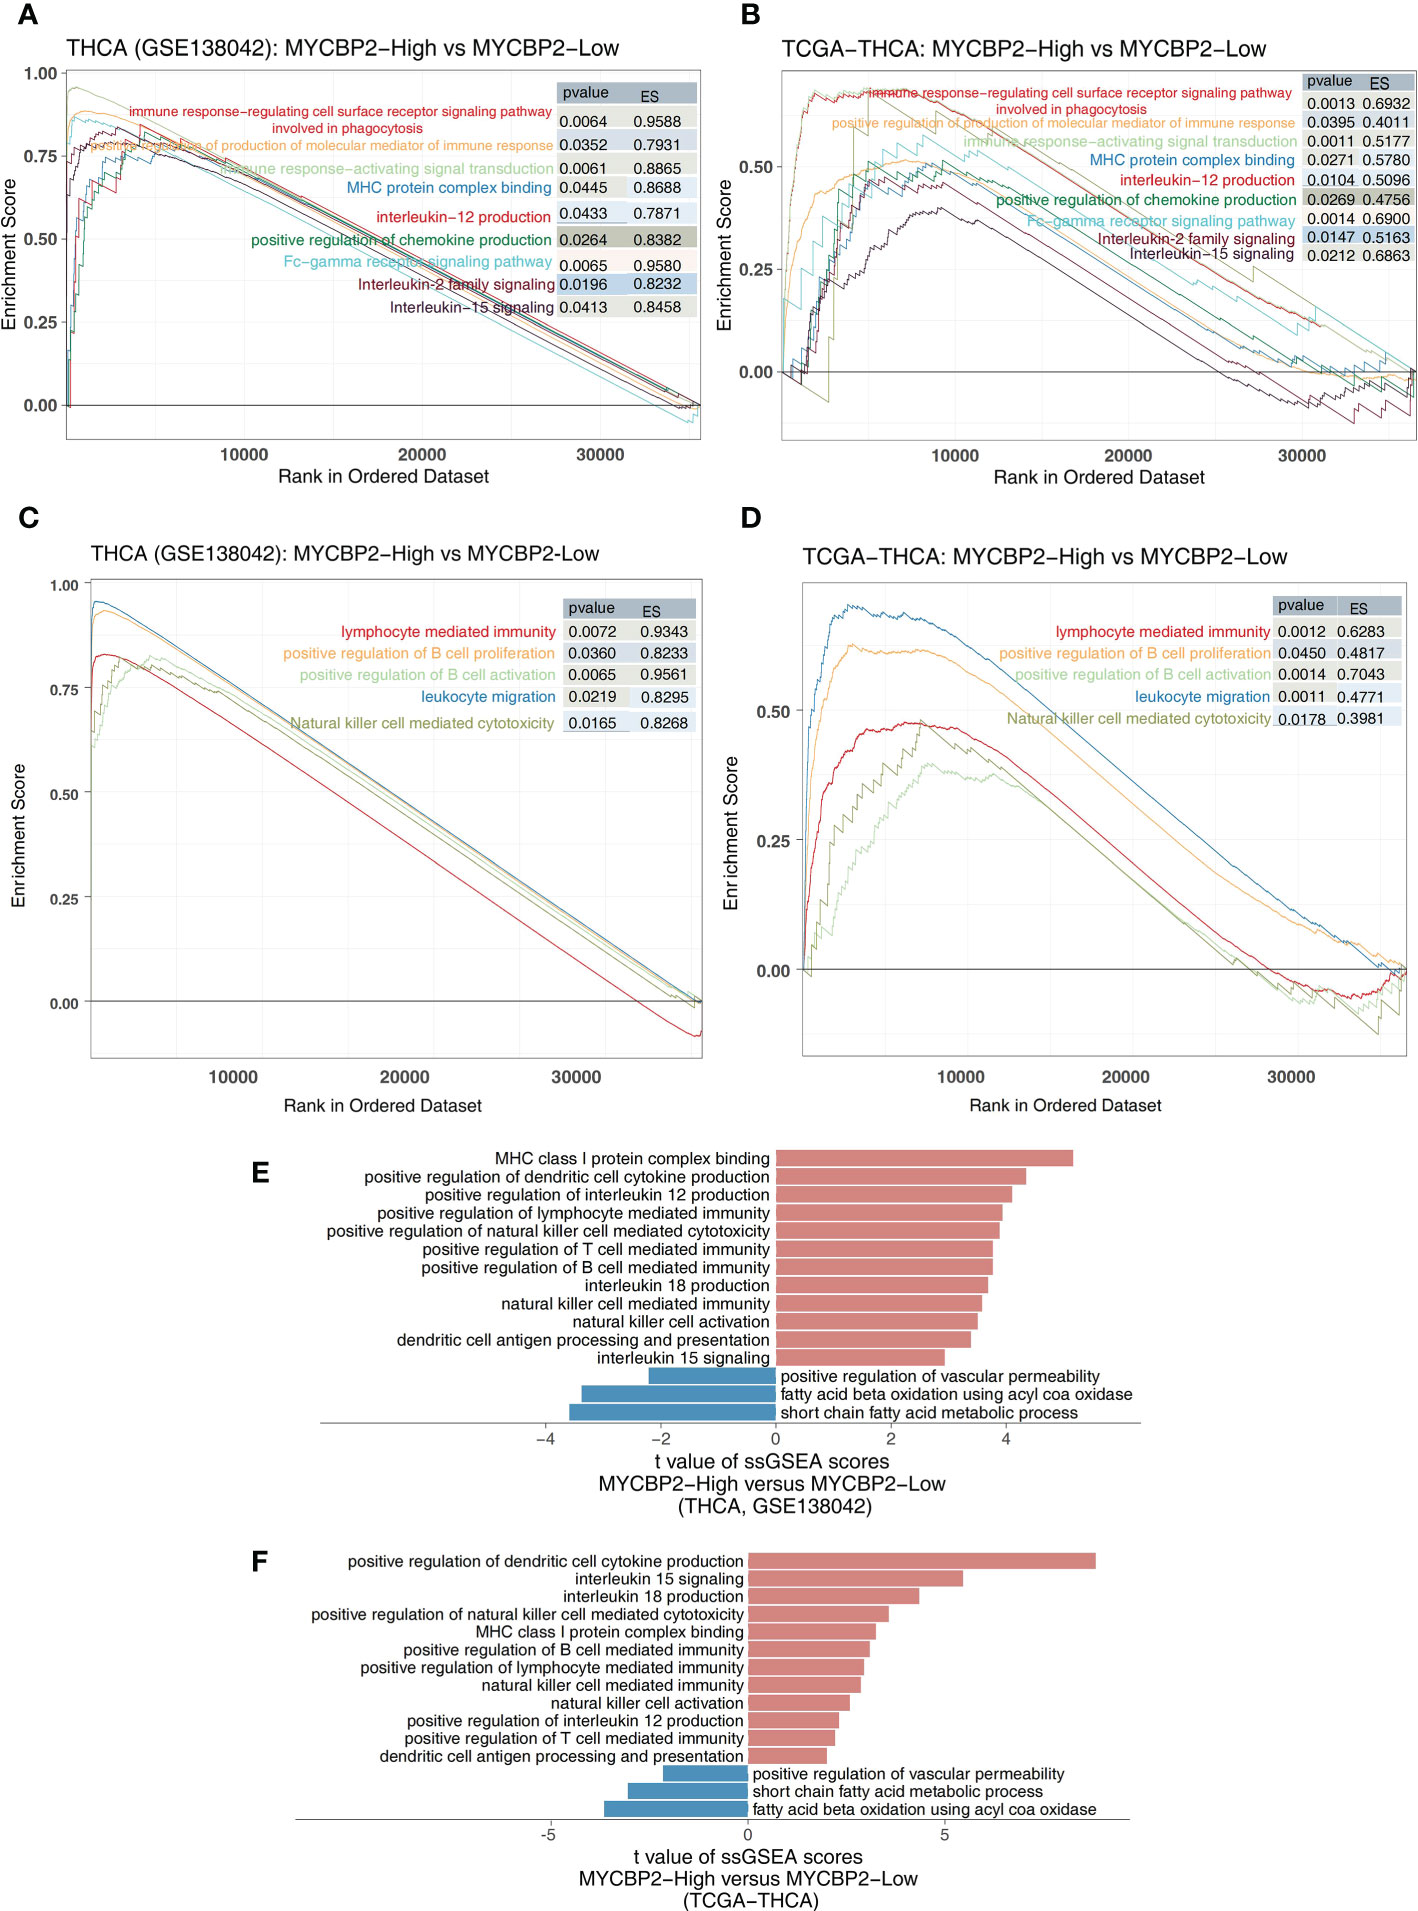
Figure 4 The association between the MYCBP2 and immune-related signaling pathways. Differences in inflammatory molecule related signaling pathways between MYCBP2-High and MYCBP2-Low TC patients in the GSE138042-TC (A) and TCGA-THCA (B) cohorts. Differences in immune response related signaling pathways between the MYCBP2-High and MYCBP2-Low TC patients in the GSE138042-TC (C) and TCGA-THCA (D) cohorts. Barplot showing the differences in ssGSEA scores between the MYCBP2-High and MYCBP2-Low TC patients in the GSE138042-TC (E) and TCGA-THCA (F) cohorts.
Validation of the local cohort based on MYCBP2 status
IHC revealed MYCBP2 expression levels in TC tissues. Patients in our local cohort with high MYCBP2 expression always had a better prognosis and greater sensitivity to therapy compared to patients with low MYCBP2 expression after six months clinic follow up (Figure 5).

Figure 5 IHC analysis of MYCBP2 expression and clinical follow up of TC patients based on their MYCBP2 expression status.Here, we show four representive IHC results of patients and corresponding ultrasound follow-up image.
Discussion
Compared to conventional chemotherapy, ICIs has higher safety and fewer adverse reactions, making it a useful treatment regimen for various advanced cancers (48). ICIs is now a potential treatment for patients with advanced and refractory TC (49–51). In this study, we found that higher MYCBP2 expression was associated with better outcomes in TC patients receiving ICIs. Immune cell infiltration analysis showed that higher MYCBP2 expression was associated with significantly enriched inflammatory immune cell infiltration and higher expression of inflammatory molecules. Pathway enrichment analysis showed that MYCBP2 may be involved in anti-tumor immune responses. Therefore, MYCBP2 may be a novel biomarker for ICI efficacy in TC patients.
The significantly enriched inflammatory immune cell infiltration in MYCBP2-high patients is a potential molecular mechanism for the greater efficacy of ICIs in these patients. Bastman et al. found that some TC patients with greater programmed death 1 [PD-1(+)] CD4+ T cell and PD-1(+) CD8+ T cell infiltration could benefit from anti-PD-1/PD-L1 treatment (52). CD8 + T cells can kill target cells in an antigen-specific manner, and improve the disease-free survival (DFS) rate of patients (53). NK cells also play a key role in anti-tumor immune monitoring. NK cells can not only kill tumor or infected cells directly, but they can also indirectly enhance antibody and T-cell-mediated anti-tumor immune responses (54). NK cells also release lysosomes containing perforin and granzyme to kill target cells (55). Many studies have also shown that DCs are a key regulatory factor for the efficacy of ICIs and other tumor immunotherapies (56). Accordingly, researchers are now attempting to engineer DCs to activate and drive T cells into the TIME, particularly for tumors with weak immunogenicity (non-inflammatory of “cold” tumors), to improve the efficacy of ICIs (51, 57). In our study, we found that MYCBP2-high patients had significantly increased CD8+ T cells, B cells, NK cells, and DCs in the TIME compared to MYCBP2-low patients.
The high expression of inflammatory molecules and activation of immune response pathways in MYCBP2-high patients is another potential molecular mechanism for the greater ICI efficacy in MYCBP2-high patients. IL-15 can maintain NK cell populations and tumor killing ability in the TIME (58). Recently, a clinical trial showed that IL-15 can increase CD8+ T cell and NK cell numbers up to 5.8 and 38 times that of the control group, respectively, and 17 of the 27 patients treated with IL-15 showed no tumor progression (59). Several other studies have attempted to activate NK cells for immunotherapy using cytokines. For example, IL-21 has been shown to improve the exhaustion status of the NK cells (60), and the combination of IL-12, IL-15, and IL-18 can increase memory NK cells and stimulate IFN-γ secretion (61, 62). In our study, we found that MYCBP2-high patients had significantly upregulated IL-12 production, IL-15 signaling, IL-2 family signaling, and IL-18 signaling compared to MYCBP2-low patients.
The pattern of fatty acid metabolism in TME is also crucial in the immunomodulatory function of tumor tissues and immunotherapy tolerance. It has been shown that the expression of genes for fatty acid oxidation is upregulated in Treg and that the level of fatty acid oxidation is increased, thus promoting Treg production (63). The rate of de novo synthesis of the fatty acid in tumor cells is usually increased, thus shifting energy production to anabolic pathways for the production of plasma membrane phospholipids and signaling molecules (64). Lipid accumulation in tumor-infiltrating myeloid cells has been shown to predispose these immune cells to an immunosuppressive and anti-inflammatory phenotype through metabolic reprogramming (65, 66). In our study, we found that lipid metabolism related pathways (such as short chain fatty acid metabolism, fatty acid beta oxidation using acyl COA oxidase, and positive regulation of vascular permeability) were significantly downregulated in MYCBP2-high patients compared to MYCBP2-low patients.
Some limitations are not ignored in our study, first, clinical long-time follow-up was not conducted, and in the future, a more clinical trial should be considered to demonstrate this gene’s clinical value, and in addition, Due to experimental constraints, organoid-related experiments have not been considered, which is a regret, and we hope we will complete this procedure in future cooperation with another excellent laboratory.
Conclusions
In summary, we found that MYCBP2-high TC patients had better responses to ICIs than MYCBP2-low patients, with a higher proportion of predicted ICI responders in the MYCBP2-high group. Higher MYCBP2 expression was associated with significantly enriched inflammatory immune cell infiltration and higher immune response pathway activity.
Data availability statement
The datasets presented in this study can be found in online repositories. The names of the repository/repositories and accession number(s) can be found in the article/Supplementary Material.
Ethics statement
The studies involving human participants were reviewed and approved by The Ethics Committee of Breast Center of The Second Affiliated Hospital of Guilin Medical University. The patients/participants provided their written informed consent to participate in this study.
Author contributions
Conceptualization, RF, WP, WS. Formal analysis, GW, CM, LM, UK. Software, GW, CM, LM, UK. Supervision, GW, CM, LM. Resources, GW, CM, LM, UK. Visualization, GW, CM, LM, UK. Writing–original draft, JW, MO, RH. Writing–review & editing, GW, CM, LM, JW, MO, RH, RF, WP, WS. All authors contributed to the article and approved the submitted version.
Funding
This study was supported by Guangxi Medical and Health Key Cultivation Discipline Construction Project.
Conflict of interest
The authors declare that the research was conducted in the absence of any commercial or financial relationships that could be construed as a potential conflict of interest.
Publisher’s note
All claims expressed in this article are solely those of the authors and do not necessarily represent those of their affiliated organizations, or those of the publisher, the editors and the reviewers. Any product that may be evaluated in this article, or claim that may be made by its manufacturer, is not guaranteed or endorsed by the publisher.
Supplementary material
The Supplementary Material for this article can be found online at: https://www.frontiersin.org/articles/10.3389/fimmu.2022.1048503/full#supplementary-material
Supplementary Figure 1 | The differences of the expression of the Mycbp2 between the ICIs-responders and ICIs-non-responders in the GSE146027 (A) and GSE151829 (B).
Supplementary Figure 2 | The Kaplan-Meier curves depicting differences in the prognoses of cancer patients between the MYCBP2-High and MYCBP2-Low groups (GSE26304, GSE1456, GSE5327, GSE30929, GSE26939, GSE30219, GSE41271, GSE30219, GSE37745, GSE50081, GSE62452, and GSE16560).
Supplementary Figure 3 | Heatmap depicting differences in the expression of immune-related genes (antigen presentation, B cells, CD8+ T cells, macrophages, NK cells, pDCs, stimulation, and IFN responses) between MYCBP2-High and MYCBP2-Low patients in TCGA-THCA.
Supplementary Table 1 | The Kaplan-Meier result of the relationship between the expression of MYCBP2 and survival times of the different cancer patients (GSE26304, GSE1456, GSE5327, GSE30929, GSE26939, GSE30219, GSE41271, GSE30219, GSE37745, GSE50081, GSE62452, and GSE16560).
References
1. Lim H, Devesa SS, Sosa JA, Check D, Kitahara CM. Trends in thyroid cancer incidence and mortality in the united states, 1974-2013. JAMA (2017) 317:1338–48. doi: 10.1001/jama.2017.2719
2. Sung H, Ferlay J, Siegel RL, Laversanne M, Soerjomataram I, Jemal A, et al. Global cancer statistics 2020: GLOBOCAN estimates of incidence and mortality worldwide for 36 cancers in 185 countries. CA Cancer J Clin (2021) 71:209–49. doi: 10.3322/caac.21660
3. Berdelou A, Lamartina L, Klain M, Leboulleux S, Schlumberger M. Treatment of refractory thyroid cancer. Endocr Relat Cancer (2018) 25:R209–23. doi: 10.1530/ERC-17-0542
4. Brose MS, Nutting CM, Jarzab B, Elisei R, Siena S, Bastholt L, et al. Sorafenib in radioactive iodine-refractory, locally advanced or metastatic differentiated thyroid cancer: A randomised, double-blind, phase 3 trial. Lancet (London England) (2014) 384:319–28. doi: 10.1016/S0140-6736(14)60421-9
5. Elisei R, Schlumberger MJ, Müller SP, Schöffski P, Brose MS, Shah MH, et al. Cabozantinib in progressive medullary thyroid cancer. J Clin Oncol Off J Am Soc Clin Oncol (2013) 31:3639–46. doi: 10.1200/JCO.2012.48.4659
6. Schlumberger M, Tahara M, Wirth LJ, Robinson B, Brose MS, Elisei R, et al. Lenvatinib versus placebo in radioiodine-refractory thyroid cancer. N Engl J Med (2015) 372:621–30. doi: 10.1056/NEJMoa1406470
7. Wells SAJ, Robinson BG, Gagel RF, Dralle H, Fagin JA, Santoro M, et al. Vandetanib in patients with locally advanced or metastatic medullary thyroid cancer: A randomized, double-blind phase III trial. J Clin Oncol Off J Am Soc Clin Oncol (2012) 30:134–41. doi: 10.1200/JCO.2011.35.5040
8. Subbiah V, Kreitman RJ, Wainberg ZA, Cho JY, Schellens JHM, Soria JC, et al. Dabrafenib and trametinib treatment in patients with locally advanced or metastatic BRAF V600-mutant anaplastic thyroid cancer. J Clin Oncol Off J Am Soc Clin Oncol (2018) 36:7–13. doi: 10.1200/JCO.2017.73.6785
9. Chan TA, Yarchoan M, Jaffee E, Swanton C, Quezada SA, Stenzinger A, et al. Development of tumor mutation burden as an immunotherapy biomarker: Utility for the oncology clinic. Ann Oncol Off J Eur Soc Med Oncol (2019) 30:44–56. doi: 10.1093/annonc/mdy495
10. Reck M, Rodríguez-Abreu D, Robinson AG, Hui R, Csőszi T, Fülöp A, et al. Pembrolizumab versus chemotherapy for PD-L1-Positive non-Small-Cell lung cancer. N Engl J Med (2016) 375:1823–33. doi: 10.1056/NEJMoa1606774
11. Zhong X, Zhang H, Zhu Y, Liang Y, Yuan Z, Li J, et al. Circulating tumor cells in cancer patients: Developments and clinical applications for immunotherapy. Mol Cancer (2020) 19:15. doi: 10.1186/s12943-020-1141-9
12. Maibach F, Sadozai H, Seyed Jafari SM, Hunger RE, Schenk M. Tumor-infiltrating lymphocytes and their prognostic value in cutaneous melanoma. Front Immunol (2020) 11:2105. doi: 10.3389/fimmu.2020.02105
13. Rittmeyer A, Barlesi F, Waterkamp D, Park K, Ciardiello F, von Pawel J, et al. Atezolizumab versus docetaxel in patients with previously treated non-small-cell lung cancer (OAK): A phase 3, open-label, multicentre randomised controlled trial. Lancet (London England) (2017) 389:255–65. doi: 10.1016/S0140-6736(16)32517-X
14. Brahmer J, Reckamp KL, Baas P, Crinò L, Eberhardt WEE, Poddubskaya E, et al. Nivolumab versus docetaxel in advanced squamous-cell non-Small-Cell lung cancer. N Engl J Med (2015) 373:123–35. doi: 10.1056/NEJMoa1504627
15. Lin A, Qiu Z, Zhang J, Luo P. Effect of NCOR1 mutations on immune microenvironment and efficacy of immune checkpoint inhibitors in patient with bladder cancer. Front Immunol (2021) 12:630773. doi: 10.3389/fimmu.2021.630773
16. Lyu Q, Lin A, Cao M, Xu A, Luo P, Zhang J. Alterations in TP53 are a potential biomarker of bladder cancer patients who benefit from immune checkpoint inhibition. Cancer Control (2020) 27:1073274820976665. doi: 10.1177/1073274820976665
17. Ge Z, Guo X, Li J, Hartman M, Kawasawa YI, Dovat S, et al. Clinical significance of high c-MYC and low MYCBP2 expression and their association with ikaros dysfunction in adult acute lymphoblastic leukemia. Oncotarget (2015) 6:42300–11. doi: 10.18632/oncotarget.5982
18. Gong L, Xia Y, Qian Z, Shi J, Luo J, Song G, et al. Overexpression of MYC binding protein promotes invasion and migration in gastric cancer. Oncol Lett (2018) 15:5243–9. doi: 10.3892/ol.2018.7944
19. Lehrer S, Rheinstein PH, Rosenzweig KE. Loss of MycBP may be associated with the improved survival in 1P co-deletion of lower grade glioma patients. Clin Neurol Neurosurg (2018) 172:112–5. doi: 10.1016/j.clineuro.2018.07.003
20. Li M, Li A, Zhou S, Lv H, Yang W. SPAG5 upregulation contributes to enhanced c-MYC transcriptional activity via interaction with c-MYC binding protein in triple-negative breast cancer. J Hematol Oncol (2019) 12:14. doi: 10.1186/s13045-019-0700-2
21. Pierre S, Zhang DD, Suo J, Kern K, Tarighi N, Scholich K. Myc binding protein 2 suppresses M2-like phenotypes in macrophages during zymosan-induced inflammation in mice. Eur J Immunol (2018) 48:239–49. doi: 10.1002/eji.201747129
22. Schaid DJ, McDonnell SK, FitzGerald LM, DeRycke L, Fogarty Z, Giles GG, et al. Two-stage study of familial prostate cancer by whole-exome sequencing and custom capture identifies 10 novel genes associated with the risk of prostate cancer. Eur Urol (2021) 79:353–61. doi: 10.1016/j.eururo.2020.07.038
23. Nan B-Y, Xiong G-F, Zhao Z-R, Gu X, Huang X-S. Comprehensive identification of potential crucial genes and miRNA-mRNA regulatory networks in papillary thyroid cancer. BioMed Res Int (2021) 2021:6752141. doi: 10.1155/2021/6752141
24. Tomczak K, Czerwińska P, Wiznerowicz M. The cancer genome atlas (TCGA): An immeasurable source of knowledge. Contemp Oncol (Poznan Poland) (2015) 19:A68–77. doi: 10.5114/wo.2014.47136
25. Jiang P, Gu S, Pan D, Fu J, Sahu A, Hu X, et al. Signatures of T cell dysfunction and exclusion predict cancer immunotherapy response. Nat Med (2018) 24:1550–8. doi: 10.1038/s41591-018-0136-1
26. Auslander N, Zhang G, Lee JS, Frederick DT, Miao B, Moll T, et al. Robust prediction of response to immune checkpoint blockade therapy in metastatic melanoma. Nat Med (2018) 24:1545–9. doi: 10.1038/s41591-018-0157-9
27. Rose TL, Weir WH, Mayhew GM, Shibata Y, Eulitt P, Uronis JM, et al. Fibroblast growth factor receptor 3 alterations and response to immune checkpoint inhibition in metastatic urothelial cancer: A real world experience. Br J Cancer (2021) 125:1251–60. doi: 10.1038/s41416-021-01488-6
28. Gao J, Aksoy BA, Dogrusoz U, Dresdner G, Gross B, Sumer SO, et al. Integrative analysis of complex cancer genomics and clinical profiles using the cBioPortal. Sci Signal (2013) 6:pl1. doi: 10.1126/scisignal.2004088
29. Nagaoka K, Shirai M, Taniguchi K, Hosoi A, Sun C, Kobayashi Y, et al. Deep immunophenotyping at the single-cell level identifies a combination of anti-IL-17 and checkpoint blockade as an effective treatment in a preclinical model of dataguided personalized immunotherapy. J Immunother Cancer (2020) 8:e001358. doi: 10.1136/jitc-2020-001358
30. Benitez AA, Khalil-Agüero S, Nandakumar A, Gupta NT, Zhang W, Atwal GS, et al. Absence of central tolerance in aire-deficient mice synergizes with immune-checkpoint inhibition to enhance antitumor responses. Commun Biol (2020) 3:355. doi: 10.1038/s42003-020-1083-1
31. Muggerud AA, Hallett M, Johnsen H, Kleivi K, Zhou W, Tahmasebpoor S, et al. Molecular diversity in ductal carcinoma in situ (DCIS) and early invasive breast cancer. Mol Oncol (2010) 4:357–68. doi: 10.1016/j.molonc.2010.06.007
32. Hall P, Ploner A, Bjöhle J, Huang F, Lin C-Y, Liu ET, et al. Hormone-replacement therapy influences gene expression profiles and is associated with breast-cancer prognosis: a cohort study. BMC Med (2006) 4:16. doi: 10.1186/1741-7015-4-16
33. Minn AJ, Gupta GP, Padua D, Bos P, Nguyen DX, Nuyten D, et al. Lung metastasis genes couple breast tumor size and metastatic spread. Proc Natl Acad Sci U.S.A. (2007) 104:6740–5. doi: 10.1073/pnas.0701138104
34. Gobble RM, Qin L-X, Brill ER, Angeles CV, Ugras S, O’Connor RB, et al. Expression profiling of liposarcoma yields a multigene predictor of patient outcome and identifies genes that contribute to liposarcomagenesis. Cancer Res (2011) 71:2697–705. doi: 10.1158/0008-5472.CAN-10-3588
35. Wilkerson MD, Yin X, Walter V, Zhao N, Cabanski CR, Hayward MC, et al. Differential pathogenesis of lung adenocarcinoma subtypes involving sequence mutations, copy number, chromosomal instability, and methylation. PloS One (2012) 7:e36530. doi: 10.1371/journal.pone.0036530
36. Rousseaux S, Debernardi A, Jacquiau B, Vitte A-L, Vesin A, Nagy-Mignotte H, et al. Ectopic activation of germline and placental genes identifies aggressive metastasis-prone lung cancers. Sci Transl Med (2013) 5:186ra66. doi: 10.1126/scitranslmed.3005723
37. Parra ER, Behrens C, Rodriguez-Canales J, Lin H, Mino B, Blando J, et al. Image analysis-based assessment of PD-L1 and tumor-associated immune cells density supports distinct intratumoral microenvironment groups in non-small cell lung carcinoma patients. Clin Cancer Res an Off J Am Assoc Cancer Res (2016) 22:6278–89. doi: 10.1158/1078-0432.CCR-15-2443
38. Goldmann T, Marwitz S, Nitschkowski D, Krupar R, Backman M, Elfving H, et al. PD-L1 amplification is associated with an immune cell rich phenotype in squamous cell cancer of the lung. Cancer Immunol Immunother (2021) 70:2577–87. doi: 10.1007/s00262-020-02825-z
39. Der SD, Sykes J, Pintilie M, Zhu C-Q, Strumpf D, Liu N, et al. Validation of a histology-independent prognostic gene signature for early-stage, non-small-cell lung cancer including stage IA patients. J Thorac Oncol Off Publ Int Assoc Study Lung Cancer (2014) 9:59–64. doi: 10.1097/JTO.0000000000000042
40. Yang S, He P, Wang J, Schetter A, Tang W, Funamizu N, et al. A novel MIF signaling pathway drives the malignant character of pancreatic cancer by targeting NR3C2. Cancer Res (2016) 76:3838–50. doi: 10.1158/0008-5472.CAN-15-2841
41. Sboner A, Demichelis F, Calza S, Pawitan Y, Setlur SR, Hoshida Y, et al. Molecular sampling of prostate cancer: A dilemma for predicting disease progression. BMC Med Genomics (2010) 3:8. doi: 10.1186/1755-8794-3-8
42. Lin A, Qi C, Wei T, Li M, Cheng Q, Liu Z, et al. CAMOIP: A web server for comprehensive analysis on multi-omics of immunotherapy in pan-cancer. Brief Bioinform (2022) 23:bbac129. doi: 10.1093/bib/bbac129
43. Becht E, Giraldo NA, Lacroix L, Buttard B, Elarouci N, Petitprez F, et al. Estimating the population abundance of tissue-infiltrating immune and stromal cell populations using gene expression. Genome Biol (2016) 17:218. doi: 10.1186/s13059-016-1070-5
44. Aran D, Hu Z, Butte AJ. xCell: Digitally portraying the tissue cellular heterogeneity landscape. Genome Biol (2017) 18:220. doi: 10.1186/s13059-017-1349-1
45. Plattner C, Finotello F, Rieder D. Deconvoluting tumor-infiltrating immune cells from RNA-seq data using quanTIseq. Methods Enzymol (2020) 636:261–85. doi: 10.1016/bs.mie.2019.05.056
46. Subramanian A, Kuehn H, Gould J, Tamayo P, Mesirov JP. GSEA-p: A desktop application for gene set enrichment analysis. Bioinformatics (2007) 23:3251–3. doi: 10.1093/bioinformatics/btm369
47. Hänzelmann S, Castelo R, Guinney J. GSVA: Gene set variation analysis for microarray and RNA-seq data. BMC Bioinf (2013) 14:7. doi: 10.1186/1471-2105-14-7
48. Lin A, Zhang H, Hu X, Chen X, Wu G, Luo P, et al. Age, sex, and specific gene mutations affect the effects of immune checkpoint inhibitors in colorectal cancer. Pharmacol Res (2020) 159:105028. doi: 10.1016/j.phrs.2020.105028
49. Kollipara R, Schneider B, Radovich M, Babu S, Kiel PJ. Exceptional response with immunotherapy in a patient with anaplastic thyroid cancer. Oncologist (2017) 22:1149–51. doi: 10.1634/theoncologist.2017-0096
50. Spalart V, Legius B, Segers K, Coolen J, Maes B, Decoster L. Dramatic response to first line single agent pembrolizumab in anaplastic thyroid carcinoma. Case Rep Endocrinol (2019) 2019:9095753. doi: 10.1155/2019/9095753
51. Peng Q, Qiu X, Zhang Z, Zhang S, Zhang Y, Liang Y, et al. PD-L1 on dendritic cells attenuates T cell activation and regulates response to immune checkpoint blockade. Nat Commun (2020) 11:4835. doi: 10.1038/s41467-020-18570-x
52. Bastman JJ, Serracino HS, Zhu Y, Koenig MR, Mateescu V, Sams SB, et al. Tumor-infiltrating T cells and the PD-1 checkpoint pathway in advanced differentiated and anaplastic thyroid cancer. J Clin Endocrinol Metab (2016) 101:2863–73. doi: 10.1210/jc.2015-4227
53. Cunha LL, Morari EC, Guihen ACT, Razolli D, Gerhard R, Nonogaki S, et al. Infiltration of a mixture of immune cells may be related to good prognosis in patients with differentiated thyroid carcinoma. Clin Endocrinol (Oxf) (2012) 77:918–25. doi: 10.1111/j.1365-2265.2012.04482.x
54. Sivori S, Pende D, Quatrini L, Pietra G, Della Chiesa M, Vacca P, et al. NK cells and ILCs in tumor immunotherapy. Mol Aspects Med (2021) 80:100870. doi: 10.1016/j.mam.2020.100870
55. Colonna M. Innate lymphoid cells: Diversity, plasticity, and unique functions in immunity. Immunity (2018) 48:1104–17. doi: 10.1016/j.immuni.2018.05.013
56. Nouri-Shirazi M, Banchereau J, Bell D, Burkeholder S, Kraus ET, Davoust J, et al. Dendritic cells capture killed tumor cells and present their antigens to elicit tumor-specific immune responses. J Immunol (2000) 165:3797–803. doi: 10.4049/jimmunol.165.7.3797
57. de Mingo Pulido Á, Gardner A, Hiebler S, Soliman H, Rugo HS, Krummel MF, et al. TIM-3 regulates CD103(+) dendritic cell function and response to chemotherapy in breast cancer. Cancer Cell (2018) 33:60–74.e6. doi: 10.1016/j.ccell.2017.11.019
58. Ali AK, Nandagopal N, Lee S-H. IL-15-PI3K-AKT-mTOR: A critical pathway in the life journey of natural killer cells. Front Immunol (2015) 6:355. doi: 10.3389/fimmu.2015.00355
59. Conlon KC, Potter EL, Pittaluga S, Lee C-CR, Miljkovic MD, Fleisher TA, et al. IL15 by continuous intravenous infusion to adult patients with solid tumors in a phase I trial induced dramatic NK-cell subset expansion. Clin Cancer Res an Off J Am Assoc Cancer Res (2019) 25:4945–54. doi: 10.1158/1078-0432.CCR-18-3468
60. Seo H, Jeon I, Kim B-S, Park M, Bae E-A, Song B, et al. IL-21-mediated reversal of NK cell exhaustion facilitates anti-tumour immunity in MHC class I-deficient tumours. Nat Commun (2017) 8:15776. doi: 10.1038/ncomms15776
61. Lusty E, Poznanski SM, Kwofie K, Mandur TS, Lee DA, Richards CD, et al. IL-18/IL-15/IL-12 synergy induces elevated and prolonged IFN-γ production by ex vivo expanded NK cells which is not due to enhanced STAT4 activation. Mol Immunol (2017) 88:138–47. doi: 10.1016/j.molimm.2017.06.025
62. Romee R, Schneider SE, Leong JW, Chase JM, Keppel CR, Sullivan RP, et al. Cytokine activation induces human memory-like NK cells. Blood (2012) 120:4751–60. doi: 10.1182/blood-2012-04-419283
63. Zhang C, Yue C, Herrmann A, Song J, Egelston C, Wang T, et al. STAT3 activation-induced fatty acid oxidation in CD8(+) T effector cells is critical for obesity-promoted breast tumor growth. Cell Metab (2020) 31:148–161.e5. doi: 10.1016/j.cmet.2019.10.013
64. Currie E, Schulze A, Zechner R, Walther TC, Farese RVJ. Cellular fatty acid metabolism and cancer. Cell Metab (2013) 18:153–61. doi: 10.1016/j.cmet.2013.05.017
65. Cubillos-Ruiz JR, Silberman PC, Rutkowski MR, Chopra S, Perales-Puchalt A, Song M, et al. ER stress sensor XBP1 controls anti-tumor immunity by disrupting dendritic cell homeostasis. Cell (2015) 161:1527–38. doi: 10.1016/j.cell.2015.05.025
Keywords: immune checkpoint inhibitors, MYCBP2, myc binding protein 2, prognosis, thyroid cancer
Citation: Wang G, Miao C, Mo L, Kahlert UD, Wu J, Ou M, Huang R, Feng R, Pang W and Shi W (2022) MYCBP2 expression correlated with inflammatory cell infiltration and prognosis immunotherapy in thyroid cancer patients. Front. Immunol. 13:1048503. doi: 10.3389/fimmu.2022.1048503
Received: 19 September 2022; Accepted: 28 November 2022;
Published: 13 December 2022.
Edited by:
Linlang Guo, Zhujiang Hospital, ChinaReviewed by:
Ziyun Li, Nanjing University of Chinese Medicine, ChinaLifei Hou, Boston Children’s Hospital and Harvard Medical School, United States
Copyright © 2022 Wang, Miao, Mo, Kahlert, Wu, Ou, Huang, Feng, Pang and Shi. This is an open-access article distributed under the terms of the Creative Commons Attribution License (CC BY). The use, distribution or reproduction in other forums is permitted, provided the original author(s) and the copyright owner(s) are credited and that the original publication in this journal is cited, in accordance with accepted academic practice. No use, distribution or reproduction is permitted which does not comply with these terms.
*Correspondence: Ruifa Feng, c71339@qq.com; Weiyi Pang, p.weiyi@live.cn; Wenjie Shi, wenjie.shi-oldenburg@outlook.com
†These authors have contributed equally to this work and share first authorship