 Helena Kuri-Magaña1,2
 Leonardo Collado-Torres3,4
 Andrew E. Jaffe3,4,5,6
 Humberto Valdovinos-Torres1Marbella Ovilla-Muñoz1
 Juan Téllez-Sosa1
 Laura C. Bonifaz7
 Jesús Martínez-Barnetche1*
- 1Centro de Investigación Sobre Enfermedades Infecciosas, Instituto Nacional de Salud Pública, Cuernavaca, Mexico
- 2Programa de Doctorado en Ciencias Biomédicas, Universidad Nacional Autónoma de Mexico, Mexico City, Mexico
- 3Lieber Institute for Brain Development, Baltimore, MD, United States
- 4Center for Computational Biology, Johns Hopkins University, Baltimore, MD, United States
- 5Department of Mental Health, Johns Hopkins Bloomberg School of Public Health, Baltimore, MD, United States
- 6Department of Biostatistics, Johns Hopkins Bloomberg School of Public Health, Baltimore, MD, United States
- 7Unidad de Investigación Medica en Inmunoquímica, Hospital de Especialidades, Centro Medico Nacional Siglo XXI, Instituto Mexicano del Seguro Social (IMSS), Mexico City, Mexico
Antibody class switch recombination (CSR) to IgG, IgA, or IgE is a hallmark of adaptive immunity, allowing antibody function diversification beyond IgM. CSR involves a deletion of the IgM/IgD constant region genes placing a new acceptor Constant gene, downstream of the VDJH exon. CSR depends on non-coding (CSRnc) transcription of donor Iμ and acceptor IH exons, located 5′ upstream of each CH coding gene. Although, our knowledge of the role of CSRnc transcription has advanced greatly, its extension and importance in healthy and diseased humans is scarce. We analyzed CSRnc transcription in 70,603 publicly available RNA-seq samples, including GTEx, TCGA, and the Sequence Read Archive using recount2, an online resource consisting of normalized RNA-seq gene and exon counts, as well as, coverage BigWig files that can be programmatically accessed through R. CSRnc transcription was validated with a qRT-PCR assay for Iμ, Iγ3, and Iγ1 in humans in response to vaccination. We mapped IH transcription for the human IGH locus, including the less understood IGHD gene. CSRnc transcription was restricted to B cells and is widely distributed in normal adult tissues, but predominant in blood, spleen, MALT-containing tissues, visceral adipose tissue and some so-called “immune privileged” tissues. However, significant Iγ4 expression was found even in non-lymphoid fetal tissues. CSRnc expression in cancer tissues mimicked the expression of their normal counterparts, with notable pattern changes in some common cancer subsets. CSRnc transcription in tumors appears to result from tumor infiltration by B cells, since CSRnc transcription was not detected in corresponding tumor-derived immortal cell lines. Additionally, significantly increased Iδ transcription in ileal mucosa in Crohn's disease with ulceration was found. In conclusion, CSRnc transcription occurs in multiple anatomical locations beyond classical secondary lymphoid organs, representing a potentially useful marker of effector B cell responses in normal and pathological immune responses. The pattern of IH exon expression may reveal clues of the local immune response (i.e., cytokine milieu) in health and disease. This is a great example of how the public recount2 data can be used to further our understanding of transcription, including regions outside the known transcriptome.
Introduction
The hallmark of the humoral adaptive immune response is the production of high affinity class-switched antibodies from relatively low-affinity IgM+ naive precursors. Affinity maturation and class switch recombination (CSR) are tightly regulated, molecular processes that occur in a specialized microenvironment within secondary lymphoid organs known as the germinal center (GC). Upon T-dependent antigen stimulation, IgM+ naive B cells re-localize into the B cell follicle, undergo clonal expansion within the GC. The GC reaction is an iterative process of mutation-selection that leads to the generation of antigen-specific high affinity, class-switched memory B cells and long-lived antibody secreting plasma cells [reviewed in (1)]. Antibody class switching from IgM to IgG, IgA or IgE allows effector function diversification. Both memory B cells and long-lived plasma cells are critical determinants of vaccine efficacy (2).
CSR involves a deletion of a genomic segment from the IGHM/IGHD coding interval (Cμ-Cδ) to the upstream flank of one of the IGHG, IGHA, or IGHE genes in the telomeric region of human chromosome 14. Activated GC B cells upregulate the Activation Induced Cytidine Deaminase (AID), which deaminates cytidines in the G-rich Switch (S) regions located upstream of each immunoglobulin constant coding gene (CH). Cytidine deamination induces DNA damage response, which eventually leads to double stranded DNA breaks in both donor (Sμ) and the corresponding acceptor S region. The chromosomal ends are rejoined and the Cμ-Cδ-encoding intervening DNA segment is re-circularized in a non-replicating episome by non-homologous end joining [reviewed in (3)].
The initiation of CSR depends on non-coding transcription of IH exons, known as germline or “sterile” transcripts (referred hereafter as CSRnc transcription). IH exons are located in the 5′ region of each S-CH gene module. Non-coding transcription of IH exons extends to the S and CH region, is coupled to chromatin remodeling and is dependent on splicing (4, 5). CSRnc transcripts form an R-loop in the corresponding S region, which recruits AID to target S region deamination and CSR [reviewed in (6)]. The precise mechanism of AID targeting to the SH region remains elusive, and off-target AID activity is implicated in the genesis of B cell malignancies (6, 7).
CSR is a complex cellular process that occurs in specialized microenvironments in secondary and tertiary lymphoid organs. The cellular choice of which IH to transcribe, and consequently the Ig class to switch to, is influenced by the availability of certain cytokines such as IL-4, IFNγ, TGFβ, and PAMP's, among others. Such environmental cues are thought to trigger specific signals that promote selective transcription of a given IH exon, guiding CSR according to a particular microenvironment or pathogenic insult (3). CSRnc transcription patterns may reflect distinctive immunological events, such as the dependence of T cell help and other micro-environmental signals. Thus, CSRnc transcription quantitation during normal and pathological human immune responses could uncover novel pathogenic mechanisms and transcriptional signatures with potential clinical value. In addition, despite CSRnc transcription is biologically linked to B cells, its expression in other cell types has not been ruled out.
The recent explosion in the generation of public genomic data, and in particular transcriptome-wide profiling with RNA sequencing (RNA-seq) provides a unique opportunity to explore previously unannotated features in the human genome. To characterize CSRnc transcription in normal and pathological conditions, we tested CSRnc transcription in human vaccination and analyzed the transcriptional landscape of the human IgH locus using more than 70,000 publicly available human RNA-seq samples from a wide variety of research projects, including the Genotype Tissue Expression project (GTEx) (8, 9), The Cancer Genome Atlas (TCGA) (10, 11), and more than 2,000 projects from the Sequence Read Archive (SRA) using recount2 (12).
Materials and Methods
Vaccination of Human Healthy Volunteers
Pre-immune (day 0), day 7, 15, 30, and 180 post-vaccination peripheral blood samples (18 mL) were obtained by venipuncture in 2 × 8 mL Vacutainer® CPT™ tubes from healthy volunteers vaccinated with Hepatitis B and/or Tetanus toxoid/Diphteria (n = 16), or Trivalent Influenza Vaccine during season 2013–2014 [A/California/7/2009 (H1N1) pdm09; A(H3N2) A/Victoria/361/2011; B/Massachusetts/ 2/2012] (n = 18). Written informed consent was obtained from each volunteer in each blood sample draw. All procedures in human subjects were performed after Institutional Review Board approval from the National Institute of Public Health (CI: 971/82-6684). Plasma and PBMCs were isolated according to the manufacturer's instructions, aliquoted and stored at −80°C and liquid N2, respectively. Total RNA was extracted from PBMCs with TRIzol and stored at −80°C until used.
Quantitation of Plasmablasts by FACS
Cryopreserved PBMCs were thawed at 37°C and resuspended in RPMI 10% FBS, washed with PBS 1X and fixed with 1% paraformaldehyde for 20 min at room temperature. After washed with FACS solution (PBS 1%, sodium azide 0.05% and 2% FBS), cells were incubated for 30 min at 4°C with the following antibody cocktail: anti-CD3 PerCP/Cy5.5 (clone SKY; Biolegend; 344808), anti-CD19 FITC (clone HIB19; Biolegend; 302206), anti-CD20 PE Cy7 (clone 2H7; Biolegend; 302312), anti-CD27 APC (clone O323; Biolegend;356410), and anti-CD38 PE (clone HIT2; Biolegend; 980302). Flow cytometry analysis was performed in a FACS Aria II (BD Biosciences, San Jose, CA, USA). Doublets and CD3+ events were gated out. Plasmablasts were defined as CD3−/CD19+/CD20−/CD27+/CD38+. 500-1000 plasmablasts were acquired per sample. Analysis was performed using Flowjo software (TreeStar).
B Cell in vitro Stimulation
PBMCs were isolated by Ficoll-Paque™ density gradient from blood bank buffy coats. B cells were enriched through negative selection using B cell Isolation Kit II (MACS, Miltenyi). 1 × 10⁶ B cells were seeded per well on 6-well plate incubated in RPMI medium supplemented with 10% FBS, streptomycin and penicillin at 37°C with 5% CO2. Two activation conditions were stablished at different time points (3 and 6 days post-activation: Germinal center-like activation (GC-like), 1 μg/ml anti-human CD40 (G28.5), 5 μg/ml CpG ODN 2006 (Invivogen) and 25 ng/ml recombinant IL-21 (eBiosciences). For T-independent activation, 5 μg/ml CpG ODN 2006 (Invivogen), 0.05% S. aureus Cowan (Pansorbin; Calbiochem), 5 ng/ml Pokeweed Mitogen (Sigma).
qRT-PCR of CSRnc Transcripts
Total RNA from PBMCs was extracted using TRIzol (Invitrogen). The integrity of the RNA was measured with Agilent RNA 6000 Nano. SuperScript™ III One-Step RT-PCR(Invitrogen) was used for reverse transcription and amplification. Quantitative PCR of CSRnc transcripts for IGHM, IGHG1, IGHG3, and AID gene was performed using specific primers and TaqMan probes(IDT). The primers and probes used to quantify the CSRnc transcripts are detailed in Table 1. Amplification of HPRT with PrimeTime® Predesigned qPCR Assays was performed as the reference gene. The fold difference was calculated using 2ΔΔCT, using resting enriched B cells as calibrator and non-B cells as negative control. HPRT was used as normalizer for every condition.
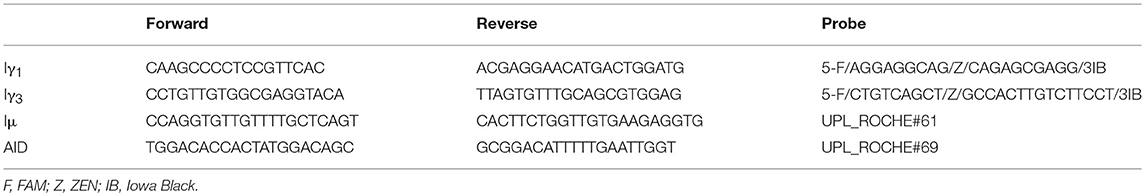
Table 1. Oligonucleotides used for qRT-PCR of Iμ, Iγ3, and Iγ1.
CSRnc Transcription Boundaries Definition
Currently, CSRnc transcripts and switch regions (S) are not mapped as such in the current version of the human genome (GRCh38). IH are upstream of the corresponding switch region (SH), thus we first mapped S regions based on the frequency distribution of the AGCT motif in 500 bp bins along the whole IGH locus (105,583,700−105,863,000) (3). recount2 is an online resource consisting of normalized RNA-seq gene and exon counts, as well as, coverage BigWig files (https://jhubiostatistics.shinyapps.io/recount/) that can be programmatically accessed through the R programming language (13). To map IH, metadata from all SRA projects contained in recount2, as well as, through the SRA-Run selector engine were used to identify RNA-seq samples and samples performed using purified B cells. The corresponding BigWig files were downloaded using the recount Bioconductor package and mapped read counts were visually inspected with Integrative Genomics Viewer (14). CSRnc regions were delimited according to an expression consensus from projects described in Table S1.
CSRnc and IGH Transcription Quantitation
recount2 was used to extract read counts from each of the nine CH constant region coding genes (IGHM, IGHD, IGHG3, IGHG1, IGHA1, IGHG2, IGHG4, IGHE, and IGHA2), as well as, from the corresponding CSRnc I exon coordinates as a GRanges object (15). The log2-transformed CH (coding) and CSRnc RPKM average per sample was used as an approximation of abundance of transcription. For CSRnc transcription, log2 RPKM per sample average adopted a quasi-normal distribution with a mean of 2.65 log2 RPKM (SD ± 3.79), which corresponds to 6.29 RPKM. As an initial exploration to which tissues and in which diseases CSRnc transcription takes place, we used the log2 RPKM average as a cut-off to define “high” expression (>2.65 log2 RPKM) or “low” expression (< 2.65 log2 RPKM). The mean CH transcription average log2 RPKM was 7.82 (SD ± 5.16). Given the difference between coding and CSRnc transcription, and to address the relative expression between coding and CSRnc transcription for each Ig loci, coding and CSRnc log2RPKM values for each Ig gene were standardized by transformation to Z-scores.
SRA RNA-seq Samples Ontology Mapping
Although all RNA-seq samples in TCGA and GTEx follow a homogeneous ontology categorization, metadata associated to SRA projects is widely heterogeneous and commonly insufficient. To obtain a more homogenous categorization of nearly half of our dataset, we used disease (16) annotations retrieved from MetaSRA, version 1–2 (17).
Enrichment Test
To define CSRnc transcription profile variation in healthy tissue (GTEx dataset), we performed tissue sample enrichment analysis according to Z-cluster using a two sided Fisher's Exact Test. The H0 is that there is no difference in the probability distribution between Z clusters and tissue. A 2 × 2 contingency table was built for each tissue between the number of samples belonging to a given Z cluster and the remaining samples not belonging to that cluster. A two-sided Fisher's test was performed with the R function fisher test (c, alternative = “two.sided”). P-value adjustment with the Benjamini-Hochberg method was performed to correct for multiple testing using the R function p. adjust [p, method = “bh”, n = length(p)]. A False Discovery Rate (FDR) < 0.01 was considered as a significant enrichment.
CSRnc Transcription Profile Clustering
To define CSRnc transcription profiles, Z-scores for each I-exon were subjected to k-means clustering using the Cluster software 3.0 (18). Ten clusters were generated, with 100 iterative runs and Euclidean distance as distance metric. Clustered data was visualized with java Treeview 3.0 (https://sourceforge.net/projects/jtreeview/).
Differential Expression Analysis
Differential expression of coding IGH and CSRnc transcripts was analyzed using the functions lmFit() and eBayes() from the limma R package v3.34 (19). If technical replicates were present for a given study, the induced correlation was adjusted for using the duplicationCorrelation() function from limma. The resulting Bonferroni-adjusted p < 0.05 were determined to be statistically significant. We used Bonferroni instead of FDR given that we tested 10 regions instead of the usual number of thousands of genes.
Results
CSRnc Transcription is B Cell-Specific and its Boundaries are Diffuse
Overall, recount2 (12) comprises a highly heterogeneous catalog of RNA-seq experiments belonging to 2,036 independent studies and comprising 70,603 samples. Each study is composed of an average of 34 samples. However, TCGA (10, 11) and GTEx (SRP012682) (8, 9) are two projects (studies) with the largest number of sequencing samples (11,284 and 9,661 respectively), and represent 29% of our dataset (Figure S1).
A schematic representation of the IgH locus is shown in Figure 1A. Although human CSRnc transcription has been evaluated by RT-PCR (5, 25, 26), the precise transcription boundaries, including alternate transcription initiation sites and splicing variants remain undefined. We selected RNA-seq samples derived from normal FACSorted B cells to map CSRnc transcription and to define transcriptional boundaries for read count quantitation for further analysis (Table S1) (27–33). We found that in normal adult B cells, CSRnc boundaries are less sharply defined than coding transcripts, and as expected, extend into switch regions (Figure 1B–D) (5). Projects SRP045500 (29) and SRP051688 (31) describing the transcriptome of isolated peripheral blood (PB) immune cells in healthy adults, including primary neutrophils, monocytes, myeloid dendritic cells, B, NK and T cells revealed that among terminally differentiated hematopoietic lineage-derived cells, CSRnc transcription is restricted to B cells (Figure 1B, Figure S2).
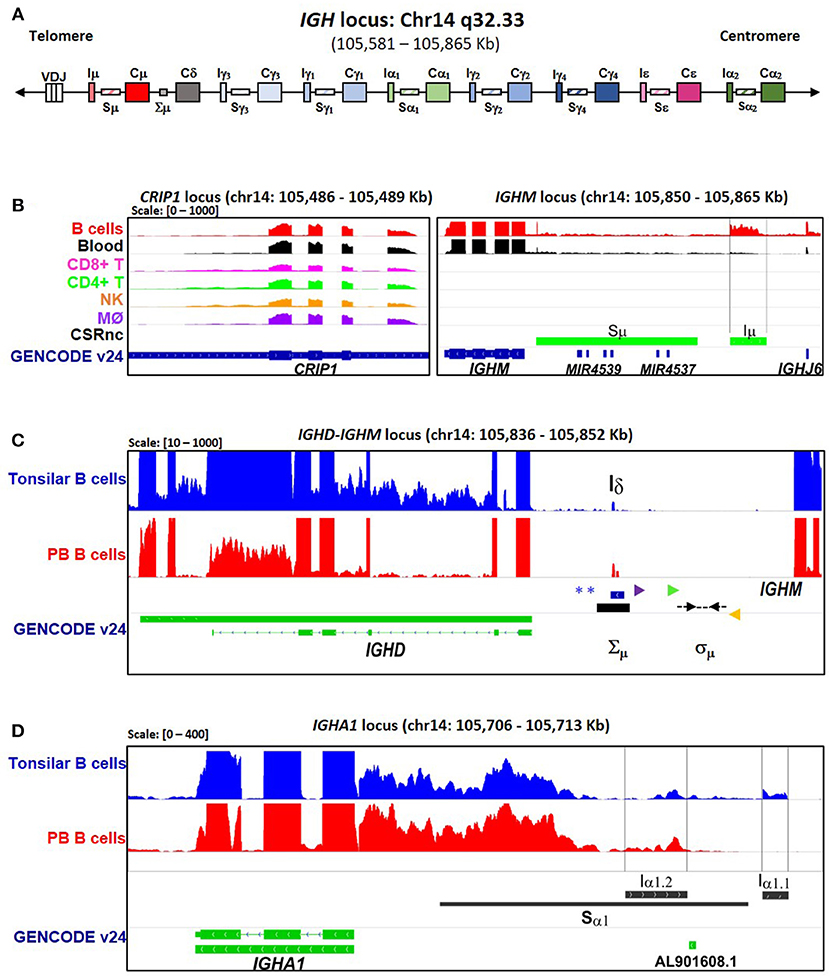
Figure 1. CSRnc transcription boundaries definition. Selected projects using isolated B cells were used to define the limits of CSRnc transcription in human chromosome 14 (See Table S1). (A) Schematic representation (not on scale) of the IgH locus in a VDJ rearranged B cell, including i-exons (IH, CSRnc transcripts), switch regions (SH, horizontal rectangles), and coding exons of the constant region (CH, large rectangles). The telomeric region is toward the left. BigWig files were downloaded using recount2 and visualized using IGV (18) to inspect to determine the boundaries for each CSRnc transcript. (B) Coverage graph of project SRP045500 showing the CRIP1 locus (left panel) and the IGHM locus (right panel) in B (red track) and non-B cells. The CRIP1 gene is transcribed in B and non-B cells, whereas IGHM and Iμ (within black vertical lines) is transcribed only in B cells and in peripheral blood (Black track). Predicted Sμ region is shown in the bottom track (blue) and annotated genes (GENCODE v24) are shown in green. (C) A view of the IGHM—IGHD intron locus displaying coverage graphs from normal purified naive tonsillar (SRP021509, blue track) and peripheral blood CD19+ B cells (SRP060715, red track). The vertical black arrow shows Iδ. IGHD annotation GENCODE v24 is shown in green. The Iδ exon overlaps with the Σμ region (20, 21, 22) and is centromeric regarding the mapped sites for μ–δ CSR junctions (Dotted black arrows) (21). Antisense primer (18156) used by Kluin et al. (21) and Arpin et al. (P4) (22) are shown in purple and green, respectively. The Sδ Sense primer used by Chen et al. (23) is shown in orange. The blue asterisks indicate Hind III sites (20, 24, 21). (D) Transcriptional landscape of the IGHA1 locus displaying coverage graphs of the IGHA1, GENCODE v24 annotation (green track), tonsillar naive (SRR834982, blue), and peripheral blood B cells (SRR2097501, red). Both Iα1.1 and Iα1.2 transcripts are shown. The Sα1 region (black bar) is shown. For B–D, coverage scale is shown in the left upper corner within brackets.
We analyzed CSRnc and CH coding transcription in isolated PB CD19+ B cells. High relative transcription of Iμ and Cμ, intermediate relative transcription of Iδ, Iγ3, Iγ1, Iα1.2, Iγ2, Iγ4 and Iα2, and low transcription of Iε and Iα1.1 were characteristic of PB B cells (Figure 2) (28, 29). Furthermore, we analyzed CSRnc transcription in tonsillar naive and germinal center B cells from project SRP021509 (27). CSRnc transcription for most IH but not Iε, was relatively high in both naive and GC B cells (Figure 2D). These findings indicate that CSRnc transcription is not exclusive of activated B cells, and agrees with previous findings demonstrating constitutive CSRnc transcription (5, 26).
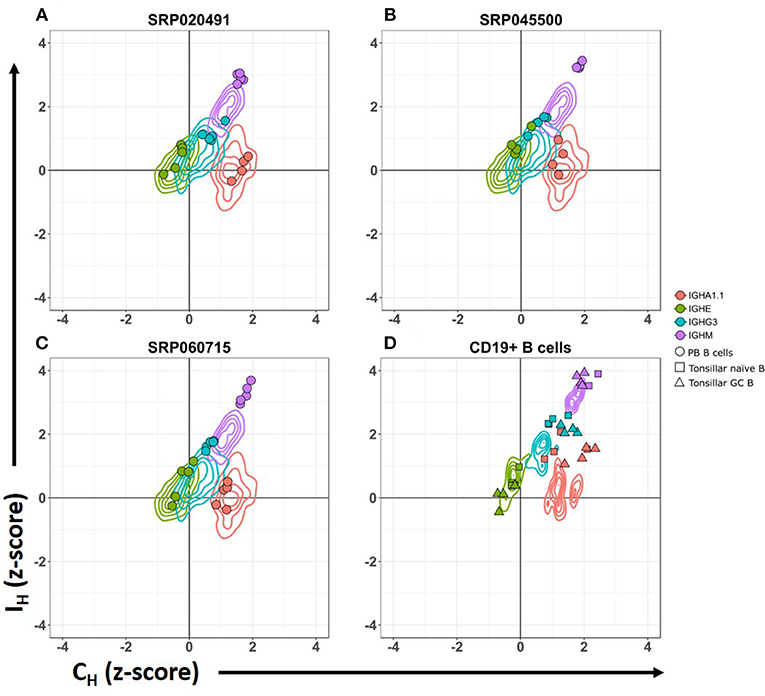
Figure 2. CSRnc transcription pattern in whole blood is similar to peripheral blood sorted CD19+ B cells. Relative CSRnc and CH transcription (Z- score) in whole blood RNA from the GTEx dataset is shown as a 2-D contour plot (n = 456 samples) in (A–C). Filled colored circles correspond to Z-scores of peripheral blood sorted CD19+ B cells derived from three independent RNA-seq projects (28, 29), overlaid to the GTEx data (Table S1). (D) 2-D density data of sorted CD19+ peripheral blood B cells Z-values of the projects shown in A–C (n = 14), overlaid with the corresponding Z scores of sorted tonsillar naïve B cells (squares. n = 4) and tonsillar germinal center B cells (triangles. n = 4) from project SRP021509 (27).
A transcriptionally active 309 base-pair (bp) region within the IGHM-IGHD intron was identified (referred hereafter as Iδ) and was included for further analysis (Figure 1C). This region is homologous to Iμ, overlaps with a previously described repeat termed Σμ, implicated in μ-δ CSR in IgD+ myelomas (20, 24). For the IGHA1 gene, we identified two potential IH exons (Iα1.1 and Iα1.2) that were selected for downstream analysis (Figure 1D). Iγ2 overlapped with a previously annotated lincRNA, ENST00000497397.1 (AL928742.1) at ENSEMBL (34). The genome coordinates of each IH exon identified and further analyzed are in Table 2. Navigation across the IgH locus using the ENSEMBL Genome Browser (34) allowed to confirm that the predicted IH exons include regions of RNApolII, H3K36, and H3K4 trimethylation enrichment in peripheral blood B cells and EBV-transformed B cells generated by the Roadmap Epigenomics and ENCODE projects (35, 36), indicating active transcription (Figure S3). Overall, these results agree with the current model of CSRnc transcription (5); however, the identification of novel transcribed elements ads complexity to the transcriptional regulation of the IgH locus.
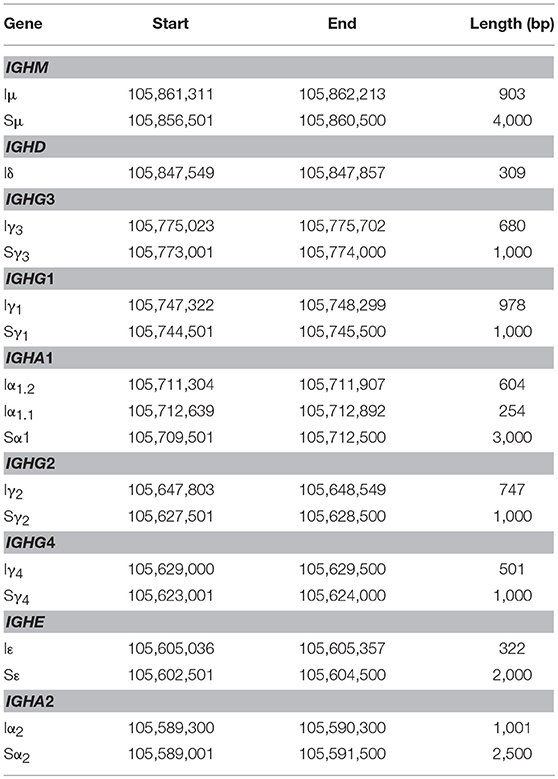
Table 2. Mapping I exons (IH) and switch regions (S) in human chromosome 14.GRCh38.p10.
CSRnc Transcription in Peripheral blood is Modified Upon Vaccination and Does Not Depend on Circulating Plasmablasts
CSRnc transcription increases upon B cell activation (5). To validate that, the predicted CSRnc transcripts are induced upon activation, normal human B cells were stimulated with agents mimicking T-dependent activation (CD40 ligand, IL-21 and CpG) and T independent activation (CpG, Pokeweed mitogen and SAC) in vitro for 3 and 6 days. We obtained whole blood total RNA and quantified Iμ, Iγ3, and Iγ1 CSRnc and AID transcripts by qRT-PCR (Figure 3A–D). CSRnc transcripts were detected in B cells activated by both T-dependent and T-independent activators, but transcription levels were significantly higher for T-dependent like activation. In both types of activation, CSRnc transcription at 6 days post-activation was higher than 3 days post-activation (Figure 3A-D). The highest transcription was for Iμ (3-fold higher than Iγ1 and Iγ3). Transcription of AID showed the same pattern as CSRnc transcripts (Figure 3D).
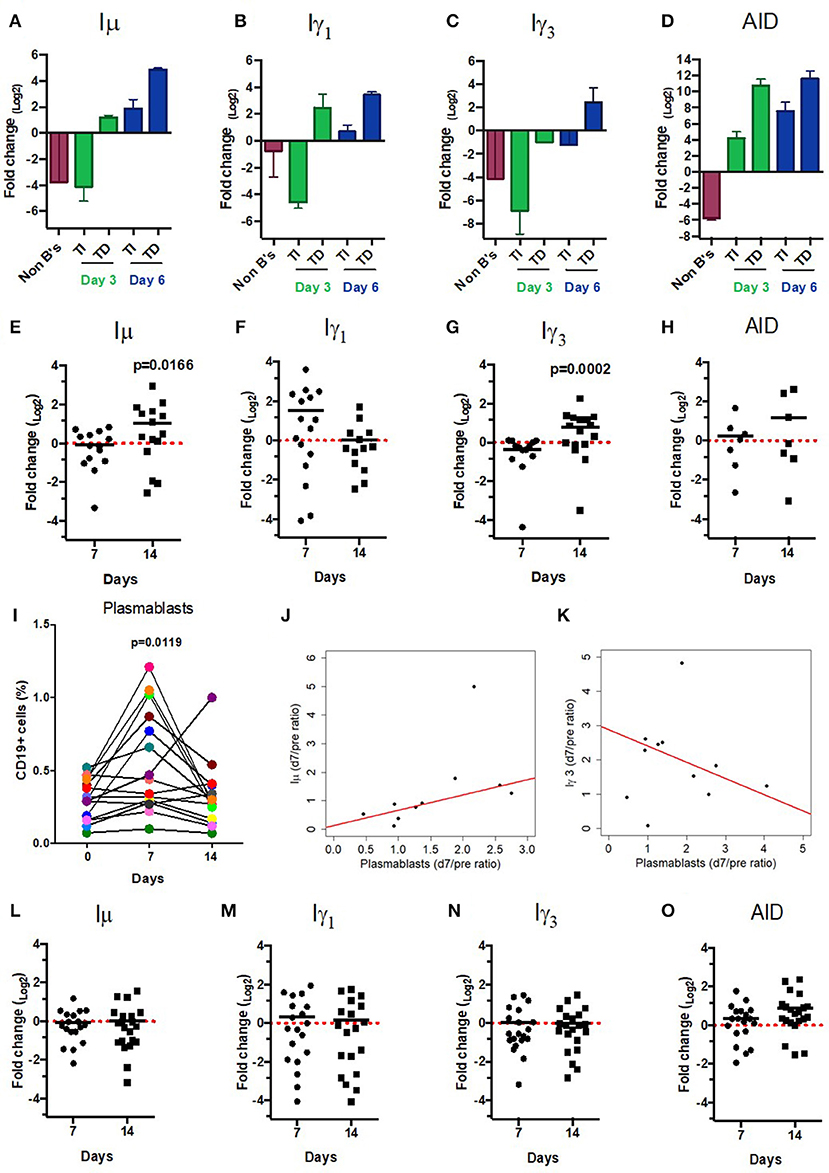
Figure 3. CSRnc transcripts quantitation in vitro and in vaccination. A qPCR Taq-Man assay for Iμ, Iγ3 Iγ1, and AID was used to quantitate CSRnc transcription with the 2ΔΔCt method (log2). (A–D) Enriched B cells cultured for 3 and 6 days with T-dependent like activation (TD) (IL-21, α-CD40) and T-independent activation (TI) (PWM, SAC). Bar plots represent the mean fold-change (non-activated enriched B cells /activated B cells) of two independent experiments. Non-B cells were used as control. (E–H) qPCR Taq-Man assay for Iμ, Iγ3 Iγ1, and AID from total RNA obtained from donors' PBMCs taken at pre-immunization (day 0) against Hepatitis B and/or Tetanus-Diphteria and on days 7 and 14 post-immunization. (Wilcoxon test. p < 0.05). (I) Plasmablast (CD3−CD19+CD20−CD27+CD38+) mobilization in peripheral blood expressed as a percentage of CD19+ B cells (Wilcoxon test. p = 0.005). (J) Positive correlation between day 0/7 plasmablast ratio and day 0/7 Iμ ratio (LTS regression method. Adjusted R2: 0.53, p-value: 0.015). (K) Negative correlation between day 0/7 plasmablast ratio and day 0/14 Iγ3 ratio (LTS regression method. Adjusted R2 = 0.63, p-value: 0.011). (L–O) No significant changes in CSRnc transcription assessed by qPCR were observed 7 and 14 days after trivalent inactivated Influenza vaccination (Wilcoxon test. P > 0.05). (L) Iμ, (M) Iγ3, (N) Iγ1, and (O) AID. Dotted red line indicates no change in expression (Fold-change = 1.0).
Immunization promotes an antigen-specific mobilization of plasmablasts to peripheral blood around day 7 post-challenge (37, 38). It is likely that this plasmablast wave derives from germinal centers (39). Thus, we hypothesized that the level of CSRnc transcription in peripheral blood correlates with the amount of plasmablasts. We assessed CSRnc transcription and plasmablast proportion in peripheral blood of healthy subjects before, 7 and 14 days post vaccination with either hepatitis B (HB) alone or in combination with tetanus/diphtheria vaccine (TT/Dp) (Figure 3E–K). Regarding pre-immune levels, Iμ transcription was not affected at day 7 (mean 0.95 ± 0.5, p = 0.76) or at day 14 (mean 2.04 ± 2, p = 0.073), however at day 14 was higher than at day 7 (p = 0.01) (Figure 3E). Iγ1 transcription was neither affected at day 7 (mean 2.9 ± 3.2, p = 0.057) nor at day 14 (mean 1.02 ± 0.9. p = 0.57) (Figure 3F). Contrastingly, Iγ3 transcription regarding pre-immune levels was reduced at day 7 (mean 0.76 ± 0.3, p = 0.016) and increased at day 14 (mean 1.73 ± 1.1, p = 0.021). As expected, Iγ3 transcription at day 14 was higher than at day 7 (p = 0.0002) (Figure 3G). No changes were detected in AID expression (Figure 3H).
Plasmablast levels peaked at day 7 post-vaccination (p = 0.011), and returned to pre-vaccine levels 14 days post-vaccination, as previously described (37, 38). There was no correlation between plasmablasts and Iγ1 transcription increase at day 7 (LTS method. Adjusted R2 = −0.1265, F-statistic: 0.1013 on 1 and 7 DF, p = 0.75). However, plasmablast and Iμ transcription correlated at day 7 (Figure 3J) (LTS method. Adjusted R2 = 0.53; F-statistic = 10.17 on 1 and 7 DF, p = 0.015). Interestingly, plasmablast fold-change at day 7 negatively correlated with Iγ3 transcription (Figure 3K) (LTS method. Adjusted R2 = 0.63; F-statistic = 13.04 on 1 and 6 DF, p-value: 0.011). No changes in Iμ, Iγ1, and Iγ3 transcription was detected in response to influenza vaccination (Figures 3L–O). Overall, these results suggest that an increase in CSRnc transcription in peripheral blood upon vaccination is dependent on vaccine type, and that the contribution of vaccine-mobilized plasmablasts to CSRnc transcription is negligible.
CSRnc Transcription is Prevalent in a Large Fraction of the recount2 Dataset, With Predominant Transcription of Iμ
Normalized counts (RPKM) obtained with recount2 were used to assess CSRnc transcription in the SRA, TCGA and GTEx datasets. We found no CSRnc transcription (RPKM = 0) in any of the 10 IH exons in a substantial fraction of the whole dataset (n = 26,512 samples; 37%) (Table 3). The IH log2-transformed RPKM average (2.65) for each non-zero RPKM sample (n = 44,091; 62.4%) was used to define an expression cutoff. “High” CSRnc transcription was defined as a mean log2 RPKM of 2.65 or higher. Only 29.8% of RNA-seq samples (n = 21,017) were above this expression cutoff. “Low” CSRnc transcription was defined as a mean log2 RPKM < 2.65 (Figure 4A. Table 3), which accounted for the remaining 32.7% of the samples (n = 23,074). The CSRnc transcription levels varied according to IH. Higher transcription (log2 RPKM), as well as, a more widespread transcription (proportion of samples) was found for Iμ in all datasets (Figure S4), supporting the current model of CSRnc transcription in which Iμ is constitutively active, and the other IH are regulated according to particular microenvironmental signals.
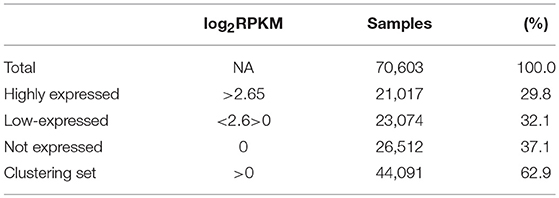
Table 3. General sequencing run metrics used for CSR-ncRNA expression analysis.
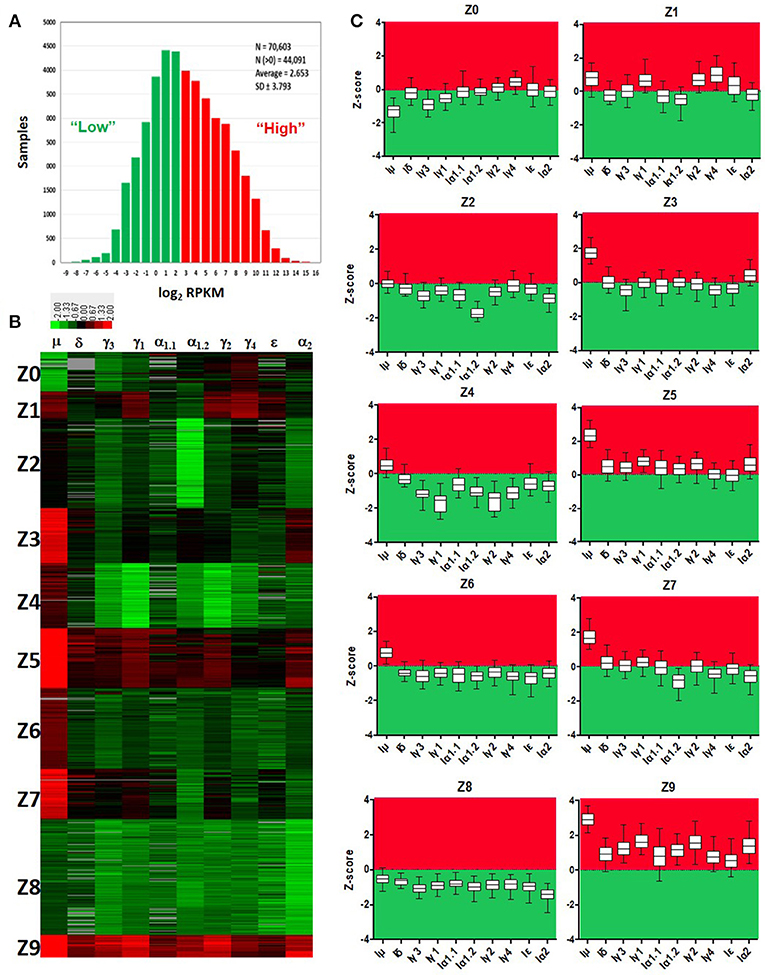
Figure 4. Quantitative analysis of CSRnc transcription using recount2. (A) Average log2-transformed RPKM distribution of the 10 IH exons per sample. There were 44,091 samples with non-zero RPKM. Higher than the mean (log2RPKM > 2.65) was considered “highly” transcribed (shown in red). “Low” CSRnc transcription was defined as a mean log2 RPKM < 2.65 (green). (B) CSRnc transcription profiling by Z-score clustering. Log2RPKM CSRnc transcription values of GTEx + TCGA + SRA datasets were transformed to standardized Z-scores and subjected to k-means clustering with a predefined number of 10 clusters (Left panel). Clustered data is represented in a heatmap where IH's are columns and Z clusters are in rows. Negative Z-scores (i.e., < 2.65 log2RPKM) are shown in green, positive Z-scores (i.e., > 2.65 log2RPKM) are shown in red. Absent values (RPKM = 0) are shown in gray. Z values near 0 are shown in black. (C) Expression pattern of each cluster represented in boxplots. The Z-score distribution (y axis) per IH (x axis) for each cluster of the 10 generated clusters. Dotted line indicates a Z-score = 0, which corresponds to the mean expression per sample (log2 RPKM = 2.65). Higher than the mean transcription is marked in red, whereas lower than the mean is marked in green.
The recount2 Dataset is Partitioned in Distinctive CSRnc Transcription Profiles
Cytokine milieu and other signals regulate CSR. To identify CSRnc transcriptional profiles that may result from different microenvironments, we further de-convoluted CSRnc transcription according to IH relative transcription profile. To do so, the entire non-zero dataset including GTEx, TCGA, and SRA Z-scores was clustered in 10 groups using k-means clustering (Figures 4B,C). Using Z0 as reference, each of IH showed a distinctive expression pattern in the remaining Z clusters (log2 RPKM regression analysis. F-statistic: p-value: < 2.2e−16). Clusters Z0, Z2, and Z8 were characterized by low (mean log2 RPKM < 2.65 or Z score < 0) CSRnc transcription in all IH classes. Clusters Z4, Z6, and Z7 were characterized by “high” expression of Iμ only (mean log2RPKM > 2.65). Cluster Z3 showed “high” expression in Iμ and Iα2. Cluster Z1 showed high expression in Iμ, Iγ1, and Iγ4. Finally, clusters Z5 and Z9 showed “high” expression in all IH's (Figure 4C).
CSRnc Transcription is Widely Distributed in Healthy Tissues, With Particular Profiles According to Tissue
To gain insight into CSRnc expression patterns in healthy adult human tissues, we used GTEx samples as a reference. Non-zero RPKM per tissue samples were ranked according to their average log2 RPKM. Higher average transcription was found in lymphoid tissues such as spleen, EBV-transformed B-lymphocytes and whole blood, but also in organs with mucosal-associated lymphoid tissues (MALT) such as terminal ileum, transverse colon, stomach, lung, and esophageal mucosa (Figure 5A). We observed a remarkable difference in average log2 RPKM between transverse colon (mean 7.5 ± 3.9) and sigmoid colon (mean 2.1 ± 3.2). Interestingly, salivary gland expression was among the tissues with highest transcription, and non-mucosal tissues such as thyroid and pituitary gland showed high average IH transcription. Another notable difference in average log2 RPKM was between visceral adipose tissue (omentum; mean 4.9 ± 2.3) and subcutaneous adipose tissue (mean 1.9 ± 1.5). Conversely, samples of tissues such as brain, skeletal and cardiac muscle, skin, as well as, chronic myelogenous leukemia cell line K562 and transformed dermal fibroblast cell lines showed the lowest CSRnc transcription levels (mean log2 RPKM < 2.65) (Figure 5A).
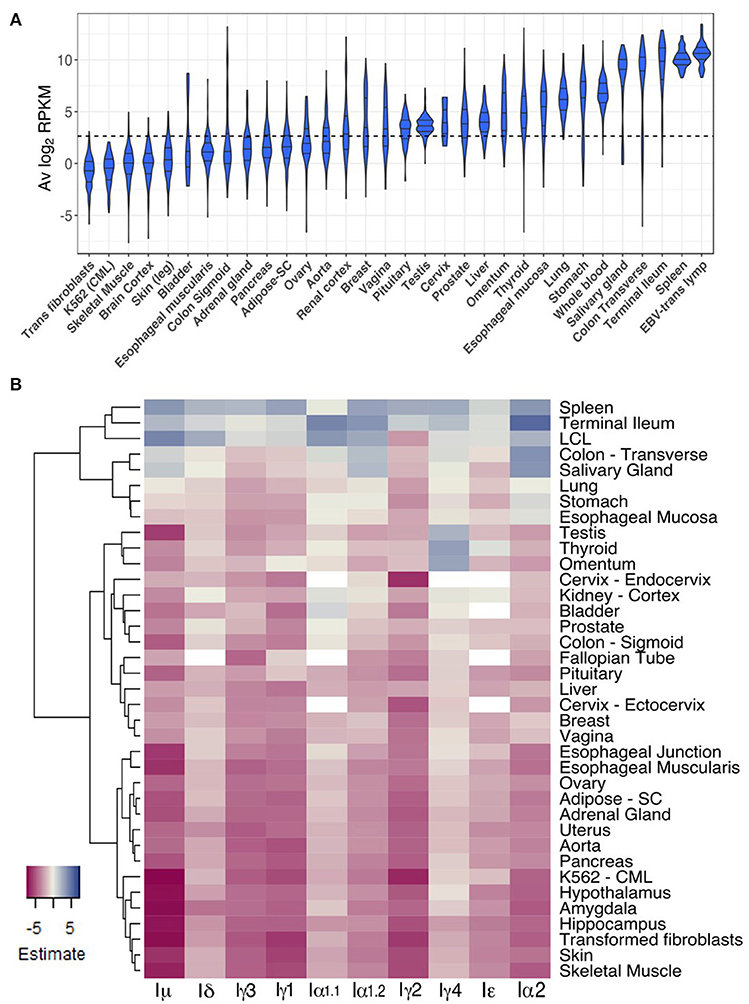
Figure 5. CSRnc transcription in healthy adult tissues. (A) The GTEx dataset was partitioned according to tissue type. Violin plot of average log2RPKM distribution of GTEx project representative tissues, ordered form left to right according to each tissue median log2RPKM. The violin area was scaled according to sample count and median and quartiles are shown. A dotted black line marks the mean average log2RPKM (2.65). For simplicity, only brain cortex was included as a representative sample for central nervous system. (B) Regression analysis of CSRnc transcription as a function of tissue type and I-exon. Whole blood CSRnc transcription was used as reference tissue (rows) for regression analysis according to I-exon (columns). The estimate for each comparison is expressed as a heatmap. Higher CSRnc transcription than in blood is represented in blue tones, whereas lower transcription is shown in pink tones. Zero estimate values are shown in ivory. Missing values (NA's) are shown in white. Euclidian distance was used for hierarchical clustering by row. For simplicity, only representative tissues are shown.
Using whole blood as reference tissue, we performed a linear regression analysis of each IH by tissue type. The transcription pattern of each IH in whole blood was significantly different (p < 2.2e−16) (Figure 5B). Iμ transcription was similar to IH average transcription (Figures 5A,B), in which we observed higher transcription in spleen, terminal ileum, salivary gland, and transverse colon than blood. Of note, Iμ transcription in testis was particularly low, despite its high average transcription. Iδ transcription was similar to Iμ transcription, but only spleen and terminal ileum were significantly higher. Iγ3, Iγ1, and Iγ2 transcription was similar and was higher in spleen than in blood (p < 2e−16) (Figure 5B).
For most tissues we found high correlation between Iα1.1 and Iα1.2 transcription however, some differences were noted. Iα1.1 transcription was higher in terminal ileum and transverse colon than in blood (p < 0.001). In contrast, Iα1.2 transcription was higher in spleen and salivary gland than in blood (p < 2e−16). Iα1 transcription was similar to Iα1.2 transcription, but also was higher in stomach, esophageal mucosa than in blood (p < 1.1e−05) (Figure 5B). Thus, Iα1 and Iα2 transcription pattern matches with the fact of IgA as the main immunoglobulin in mucosal tissue. Furthermore, our results suggest that CSR to IgA may involve tissue-dependent alternative transcription initiation and/or splicing in the corresponding CSRnc transcripts.
The most unexpected patterns of CSRnc transcription corresponded to Iγ4 and Iε. Transcription for both was higher in spleen, terminal ileum and EBV-transformed B-cells than in blood (p < 0.01). However, Iγ4 transcription was higher in thyroid, visceral adipose tissue (omentum), testis, than in blood (p < 2e−16). Similarly, Iε transcription was higher in in thyroid than in blood (p < 0.00003) (Figure 5B).
We tested if a particular CSRnc expression profile was associated to a particular tissue. Consistently with the regression analysis, de-convolution of CSRnc transcription according to IH relative expression (Z-score) revealed that terminal ileum, spleen, transverse colon, whole blood and salivary gland share a similar expression pattern and are highly enriched (FDR < 0.001) in clusters Z5 and Z9 (high transcription in all IH's) (Figure 6A). Some tissues with MALT such as stomach, esophageal mucosa and lung shared a similar IH transcription pattern and were enriched in cluster Z5 and Z3 (high Iμ and Iα2 transcription) (FDR < 0.001), whereas others such as breast, vagina, liver were enriched in cluster Z3 and Z6 (Iμ only). Testis, thyroid, pituitary, and omentum, characterized by the highest Iγ4 transcription, were enriched in cluster Z1 (Iμ, Iγ1, and high Iγ4) (FDR < 0.001). Finally, the remaining tissues such as subcutaneous adipose tissue, arteries, brain, skeletal, and cardiac muscle, skin, transformed fibroblasts and K562 cell lines, were enriched in Z0, Z2, and Z8 (low CSRnc transcription in all IH classes) (FDR < 0.001) (Figure 6A), and in few cases were enriched in clusters Z4 and Z6 (Iμ only) (FDR < 0.001).
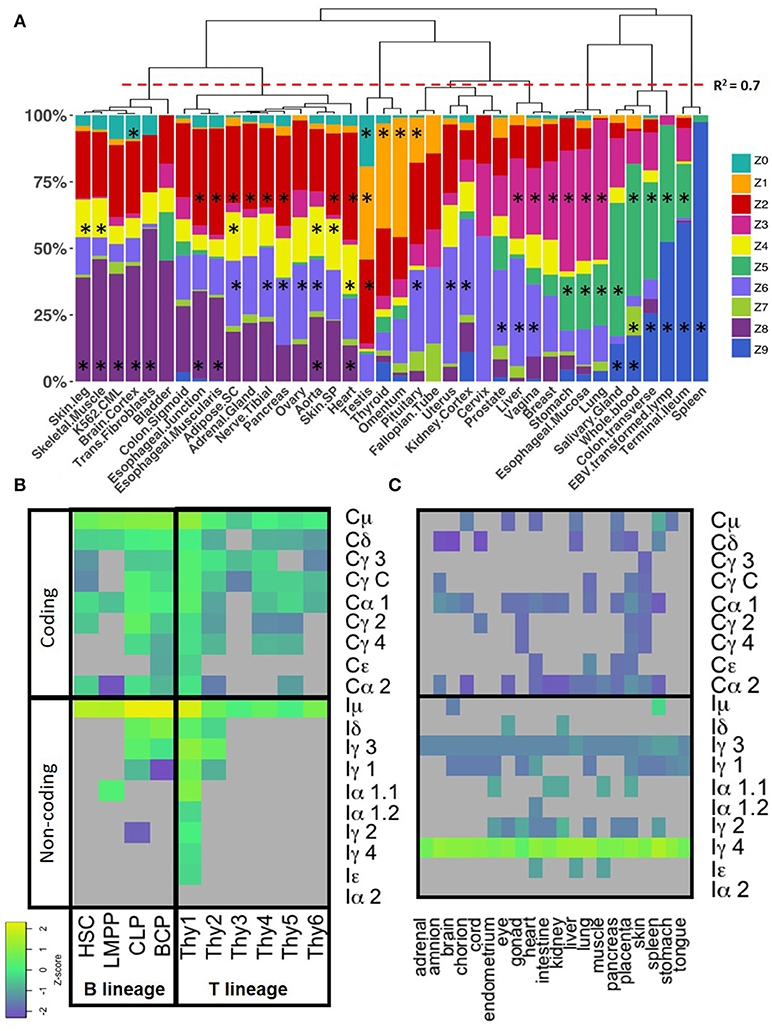
Figure 6. CSRnc transcription profile variation in healthy tissue. (A) The GTEX dataset was categorized according to tissue (x axis) and the relative proportion of samples (y-axis) belonging to each Z cluster (in colors). Many central nervous system tissues with highly similar pattern were removed for simplicity. Proportions were hierarchically clustered using Pearson correlation as distance metric with Cluster3.0 (18). The red dotted line marks a correlation R2 = 0.7. The black asterisk indicates a significant enrichment of a given tissue in a particular Z cluster (Exact Fisher's test, Benjamini-Hochberg adjustment for multiple correction. FDR < 0.01). (B) CSRnc (rows, lower panel) and CH (rows, upper panel) transcription in B (columns, left panel) and T cell precursors (columns, right panel). Z-score heatmap of IH and CH transcription in bone marrow from hematopoietic stem cells (HSC, CD34+CD38−lin−), lymphoid multipotent progenitors (LMPP, CD34+CD45RA+ CD38+CD10−CD62Lhilin−), common lymphoid progenitors (CLP, CD34+CD38+CD10+CD45RA+lin−), and committed B cell progenitors (BCP, CD34+,CD38+,CD19+) are shown in the left panel. CSRnc and CH transcription in thymic lymphoid precursors in thymic early lymphoid precursors with myeloid potential Thy1 (CD34+CD7− CD1a− CD4−CD8−) and Thy2 (CD34+CD7+CD1a− CD4−CD8−), as well as, fully committed T cell precursors Thy3 (CD34+CD7+CD1a+CD4− CD8−), Thy4 (CD4+CD8+), Thy5 (CD3+CD4+CD8−), and Thy6 (CD3+CD4− CD8+). Data was obtained from study SRP058719 (40). Each value represents the mean ± SD of two biological replicates. (C) CSRnc IH and CH transcription in fetal tissues from study SRP055513 (41). Heatmap of Z-score average per tissue (n = 3–8) of IH and CH (rows) in 9–22 weeks of gestation fetal tissues (columns). Higher transcription (Z-scores) are shown in green-yellow, lower expression and no expression is shown in purple and gray, respectively. Higher than average expression of Iγ4 is observed in all tested tissues. Z-score color code as in (B).
The observed anatomical distribution and abundance of CSRnc transcription suggests that the amount of CSRnc transcription may be dependent on the abundance of B cells present in a given tissue. We used the CH coding transcript log2RPKM as a proxy of the amount of B cells in the tissue. In general, CH transcription was 10–100-fold higher than CSRnc transcription. To correlate CSRnc transcription with corresponding CH transcription, Z-scores were used. As expected for each class, CSRnc and CH Z-scores where significantly correlated (p < 1.0e−16), suggesting that the higher numbers of B cells or plasma cells in a given tissue, higher CSRnc transcription. However, we have noticed that for most classes, a fraction of samples deviates from the expected orthogonal correlation, indicating higher CSRnc transcription relative to the CH transcript. This is particularly notable for Iμ, but also, Iγ1, Iγ4, and Iα2 (Figure S5). We suggest that this higher relative expression of IH regarding CH indicates active CSR.
Iμ Transcription Occurs in Early Lymphoid Progenitors and iγ4 is Widely Expressed in Non-Lymphoid Fetal Tissues
CSRnc transcription was addressed in early lymphoid development using data from study SRP058719, which addresses transcription in early lymphoid differentiation prior to and after B and T cell lineage commitment using RNA-seq from FACSorted cells (40). Interestingly, both B and T lineage precursors expressed Iμ. Enriched hematopoietic stem cells (HSC's CD34+CD38−lin−), lymphoid-primed multipotent progenitors (LMPP's, CD34+CD38+CD10− CD45RA+lin−), common lymphoid progenitors (CLP's, CD34+CD38+CD10+CD45RA+lin−), thymic CD34+CD7− CD1a− CD4−CD8− (Thy1) precursors and fully B cell-committed progenitors (BCPs, CD34+CD38+CD19+) expressed Iμ (Figures 6B).
We analyzed CSRnc expression in fetal tissue by using project SRP055513 data, which reported an extensive RNA-seq analysis in twenty fetal tissues during gestational weeks 9–22 (41). Remarkably, we detected a robust Iγ4, but not IGHG4 expression in all fetal tissues tested, regardless of the gestational week (Figure 6C). Higher average Iγ4 expression is in spleen, followed by lung and liver. The latter has lympho-hematopoietic function in the fetal stage. In contrast with their adult counterparts, Iγ4 was highly transcribed (Z-score > 0.8) in kidney, brain and muscle.
CSRnc Transcription in Cancer Varies According to Cancer Type and is Likely to Depend on the Degree of B Cell Tumor Infiltration
The TCGA project data was used as a reference to study CSRnc transcription in a wide variety of human cancers. As for GTEx, we analyzed CSRnc transcription (IH average log2 RPKM distribution) across 33 cancer types (Figure 7). IH transcription in diffuse large B cell lymphoma (DLBCL) and acute myeloid leukemia (AML) were the highest. In general, CSRnc transcription in neoplastic tissue mimicked its non-neoplastic counterparts, being high in lung, stomach, and testicular germ cell carcinomas. Conversely, CSRnc transcription was low in glial cell and skin cancers (Figure 7).
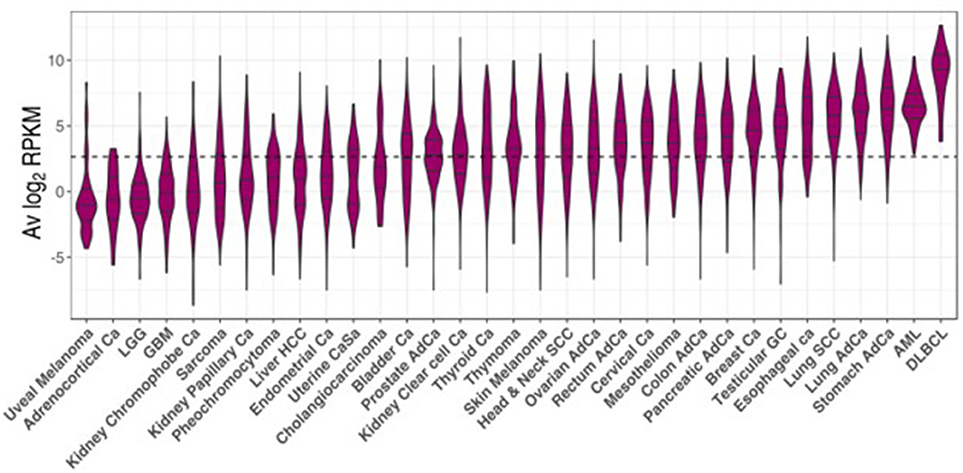
Figure 7. CSRnc transcription in cancer. RNA-seq data from the TCGA project was used to analyze CSRnc transcription in 33 cancer types. Violin plots of average log2RPKM, ordered from left to right according to increasing median. Violin area is scaled to each tumor sample count. A dotted black line marks the average log2RPKM = 2.65.
A direct comparison between CSRnc transcription in healthy (GTEx) and neoplastic tissue allowed the identification of three distinct patterns (Figure 8): (1) Tumors where average CSRnc transcription is lower than in healthy tissue, such as in DLBCL, prostate, thyroid, liver, and colon cancer (Figures 8A–E). (2) Tumors where average CSRnc transcription was higher than its healthy tissue counterpart, such as breast, rectum, testicular germ cell, pancreas carcinomas, ovarian cystadenoma, and skin melanoma (Figure 8G–L). (3) Tumors with no difference in CSRnc transcription between healthy and neoplastic counterpart, such as stomach and esophagus (Figure S6). Interestingly, using healthy kidney cortex as reference for kidney tumors, CSRnc transcription varied according to cancer type, CSRnc transcription was significantly lower in chromophobe and papillary carcinomas, but not in clear cell carcinoma. (Figure 8F). In adrenal gland, we observed a similar pattern, with lower CSRnc transcription in adrenocortical carcinoma, but not pheochromocytoma (Figure S6).
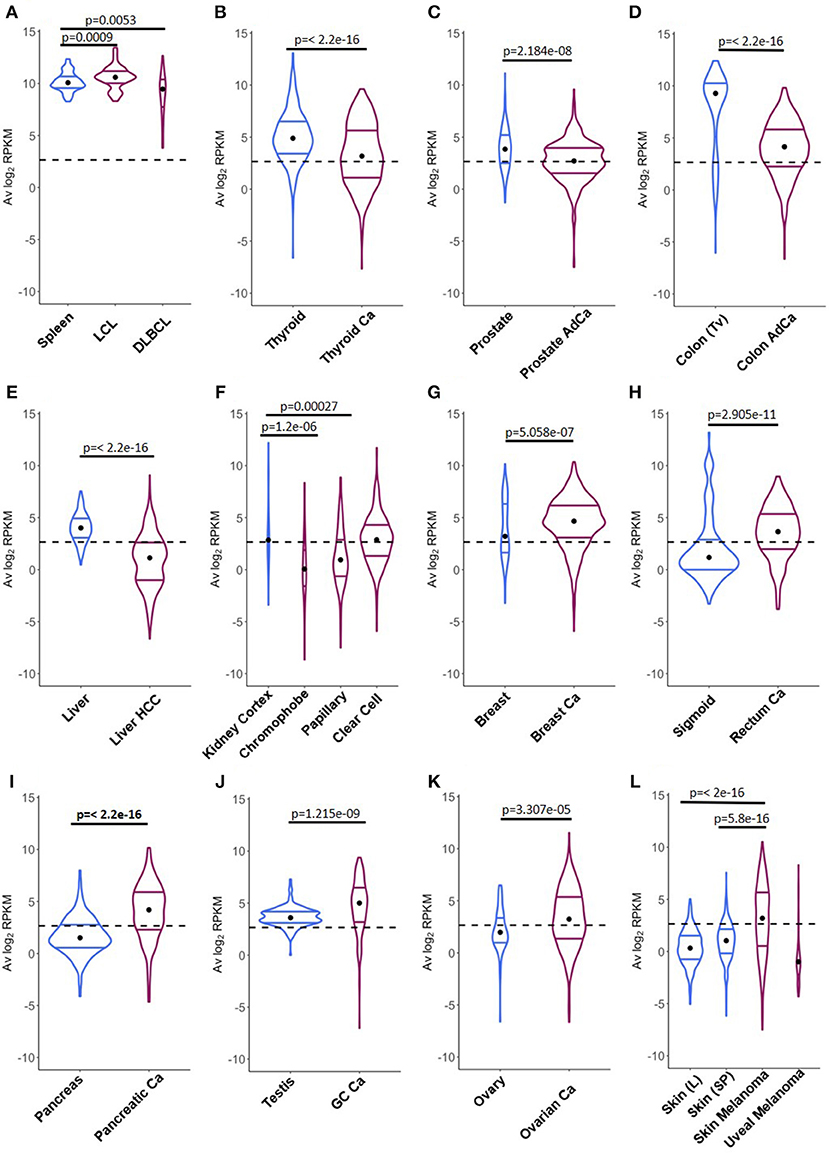
Figure 8. Comparison of CSRnc transcription in healthy tissue and its tumoral counterpart. Violin plots of the average log2RPKM distribution in healthy tissue (blue) in comparison with its cancer tissue counterpart (purple). Violin area are not scaled to sample count. Median (black dot) and quartiles are shown for each violin. Dashed black line marks the mean average log2RPKM (2.65). A reduction of CSRnc transcription in tumors was observed in (A–E). An increase of CSRnc transcription in tumors vs. healthy tissue was observed in (G–K). Some types of kidney cancers and melanomas showed an opposite patterns regarding the healthy tissue counterpart (F,L). The conducted statistical test were Wilcoxon rank sum test with continuity correction for two-sample comparisons, and Kruskal-Wallis test with post hoc Dunn's test correction for multiple comparisons.
The correlation between CSRnc and CH transcription (Figure S5) suggests that as for healthy tissues, CSRnc transcription derives from tertiary lymphoid infiltrates resulting from tumor-associated inflammation and the corresponding mucosal associated lymphoid tissues (42). To address this question, we analyzed CSRnc transcription in a wide variety of tumor-derived cell lines in SRA. The majority of the representative tumor derived cell lines tested (i.e., lung cancer A549 cells, breast cancer MCF-7 cells, and colon cancer HCT116 cells) were depleted in samples expressing CSRnc RNA (Table S2), indicating that CSRnc transcription in cancer derives from infiltrating B cells, and not the neoplastic cells per se. Nevertheless, using this approach, CSRnc transcription in cancer cells in situ cannot be ruled out.
CSRnc Transcription is Altered in Certain Infectious Conditions and a Iδ-iα2 Transcriptional Signature is Associated With Pediatric Crohn's Disease With Deep Ulceration
The SRA dataset represents the most diverse collection of data regarding methodological approaches and subjects of interest and represents a useful source of data related to diverse malignancies, as well as, infectious and non-infectious inflammatory pathology. Using MetaSRA Disease Ontology annotations (16), we identified significant enrichment of acute AML, breast, and lung cancers in SRA samples with CRSnc transcription, confirming our observations derived from TCGA data analysis.
Moreover, the SRA dataset allowed us to identify enriched CSRnc expression in infectious diseases such as diarrhea, brucellosis, and malaria. However, in all cases, peripheral blood samples were used for these experiments. To distinguish if the enrichment was due to increased expression, rather than for the inherent enrichment observed in blood (Figure 5), we performed differential expression analysis comparing experimental groups provided by SRA metadata. We detected significant reduction of CSRnc transcription in enterobacteria, but not in rotavirus diarrheal disease (SRP059039), malaria (SRP032775) (43), brucellosis and leishmaniasis (SRP059172) (Table S3). SRA data from influenza vaccination (SRP020491) (28) was consistent with our own experimental data demonstrating no significant changes in CSRnc transcription 7 days post-vaccination, regardless the plasmablast migration wave to peripheral blood at that time, indicating that CSRnc transcripts observed in peripheral blood do not derive from recently class-switched plasmablasts (Figures 3L–O). CSRnc transcription in response to influenza vaccination contrasted with the observation that natural infection with H7N9 (44) (SRP033696), in which we observed changes in coding and CSRnc transcription (Table S3).
The SRA dataset also showed enrichment for autoimmune disease terms such as systemic lupus erythematous and autoinflammatory diseases like inflammatory bowel disease. No significant differential expression was observed in peripheral blood transcriptomes in systemic lupus erythematosus patients compared with healthy subjects (SRP062966) (45) (Table S3). However, a study comparing the ileal transcriptome in pediatric Crohn's disease (CD) with and without deep ulceration, and with or without ileal involvement (SRP042228) (46), revealed an increased significant expression for Iμ, Iδ, and Iα2 in patients with deep ulcerated CD, regardless the presence of macroscopic or microscopic inflammation (Figure 9 and Table S3).
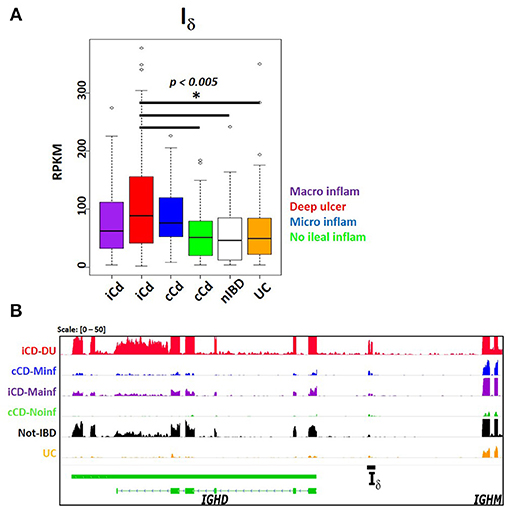
Figure 9. Increased Iδ transcription in ileal mucosa of Crohn's disease. Pediatric Crohn's disease patients from project SRP042228 were classified in two groups according to ileal mucosa involvement (iCD) on non-involvement (cCD) (46). Patients were further classified according to the degree of ileal mucosa inflammation. Ileal mucosa from non-inflammatory bowel disease (nIBD) and ulcerative colitis (UC) were used as controls (46). (A) Boxplot showing increased Iδ transcription (RPKM, y axis) in deep ulcerated Crohn's disease with ileal involvement (one factor ANOVA, Tukey multiple comparisons of means. P < 0.005). (B) Transcriptional landscape of the IGHD-IGHM locus in human chromosome 14 showing increased Iδ transcription in representative samples of deep ulcerated ileal involved CD (iCD, red track), CD with microscopic inflammation (cCD, blue track), iCD with macroscopic inflammation (purple track), non- inflammatory bowel disease (IBD, black track) and ulcerative colitis (UC, orange track).
Discussion
We performed an integral, systematic analysis of human CSRnc transcription using an experimental approach and datamining of a large and diverse public RNA-seq dataset supported by a previously described resource, recount2 (12). The precise I-exon boundaries for every class were undefined and are not annotated in current human genome version (GRCh38.p12). Among hematopoietic-derived cells, CSRnc transcription was specific for B cells, and consistent with previous findings was present in naïve, as well as, GC-B cells (5).
The present study has certain limitations. CSRnc transcription is required for CSR, however it does not prove that CSR is actively taking place. Among the most determinant factors influencing the amount of CSRnc transcription observed in an RNA-seq sample is the relative amount of B cells expressing a particular I-exon, as suggested by the high Z-score correlation between CSRnc and its corresponding CH transcript (Figure S5). We propose that the higher non-coding/coding Z-score ratio indicates a higher proportion of B cells undergoing a particular CSR event. Other factors influencing the amount of CSRnc transcription is that switch circles are transcriptionally active (47), and our current analysis cannot differentiate if CSRnc transcripts derive from chromosomal or switch circle transcription. Switch circles are non-replicating episomes that decay with B cell division (48–50). Thus, B cells undergoing cell division at high rate (i.e., GC B cells) should dilute the amount of circle templates in a greater extent than non-dividing B cells.
A novel transcribed element (Iδ) located in the IGHM-IGHD intergenic region was identified, which overlaps with a previously described repeat Σμ region, downstream of an atypical switch region (σδ) involved in non-classical CSR to IgD in mice (51) and humans (21–23). The Σμ region was originally described as mediator of μ-δ CSR by homologous recombination in myeloma cell lines (20, 24). The biological role of Σμ is uncertain, because IgD+ EBV-transformed cell lines and human tonsillar B cells undergo μ-δ CSR by non-homologous recombination using σδ as acceptor switch region (21, 22), in an AID-dependent fashion (23). Here, we demonstrate that Iδ (Σμ) can be actively transcribed (Figure 1C). Nonetheless, Iδ as an acceptor I-exon does not fit into the general model of CSR, because it is located downstream of the σδ region. Further research is required to elucidate if Iδ transcription is involved in the non-classical μ-δ CSR.
An important motivation for this work was the identification of early transcriptional signatures in blood that correlated with the strength and quality of the humoral response, and in particular with the GC response. Interestingly, Hepatitis B and or Tetanus/Diphteria vaccination induced Iμ, and Iγ3 transcription in peripheral blood at day 14 post-vaccination, but not when plasmablasts peaked (day 7 post-vaccination), suggesting that CSRnc transcription may not be the result of plasmablast mobilization to peripheral blood. Moreover, we observed increased Iγ1 and Iα1 transcription in natural H7N9 infection, but not upon influenza vaccination (Figure 3, Table S3), or in rotavirus infection (Table S3). The differential response observed upon influenza vaccination and natural rotavirus infection in contrast to HBV/tetanus-diphteria vaccination and H7N9 infection may be the result of the common repeated exposure to seasonal influenza or rotavirus, which would reactivate IgG+ memory B cells and in the absence of CSR (52).
Although IH transcription is highly inducible upon activation (Figure 3A-D), GTEx and SRA mining revealed that Iμ transcription was higher than other IH. This is consistent with the current model of CSR, in which Iμ is constitutively transcribed under the control of the μ intronic enhancer (Eμ), and its transcription is required for CSR regardless of the acceptor class (53). Eμ participates in chromatin remodeling of the IgH locus during lineage commitment and VDJ recombination (54, 55), and its deletion impairs B cell development, Iμ transcription and CSR (56).
We identified distinctive CSRnc transcriptional patterns related to known immunological functions, such as Iμ and Iα2 co-expression in MALT-rich organs, where active IgA secretion takes place. Of particular interest is cluster Z1, defined by an Iγ1, Iγ2, and Iγ4 transcriptional signature. Z1 cluster was the only cluster with higher expression of Iγ4, and was characteristic of the testis, thyroid gland and visceral adipose tissue (omentum), but not subcutaneous adipose tissue. Visceral adipose lymphoid B cells are immunologically active cells implicated in adipose tissue homeostasis that may play important pro-inflammatory roles associated with metabolic syndrome and obesity (57). The expression of Iγ1 and Iγ4 transcriptional signature in testis and thyroid is unexpected, because they are regarded as immune-privileged sites devoid of secondary/tertiary lymphoid organs (58). Similarly, higher Iε transcription in the thyroid gland is a striking finding worthy of further research due to the common association of atopic disease with autoimmune thyroiditis (59). At present, we do not know if CSR to IgG4 or IgE is taking place, however further research is required given that IgG4 is an atypical Ig that lacks Fc-mediated effector functions (60) and IgE could be implicated in autoimmunity. Furthermore, Iγ4 transcription in different fetal tissues suggests that its transcription is not limited to lymphoid tissue, may be a common feature of multipotency and is not necessarily coupled with CH transcription, suggesting additional functions beyond CSR.
A major goal of the GTEx project was to identify the role of genetic variation in gene expression as a quantitative trait. Tissue enrichment in two clusters with qualitatively different IH transcriptional pattern such as in liver (Z3 and Z6), testis (Z1 and Z2), terminal ileum (Z5 and Z9), and whole blood (Z5, Z7, and Z9) indicate CSRnc transcriptional heterogeneity in tissue donors involved in the GTEx project. This could result from different tissue microenvironments (i.e., cytokine/chemokine milieu, microbiota and environmental stimuli), as well as, genetics, which may modify CSRnc transcription patterns and possibly CSR itself. A recent study identified four SNP's in the human IgH locus presumably involved in CSR that affect immunoglobulin levels (61). Their implication in modifying CSRnc transcription warrants further investigation.
The study of CSRnc transcription in cancer is of particular interest for several reasons: (1) The anti-tumor response is largely mediated by the presentation of tumor neo-antigens to T cells and Treg balance. However, antibody-mediated anti-tumor activity can be achieved by antibody—dependent cytotoxicity or other mechanisms (42). (2) The presence of ectopic (or tertiary) lymphoid structures (ELS) (42, 62) and higher densities of infiltrating B cells and T follicular helper cells correlate with improved survival in lung (63), breast (64), and colorectal carcinoma (65). (3) The tumor microenvironment, including certain cytokines may modify CSR patterns in infiltrating and ELS B cells, regardless the antibody effector function. (4) AID activity is a known contributor to off-target mutagenesis and genomic instability in B cell malignancies (66). Aberrant AID and CSRnc transcription in non-lymphoid tumor cells could potentially contribute to cytidine deaminases—mediated kataegis (67).
We have found that average IH expression in certain tumors analyzed in the TCGA project resembles their non-neoplastic counterpart; however, some cancer types have significantly less CSRnc transcription, whereas others show the opposite. Most of the evidence we have gathered so far indicate that the origin of IH transcription is in the tumor infiltrating and ELS B cells, rather than the tumor cells per se (Table S2). Thus, differences in IH transcription in cancer may be the result of immune editing (68), which may alter the amount and activation state of the infiltrating and ELS B cells. Based on gene expression signature clustering, all non-hematologic cancers of the TCGA project were classified into six immunologically distinct subtypes with distinctive somatic aberration patterns, tumor microenvironment including the amount and cell type infiltration, and clinical outcome (69, 70). The relation between these six immunological subtypes with CSRnc transcription pattern may help to understand the elusive role of infiltrating B cells in the progression of different cancer types (42).
Despite the limitation of relying on public data when often the submitter researcher chooses to submit the minimal requirements of sample metadata, the SRA represents an enormous source of RNA-seq data from a highly diverse type of studies. In contrast to the standardized methodological criteria and metadata collection protocols used by the GTEx and TCGA consortiums, higher methodological variability in SRA data is expected, limiting inter-study comparisons. Nevertheless, we were able to identify a Iμ- Iδ, - Iα2 signature in ileal mucosa of Crohn's disease in a treatment-naive pediatric cohort (46). Iμ and Iα2 is somehow expected as the result of predominant IgM to IgA CSR on mucosal tissue (Figures 4B–C, 5B, 6A), and its exacerbation due to increased tissue B cell infiltration in response to inflammation (46). However, the increased Iδ transcription, particularly in CD associated with deep ulceration is an intriguing finding (Figure 9). Serum IgD levels are elevated in patients with CD (71) and other autoinflammatory syndromes (23, 72). A high proportion of μ-δ switched IgD+ cells bare autoreactive and poly-reactive specificities (73, 74), a feature shared with “natural autoantibodies,” which are reactive against bacterial wall components and may provide natural immunity against bacterial infection (75). In human respiratory mucosa, μ-δ switched IgD+ B cells mediate the innate-adaptive immunity and inflammatory cross talk (23). Mice incapable of undergoing classic CSR due loss of function of 53BP1 have an intestinal microbiota-dependent elevation of IgD serum titers and increased μ-δ switched IgD+ B cells (76). Direct experimental testing is required to elucidate the role of Iδ transcription, its role in μ-δ CSR and its implications in healthy and inflamed mucosae.
In conclusion, we have performed an unbiased analysis of the transcriptional landscape of the human IGH locus using a vast public RNA-seq dataset. Our observations agree with previous findings regarding constitutive CSRnc transcription in naïve B cells and its upregulation upon activation. We provide a detailed analysis of CSRnc transcription in healthy tissue. As expected, CSRnc transcription correlated with the amount of associated lymphoid tissue, however, we found novel transcriptional signatures involving Iγ4 or Iε in testis, pituitary, thyroid, and visceral adipose tissue. Changes in CSRnc transcription between healthy and tumor tissue were also found, likely as a result of immune editing. A novel transcribed element within the IGHM-IGHD intron termed Iδ was discovered and highly expressed in ileal mucosae of pediatric Crohn' s disease patients. Overall, this study highlights the importance of open access data for discovery and generation of novel hypothesis amenable for direct testing, and is a great example of the potential of the recount2 dataset to further our understanding of transcription, including regions outside the known transcriptome.
Ethics Statement
The participants in this study did so voluntarily after written consent in accordance with the Declaration of Helsinki. The study was approved by the INSP Institutional Review Board (CI: 971/82-6684).
Author Contributions
This study was conceived and designed by HK-M and JM-B. The experimental procedures were performed by H-KM, MO-M, HV-T, and JT-S. Flow cytometry acquisition and analysis was conducted by HK-M and LCB. RNA-seq data bioinformatics and statistical analysis were done by HK-M, LC-T, and JM-B, and supervised by AJ. HK-M and JM-B drafted the manuscript. LCB, LC-T, and AJ critically reviewed the manuscript. All authors read and approved the final manuscript.
Funding
This research was funded by the Consejo Nacional de Ciencia y Tecnología (CONACyT)/Fondo Sectorial de Investigación en Salud y Seguridad Social (FOSISSS) grant # 142120; HK-M is a PhD student of Programa de Doctorado en Ciencias Biomédicas, UNAM, and was supported by a CONACyT scholarship #289631.
Conflict of Interest Statement
The authors declare that the research was conducted in the absence of any commercial or financial relationships that could be construed as a potential conflict of interest.
Acknowledgments
We would like to thank Analí Migueles and Everardo Millan for their support in data pre-processing, and Fernando Riveros Mackay for differential expression analysis; Leopoldo Santos-Argumedo for kindly donating αCD40 hybridoma G28.5), Martha Patricia Rojo for support on flow cytometry; Tomás Salmerón Enciso, Yvonne Rosenstein, Fernando Esquivel and José Moreno for academic input, and Menno Van Zelm for critically reviewing the manuscript. HK-M is a PhD student of Programa de Doctorado en Ciencias Biomédicas, UNAM, and was supported by a CONACyT scholarship #289631.
Supplementary Material
The Supplementary Material for this article can be found online at: https://www.frontiersin.org/articles/10.3389/fimmu.2018.02679/full#supplementary-material
Abbreviations
AID, Activated-Induced Cytidine Deaminase; CD, Crohn's disease; CSRnc, Class Switch Recombination non-coding; CSR, Class Switch Recombination; CG, Germinal Center; CH, Heavy chain Constant; ELS, Ectopic Lymphoid Structures; EBV, Epstein Barr Virus; GTEx, Genotype-Tissue Expression Project; IH, I exon; MALT, Mucosal Associated lymphoid Tissue; PAMP, Pathogen-Associated Molecular Pattern; PB, Peripheral blood; SRA, Sequence Read Archive; RPKM, Reads Per Kilobase (transcript) Per Million (reads); TCGA, The Cancer Genome Atlas.
References
1. Victora GD, Nussenzweig MC. Germinal centers. Annu Rev Immunol. (2012) 30:429–57. doi: 10.1146/annurev-immunol-020711-075032
2. Yoshida T, Mei H, Dörner T, Hiepe F, Radbruch A, Fillatreau S, et al. Memory B and memory plasma cells. Immunol Rev. (2010) 237:117–39. doi: 10.1111/j.1600-065X.2010.00938.x
3. Xu Z, Zan H, Pone EJ, Mai T, Casali P. Immunoglobulin class-switch DNA recombination: induction, targeting and beyond. Nat Rev Immunol. (2012) 12:517–31. doi: 10.1038/nri3216
4. Lorenz M, Jung S, Radbruch A. Switch transcripts in immunoglobulin class switching. Science (1995) 267:1825–8. doi: 10.1126/science.7892607
5. Chowdhury M, Forouhi O, Dayal S, Mccloskey N, Gould HJ, Felsenfeld G, et al. Analysis of intergenic transcription and histone modification across the human immunoglobulin heavy-chain locus. Proc Natl Acad Sci USA. (2008) 105:15872–7. doi: 10.1073/pnas.0808462105
6. Yewdell WT, Chaudhuri J. A transcriptional serenAID: the role of noncoding RNAs in class switch recombination. Int Immunol. (2017) 29:183–96. doi: 10.1093/intimm/dxx027
7. Alt FW, Zhang Y, Meng FL, Guo C, Schwer B. Mechanisms of programmed DNA lesions and genomic instability in the immune system. Cell (2013) 152:417–29. doi: 10.1016/j.cell.2013.01.007
8. Consortium TG. The Genotype-Tissue Expression (GTEx) project. Nat Genet. (2013) 45:580–5. doi: 10.1038/ng.2653
9. Consortium G. Genetic effects on gene expression across human tissues. Nature (2017) 550:204–13. doi: 10.1038/nature24277
10. Cancer Genome Atlas Research N, Weinstein JN, Collisson EA, Mills GB, Shaw KR, Ozenberger BA, et al. The Cancer Genome Atlas Pan-Cancer analysis project. Nat Genet. (2013) 45:1113–20. doi: 10.1038/ng.2764
11. Hoadley KA, Yau C, Hinoue T, Wolf DM, Lazar AJ, Drill E, et al. Cell-of-origin patterns dominate the molecular classification of 10,000 tumors from 33 types of cancer. Cell (2018) 173:291–304 e296. doi: 10.1016/j.cell.2018.03.022
12. Collado-Torres L, Nellore A, Kammers K, Ellis SE, Taub MA, Hansen KD, et al. Reproducible RNA-seq analysis using recount2. Nat Biotechnol. (2017) 35:319–21. doi: 10.1038/nbt.3838
14. Thorvaldsdottir H, Robinson JT, Mesirov JP. Integrative Genomics Viewer (IGV): high-performance genomics data visualization and exploration. Brief Bioinformatics (2013) 14:178–92. doi: 10.1093/bib/bbs017
15. Lawrence M, Huber W, Pages H, Aboyoun P, Carlson M, Gentleman R, et al. Software for computing and annotating genomic ranges. PLoS Comput Biol. (2013) 9:e1003118. doi: 10.1371/journal.pcbi.1003118
16. Kibbe WA, Arze C, Felix V, Mitraka E, Bolton E, Fu G, et al. Disease ontology 2015 update: an expanded and updated database of human diseases for linking biomedical knowledge through disease data. Nucleic Acids Res. (2015) 43:D1071–8. doi: 10.1093/nar/gku1011
17. Bernstein MN, Doan A, Dewey CN. MetaSRA: normalized human sample-specific metadata for the sequence read archive. Bioinformatics (2017) 33:2914–23. doi: 10.1093/bioinformatics/btx334
18. De Hoon MJ, Imoto S, Nolan J, Miyano S. Open source clustering software. Bioinformatics (2004) 20:1453–4. doi: 10.1093/bioinformatics/bth078
19. Ritchie ME, Phipson B, Wu D, Hu Y, Law CW, Shi W, et al. limma powers differential expression analyses for RNA-sequencing and microarray studies. Nucleic Acids Res. (2015) 43:e47. doi: 10.1093/nar/gkv007
20. Akahori Y, Handa H, Imai K, Abe M, Kameyama K, Hibiya M, et al. Sigma region located between C mu and C delta genes of human immunoglobulin heavy chain: possible involvement of tRNA-like structure in RNA splicing. Nucleic Acids Res. (1988) 16:9497–511. doi: 10.1093/nar/16.20.9497
21. Kluin PM, Kayano H, Zani VJ, Kluin-Nelemans HC, Tucker PW, Satterwhite E, et al. IgD class switching: identification of a novel recombination site in neoplastic and normal B cells. Eur J Immunol. (1995) 25:3504–8. doi: 10.1002/eji.1830251244
22. Arpin C, De Bouteiller O, Razanajaona D, Fugier-Vivier I, Briere F, Banchereau J, et al. The normal counterpart of IgD myeloma cells in germinal center displays extensively mutated IgVH gene, Cmu-Cdelta switch, and lambda light chain expression. J Exp Med. (1998) 187:1169–78. doi: 10.1084/jem.187.8.1169
23. Chen K, Xu W, Wilson M, He B, Miller NW, Bengten E, et al. Immunoglobulin D enhances immune surveillance by activating antimicrobial, proinflammatory and B cell-stimulating programs in basophils. Nat Immunol. (2009) 10:889–98. doi: 10.1038/ni.1748
24. Yasui H, Akahori Y, Hirano M, Yamada K, Kurosawa Y. Class switch from mu to delta is mediated by homologous recombination between sigma mu and sigma mu sequences in human immunoglobulin gene loci. Eur J Immunol. (1989) 19:1399–403. doi: 10.1002/eji.1830190808
25. Litinskiy MB, Nardelli B, Hilbert DM, He B, Schaffer A, Casali P, et al. DCs induce CD40-independent immunoglobulin class switching through BLyS and APRIL. Nat Immunol. (2002) 3:822–9. doi: 10.1038/ni829
26. Fear DJ, Mccloskey N, O'connor B, Felsenfeld G, Gould HJ. Transcription of Ig germline genes in single human B cells and the role of cytokines in isotype determination. J Immunol. (2004) 173:4529–38. doi: 10.4049/jimmunol.173.7.4529
27. Beguelin W, Popovic R, Teater M, Jiang Y, Bunting KL, Rosen M, et al. EZH2 is required for germinal center formation and somatic EZH2 mutations promote lymphoid transformation. Cancer Cell (2013) 23:677–92. doi: 10.1016/j.ccr.2013.04.011
28. Henn AD, Wu S, Qiu X, Ruda M, Stover M, Yang H, et al. High-resolution temporal response patterns to influenza vaccine reveal a distinct human plasma cell gene signature. Sci Rep. (2013) 3:2327. doi: 10.1038/srep02327
29. Linsley PS, Speake C, Whalen E, Chaussabel D. Copy number loss of the interferon gene cluster in melanomas is linked to reduced T cell infiltrate and poor patient prognosis. PLoS ONE (2014) 9:e109760. doi: 10.1371/journal.pone.0109760
30. Pascual M, Roa S, Garcia-Sanchez A, Sanz C, Hernandez-Hernandez L, Greally JM, et al. Genome-wide expression profiling of B lymphocytes reveals IL4R increase in allergic asthma. J Allergy Clin Immunol. (2014) 134:972–5. doi: 10.1016/j.jaci.2014.05.015
31. Hoek KL, Samir P, Howard LM, Niu X, Prasad N, Galassie A, et al. A cell-based systems biology assessment of human blood to monitor immune responses after influenza vaccination. PLoS ONE (2015) 10:e0118528. doi: 10.1371/journal.pone.0118528
32. Koues OI, Kowalewski RA, Chang LW, Pyfrom SC, Schmidt JA, Luo H, et al. Enhancer sequence variants and transcription-factor deregulation synergize to construct pathogenic regulatory circuits in B-cell lymphoma. Immunity (2015) 42:186–98. doi: 10.1016/j.immuni.2014.12.021
33. Kushwaha G, Dozmorov M, Wren JD, Qiu J, Shi H, Xu D. Hypomethylation coordinates antagonistically with hypermethylation in cancer development: a case study of leukemia. Hum Genomics (2016) 10 (Suppl 2):18. doi: 10.1186/s40246-016-0071-5
34. Zerbino DR, Achuthan P, Akanni W, Amode MR, Barrell D, Bhai J, et al. Ensembl 2018. Nucleic Acids Res. (2018) 46:D754–61. doi: 10.1093/nar/gkx1098
35. Consortium EP. An integrated encyclopedia of DNA elements in the human genome. Nature (2012) 489:57–74. doi: 10.1038/nature11247
36. Roadmap Epigenomics C, Kundaje A, Meuleman W, Ernst J, Bilenky M, Yen A, et al. Integrative analysis of 111 reference human epigenomes. Nature (2015) 518:317–30. doi: 10.1038/nature14248
37. Odendahl M, Mei H, Hoyer BF, Jacobi AM, Hansen A, Muehlinghaus G, et al. Generation of migratory antigen-specific plasma blasts and mobilization of resident plasma cells in a secondary immune response. Blood (2005) 105:1614–21. doi: 10.1182/blood-2004-07-2507
38. Wrammert J, Smith K, Miller J, Langley WA, Kokko K, Larsen C, et al. Rapid cloning of high-affinity human monoclonal antibodies against influenza virus. Nature (2008) 453:667–71. doi: 10.1038/nature06890
39. Frolich D, Giesecke C, Mei HE, Reiter K, Daridon C, Lipsky PE, et al. Secondary immunization generates clonally related antigen-specific plasma cells and memory B cells. J Immunol. (2010) 185:3103–10. doi: 10.4049/jimmunol.1000911
40. Casero D, Sandoval S, Seet CS, Scholes J, Zhu Y, Ha VL, et al. Long non-coding RNA profiling of human lymphoid progenitor cells reveals transcriptional divergence of B cell and T cell lineages. Nat Immunol. (2015) 16:1282–91. doi: 10.1038/ni.3299
41. Roost MS, Van Iperen L, Ariyurek Y, Buermans HP, Arindrarto W, Devalla HD, et al. KeyGenes, a tool to probe tissue differentiation using a human fetal transcriptional atlas. Stem Cell Rep. (2015) 4:1112–24. doi: 10.1016/j.stemcr.2015.05.002
42. Colbeck EJ, Ager A, Gallimore A, Jones GW. Tertiary lymphoid structures in cancer: drivers of antitumor immunity, immunosuppression, or bystander sentinels in disease? Front Immunol. (2017) 8:1830. doi: 10.3389/fimmu.2017.01830
43. Tran TM, Jones MB, Ongoiba A, Bijker EM, Schats R, Venepally P, et al. Transcriptomic evidence for modulation of host inflammatory responses during febrile Plasmodium falciparum malaria. Sci Rep. (2016) 6:31291. doi: 10.1038/srep31291
44. Mei B, Ding X, Xu HZ, Wang MT. Global gene expression changes in human peripheral blood after H7N9 infection. Gene (2014) 551:255–60. doi: 10.1016/j.gene.2014.08.062
45. Hung T, Pratt GA, Sundararaman B, Townsend MJ, Chaivorapol C, Bhangale T, et al. The Ro60 autoantigen binds endogenous retroelements and regulates inflammatory gene expression. Science (2015) 350:455–9. doi: 10.1126/science.aac7442
46. Haberman Y, Tickle TL, Dexheimer PJ, Kim MO, Tang D, Karns R, et al. Pediatric Crohn disease patients exhibit specific ileal transcriptome and microbiome signature. J Clin Invest. (2014) 124:3617–33. doi: 10.1172/JCI75436
47. Kinoshita K, Harigai M, Fagarasan S, Muramatsu M, Honjo T. A hallmark of active class switch recombination: transcripts directed by I promoters on looped-out circular DNAs. Proc Natl Acad Sci USA. (2001) 98:12620–3. doi: 10.1073/pnas.221454398
48. Iwasato T, Shimizu A, Honjo T, Yamagishi H. Circular DNA is excised by immunoglobulin class switch recombination. Cell (1990) 62:143–9. doi: 10.1016/0092-8674(90)90248-D
49. Matsuoka M, Yoshida K, Maeda T, Usuda S, Sakano H. Switch circular DNA formed in cytokine-treated mouse splenocytes: evidence for intramolecular DNA deletion in immunoglobulin class switching. Cell (1990) 62:135–42. doi: 10.1016/0092-8674(90)90247-C
50. Von Schwedler U, Jack HM, Wabl M. Circular DNA is a product of the immunoglobulin class switch rearrangement. Nature (1990) 345:452–6. doi: 10.1038/345452a0
51. Rouaud P, Saintamand A, Saad F, Carrion C, Lecardeur S, Cogne M, et al. Elucidation of the enigmatic IgD class-switch recombination via germline deletion of the IgH 3′ regulatory region. J Exp Med. (2014) 211:975–85. doi: 10.1084/jem.20131385
52. Guthmiller JJ, Wilson PC. Harnessing immune history to combat influenza viruses. Curr Opin Immunol. (2018) 53:187–95. doi: 10.1016/j.coi.2018.05.010
53. Li SC, Rothman PB, Zhang J, Chan C, Hirsh D, Alt FW. Expression of I mu-C gamma hybrid germline transcripts subsequent to immunoglobulin heavy chain class switching. Int Immunol. (1994) 6:491–7. doi: 10.1093/intimm/6.4.491
54. Afshar R, Pierce S, Bolland DJ, Corcoran A, Oltz EM. Regulation of IgH gene assembly: role of the intronic enhancer and 5'DQ52 region in targeting DHJH recombination. J Immunol. (2006) 176:2439–47. doi: 10.4049/jimmunol.176.4.2439
55. Bolland DJ, Wood AL, Afshar R, Featherstone K, Oltz EM, Corcoran AE. Antisense intergenic transcription precedes Igh D-to-J recombination and is controlled by the intronic enhancer Emu. Mol Cell Biol. (2007) 27:5523–33. doi: 10.1128/MCB.02407-06
56. Perlot T, Alt FW, Bassing CH, Suh H, Pinaud E. Elucidation of IgH intronic enhancer functions via germ-line deletion. Proc Natl Acad Sci USA. (2005) 102:14362–7. doi: 10.1073/pnas.0507090102
57. Winer DA, Winer S, Chng MH, Shen L, Engleman EG. B Lymphocytes in obesity-related adipose tissue inflammation and insulin resistance. Cell Mol Life Sci. (2014) 71:1033–43. doi: 10.1007/s00018-013-1486-y
58. Chen Q, Deng T, Han D. Testicular immunoregulation and spermatogenesis. Semin Cell Dev Biol. (2016) 59:157–65. doi: 10.1016/j.semcdb.2016.01.019
59. Kolkhir P, Metz M, Altrichter S, Maurer M. Comorbidity of chronic spontaneous urticaria and autoimmune thyroid diseases: a systematic review. Allergy (2017) 72:1440–60. doi: 10.1111/all.13182
60. Aalberse RC, Stapel SO, Schuurman J, Rispens T. Immunoglobulin G4: an odd antibody. Clin Exp Allergy (2009) 39:469–77. doi: 10.1111/j.1365-2222.2009.03207.x
61. Jonsson S, Sveinbjornsson G, De Lapuente Portilla AL, Swaminathan B, Plomp R, Dekkers G, et al. Identification of sequence variants influencing immunoglobulin levels. Nat Genet. (2017) 49:1182–91. doi: 10.1038/ng.3897
62. Pitzalis C, Jones GW, Bombardieri M, Jones SA. Ectopic lymphoid-like structures in infection, cancer and autoimmunity. Nat Rev Immunol. (2014) 14:447–62. doi: 10.1038/nri3700
63. Germain C, Gnjatic S, Tamzalit F, Knockaert S, Remark R, Goc J, et al. Presence of B cells in tertiary lymphoid structures is associated with a protective immunity in patients with lung cancer. Am J Respir Crit Care Med. (2014) 189:832–44. doi: 10.1164/rccm.201309-1611OC
64. Gu-Trantien C, Loi S, Garaud S, Equeter C, Libin M, De Wind A, et al. CD4(+) follicular helper T cell infiltration predicts breast cancer survival. J Clin Invest. (2013) 123:2873–92. doi: 10.1172/JCI67428
65. Bindea G, Mlecnik B, Tosolini M, Kirilovsky A, Waldner M, Obenauf AC, et al. Spatiotemporal dynamics of intratumoral immune cells reveal the immune landscape in human cancer. Immunity (2013) 39:782–95. doi: 10.1016/j.immuni.2013.10.003
66. Qian J, Wang Q, Dose M, Pruett N, Kieffer-Kwon KR, Resch W, et al. B cell super-enhancers and regulatory clusters recruit AID tumorigenic activity. Cell (2014) 159:1524–37. doi: 10.1016/j.cell.2014.11.013
67. Taylor BJ, Nik-Zainal S, Wu YL, Stebbings LA, Raine K, Campbell PJ, et al. DNA deaminases induce break-associated mutation showers with implication of APOBEC3B and 3A in breast cancer kataegis. Elife (2013) 2:e00534. doi: 10.7554/eLife.00534
68. Teng MW, Galon J, Fridman WH, Smyth MJ. From mice to humans: developments in cancer immunoediting. J Clin Invest. (2015) 125:3338–46. doi: 10.1172/JCI80004
69. Saltz J, Gupta R, Hou L, Kurc T, Singh P, Nguyen V, et al. Spatial organization and molecular correlation of tumor-infiltrating lymphocytes using deep learning on pathology images. Cell Rep. (2018) 23:181–93 e187. doi: 10.1016/j.celrep.2018.03.086
70. Thorsson V, Gibbs DL, Brown SD, Wolf D, Bortone DS, Ou Yang TH, et al. The immune landscape of cancer. Immunity (2018) 48:812–30 e814. doi: 10.1016/j.immuni.2018.03.023
71. Cianci R, Lolli S, Pagliari D, Gambassi G, Frosali S, Marmo R, et al. The involvement of IgH enhancer HS1.2 in the pathogenesis of Crohn's disease: how the immune system can influence a multifactorial disease. Eur Rev Med Pharmacol Sci. (2016) 20:3618–27.
72. Masters SL, Simon A, Aksentijevich I, Kastner DL. Horror autoinflammaticus: the molecular pathophysiology of autoinflammatory disease (*). Annu Rev Immunol. (2009) 27:621–68. doi: 10.1146/annurev.immunol.25.022106.141627
73. Zheng NY, Wilson K, Wang X, Boston A, Kolar G, Jackson SM, et al. Human immunoglobulin selection associated with class switch and possible tolerogenic origins for C delta class-switched B cells. J Clin Invest. (2004) 113:1188–201. doi: 10.1172/JCI20255
74. Koelsch K, Zheng NY, Zhang Q, Duty A, Helms C, Mathias MD, et al. Mature B cells class switched to IgD are autoreactive in healthy individuals. J Clin Invest. (2007) 117:1558–65. doi: 10.1172/JCI27628
75. Mannoor K, Xu Y, Chen C. Natural autoantibodies and associated B cells in immunity and autoimmunity. Autoimmunity (2013) 46:138–47. doi: 10.3109/08916934.2012.748753
Keywords: Class Switch Recombination, B cell, non-coding transcription, RNA-seq, tumor microenvironment, antibody, vaccination, Crohn's disease
Citation: Kuri-Magaña H, Collado-Torres L, Jaffe AE, Valdovinos-Torres H, Ovilla-Muñoz M, Téllez-Sosa J, Bonifaz LC and Martínez-Barnetche J (2018) Non-coding Class Switch Recombination-Related Transcription in Human Normal and Pathological Immune Responses. Front. Immunol. 9:2679. doi: 10.3389/fimmu.2018.02679
Received: 16 September 2018; Accepted: 30 October 2018;
Published: 21 November 2018.
Edited by:
Amy L. Kenter, University of Illinois at Chicago, United StatesReviewed by:
Jayanta Chaudhuri, Memorial Sloan Kettering Cancer Center, United StatesAlberto Martin, University of Toronto, Canada
Copyright © 2018 Kuri-Magaña, Collado-Torres, Jaffe, Valdovinos-Torres, Ovilla-Muñoz, Téllez-Sosa, Bonifaz and Martínez-Barnetche. This is an open-access article distributed under the terms of the Creative Commons Attribution License (CC BY). The use, distribution or reproduction in other forums is permitted, provided the original author(s) and the copyright owner(s) are credited and that the original publication in this journal is cited, in accordance with accepted academic practice. No use, distribution or reproduction is permitted which does not comply with these terms.
*Correspondence: Jesús Martínez-Barnetche, jmbarnet@insp.mx