 Jesse J. R. Masson1
 Catherine L. Cherry1,2,3Nicholas M. Murphy4,5
 Isabel Sada-Ovalle6
 Tabinda Hussain7
 Riya Palchaudhuri1Jeffrey Martinson8Alan L. Landay8Baki Billah9Suzanne M. Crowe1,2Clovis S. Palmer1,2,10*
- 1Centre for Biomedical Research, Burnet Institute, Melbourne, VIC, Australia
- 2Department of Infectious Diseases, Monash University, Melbourne, VIC, Australia
- 3Faculty of Health Sciences, University of the Witwatersrand, Johannesburg, South Africa
- 4Monash Institute of Pharmaceutical Sciences, Monash University, Parkville, VIC, Australia
- 5Preimplantation Genetic Diagnosis, Monash IVF, Melbourne, VIC, Australia
- 6Unidad de Investigación Instituto Nacional de Enfermedades Respiratorias, Mexico City, Mexico
- 7Department of Biochemistry and Molecular Biology, Monash Biomedicine Discovery Institute, Monash University, Clayton, VIC, Australia
- 8Department of Immunology-Microbiology, Rush University Medical Centre, Chicago, IL, United States
- 9School of Public Health and Preventive Medicine, Monash University, Melbourne, VIC, Australia
- 10Department of Microbiology and Immunology, University of Melbourne, Melbourne, VIC, Australia
Untreated HIV infection is associated with progressive CD4+ T cell depletion, which is generally recovered with combination antiretroviral therapy (cART). However, a significant proportion of cART-treated individuals have poor CD4+ T cell reconstitution. We investigated associations between HIV disease progression and CD4+ T cell glucose transporter-1 (Glut1) expression. We also investigated the association between these variables and specific single nucleotide polymorphisms (SNPs) within the Glut1 regulatory gene AKT (rs1130214, rs2494732, rs1130233, and rs3730358) and in the Glut1-expressing gene SLC2A1 (rs1385129 and rs841853) and antisense RNA 1 region SLC2A1-AS1 (rs710218). High CD4+Glut1+ T cell percentage is associated with rapid CD4+ T cell decline in HIV-positive treatment-naïve individuals and poor T cell recovery in HIV-positive individuals on cART. Evidence suggests that poor CD4+ T cell recovery in treated HIV-positive individuals is linked to the homozygous genotype (GG) associated with SLC2A1 SNP rs1385129 when compared to those with a recessive allele (GA/AA) (odds ratio = 4.67; P = 0.04). Furthermore, poor response to therapy is less likely among Australian participants when compared against American participants (odds ratio: 0.12; P = 0.01) despite there being no difference in prevalence of a specific genotype for any of the SNPs analyzed between nationalities. Finally, CD4+Glut1+ T cell percentage is elevated among those with a homozygous dominant genotype for SNPs rs1385129 (GG) and rs710218 (AA) when compared to those with a recessive allele (GA/AA and AT/TT respectively) (P < 0.04). The heterozygous genotype associated with AKT SNP 1130214 (GT) had a higher CD4+Glut1+ T cell percentage when compared to the dominant homozygous genotype (GG) (P = 0.0068). The frequency of circulating CD4+Glut1+ T cells and the rs1385129 SLC2A1 SNP may predict the rate of HIV disease progression and CD4+ T cell recovery in untreated and treated infection, respectively.
Introduction
Metabolic dysfunction of immune cells is a hallmark of HIV infection, with implications in pathogenesis and disease progression (1–6). HIV disease progression varies considerably between individuals, with no approved methods to determine the rate of progression to AIDS or to predict favorable immunological recovery on treatment (7–12). Low CD4+ T cell count is associated with hyperactive glucose metabolism and dysregulation of glucose transporter 1 (Glut1), the major transporter of glucose on immune cells essential for CD4+ T cell activation and effector function (5, 6, 13–15). The genetic variation in immune-related genes and observed links to HIV disease progression has previously been investigated (16–22). However, the link between genetic variations in genes that regulate glucose metabolism and HIV disease progression has never been established.
Recent advances in immunometabolism support the concept that fundamental processes of metabolism in T cells are closely linked to their survival and functions (23). Indeed, susceptibility to HIV and disease progression has been associated with human leukocyte antigens HLA-B*27 and HLA-B*57, which influence the rate of CD4+ T cell loss and viral load (24–28). These clinical outcomes are dependent on the genetic diversity of specific identified key amino acid positions in the peptide-binding groove of HLA-B (29, 30). However, recent evidence has shown that viral controllers with maintained low levels of HIV replication do not always have these protective HLA allele configurations (31). This suggests new directions to expand our understanding of the mechanism of immunological dysfunctions in treated and untreated HIV infection may offer opportunities to develop novel treatments to improve immune recovery.
Immunometabolic dysfunctions related to HIV infection is associated with over expression of the glucose transporter Glut1, leading to increased influx of glucose into CD4+ T cells, irrespective of combination antiretroviral therapy (cART) status (1). Glut1 is regulated by the phosphoinositide 3-kinase (PI3K)/protein kinase B (AKT)/mammalian target of rapamycin (mTOR) pathway associated with T cell growth, proliferation and apoptosis, and more recently, HIV latency and replication (13, 32–34). As a key regulator of T cell growth and metabolic processes, abnormal PI3K/AKT/mTOR signaling is a characteristic feature of leukemia (35, 36), a disease associated with increased Glut1 expression and glucose influx in B and T cells isolated from blood and myeloid cells from bone marrow (37–39).
A posttranslational Glut1 regulator (40), AKT has five polymorphisms (rs3803300, rs1130214, rs2494732, rs1130233, and rs3730358) associated with metabolic dysfunction and the development of specific cancers, including nasopharyngeal and oral squamous cell carcinoma, non-small cell lung carcinoma, and gastric cancer (41–43). The relationship between AKT single nucleotide polymorphisms (SNPs) and systemic metabolic dysregulation has been shown by lower circulating blood glucose and lower fasting insulin levels in participants with at least one copy of the T allele found at the AKT rs1130214 site, consistent with lower insulin resistance observed in the presence of the T allele (44).
Glucose influx in breast cancer tissue associated with SNPs in SLC2A1, the gene that encodes Glut1, was attributable to the rs841853 locus in 52 German caucasians with primary breast cancer (45). Within this population, the G > T SNP is associated with upregulation of breast tumor glucose uptake compared to normal breast cells in vivo (45). Ng et al. (46) found expression of Glut1 Enhancer-2 SNP 1, located within putative insulin-responsive enhancer-2, was associated with diabetic nephropathy as a result of high intracellular glucose levels in response to insulin and hyperglycemia among 230 North American caucasians with type 1 diabetes.
It is now acknowledged that T cell metabolism dictates their survival, activation, differentiation, and functions. Activated T cells shift glucose metabolism toward a glycolytic phenotype reminiscent of cancer cells even in the presence of physiologically normal oxygen levels, known as the Warburg effect (1, 5). Because of this shared similarity in metabolism, SNPs regulating glucose uptake and metabolism in cancer cells may also regulate glucose metabolism in T cells. By analyzing SNPs associated with the AKT gene (rs3803300, rs1130214, rs2494732, rs1130233, and rs3730358) as well as in the Glut1 gene SLC2A1 (rs1385129 and rs841853) and antisense RNA 1 region SLC2A1-AS1 (rs710218), this study investigated the association between genes that regulate glucose metabolism and HIV disease outcome in treated and untreated HIV-positive people. This study determined whether genetic variants in metabolic genes are associated with HIV disease outcomes.
Materials and Methods
Study Participants
The study population included 29 HIV-positive treatment-naïve individuals, 39 HIV-positive individuals on cART (HIV+/cART), and 32 HIV seronegative controls (HIV-negative). Participating individuals were recruited from the community and the Infectious Diseases Unit at The Alfred Hospital (A state referral service for HIV care) in Melbourne, VIC, Australia. Viable peripheral blood mononuclear cells (PBMCs) were also obtained from the Clinical Research Core (CRC) Repository at the University of Washington, Seattle, WA, USA. This study was carried out in accordance with the recommendations of ethics committees at the participating institutions, with written informed consent from all subjects. All subjects gave written informed consent in accordance with the Declaration of Helsinki. The protocol was approved by the Alfred institutional board. Blood samples were collected in citrate anticoagulant tubes and processed within 1 h of venepuncture to isolate and cryopreserve PBMCs. All participants with self-reported co-infection with hepatitis C virus, active malignancy, vaccination, physical trauma, or surgery within 3 weeks prior to participation were excluded from this study.
Peripheral Blood Mononuclear Cell Preparation
Peripheral blood mononuclear cells were isolated using density gradient centrifugation (Lymphoprep, Axis Shield, Dundee, Scotland) (47), before being cryopreserved in 10% dimethyl-sulfoxide (DMSO; Sigma-Aldrich, St. Louis, MO, USA) and 90% autologous plasma. Cryopreserved PBMCs (>90% viability) were thawed in supplemented RPMI-1640 medium [10% human serum, penicillin/streptomycin (Invitrogen), 2 mmol/L l-glutamine (Invitrogen, Carlsbad, CA, USA)], before being stained on ice for 30 min as previously described (1).
Single Nucleotide Polymorphism Analysis
Peripheral blood mononuclear cell DNA was extracted and subjected to sequencing for SNP analysis by the Australian Genome Research Facility (QLD, Australia) using the iPLEX™ Assay (48).
Categorization of Favorable and Non-Favorable Genotypes in HIV-Positive Individuals
Favorable or normal disease progressors not on cART are defined by having CD4+ T cell counts within the range of 200–1,500 cells/μL within the first 3 years after initial diagnosis and are maintained above 200 cells/μL within 3–7 years after initial diagnosis, or the loss of less than 80 cells/μL per year. Slow and long term non-progressors were also classified as favorable disease progressors and defined as having a CD4+ T cell count of >500 cells/μL for up to 7–10 and >10 years, respectively. Non-favorable disease progressors are defined as having CD4+ T cell counts that fell below 200 cells/μL within the first 3 years of diagnosis or experiencing a loss of >80 cells/μL per year. These criteria were adapted from previously described work (49–55).
Due to our modest sample size, we assigned very stringent published criteria for our subject groups. Thus, favorable HIV+/cART responders are defined as participants who sustained CD4+ T cell counts >500 cells/μL after at least 3 years of cART. Non-responders are defined by having a CD4+ T cell count of <500 cells/μL despite at least 3 years on cART. These criteria are as previously described (9–12).
Flow Cytometric Analysis
Peripheral blood mononuclear cells were stained with fluorochromatic monoclonal antibodies CD3 (PE), CD4 (PerCP), and CD8 (APC) provided by BD Bioscience, and CD4 (PE Texas Red), CD57 (FITC), CD28 (PerCP Cy5.5), and PD1 (PE) from Invitrogen, ThermoFischer Scientific, before being washed and resuspended in 300 µL of 1× PBS prior to analysis with flow cytometry (BD Biosciences, San Jose, CA, USA). The Glut1 antibodies [FAB1418A and MAB1418 clones (R&D Systems, Minneapolis, MN, USA)] conjugated with APC and FITC were used to analyze Glut1 on CD4+ and CD8+ T cells using the staining procedure previously described (1). PBMCs were acquired on a FACS Calibur flow cytometer (BD Biosciences) and analyzed using FlowJo software, version 8.8 (Tree Star Inc., Ashland, OR, USA).
Statistical Analysis
Statistical analyses were performed using STATA (Version 13.1; StataCorp, College Station, TX, USA) and SPSS (Version 23; IBM statistical software, Armock, New York, NY, USA), while GraphPad Prism (Version 6.0; GraphPad Software, La Jolla, CA, USA) was used to construct figures. A “normal range” for CD4+Glut1+ T cell percentage was established using the 5th–95th centile of results obtained on HIV-control samples.
Mann–Whitney testing was used to compare unpaired, non-parametric continuous data between patient groups, which are described using interquartile ranges (IQR) (25th–75th centiles). Comparison of groups with high and low CD4+Glut1+ T cell percentage, age, and country of origin were performed using the Fishers Exact Test between genotypes. People who were homozygous for SLC2A1 SNP rs841853 and SLC2A1-AS1 SNP rs710218 were merged into four groups of genotypic combinations (TT and AA, TT and TT, GG and AA, GG and TT) and their data compared using Mann–Whitney testing using IQR (25th–75th centiles), with homozygote dominant and recessive genotypes grouped accordingly for HIV-positive treatment naive and HIV+/cART individuals, excluding those with heterozygous genotypes. Spearman correlation coefficients were used to assess associations between non-parametric, continuous variables. P values <0.05 were considered significant. Univariable logistic regression analyses were performed to examine associations between response to therapy and SNPs of interest. This was followed by multivariate logistic regression modeling where we included other important HIV-related variables that could have influenced disease progression [age, body mass index (BMI), sex, CD4+ T cell count, CD4%, CD4/CD8 ratio, time on cART, viral load, or percentage of CD4+Glut1+ T cells] using a step wise removal procedure to obtain the model of best fit.
Results
Participant Characteristics
Participants recruited included 32 HIV-negative controls, 29 HIV-positive treatment-naïve, and 39 HIV+/cART individuals (Table 1). Controls were similar in age to both treatment-naïve HIV-positive and HIV+/cART groups (Table 1). As expected, treatment-naïve individuals had lower CD4+ T cell counts and lower CD4/CD8 ratios than those on cART, and higher HIV viral loads (Table 1). To establish a typical range, CD4+Glut1+ T cell percentage was measured in HIV-negative controls. Based on these values, a range of 0.6% (fifth centiles) to 9.4% (95th centiles), with a median CD4+Glut1+ T cell percentage value of 4.6%, was established as a standard range for CD4+Glut1+ T cell percentages to create a qualitative data set in HIV-positive individuals (Table 1).
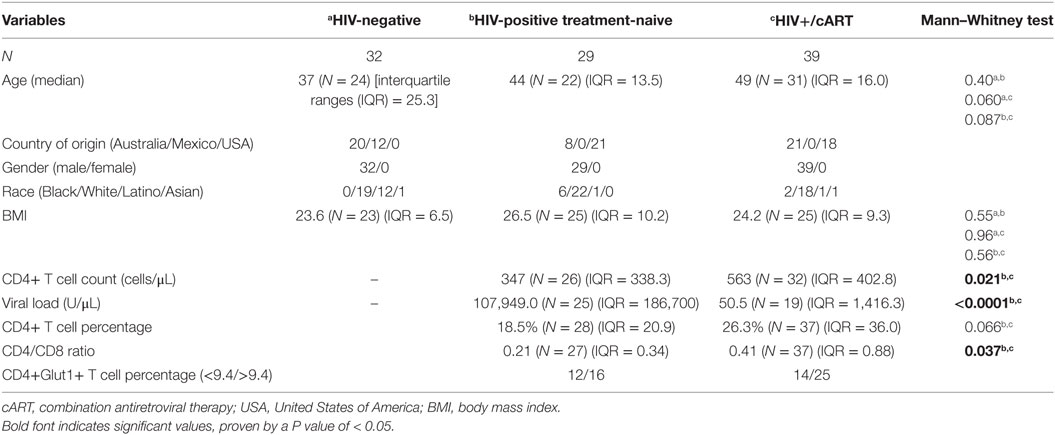
Table 1. Clinical characteristics of study population.
The SLC2A1 SNP rs1385129 Is Associated With Immunological Response on cART but Not With Disease Progression in Treatment Naive Subjects
Using univariable logistic regression analysis among the HIV-positive treatment-naive population, unfavorable disease progression was associated with lower CD4+ T cell percentage (OR: 0.82; CI: 0.71–0.95; P = 0.007) and CD4/CD8 ratio (OR: <0.0001; CI: <0.0001–0.06; P = 0.01) (Table 2). Unfavorable disease progression was also associated with higher CD4+Glut1+ T cell percentage (OR: 1.08; CI: 1.01–1.15; P = 0.02) (Table 2). No SNPs were associated with disease progression among the HIV-positive treatment-naive population (P > 0.05).
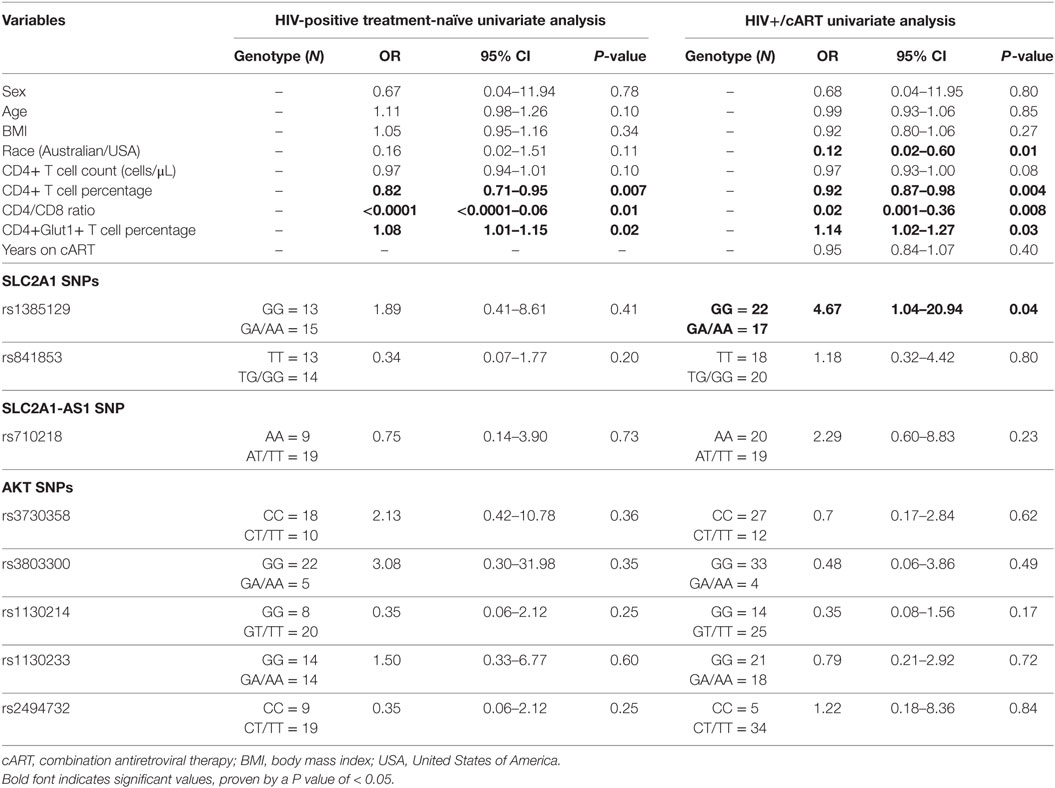
Table 2. Univariate associations with disease progression among HIV-positive treatment-naïve individuals and response to therapy for HIV+/cART individuals.
Univariable logistic regression was next used to assess associations with immunological response to cART among the HIV+/cART population. Poor response to therapy was less likely among Australian participants when compared against American participants (OR: 0.12; CI: 0.02–0.60; P = 0.01) (Table 2). As expected, poor response to therapy was inversely associated with CD4+ T cell percentage (OR: 0.92; CI: 0.87–0.98; P = 0.004) and CD4/CD8 ratio (OR: 0.02; CI: 0.001–0.36; P = 0.008) (Table 2). Furthermore, a poor response to therapy was associated with increased CD4+Glut1+ T cell percentage (OR: 1.14; CI: 1.02–1.27; P = 0.03) (Table 2). When analyzing SNPs, people with the dominant GG genotype associated with SLC2A1 SNP rs1385129 had a 4.67-fold higher risk of poor response to therapy (CI: 1.04–20.94; P = 0.04) when compared to those with a GA or AA genotype (Table 2).
To better understand the inverse relationship between CD4+ T cell counts and Glut1 expression on these cells, we evaluated Glut1 expression on exhausted CD4+ T cells marked by PD1 expression (56) and on CD4+ T cells with a senescence phenotype (CD57+CD28−) (57). We show that Glut1 is significantly elevated on cells with an exhausted and senescent phenotype, indicating that these CD4+ T cells are metabolically exhausted as previously hypothesized (6) (Figure S1 in Supplementary Material).
Using multivariate logistic regression modeling, it was shown that the GG genotype of SNP rs1385129 and lower total CD4+ T cell percentage, independent of each other, were dependently associated with poor response to therapy (OR: 0.08; CI: 0.01–0.7; P = 0.02; and OR: 0.9; CI: 0.8–1.0; P = 0.003, respectively) independent of age, BMI, sex, and time on cART. No other variables of interest were associated with any SNPs, progression to disease, or recovery with treatment (P > 0.05). Further multivariable analysis was limited due to low participant numbers.
CD4+Glut1+ T Cell Percentage Is Highest in HIV-Positive Individuals With Non-Favorable Disease Progression and Poor Response to cART
Since high Glut1 expression on CD4+ T cells has previously been implicated in low CD4+ T cell counts in both HIV-positive treatment-naive and cART-treated patients (1), we first determined whether an association existed between the frequency of circulating CD4+ T cells expressing Glut1 and both unfavorable disease progression and poor CD4+ T cell recovery in our cohort. The percentage of CD4+ T cells expressing Glut1, a surrogate marker of T cell activation and glycolytic metabolism, was compared between controls and HIV-positive treatment-naïve individuals. A conventional gating strategy was used to evaluate CD4+Glut1+ T cell percentage (Figures 1A–C). The percentages of CD4+Glut1+ T cells were higher for both favorable (median: 18.0%; IQR = 14.5) and non-favorable (median: 36.3%; IQR = 37.9) disease progression in untreated individuals when compared to HIV-negative controls (median: 4.6%; IQR = 4.9) (P < 0.0001) (Figure 1D). Furthermore, CD4+Glut1+ T cell percentage was higher in HIV-positive treatment-naïve individuals with non-favorable progression when compared to those with favorable progression (P = 0.045) (Figure 1D). HIV-negative controls also had significantly higher percentages of CD8+Glut1+ T cells when compared to those with non-favorable progression (P = 0.036) but were similar when compared to favorable progressors (median: 98.0; IQR = 3.2) (P = 0.30) (Figure 1E). The percentage of CD8+Glut1+ T cells was not statistically different between HIV-positive groups (P = 0.31) (Figure 1E).
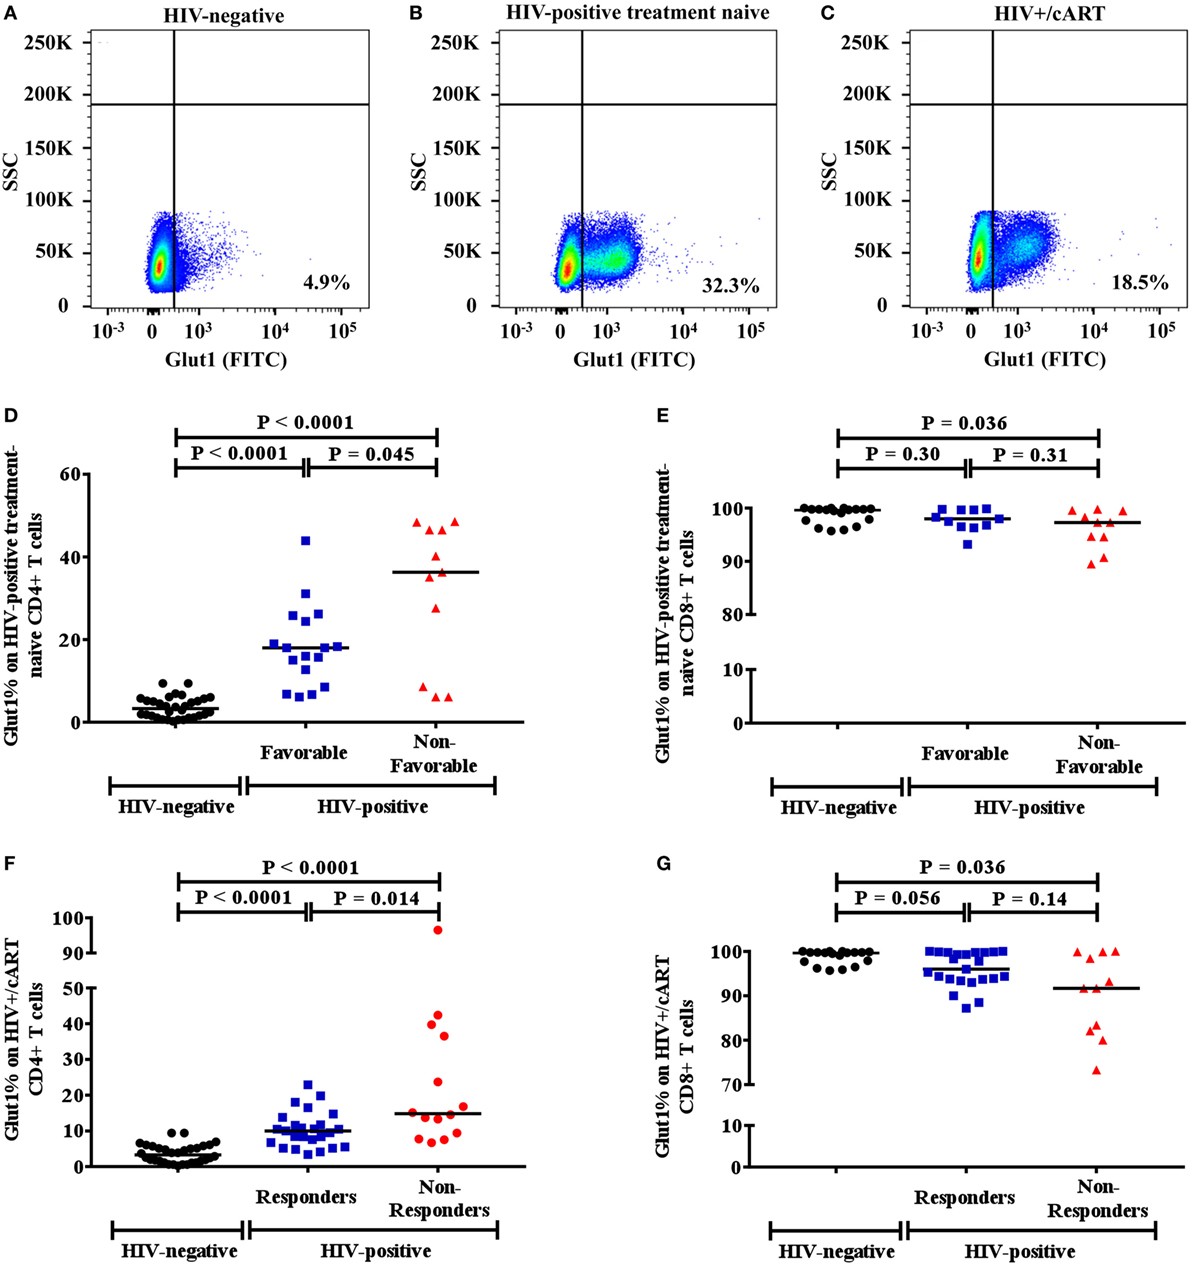
Figure 1. Gaiting strategy and analysis of CD4+Glut1+ T cell percentage in HIV-negative and HIV-positive populations. (A–C) Percentage of Glut1 expressing CD3+CD4+ T cells within the lymphocyte population were defined using side scatter (SSC) and the Glut1 fluorophore (FITC); (D,E) comparison between HIV-negative controls and HIV-positive treatment-naïve groups with favorable and non-favorable disease progression; (F,G) comparison between HIV-negative controls and HIV+/cART responder and non-responder groups. Horizontal black lines refer to median CD4+Glut1+ or CD8+Glut1+ T cell percentages of each group. cART, combination antiretroviral therapy.
The percentage of CD4+Glut1+ T cells was also higher in cART-treated immunological responder (median: 10.0%; IQR = 6.6) and non-responder populations (median: 14.8%; IQR = 28.3) when compared to controls (median: 4.6%; IQR = 4.9) (P < 0.0001) (Figure 1F). Furthermore, CD4+Glut1+ T cell percentages were higher in immunological non-responders than in immunological responders (P = 0.014) (Figure 1F). HIV-negative controls had similar percentages of CD8+Glut1+ T cells (median: 99.7; IQR = 2.6) when compared to immunological responders (median: 96.0; IQR = 6.1) (P = 0.056) (Figure 1G). However, immunological non-responders had lower CD8+Glut1+ T cell percentages (median: 91.7; IQR = 17.8) when compared to controls (P = 0.036) (Figure 1G).
Mann–Whitney testing assessed if participant characteristics varied between favorable and non-favorable groups in HIV-positive individuals (Table S1 in Supplementary Material). CD4+ T cell counts, CD4+ T cell percentages, and CD4/CD8 ratios were highest in those with favorable disease progression and recovery (Table S1 in Supplementary Material). Viral loads were also highest among non-favorable HIV-positive treatment-naïve individuals (Table S1 in Supplementary Material).
CD4+Glut1+ T Cell Percentage Correlates Inversely With CD4+ T Cell Counts and Percentage in Those With HIV Infection
Among HIV-positive treatment-naïve and HIV+/cART populations, there was an inverse relationship between the frequency of circulating CD4+Glut1+ T cells and that of total CD4+ T cell counts (Figures 2A,B). This relationship also existed between the percentage of CD4+Glut1+ T cells and total CD4+ T cell percentage confirming previous findings (Figures 2C,D) (1). CD4+Glut1+ T cell percentage was also inversely correlated with the CD4/CD8 ratio in HIV-positive treatment-naïve and HIV+/cART individuals (Figures 2E,F). We found no association between age, BMI, viral load, or duration of cART use and the percentage of CD4+Glut1+ T cells.
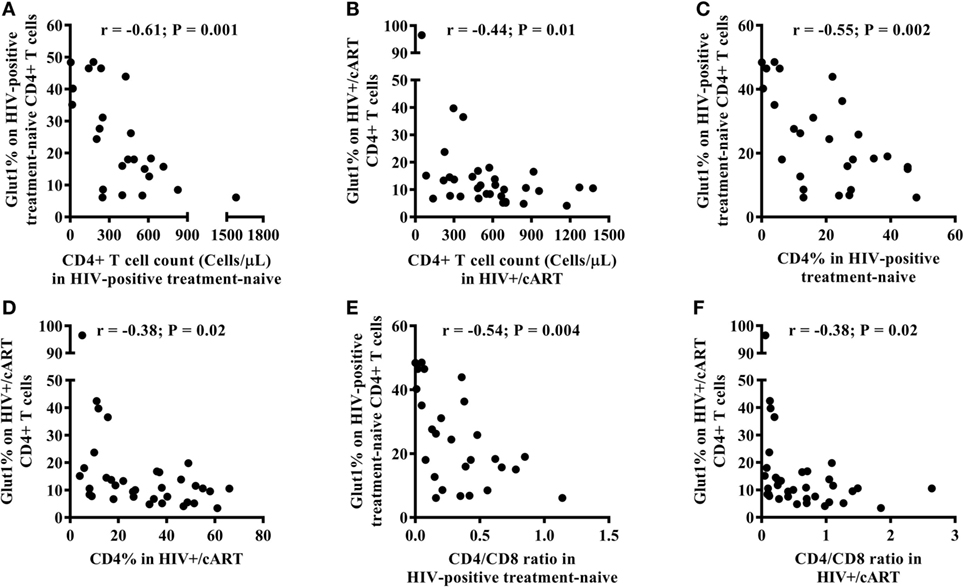
Figure 2. CD4+Glut1+ T cell percentage inversely correlates with CD4+ T cell counts (A,B), CD4+ T cell percentage (C,D), and CD4/CD8 ratio (E,F) in HIV-positive individuals confirming previous results (1). cART, combination antiretroviral therapy.
CD4+Glut1+ T Cell Percentage Is Different Between Genotypes Associated With SLC2A1 and AKT SNPs in HIV+/cART Individuals
We next investigated whether a relationship exists between the frequency of circulating CD4+Glut1+ T cells and SNPs within genes that encode the Glut1 protein (SLC2A1) and AKT. The percentage of CD4+Glut1+ T cells was compared between allele populations in HIV+/cART individuals. The dominant homozygote allele (GG) for the rs1385129 SLC2A1 SNP was associated with higher CD4+Glut1+ T cell percentage in HIV+/cART individuals at 13.8% (IQR = 14.0) when compared to the heterozygous (GA) allele percentage of 9.4% (IQR = 4.8; P = 0.018) (Figure 3A). A median value of 6.8% was obtained in individuals with the recessive homozygote allele (AA). There was no difference in percentage of CD8+Glut1+ T cells between those with the homozygous dominant genotype and those with a recessive allele (GG: median: 99.6%; IQR = 7.2 vs. GA/AA: median: 94.2%; IQR = 8.5; P = 0.096).
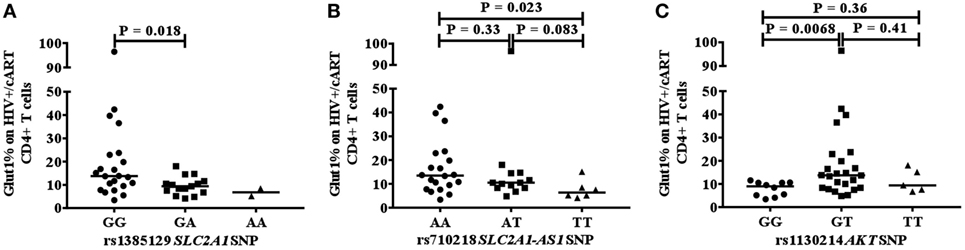
Figure 3. Association between CD4+Glut1+ T cell percentage and genetic polymorphisms associated with the SLC2A1 SNPs rs1385129 (A) SLC2A1-AS1 SNP rs710218 (B), AKT SNP rs1130214 (C). cART, combination antiretroviral therapy; SNP, single nucleotide polymorphisms.
When analyzing the rs710218 SLC2A1-AS1 SNP in HIV+/cART individuals, the dominant homozygote allele (AA) was associated with higher CD4+Glut1+ T cell percentage at 13.5% (IQR = 14.0) when compared to the recessive homozygous (TT) percentage of 6.3% (IQR = 5.2; P = 0.023) (Figure 3B). No difference was found between the heterozygous (AT) median at 10.5% (IQR = 6.3) and the dominant (P = 0.33) and recessive homozygous medians (P = 0.083) (Figure 3B). The median percentage of CD4+Glut1+ T cells among homozygous dominant individuals was also higher when compared to those with a recessive allele (AT or TT) suggesting a higher percentage of CD4+ T cell metabolic activation in HIV+/cART individuals with the rs710218 GG genotype (P = 0.04). Percentage of CD8+Glut1+ T cells was higher among those with a homozygous dominant genotype (GG: median: 99.8%) when compared to those with a recessive allele (GA/AA: median: 93.9%; P = 0.047).
The heterozygotic genotype (GT) for AKT SNP rs1130214 was associated with higher CD4+Glut1+ T cell percentage of 13.8% (IQR = 13.8) when compared with the dominant homozygous genotype (GG) (median: 9.0%; IQR = 5.6) (P = 0.0068) (Figure 3C). There was no difference between the recessive homozygous population (TT) value of 9.4% (IQR = 9.4) and the values of the other genotypes (Figure 3C). Therefore, the GT genotype of the rs1130214 AKT SNP is associated with persistently high CD4+ T cell glycolytic activity in HIV-positive cART-treated individuals.
CD4+Glut1+ T Cell Percentage Is Highest in HIV+/cART Individuals With Dominant Homozygous Genotypes for Both rs841853 SLC2A1 and rs710218 SLC2A1-AS1 SNPs
Based on the 1,000 genomes data, which describes the linkage disequilibrium between SLC2A1 SNP rs841853 and SLC2A1-AS1 SNP rs710218 to be strongly linked across most individuals (58), subjects were merged into four groups. Homozygote dominant and recessive genotypes were grouped accordingly for both HIV-positive treatment-naïve and HIV+/cART groups, excluding those with heterozygous genotypes for both SNP positions. HIV+/cART individuals with a dominant homozygous genotype at positions rs841853 (TT) and rs710218 (AA) had a higher CD4+Glut1+ T cell percentage median of 11.6% (N = 26; IQR = 9.4) when compared to the 8.3% (N = 11; IQR = 3.8) found among those with a dominant homozygous genotype at position rs841853 (TT) and a recessive homozygous genotype at rs710218 (TT) (P = 0.02). Despite being associated with CD4+Glut1+ T cell percentage, HIV+/cART individuals with dominant homozygous genotypes for rs841853 and rs710218 were not associated with disease progression.
The SLC2A1 SNP 1385129 Is Associated With High CD4+Glut1+ T Cell Percentage and the Non-Responder Phenotype in HIV+/cART Individuals With a Dominant Homozygous Genotype
A value of 9.4% (The 95th centile observed in normal controls) was used as the “cut off” between normal and elevated results in the analysis of HIV-positive treatment-naïve and HIV+/cART participants and used to assess if high and normal CD4+Glut1+ T cell percentages are associated with allele sets attributed to AKT and SLC2A1 SNPs. Among all SLC2A1 SNPs analyzed, only rs1385129 was found to be associated with CD4+Glut1+ T cell percentage in HIV-positive individuals on cART. Those with the GG allele were more likely to have high CD4+Glut1+ T cell percentage than those with the GA/AA allele sets (P = 0.038) (Table 3).
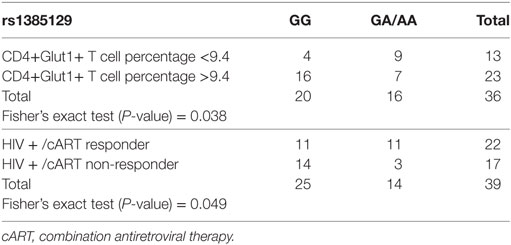
Table 3. Fisher’s exact testing of rs1385129 SLC2A1 single nucleotide polymorphism allele distribution against high and normal HIV+/cART CD4+Glut1+ T cell percentage groups, and responder and non-responder groups.
The association between SLC2A1 rs1385129 and favorable treatment response phenotypes in HIV+/cART individuals was confirmed using Fisher’s exact testing. Immunological non-response was more commonly seen in those with the GG genotype than in those with GA and AA allele sets (P = 0.049) (Table 3). We found no associations between percentage of CD4+Glut1+ T cells and clinical variables including age, BMI, time on cART, CD4+ T cell percentage, and CD4/CD8 ratio in HIV+/cART individuals.
SLC2A1 rs1385129 was analyzed among participants from Australia and America in HIV+/cART individuals using Fisher’s exact testing. Specific rs1385129 genotypes were not more common in those from either country (P = 0.21) (Table 4). However, unfavorable treatment response was associated with participants from the USA independently of CD4+Glut1+ T cell percentages (P = 0.024) (Table 4). No significant results were found when analyzing other SNP genotypes among either HIV-positive group (P > 0.05).
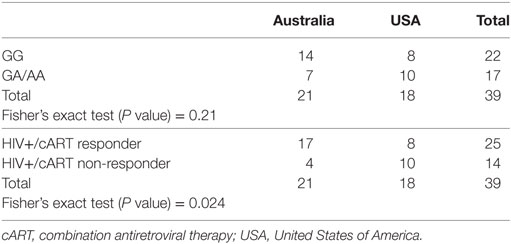
Table 4. Fisher’s exact testing of country of origin against genotypes associated with the rs1385129 SLC2A1 single nucleotide polymorphism and responder and non-responder HIV+/cART groups.
Elevated CD4+Glut1+ T cell Percentage Is Associated With Non-Favorable Disease Progression Among Those With AKT And SLC2A1 SNP Genotypes That Maintain Hardy–Weinberg Equilibrium
We assessed CD4+Glut1+ T cell percentage between favorable and non-favorable HIV-positive individuals with specific genotypes, employing Hardy–Weinberg equilibrium to ensure that allele frequencies remain constant. The GG genotype of SLC2A1 SNP rs1385129 was associated with a higher CD4+Glut1+ T cell percentage among non-favorable progressors (median: 43.4%; IQR = 11.0) compared with favorable progressors among HIV-positive treatment-naïve individuals (median: 16.0%; IQR = 11.7; P = 0.0082) (Hardy–Weinberg equilibrium = 0.47; P = 0.49) (Table S2 in Supplementary Material; Figure S2A in Supplementary Material). The dominant homozygous rs710218 SNP population (AA) had a higher CD4+Glut1+ T cell percentage (median: 46.5%; IQR = 1.9) in non-favorable progressors compared with favorable progressors (median: 15.8%; IQR = 18.2; P = 0.024) (Hardy–Weinberg equilibrium = 0.85; P = 0.36) (Table S2 in Supplementary Material; Figure S2B in Supplementary Material). Therefore, these results suggest that higher CD4+Glut1+ T cell percentage is associated with non-favorable disease progression and poor response to therapy in HIV-positive people.
The GG genotype of AKT SNP rs1130214 was associated with a higher CD4+Glut1+ T cell percentage of 39.7% among non-responders (IQR = 28.7) when compared with 9.5% for responders among HIV+/cART individuals (IQR = 5.5; P = 0.011) (Hardy–Weinberg equilibrium = 0.27; P = 0.60) (Table S2 in Supplementary Material).
Discussion
This study investigated the associations between the frequency of circulating CD4+Glut1+ T cells, HIV disease progression in untreated and cART-treated individuals, and SNPs associated with Glut1 expression and regulation. The SNPs we studied include five of the AKT gene, two of the SLC2A1 gene, and one belonging to SLC2A1-AS1. Our analysis shows that CD4+Glut1+ T cell percentage was significantly elevated in HIV-positive treatment-naïve individuals who experienced rapid CD4+ T cell loss and in those who experienced poor CD4+ T cell recovery on cART. Among HIV+/cART individuals, high CD4+Glut1+ T cell percentages were observed in those with the dominant homozygous genotype associated with SLC2A1 SNP rs1385129, SLC2A1-AS1 SNP rs710218 and those who were heterozygous (GT) for AKT rs1130214. Although genotypes associated with rs710218 and rs1130214 were associated with Glut1 expression, they did not achieve a significant relationship with clinical outcomes, perhaps due to our modest sample size.
Elevated CD4+Glut1+ T cell percentage was previously reported among HIV-positive people when compared to HIV-negative controls regardless of treatment status (1). We show that CD4+Glut1+ T cell percentage is associated with rapid CD4+ T cell decline during untreated HIV infection, and in patients with poor CD4+ T cell recovery despite sustained viral suppression on cART. Glycolysis and oxidative phosphorylation are the primary pathways used by T cells to fulfill their energy requirements when activated (59–61). We found that Glut1, a marker of glycolytic activation, is elevated on CD4+ T cells that exhibit an exhausted and senescent phenotype. Thus, these observations support the model that elevated glycolysis facilitates metabolic exhaustion that drives CD4+ T cell loss (5, 6). Indeed, Glut1 expression on CD4+ T cells is associated with increased metabolic activity, including upregulated glucose influx, increased ROS production, and cell stress (1, 59–62).
High T cell exhaustion measured by PD-1 surface expression, and immune activation measured by the percentage of CD4+ and CD8+ T cells co-expressing the activation markers CD38 and HLA-DR have been shown in HIV+ individuals with suboptimal CD4+ T cell recovery on ART (63). Here, we demonstrate that elevated glucose metabolic activity in CD4+ T cells is observed in exhausted and senescent CD4+ T cells from cART-treated and virologically suppressed HIV+ subjects. While the mechanistic relationship between metabolism and T cell exhaustion is under-researched, it has been shown that elevated glycolytic metabolism is a common feature in senescent fibroblasts (64).
Despite prevailing knowledge that central memory CD4+ T cells constitute the major reservoir (65), other subsets like naïve T cells have been shown to harbor considerable HIV reservoirs and indeed may be major virion sources following treatment interruption (66). Naïve T cells have historically been described as immunologically resting (67), but we have recently shown that these cells are in fact metabolically active (68). The role of Glut1 in reservoir maintenance is unexplored; however, Glut1 is shown to be a facilitator of HIV infection (15, 69), with a marginal increase in total HIV DNA in CD4+Glut1+ T cells compared to CD4+Glut1− T cells in HIV+ individuals (15). Nevertheless, it appears that Glut1 expression on the majority of CD4+ T cells may be due to inflammatory signals like IL-7, known to regulate Glut1 trafficking to the cell surface of T cells (59, 70). The hypothesis that SNPs within metabolic genes influences HIV reservoir size is untested.
Our results highlight a potential link between genetic polymorphisms within genes that control glucose metabolism in CD4+ T cells. Indeed, cancerous T cells over express Glut1 to meet their requirements for glucose and drive glycolytic metabolism (39). In the context of cancer cells, this increased glycolytic metabolism is essential for biomass production and cell growth. This metabolic state is similar in activated T cells, but in the context of HIV infection, persistent activation of glycolysis in CD4+ T cells occurs at the expense of ATP production by oxidative phosphorylation. This might partly explain why HIV-positive subjects have elevated CD4+Glut1+ T cell percentage, and why we found a strong relationship between the SLC2A1 rs1385129 GG genotype and poor CD4+ T cell recovery in cART-treated patients.
Bioinformatic analysis revealed that elevated CD4+Glut1+ T cell percentage was associated with SNPs (rs1385129, rs710218, rs1130214) that do not alter the amino acid sequence (Figure 4). When analyzing SLC2A1 SNP rs1385129 and SLC2A1-AS1 SNP rs710218, the dominant homozygous genotype was associated with elevated CD4+Glut1+ T cell percentage in HIV+/cART individuals. These SNPs have been studied in breast cancer cells through the measurement of fluorescently tagged glucose molecules 18F-FDG; however, there was no association between glucose uptake and these genotypes (45). However, the rs710218 SLC2A1-AS1 SNP has recently been shown to be associated with increased Glut1 expression in colorectal cancer tissue when at least one copy of the T allele was present in comparison to those with homozygous AA genotypes among individuals with colorectal cancer (71). These results do not correspond with our own, as we found non-favorable progression among the HIV-positive treatment-naive and elevated CD4+Glut1+ T cell percentage in HIV+/cART individuals to be associated with the rs710218 dominant A allele (71). Furthermore, other studies have shown that this SNP does not influence 18F-FDG uptake in breast cancer (72), suggesting that regulation of Glut1 expression by SNPs may be cell and context specific.
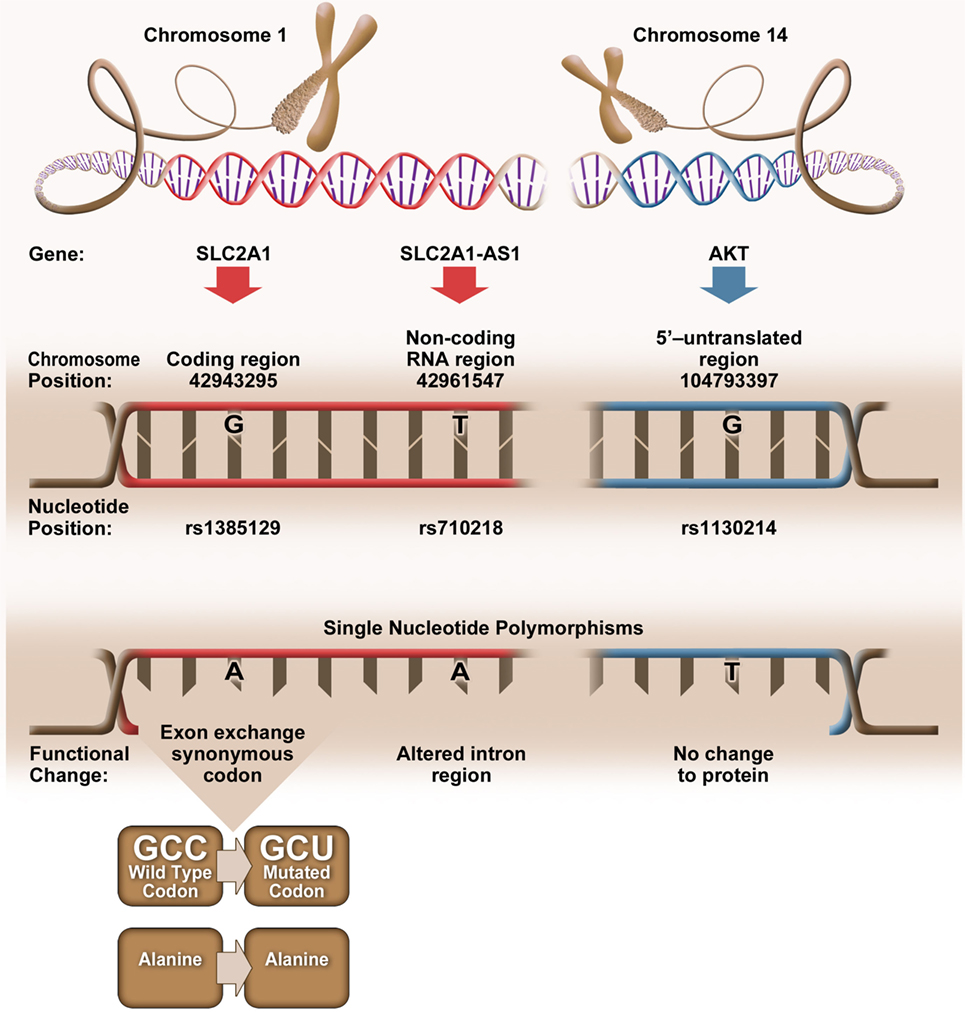
Figure 4. Genetic positioning and functional changes associated with SLC2A1 single nucleotide polymorphism (SNP) rs1385129 (73), SLC2A1-AS1 SNP rs710218 (74), and AKT SNP rs1130214 (75).
The rs1385129 SLC2A1 SNP is a synonymous mutation, resulting in no change in the amino acid sequence of the expressed protein. We are unable to fully explain the relationship between Glut1 expression and this SNP, since we did not evaluate SLC2A1 mRNA or total Glut1 levels in CD4+ T cells from our subjects. However, silent mutations have been shown to affect gene expression by influencing the binding of DNA regulatory factors, the structure and stability of mRNA, ribosome trafficking and its interactions with mRNA, and specific ligands that influence RNA and protein expression (76). The mechanism underlying the associations between the synonymous mutations, Glut1 expression, and the immunological outcomes in HIV+ subjects warrants further investigation.
Elevated CD4+Glut1+ T cell percentage was associated with AKT SNP 1130214, suggesting that variation within the 5’ untranslated region of the AKT gene affects Glut1 expression despite no change to the amino acid sequence (Figure 4). The Nef HIV protein binds and promotes the phosphorylation of the AKT protein in CD3+ T cells (77), with resulting hyperphosphorylation of AKT occurring with the activation of HIV-1 expression in CD4+ T cells and coinciding with the proliferation of T cells (78, 79). With HIV infection linked to upregulation of both AKT and Glut1 expression in CD4+ T cells (80), we can assume that Glut1 expression and trafficking to the cell surface is regulated upstream by AKT, a phenotype shared by cells belonging to the lymphoid cell line (81). Therefore, the frequency of circulating CD4+Glut1+ T cells, and inherited SNPs within the AKT encoding gene could be explored to identify HIV-positive untreated individuals prone to unfavorable disease progression or poor T cell recovery in cART-treated persons.
We report that non-favorable HIV disease outcomes is associated with increased frequency of circulating CD4+Glut1+ T cells linked to rapid CD4+ T cell depletion and poor recovery in untreated and treated HIV-positive persons. Among HIV+/cART populations, the homozygous dominant genotypes associated with SLC2A1 SNP rs1385129 and SLC2A1-AS1 SNP rs710218 were associated with elevated Glut1 expression, while the rs1385129 SNP GG genotype was linked with both high CD4+Glut1+ T cell percentage and non-favorable response to therapy.
Our modest sample size constitutes a limitation of this work and could be strengthened by analysis of multiple time points prior to and during cART treatment. Notwithstanding, we demonstrate that genes, which regulate glucose metabolism in T cells may influence immunological and clinical outcomes in HIV infection and support further analysis of other genes implicated in glucose metabolism in T cells such as mTOR, PI3Kinase, and HIF1. As we found that unfavorable treatment response was associated with those from the USA when compared to Australia, we conclude that differences in treatment regimens or health care between these nations warrants further investigation on their effects on immune recovery. Furthermore, the different ethnic make ups of this cohort may have influenced the distribution of SNPs analyzed, which could be explored with a larger cohort focused on specific racial backgrounds. Our results support the impact of metabolic genes in influencing immune cell biology and the course of HIV disease. Furthermore, immunometabolic SNPs could potentially be exploited to predict response to metabolic-based immunotherapy.
Ethics Statement
This study was carried out in accordance with the recommendations of ethics committees at the participating institutions, with written informed consent from all subjects. All subjects gave written informed consent in accordance with the Declaration of Helsinki. The protocol was approved by the Alfred institutional board.
Author Contributions
CP conceived the project, designed, conducted experiments, analysed, interpreted data and wrote the manuscript. IS-O provided samples, provided critical suggestions and reviewed the manuscript. JJRM analysed, interpreted data, wrote the manuscript and replied to reviewers comments. JJRM and TH performed bioinformatic analysis. CC analysed and interpreted data. NM, RP, BB, TH, JM and SC interpreted data, made critical intellectual suggestions, reviewed, edited and approved the manuscript, and assisted in replying to reviewers comments. JM and AL designed experiments, interpreted data and approved the manuscript.
Conflict of Interest Statement
The authors declare that the research was conducted in the absence of any commercial or financial relationships that could be construed as a potential conflict of interest.
Acknowledgments
We acknowledge the assistance of Geza Paukovic and Eva Orlowski-Oliver from the AMREP Flow Cytometry Core Facility for flow cytometry training and technical advice. We are grateful to Dr Darren Lockie who provided a donation to support this research. We also acknowledge Keryn L. Masson for her graphic design assistance.
Funding
This research was supported by the Australian Center for HIV and Hepatitis Virology Research (ACH2) and a 2010 developmental grant (CNIHR) from the University of Washington Center for AIDS Research (CFAR), an NIH funded program under award number AI027757, which is supported by the following NIH Institutes and Centers (NIAID, NCI, NIMH, NIDA, NICHD, NHLBI, NIA). CP is a recipient of the CNIHR and ACH2 grant. The authors gratefully acknowledge the contribution to this work of the Victorian Operational Infrastructure Support Program received by the Burnet Institute.
Supplementary Material
The Supplementary Material for this article can be found online at https://www.frontiersin.org/articles/10.3389/fimmu.2018.00900/full#supplementary-material.
Figure S1. Gaiting strategy used to analyse CD4+ T cell populations phenotypically distinct by their CD57 and CD28 surface expression (A,B). Glut1 MFI expression in CD4+ T cells with naïve (CD57–CD28+), activated (CD57+CD28+) and senescent phenotypes (CD57+CD28–) (C). Gaiting strategy used to analyse CD4+PD1– and CD4+PD1+ T cell populations (D). Glut1 MFI expression in CD4+ T cells with normal (CD4+PD1–) and exhausted (CD4+PD1+) phenotypes (E).
Figure S2. Genotypes and the distribution of favorable and non-favorable CD4+Glut1+ T cell percentages in HIV-positive individuals with SLC2A1 SNP rs1385129 (A), and SLC2A1-AS1 SNP rs710218 (B). SNP = Single nucleotide polymorphism.
References
1. Palmer CS, Ostrowski M, Gouillou M, Tsai L, Yu D, Zhou J, et al. Increased glucose metabolic activity is associated with CD4+ T-cell activation and depletion during chronic HIV infection. AIDS (2014) 28:297–309. doi:10.1097/QAD.0000000000000128
2. Dagenais-Lussier X, Mouna A, Routy JP, Tremblay C, Sekaly RP, El-Far M, et al. Current topics in HIV-1 pathogenesis: the emergence of deregulated immuno-metabolism in HIV-infected subjects. Cytokine Growth Factor Rev (2015) 26:603–13. doi:10.1016/j.cytogfr.2015.09.001
3. Matheson NJ, Greenwood EJ, Lehner PJ. Manipulation of immunometabolism by HIV-accessories to the crime? Curr Opin Virol (2016) 19:65–70. doi:10.1016/j.coviro.2016.06.014
4. Willig AL, Overton ET. Metabolic complications and glucose metabolism in HIV infection: a review of the evidence. Curr HIV/AIDS Rep (2016) 13:289–96. doi:10.1007/s11904-016-0330-z
5. Palmer CS, Henstridge DC, Yu D, Singh A, Balderson B, Duette G, et al. Emerging role and characterization of immunometabolism: relevance to HIV pathogenesis, serious non-AIDS events, and a cure. J Immunol (2016) 196:4437–44. doi:10.4049/jimmunol.1600120
6. Palmer CS, Cherry CL, Sada-Ovalle I, Singh A, Crowe SM. Glucose metabolism in T cells and monocytes: new perspectives in HIV pathogenesis. EBioMedicine (2016) 6:31–41. doi:10.1016/j.ebiom.2016.02.012
7. Lapadula G, Cozzi-Lepri A, Marchetti G, Antinori A, Chiodera A, Nicastri E, et al. Risk of clinical progression among patients with immunological nonresponse despite virological suppression after combination antiretroviral treatment. AIDS (2013) 27:769–79. doi:10.1097/QAD.0b013e32835cb747
8. Gurdasani D, Iles L, Dillon DG, Young EH, Olson AD, Naranbhai V, et al. A systematic review of definitions of extreme phenotypes of HIV control and progression. AIDS (2014) 28:149–62. doi:10.1097/QAD.0000000000000049
9. Rajasuriar R, Gouillou M, Spelman T, Read T, Hoy J, Law M, et al. Clinical predictors of immune reconstitution following combination antiretroviral therapy in patients from the Australian HIV observational database. PLoS One (2011) 6:e20713. doi:10.1371/journal.pone.0020713
10. Chow WZ, Lim SH, Ong LY, Yong YK, Takebe Y, Kamarulzaman A, et al. Impact of HIV-1 subtype on the time to CD4+ T-cell recovery in combination antiretroviral therapy (cART)-experienced patients. PLoS One (2015) 10:e0137281. doi:10.1371/journal.pone.0137281
11. Jarrin I, Pantazis N, Dalmau J, Phillips AN, Olson A, Mussini C, et al. Does rapid HIV disease progression prior to combination antiretroviral therapy hinder optimal CD4+ T-cell recovery once HIV-1 suppression is achieved? AIDS (2015) 29:2323–33. doi:10.1097/QAD.0000000000000805
12. Ngayo MO, Okalebo FA, Bulimo WD, Mwachari C, Guantai AN, Oluka M. Impact of first line antiretroviral therapy on clinical outcomes among HIV-1 infected adults attending one of the largest HIV care and treatment program in Nairobi Kenya. J AIDS Clin Res (2016) 7:10. doi:10.4172/2155-6113.1000615
13. Macintyre AN, Gerriets VA, Nichols AG, Michalek RD, Rudolph MC, Deoliveira D, et al. The glucose transporter Glut1 is selectively essential for CD4 T cell activation and effector function. Cell Metab (2014) 20:61–72. doi:10.1016/j.cmet.2014.05.004
14. Johnson MO, Siska PJ, Contreras DC, Rathmell JC. Nutrients and the microenvironment to feed a T cell army. Semin Immunol (2016) 28:S1044–5323. doi:10.1016/j.smim.2016.09.003
15. Palmer CS, Duette GA, Wagner MCE, Henstridge DC, Saleh S, Pereira C, et al. Metabolically active CD4+ T cells expressing Glut1 and OX40 preferentially harbor HIV during in vitro infection. FEBS Lett (2017) 591:3319–32. doi:10.1002/1873-3468.12843
16. Wu JQ, Dwyer DE, Dyer WB, Yang YH, Wang B, Saksena NK. Genome-wide analysis of primary CD4+ and CD8+ T cell transcriptomes shows evidence for a network of enriched pathways associated with HIV disease. Retrovirology (2011) 8:18. doi:10.1186/1742-4690-8-18
17. Da Conceicao VN, Dyer WB, Gandhi K, Gupta P, Saksena NK. Genome-wide analysis of primary peripheral blood mononuclear cells from HIV + patients-pre-and post- HAART show immune activation and inflammation the main drivers of host gene expression. Mol Cell Ther (2014) 2:11. doi:10.1186/2052-8426-2-11
18. Saina MC, Bi X, Lihana R, Lwembe R, Ishizaki A, Panikulam A, et al. Comparison of HIV-1 nef and gag variations and host HLA characteristics as determinants of disease progression among HIV-1 vertically infected Kenyan children. PLoS One (2015) 10:e0137140. doi:10.1371/journal.pone.0137140
19. Spadoni JL, Rucart P, Le Clerc S, van Manen D, Coulonges C, Ulveling D, et al. Identification of genes whose expression profile is associated with non-progression towards AIDS using eQTLs. PLoS One (2015) 10:e0136989. doi:10.1371/journal.pone.0136989
20. Devadas K, Biswas S, Haleyurgirisetty M, Wood O, Ragupathy V, Lee S, et al. Analysis of host gene expression profile in HIV-1 and HIV-2 infected T-cells. PLoS One (2016) 11:e0147421. doi:10.1371/journal.pone.0147421
21. Egaña-Gorroño L, Guardo AC, Bargalló ME, Planet E, Vilaplana E, Escribà T, et al. MicroRNA profile in CD8+ T-lymphocytes from HIV-infected individuals: relationship with antiviral immune response and disease progression. PLoS One (2016) 11:e0155245. doi:10.1371/journal.pone.0155245
22. Nunnari G, Fagone P, Condorelli F, Nicoletti F, Malaguarnera L, Di Rosa M. CD4+ T-cell gene expression of healthy donors, HIV-1 and elite controllers: immunological chaos. Cytokine (2016) 83:127–35. doi:10.1016/j.cyto.2016.04.007
23. Buck MD, Sowell RT, Kaech SM, Pearce EL. Metabolic instruction of immunity. Cell (2017) 169:570–86. doi:10.1016/j.cell.2017.04.004
24. Kaslow RA, Carrington M, Apple R, Park L, Muñoz A, Saah AJ, et al. Influence of combinations of human major histocompatibility complex genes on the course of HIV-1 infection. Nat Med (1996) 2:405–11. doi:10.1038/nm0496-405
25. Migueles SA, Sabbaghian MS, Shupert WL, Bettinotti MP, Marincola FM, Martino L, et al. HLA B*5701 is highly associated with restriction of virus replication in a subgroup of HIV-infected long term nonprogressors. Proc Natl Acad Sci U S A (2000) 97:2709–14. doi:10.1073/pnas.050567397
26. Horton H, Frank I, Baydo R, Jalbert E, Penn J, Wilson S, et al. Preservation of T cell proliferation restricted by protective HLA alleles is critical for immune control of HIV-1 infection. J Immunol (2006) 177:7406–15. doi:10.4049/jimmunol.177.10.7406
27. Fellay J, Shianna KV, Ge D, Colombo S, Ledergerber B, Weale M, et al. A whole-genome association study of major determinants for host control of HIV-1. Science (2007) 317:944–7. doi:10.1126/science.1143767
28. Elahi S, Dinges WL, Lejarcegui N, Laing KJ, Collier AC, Koelle DM, et al. Protective HIV-specific CD8+ T cells evade Treg cell suppression. Nat Med (2011) 17:989–95. doi:10.1038/nm.2422
29. International HIV Controllers Study, Pereyra F, Jia X, McLaren PJ, Telenti A, de Bakker PI, et al. The major genetic determinants of HIV-1 control affect HLA class I peptide presentation. Science (2010) 330:1551–7. doi:10.1126/science.1195271
30. Kosmrlj A, Read EL, Qi Y, Allen TM, Altfeld M, Deeks SG, et al. Effects of thymic selection of the T-cell repertoire on HLA class I-associated control of HIV infection. Nature (2010) 465:350–4. doi:10.1038/nature08997
31. Canouï E, Lécuroux C, Avettand-Fenoël V, Gousset M, Rouzioux C, Saez-Cirion A, et al. A subset of extreme human immunodeficiency virus (HIV) controllers is characterized by a small HIV blood reservoir and a weak T-cell activation level. Open Forum Infect Dis (2017) 4:ofx064. doi:10.1093/ofid/ofx064
32. Gerriets VA, Rathmell JC. Metabolic pathways in T cell fate and function. Trends Immunol (2012) 33:168–73. doi:10.1016/j.it.2012.01.010
33. Besnard E, Hakre S, Kampmann M, Lim HW, Hosmane NN, Martin A, et al. The mTOR complex controls HIV latency. Cell Host Microbe (2016) 20:785–97. doi:10.1016/j.chom.2016.11.001
34. Kumar B, Arora S, Ahmed S, Banerjea AC. Hyperactivation of mammalian target of rapamycin complex 1 by HIV-1 is necessary for virion production and latent viral reactivation. FASEB J (2017) 31:180–91. doi:10.1096/fj.201600813R
35. Bressanin D, Evangelisti C, Ricci F, Tabellini G, Chiarini F, Tazzari PL, et al. Harnessing the PI3K/Akt/mTOR pathway in T-cell acute lymphoblastic leukemia: eliminating activity by targeting at different levels. Oncotarget (2012) 3:811–23. doi:10.18632/oncotarget.579
36. Silva A, Girio A, Cebola I, Santos CI, Antunes F, Barata JT. Intracellular reactive oxygen species are essential for PI3K/Akt/mTOR-dependant IL-7-mediated viability of T-cell acute lymphoblastic leukemia cells. Leukemia (2011) 25(6):960–7. doi:10.1038/leu.2011.56
37. Buentke E, Nordström A, Lin H, Björklund AC, Laane E, Harada M, et al. Glucocorticoid-induced cell death is mediated through reduced glucose metabolism in lymphoid leukemia cells. Blood Cancer J (2011) 1:e31. doi:10.1038/bcj.2011.27
38. Song K, Li M, Xu XJ, Xuan L, Huang GN, Song XL, et al. HIF-1α and GLUT1 gene expression is associated with chemoresistance of acutemyeloid leukemia. Asian Pac J Cancer Prev (2014) 15:1823–9. doi:10.7314/APJCP.2014.15.4.1823
39. Moreno C. Chronic lymphocytic leukemia and the Warburg effect. Blood (2015) 125:3368–9. doi:10.1182/blood-2015-04-636332
40. Basu S, Hubbard B, Shevach EM. Foxp3-mediated inhibition of Akt inhibits Glut1 (glucose transporter 1) expression in human T regulatory cells. J Leukoc Biol (2015) 97:279–83. doi:10.1189/jlb.2AB0514-273RR
41. Kim MJ, Kang HG, Lee SY, Jeon HS, Lee WK, Park JY, et al. AKT1 polymorphisms and survival of early stage non-small cell lung cancer. J Surg Oncol (2012) 105:167–74. doi:10.1002/jso.22071
42. Piao Y, Li Y, Xu Q, Liu JW, Xing CZ, Xie XD, et al. Association of MTOR and AKT gene polymorphisms with susceptibility and survival of gastric cancer. PLoS One (2015) 10:e0136447. doi:10.1371/journal.pone.0136447
43. Wang Y, Lin L, Xu H, Li T, Zhou Y, Dan H, et al. Genetic variants in AKT1 gene were associated with risk and survival of OSCC in Chinese Han population. J Oral Pathol Med (2015) 44:45–50.44. doi:10.1111/jop.12211
44. Devaney JM, Gordish-Dressman H, Harmon BT, Bradbury MK, Devaney SA, Harris TB, et al. AKT1 polymorphisms are associated with risk for metabolic syndrome. Hum Genet (2011) 129:129–39. doi:10.1007/s00439-010-0910-8
45. Grabellus F, Sheu SY, Bachmann HS, Lehmann N, Otterbach F, Heusner TA, et al. The XbaI G>T polymorphism of the glucose transporter 1 gene modulates 18F-FDG uptake and tumor aggressiveness in breast cancer. J Nucl Med (2010) 51:1191–7. doi:10.2967/jnumed.110.075721
46. Ng DP, Canani L, Araki S, Smiles A, Moczulski D, Warram JH, et al. Minor effect of GLUT1 polymorphisms on susceptibility to diabetic nephropathy in type 1 diabetes. Diabetes (2002) 51:2264–9. doi:10.2337/diabetes.51.7.2264
47. Palmer C, Hampartzoumian T, Lloyd A, Zekry A. A novel role for adiponectin in regulating the immune responses in chronic hepatitis C virus infection. Hepatology (2008) 48:374–84. doi:10.1002/hep.22387
48. Oeth P, Beaulieu M, Park C, Kosman D, del Mistro G, van den Boom D, et al. iPLEX™ assay: Increased plexing efficiency and flexibility for MassARRAY system through single base primer extension with mass-modified terminators. (2005). Sequenom application note Available from: https://www.researchgate.net/publication/290120569_iPLEX_Assay_Increased_Plexing_Efficiency_and_Flexibility_for_MassARRAY_System_Through_Single_Base_Primer_Extension_with_Mass-Modified_Terminators.
49. Muñoz A, Wang MC, Bass S, Taylor JM, Kingsley LA, Chmiel JS, et al. Acquired immunodeficiency syndrome (AIDS)-free time after human immunodeficiency virus type 1 (HIV-1) seroconversion in homosexual men. Multicenter AIDS Cohort Study Group. Am J Epidemiol (1989) 130:530–9. doi:10.1093/oxfordjournals.aje.a115367
50. Phair J, Jacobson L, Detels R, Rinaldo C, Saah A, Schrager L, et al. Acquired immune deficiency syndrome occurring within 5 years of infection with human immunodeficiency virus type-1: the Multicenter AIDS Cohort Study. J Acquir Immune Defic Syndr (1992) 5:490–6. doi:10.1097/00126334-199205000-00010
51. Gaardbo JC, Hans J, Hartling HJ, Thorsteinsson K, Madsen HO, Springborg K, et al. Different immunological phenotypes associated with preserved CD4+ T cell counts in HIV-infected controllers and viremic long term non-progressors. PLoS One (2013) 8:e63744. doi:10.1371/journal.pone.0063744
52. The Natural History Project Working Group for the Collaboration of Observational HIV Epidemiological Research Europe (COHERE) in EuroCoord. Factors associated with short-term changes in HIV viral load and CD4+ cell count in antiretroviral-naive individuals. AIDS (2014) 28:1351–6. doi:10.1097/QAD.0000000000000224
53. Lin YT, Yen CH, Chen HL, Liao YJ, Lin IF, Chen M, et al. The serologic decoy receptor 3 (DcR3) levels are associated with slower disease progression in HIV-1/AIDS patients. J Formos Med Assoc (2015) 114:498–503. doi:10.1016/j.jfma.2013.01.007
54. Chaiyasin N, Sungkanuparph S. Rate of CD4 decline and factors associated with rapid CD4 decline in asymptomatic HIV-infected patients. J Int Assoc Provid AIDS Care (2016) 15:3–6. doi:10.1177/2325957415616493
55. Demers KR, Makedonas G, Buggert M, Eller MA, Ratcliffe SJ, Goonetilleke N, et al. Temporal dynamics of CD8+ T cell effector responses during primary HIV infection. PLoS Pathog (2016) 12:e1005805. doi:10.1371/journal.ppat.1005805
56. Zuazo M, Gato-Cañas M, Llorente N, Ibañez-Vea M, Arasanz H, Kochan G, et al. Molecular mechanisms of programmed cell death-1 dependent T cell suppression: relevance for immunotherapy. Ann Transl Med (2017) 5:385. doi:10.21037/atm.2017.06.11
57. Focosi D, Bestagno M, Burrone O, Petrini M. CD57+ T lymphocytes and functional immune deficiency. J Leukoc Biol (2010) 87:107–16. doi:10.1189/jlb.0809566
58. Ensembl. rs841853 variant display page [Online]. Cambridge, United Kingdom: European Molecular Biology Laboratory’s European Bioinformatics Institute (EMBI-EBI) (2017). Available from: http://grch37.ensembl.org/Homo_sapiens/Variation/HighLD?db=core;r=1:43400938-43401938;v=rs841853;vdb=variation;vf=591873;second_variant_name=rs710218#373514_tablePanel.(Accessed: December 16, 2017).
59. Frauwirth KA, Riley JL, Harris MH, Parry RV, Rathmell JC, Plas DR, et al. The CD28 signaling pathway regulates glucose metabolism. Immunity (2002) 16:769–77. doi:10.1016/S1074-7613(02)00323-0
60. Jacobs SR, Herman CE, MacIver NJ, Wofford JA, Wieman HL, Hammen JJ, et al. Glucose uptake is limiting in T cell activation and requires CD28-mediated Akt-dependent and independent pathways. J Immunol (2008) 180:4476–86. doi:10.4049/jimmunol.180.7.4476
61. Wofford JA, Wieman HL, Jacobs SR, Zhao Y, Rathmell JC. IL-7 promotes Glut1 trafficking and glucose uptake via STAT5-mediated activation of Akt to support T-cell survival. Blood (2008) 111:2101–11. doi:10.1182/blood-2007-06-096297
62. Masiá M, Padilla S, Fernández M, Rodríguez C, Moreno A, Oteo JA, et al. Oxidative stress predicts all-cause mortality in HIV-infected patients. PLoS One (2016) 11:e0153456. doi:10.1371/journal.pone.0153456
63. Nakanjako D, Ssewanyana I, Mayanja-Kizza H, Kiragga A, Colebunders R, Manabe YC, et al. High T-cell immune activation and immune exhaustion among individuals with suboptimal CD4 recovery after 4 years of antiretroviral therapy in an African cohort. BMC Infect Dis (2011) 11:43. doi:10.1186/1471-2334-11-43
64. Wang D, Liu Y, Zhang R, Zhang F, Sui W, Chen L, et al. Apoptotic transition of senescent cells accompanied with mitochondrial hyper-function. Oncotarget (2016) 7:28286–300. doi:10.18632/oncotarget.8536
65. Chomont N, El-Far M, Ancuta P, Trautmann L, Procopio FA, Yassine-Diab B, et al. HIV reservoir size and persistence are driven by T cell survival and homeostatic proliferation. Nat Med (2009) 15:893–900. doi:10.1038/nm.1972
66. Zerbato JM, Serrao E, Lenzi G, Kim B, Ambrose Z, Watkins SC, et al. Establishment and reversal of HIV-1 latency in naive and central memory CD4+ T cells in vitro. J Virol (2016) 90:8059–73. doi:10.1128/JVI.00553-16
67. Almeida L, Lochner M, Berod L, Sparwasser T. Metabolic pathways in T cell activation and lineage differentiation. Semin Immunol (2016) 28:514–24. doi:10.1016/j.smim.2016.10.009
68. Masson JJR, Murphy AJ, Lee MKS, Ostrowski M, Crowe SM, Palmer C. Assessment of metabolic and mitochondrial dynamics in CD4+ and CD8+ T cells in virologically suppressed HIV-positive individuals on combination antiretroviral therapy. PLoS One (2017) 12:e0183931. doi:10.1371/journal.pone.0183931
69. Loisel-Meyer S, Swainson L, Craveiro M, Oburoglu L, Mongellaz C, Costa C, et al. Glut1-mediated glucose transport regulates HIV infection. Proc Natl Acad Sci U S A (2012) 109:2549–54. doi:10.1073/pnas.1121427109
70. Venet F, Demaret J, Blaise BJ, Rouget C, Girardot T, Idealisoa E, et al. IL-7 restores T lymphocyte immunometabolic failure in septic shock patients through mTOR activation. J Immunol (2017) 199:1606–15. doi:10.4049/jimmunol.1700127
71. Feng W, Cui G, Tang CW, Zhang XL, Dai C, Xu YQ, et al. Role of glucose metabolism related gene GLUT1 in the occurrence and prognosis of colorectal cancer. Oncotarget (2017) 8:56850–7. doi:10.18632/oncotarget.18090
72. Bravatà V, Stefano A, Cammarata FP, Minafra L, Russo G, Nicolosi S, et al. Genotyping analysis and 18FDG uptake in breast cancer patients: a preliminary research. J Exp Clin Cancer Res (2013) 32:23. doi:10.1186/1756-9966-32-23
73. NCBI. rs1385129 variant display page [Online]. Rockville Pike Bethesda, USA: National Center for Biotechnology Information: National Library of Medicine (2017). Available from: https://www.ncbi.nlm.nih.gov/projects/SNP/snp_ref.cgi?rs=1385129 (Accessed: September 18, 2017).
74. NCBI. rs710218 variant display page [Online]. Rockville Pike Bethesda, USA: National Center for Biotechnology Information: National Library of Medicine (2017). Available from: https://www.ncbi.nlm.nih.gov/projects/SNP/snp_ref.cgi?rs=710218 (Accessed: September 18, 2017).
75. NCBI. rs1130214 variant display page [Online]. Rockville Pike Bethesda, USA: National Center for Biotechnology Information: National Library of Medicine (2017). Available from: https://www.ncbi.nlm.nih.gov/projects/SNP/snp_ref.cgi?rs=1130214 (Accessed: September 18, 2017).
76. Fåhraeus R, Marin M, Olivares-Illana V. Whisper mutations: cryptic messages within the genetic code. Oncogene (2016) 35:3753–9. doi:10.1038/onc.2015.454
77. Len ACL, Starling S, Shivkumar M, Jolly C. HIV-1 activates T cell signaling independently of antigen to drive viral spread. Cell Rep (2017) 18:1062–74. doi:10.1016/j.celrep.2016.12.057
78. Kumar A, Abbas A, Colin L, Khan KA, Bouchat S, Varin A, et al. Tuning of AKT-pathway by Nef and its blockade by protease inhibitors results in limited recovery in latently HIV infected T-cell line. Sci Rep (2016) 6:24090. doi:10.1038/srep24090
79. Doyon G, Zerbato J, Mellors JW, Sluis-Cremer N. Disulfiram reactivates latent HIV-1 expression through depletion of the phosphatase and tensin homolog. AIDS (2013) 27:F7–11. doi:10.1097/QAD.0b013e3283570620
80. Palmer CS, Hussain T, Duette G, Weller TJ, Ostrowski M, Sada-Ovalle I, et al. Regulators of glucose metabolism in CD4+ and CD8+ T cells. Int Rev Immunol (2016) 35:477–88. doi:10.3109/08830185.2015.1082178
Keywords: HIV, CD4+ T cells, immune reconstitution, immunometabolism, Glut1, AKT, SLC2A1, immune activation
Citation: Masson JJR, Cherry CL, Murphy NM, Sada-Ovalle I, Hussain T, Palchaudhuri R, Martinson J, Landay AL, Billah B, Crowe SM and Palmer CS (2018) Polymorphism rs1385129 Within Glut1 Gene SLC2A1 Is Linked to Poor CD4+ T Cell Recovery in Antiretroviral-Treated HIV+ Individuals. Front. Immunol. 9:900. doi: 10.3389/fimmu.2018.00900
Received: 25 January 2018; Accepted: 11 April 2018;
Published: 17 May 2018
Edited by:
Aurelio Cafaro, Istituto Superiore di Sanità, ItalyReviewed by:
Sergio Iván Valdés-Ferrer, Instituto Nacional de Ciencias Médicas y Nutrición Salvador Zubirán, MexicoNilu Goonetilleke, University of North Carolina at Chapel Hill, United States
Copyright: © 2018 Masson, Cherry, Murphy, Sada-Ovalle, Hussain, Palchaudhuri, Martinson, Landay, Billah, Crowe and Palmer. This is an open-access article distributed under the terms of the Creative Commons Attribution License (CC BY). The use, distribution or reproduction in other forums is permitted, provided the original author(s) and the copyright owner are credited and that the original publication in this journal is cited, in accordance with accepted academic practice. No use, distribution or reproduction is permitted which does not comply with these terms.
*Correspondence: Clovis S. Palmer, clovis.palmer@burnet.edu.au