HapTip: Displaying Haptic Shear Forces at the Fingertips for Multi-Finger Interaction in Virtual Environments
 Adrien Girard1*
 Maud Marchal1,2*
 Florian Gosselin3
 Anthony Chabrier3
 François Louveau4
  Anatole Lécuyer1*
- 1Inria Rennes – Bretagne Atlantique, Rennes, France
- 2INSA Rennes, Rennes, France
- 3CEA, LIST, Gif-sur-Yvette, France
- 4Haption SA, Soulgé-Sur-Ouette, France
The fingertips are one of the most important and sensitive parts of our body. They are the first stimulated areas of the hand when we interact with our environment. Providing haptic feedback to the fingertips in virtual reality could, thus, drastically improve perception and interaction with virtual environments. In this paper, we present a modular approach called HapTip to display such haptic sensations at the level of the fingertips. This approach relies on a wearable and compact haptic device able to simulate 2 Degree of Freedom (DoF) shear forces on the fingertip with a displacement range of ±2 mm. Several modules can be added and used jointly in order to address multi-finger and/or bimanual scenarios in virtual environments. For that purpose, we introduce several haptic rendering techniques to cover different cases of 3D interaction, such as touching a rough virtual surface, or feeling the inertia or weight of a virtual object. In order to illustrate the possibilities offered by HapTip, we provide four use cases focused on touching or grasping virtual objects. To validate the efficiency of our approach, we also conducted experiments to assess the tactile perception obtained with HapTip. Our results show that participants can successfully discriminate the directions of the 2 DoF stimulation of our haptic device. We found also that participants could well perceive different weights of virtual objects simulated using two HapTip devices. We believe that HapTip could be used in numerous applications in virtual reality for which 3D manipulation and tactile sensations are often crucial, such as in virtual prototyping or virtual training.
1. Introduction
The fingertips are involved in almost all our grasping movements and are of primary importance for the manipulation of objects (Cutkosky, 1989). The fingertips are also involved in exploratory procedures, such as when perceiving roughness through lateral motions across a surface, or when following edges to recognize an object’s shape (Lynette and Susan, 2006). As the fingertips are one of the most stimulated areas of the hand during manual interactions, they naturally raise a specific interest for the design of dexterous haptic interfaces (Gonzalez et al., 2014).
During manual interactions, the fingertips are stimulated in many ways. The skin first enters in contact with objects, then vertical stress and shearing stress can be perceived. When moving in contact with objects, it is also deformed locally by the objects ridges and textures. Finally, the skin can be heated or cooled as it slowly exchanges heat with the touched objects. To reproduce these stimulations, various fingertip interfaces have already been proposed in the fields of Haptics and Virtual Reality during the past decades.
Among these stimuli, the skin stretch, which displays shear forces (tangential forces to the surface of the skin), drew our attention as it was found to greatly improve user performance during interactions with virtual environments such as for path following tasks (Kuchenbecker et al., 2004), or perception of friction (Kurita et al., 2011), or stiffness (Quek et al., 2015). Skin stretch can be produced by the weight of objects grasped in hand or by the forces applied on them (Minamizawa et al., 2007). It can also result from shear forces arising during finger-based surface exploration.
However, as will be shown in section 2.1, the current approaches for displaying skin stretch and shear forces on the fingertips often fail at being at the same time wearable, multi-finger, and able to generate a compelling two degrees-of-freedom (DoF) shear force. In addition, previous works are mostly focused on the hardware aspects, and only few studies take into consideration the software aspects, i.e., the haptic rendering of such tactile effects, and the integration of tactile cues for real-time 3D interactions in virtual environments.
To address this issue, we propose a modular approach named HapTip to display tactile cues when users are interacting with virtual environments. Our approach relies on a new miniaturized and wearable haptic device. HapTip can display 2 DoF shear forces through skin stretch at the fingertips with a range of displacement of ±2 mm. Several modules can be added and used jointly in order to address multi-finger and/or bimanual scenarios in virtual environments. Moreover, we have designed a set of tactile rendering techniques specifically adapted to different contexts of 3D interaction such as for touching a surface or lifting and manipulating an object in a virtual environment. To validate the efficiency of this approach, we have also conducted a series of experiments in order to assess the perception of our tactile feedback and some of our rendering techniques.
In the remainder of this paper, we first present related work on fingertip tactile devices and skin stretch perception. Then, the design and properties of our tactile device are described. Next, our set of tactile rendering techniques is presented along with four associated and illustrative use cases. Section 5 contains the description of our series of experiments and their results in order to asses the performance of our approach. The paper ends with a general discussion and a conclusion.
2. Related Work
2.1. Fingertip Haptic Devices
This section is focused on fingertip haptic devices that can display contact forces, i.e., normal force and/or lateral shear forces. These devices can be decomposed into three main categories corresponding to the underlying technology used: (1) motorized and articulated structures, (2) belt or wire tightening, and (3) tactor displacement. The fingertip devices providing vibratory or thermal feedback [e.g., Hafez (2007) and Horvath et al. (2014)], are excluded from this survey.
2.1.1. Articulated Structures
A first category of haptic devices displaying contact forces relies on modified robotic arms or articulated structures. The main feature of this technology is the possibility of placing and removing a local contact point directly on the fingertip. The first device of this kind was proposed by Yoshikawa and Nagura (1999). This device relies on a robotic arm that moves a finger cap in order to follow the user’s fingertip without touching it. When a contact occurs in the simulation, the finger cap enters in contact with the fingertip. Similar systems were proposed later on by Kuchenbecker et al. (2004, 2008) and Gonzalez et al. (2015). These devices can generate contact feedback anywhere on the fingertip. However, these devices are grounded systems and are limited by the working space of the robotic arm.
Other articulated structures were proposed by Cini et al. (2005), Tsetserukou et al. (2014), Leonardis et al. (2015), and Perez et al. (2015). They rely on a structure made of parallel arms, which is attached on the finger and drives the position and orientation of an end effector. With the exception of the device proposed by Cini et al. (2005), these devices are compact enough to be wearable. They can provide tactile feedback on one finger but they are too cumbersome to be used on several fingers at the same time.
2.1.2. Belt or Wire Tightening
A second technology of tactile devices relies on belts or wires to tighten the fingertips. Such devices often use a belt that can be rolled up by one or two actuators attached to the belt extremities. When one single motor is used as proposed by Inaba and Fujita (2006) only the pressure of a normal force can be displayed. With two motors as proposed by Minamizawa et al. (2010) and Prattichizzo et al. (2010), the belt can also induce a shear stress when the motors are moved in the same direction. These devices are very simple, compact, and light. They can be worn on several fingers at the same time and can provide the sensation of grasping an object. However, they require to be well fixed on the finger in order to avoid instability during shear forces display. Thus, they need to be strapped to the second phalanx that blocks the last finger’s articulation and impairs hand mobility.
A second approach of this technology consists in using three actuators that tighten wires as proposed by Chinello et al. (2012), Pacchierotti et al. (2012), Meli et al. (2014), and Scheggi et al. (2015). The wires are attached to a tiny disk placed under the fingertip. Three kinds of feedback can be provided: normal forces, lateral, and longitudinal tilts. Most of these devices are wearable but the requirement of a third actuator increases the weight and volume of the device. Moreover, similarly to the devices based on belt tightening, they constrain the movements of the last phalanx as they need to be strapped to the second phalanx.
2.1.3. Tactor Displacement
Tactile devices of this last category rely on motors that control the position of a tactor placed in contact with the fingertip. Most of these devices can perform tangential moves. The skin is stretched by the tactor, in order to simulate the shear forces. The first prototypes introduced by Drewing et al. (2005) and Vitello et al. (2006) were too cumbersome and heavy to be moved with the hand. But recent papers proposed a more compact version that can be worn (Gleeson et al., 2010b) or integrated into control devices, such as game pads (Guinan et al., 2013a), joysticks (Gwilliam et al., 2013), haptic arms, or wireless trackers (Guinan et al., 2013b).
One limitation of these devices is that no normal force can be applied on the fingertip. Only the device proposed by Quek et al. (2015) can display three DoF forces. This device can display tactile feedback to three fingers at the same time but the displayed feedbacks are interdependent that limits the possibilities of tactile rendering.
2.1.4. Analysis of Existing Fingertip Devices
As presented in Table 1, the current tactile devices able to display contact forces propose different kinds of feedback and rely on different technologies. But they are all facing the same miniaturization issues. Very few of them are wearable. Some of them can be worn on all the fingers at the same time but with the last phalanx movement being constrained (Inaba and Fujita, 2006; Minamizawa et al., 2010; Chinello et al., 2012; Meli et al., 2014; Scheggi et al., 2015). Only the device proposed by Scheibe et al. (2007) remains wearable without limiting the movement of fingers. However, this device provides a limited and rather weak tactile feedback. Besides, it needs to be adjusted to each finger in order to provide the same feedback rendering. All the other devices seem too heavy or cumbersome to be worn on several fingers and to perform free movements without colliding.
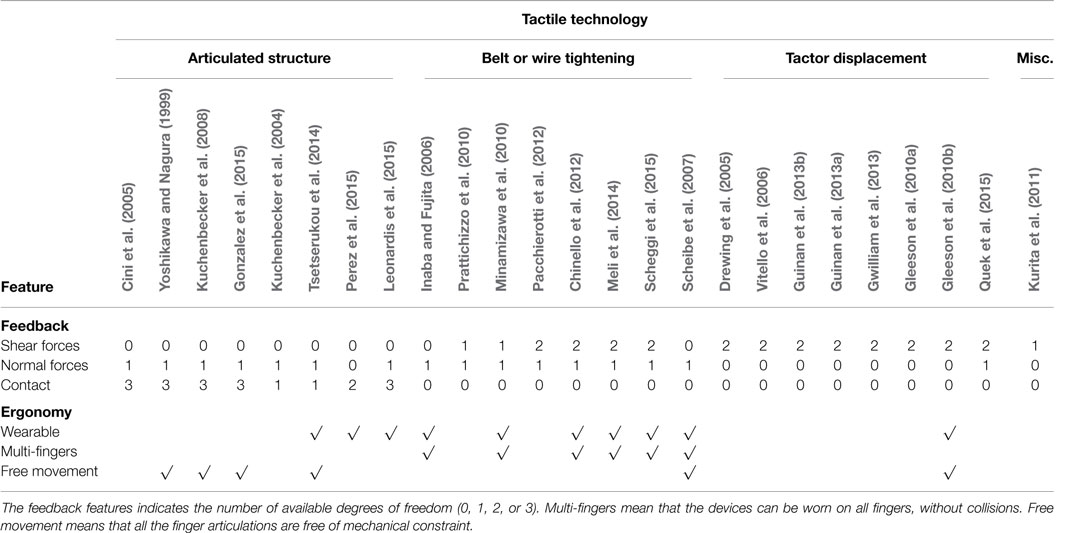
Table 1. Overview of existing tactile devices able to generate contact forces at the fingertip.
2.2. Perception of Shear Forces
2.2.1. Perception and Discrimination of Direction
Several studies have investigated the perception of feedback and shear forces produced by tactile fingertip devices. Some previous works have focused first on measuring the just noticeable difference between the directions of shear forces generated at two different angles by a fingertip tactile device. Keyson and Houtsma (1995) obtained a threshold angle between 11° and 17° depending on the tested direction. Drewing et al. (2005) found a threshold angle between 23° and 35°.
Then, Gleeson et al. (2010b) found that 0.5 mm of displacement and a speed of 5.6 mm/s is enough to obtain 99% of correct discrimination between two opposed directions. In a second experiment, Gleeson et al. (2010a) investigated the influence of speed, repetition, and displacement amplitude in a four-direction discrimination task. They found that tangential displacements as little as 0.2 mm at speeds as slow as 1 mm/s are sufficient to distinguish four directions of movement. The study also reveals that repeating the same movement and increasing the displacement amplitude can improve the discrimination and that a speed between 1 and 4 mm/s can provide the best recognition rates. The authors pointed out that user sensitivity depends on the displayed direction, and this dependency becomes less significant with larger displacements.
Vitello et al. (2006) and Gwilliam et al. (2013) found that moving the arm or the wrist during tactor displacement also has an influence on the direction discrimination threshold. Vitello et al. (2006) observed an increase of the discrimination threshold from 36° with a static arm to 64° with an active arm. Then, Guinan et al. (2013b) have coupled two devices providing 2.5 mm of displacement back to back in order to perform a discrimination task with 4 directions and 6 rotations. They obtain a discrimination accuracy of 98% for each type of direction or rotation cues.
2.2.2. Requirements for Tactor-Based Tactile Devices
The perceptual studies that have been conducted so far provide several interesting guidelines and requirements regarding the design of tactor-based tactile devices. These studies show indeed that a tactor displacement of 0.5 mm (or higher) and a displacement speed between 1 and 4 mm/s seem to provide the best perceived tactile signal. Moreover, a maximum objective of 10 discernible directions seems to be reasonable to ensure a discrimination threshold over 80%.
3. The HapTip Device
We propose a novel tactile device based on a tactor displacement for simulating shear forces at the fingertip. Compared to existing approaches, our objective is to reach a light, wearable, and multi-finger solution with compelling tactile stimulations on 2 degrees of freedom. Our objective, in terms of maximum tactor displacement is set to 2 mm in any direction tangential to the skin. Therefore, forces up to 3 N are required, taking into account a skin stiffness varying between 0.79 and 1.53 N/mm depending on the directions (Gleeson et al., 2010b).
3.1. Device Design
The design of the device is illustrated in Figures 1 and 2. It is composed of a plastic housing fixed above a parallelogram structure actuated by two miniature DC motors able to move a plastic cap responsible for the shear force feedback in 2D. The housing has a hollow shape in front of the fingertip, allowing the user to naturally position the pulp of his or her finger in front of a small hole giving access to the moving cap. The housing is manufactured using rapid prototyping techniques (micro stereo lithography) and painted using an anti-sweat black matte paint.
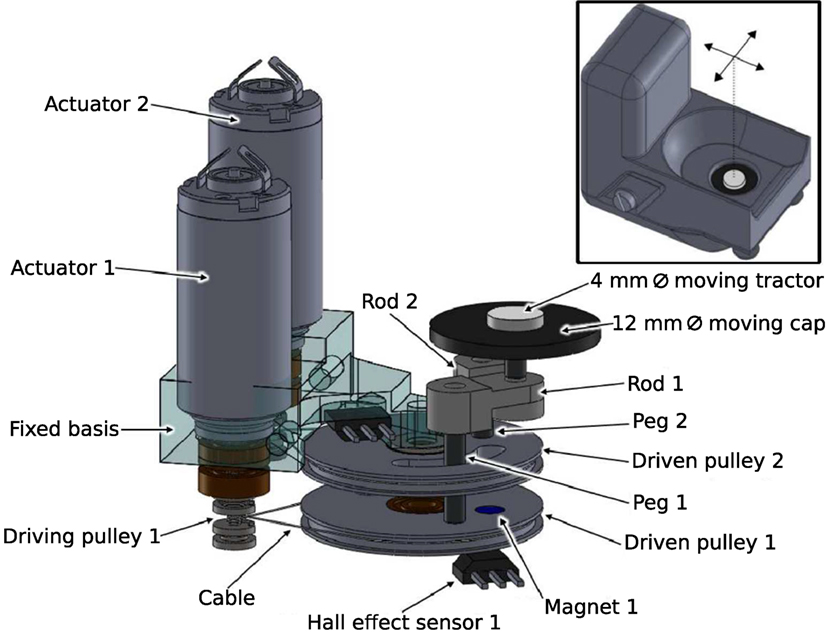
Figure 1. Exploded CAD view of the HapTip device. Top right hand corner: the assembled device within its housing.
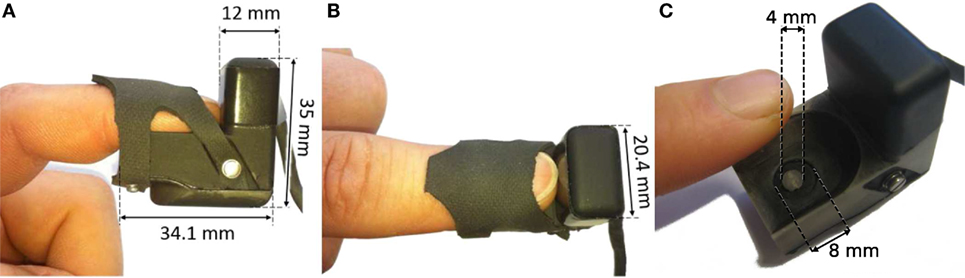
Figure 2. HapTip dimensions and close up: (A) right side view, (B) up side view, and (C) close up on the tactor.
Small high performance ironless DC actuators (ref. Maxon RE8 347727, 12 V, 0.5 W, 22.5 mm × 8 mm, 4.1 g) and miniature cable capstan reducers are used to get a compact and light actuation system. Using tiny dyneema cables (ref. Berkley Nanofil 0.06, diameter 0.0723 mm) instead of usual steel cables as used by Massie and Salisbury (1994), the driving pulley diameter can be reduced up to 0.87 mm. The driven pulleys have a diameter of 16.07 mm (largest possible size considering the width of the housing), hence a reduction ratio (equal to the ratio between the pulleys’ diameters) of 18.4. These pulleys are made of aluminum to limit their weight and they are guided around a common axis using miniature ball bearings (ref. MR682, 2 mm × 5 mm × 1.5 mm) to minimize friction. Such cable capstan reducers have a very high efficiency, up to 0.97 and more. This is much higher than the efficiency of gear trains found in servomotors usually selected, for example by Gleeson et al. (2010b), for their high torque/volume ratio. As a consequence, smaller motors can be used for the same amount of force at the fingertip, hence a more compact and lighter design. Also, the movement is continuous (there is no backlash) and the friction between teeth is eliminated.
Two small cylindrical steel pegs fixed on the driven pulleys move two small rods that in turn drive a third steel peg supporting the moving cap. The driven pulleys and rods form a parallelogram structure. In order to minimize the size of the system, the rods are manufactured in POM (a variety of plastic that displays a very low coefficient of friction) and directly guided around the pegs without ball bearings. This solution is more compact than structures using compliant joints as used in Gleeson et al. (2010b). The latter structures only support small displacements compared to their size and exhibit an elastic or a viscoelastic behavior that tends to move the cap back to the center of the workspace when no force is applied. As a consequence, the motors have to fight against this stiffness to displace the cap; hence, larger actuators compared to our solution.
After optimization, the distance between the axis of the pulleys and the pegs, and the dimensions of the rods were set to 5 mm. With these components, the force capacity is theoretically more than 2.7 N in any direction in any point of the workspace. It exceeds 3.4 N in the reference configuration where both rods are orthogonal.
As shown in Figure 1, in order to have a constant skin resistance against the tactor’s movement, the tactor is placed below a hole in the device’s housing. This solution avoids the user pressing against the cap with excessive forces. In our design, the hole diameter is 8 mm. It is shown in Gleeson et al. (2011) that larger holes are beneficial in terms of user sensitivity to tangential tactile stimuli. However, larger holes could induce a higher pressure on the moving cap, which would increase the skin stiffness and reduce the possible displacements given the limited force capacity of our device. While this is not a problem for fixed systems as in Gleeson et al. (2011) for which it is possible to use large and powerful actuators, it becomes an issue in wearable systems due to size and weight constraints. In practice, we verified that this 8 mm diameter ensures that the cap movement is not impeded by the finger’s pressure. Also, in order to avoid any risk of squeezing the skin, an overlap is always maintained between the cap and the housing. Therefore, the cap must have a diameter larger than the hole plus the tactor’s range of motion, and it spans a surface equal to its diameter plus its range of motion. With a hole diameter of 8 mm and maximum displacements of ±2 mm, the cap’s minimum diameter is 12 mm, and it spans a surface of 16 mm that is the largest possible considering the size of the housing.
As shown in Figure 2, the device is maintained in contact with the fingertip using an elastic belt. Its width is equal to 20.4 mm, which is only few millimeters larger than an adult finger. Its length is 34 mm, of which about 22 mm are below the distal phalanx (the length of the part below the distal phalanx is chosen so that it does not limit its flexion), hence, only 12 mm in front of the fingertip. Finally, its total height is about 35 mm, with only 12 mm below the pulp of the finger. The total weight of the device is 22 g without electric cables and elastic belt.
This device, of which several prototypes were manufactured, is light and compact enough to be wearable and to be fixed on the distal phalanx of the fingers, letting the user free to move his hand and fingers. As shown in Figure 3 with few examples, it is possible to reach most precision grasps and fingers configurations with three devices.
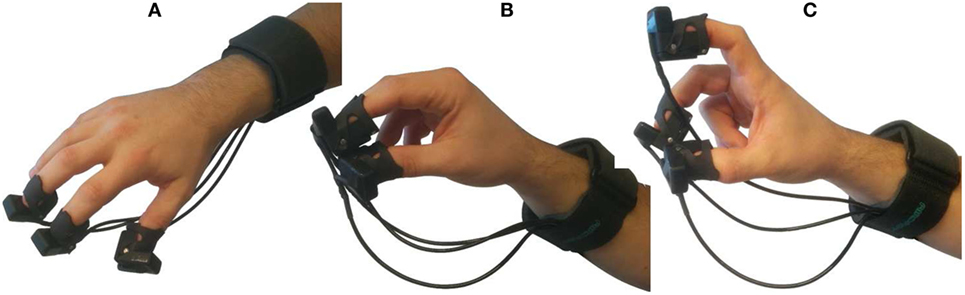
Figure 3. Devices strapped on the hand of the user in a three fingers configurations: (A) hand open, (B) thumb-2 finger precision grasp, and (C) thumb and middle finger opposition.
It is worth noting that the weight of the moving cap and tactor is negligible (only about 0.2 g) compared to the weight of the device (22 g). Alone, the basis, motors, and housing, including ball bearings and screws, which are fixed with respect to the finger, represent almost 19 g. As a consequence, the housing remains almost fixed when the cap is displaced, and the user is expected to sense the sole movement of the cap, contrary to vibrating motors, for example, which induce a vibration of the whole device in which they are embedded. Also, the device’s geometry and kinematics ensure that the force applied on the back of the finger and nail is independent of the cap movements (only a constant force required to maintain the finger in place is felt, this force being evenly distributed due to the flexibility of the belt). On the contrary, the tightening kinematics often used in the literature, as, for example, in Minamizawa et al. (2007) or Leonardis et al. (2015), induces a variation of the force applied on the back of the finger and nail that can disturb the user, this force being often not evenly distributed as the parts in contact with the back of the finger are made of hard plastic, eventually covered with a thin sheet of foam.
3.2. Sensors
As shown in Figures 1 and 2, the actuators are integrated in the distal part of the device in front of the finger. In order to minimize their volume, they are not equipped with encoders that would add about 5 mm in height. Instead, the movements are measured at the level of the driven pulleys using miniature Hall effect sensors (ref. Honeywell SS495A1) fixed on the basis and housing, and small iron-neodymium-boron magnets (diameter 2 mm, height 1 mm, ref. supermagnete S02-01-N) embedded in the pulleys. The response of a reference sensor embedded in a mock-up reproducing the geometry of the HapTip device, acquired and identified using an Arduino Leonardo and a National Instruments acquisition card, is displayed in Figure 4. As shown in this figure, the sensor response is almost linear within the range between −30° and +30° that exceeds the pulley’s maximum rotation.
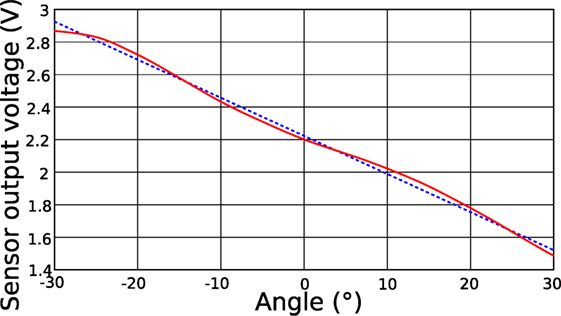
Figure 4. Hall effect sensor’s response.
It is worth noting that, in practice, we manufactured several prototypes of the HapTip device. These prototypes, and the sensors in particular, were assembled manually. As a consequence, there can be small disparities between the different devices. To guaranty the best possible calibration of all systems, the response of each sensor was identified separately. It was shown that all sensors display the same behavior as shown in Figure 4, with, however, slightly different slopes and offsets.
3.3. Controller
The motors and sensors are connected to an electronic board, which integrates a motor current servo loop. The motor currents are measured with 14-bit resolution. The current loop is handled by a micro-controller (ref. Texas Instrument TMS 320F28035) with a frequency of 2.5 kHz. The electronic board communicates with the PC through an UDP connection with a refresh rate of 1 kHz, sending down the motor currents and positions, and receiving the torque commands. A software controller is used to implement the geometric and static models of the device. The first ones compute the position of the moving cap knowing the driven pulleys’ angles obtained from the sensors’ responses or the angles that are necessary to reach a given position. They are used to control the position of the cap. The second ones compute the torques required to apply a given force on the cap, or the force resulting from given motor torques. They are used for force regulation.
Table 2 summarizes the technical specifications of the HapTip in the reference configuration where both rods are orthogonal.
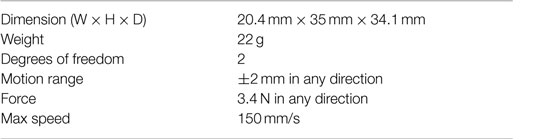
Table 2. Technical specifications of the HapTip device.
4. Tactile Rendering
In this section, we propose several tactile rendering techniques suited for fingertip devices displaying 2 DoF shear forces. These rendering techniques simulate interactions occurring between the extremity of a virtual finger and the virtual surface of a rigid object. Three complementary rendering techniques are proposed depending on the nature of the interaction: (1) getting in contact, (2) touching a surface, and (3) manipulating an object. They all return a 3D vector corresponding to the theoretical 3D tactor displacement. This 3D vector is then projected and displayed in 2D by the fingertip device.
In the equations displayed hereafter, the following symbols are used: is the theoretical tactor displacement in 3D (in millimeter), α is the tactor amplitude (in millimeter), λ is the decay constant, f is the frequency (in Hertz), is the velocity vector (in meter per second), is the acceleration vector (in meter per second square), is the earth gravity vector (constant in meter per second square), and t is the time (in seconds).
4.1. Getting in Contact
The first step when interacting with an object is getting in physical contact. In this case, the tactile feedback notifies the user when the virtual finger enters in contact with a solid object.
In order to simulate the act of tapping on a surface, we propose to rely on the feedback model introduced by Okamura et al. (2001) were the authors proposed a vibration feedback based on a decaying sinusoidal waveform. The experiments of Okamura et al. (2001) and Kuchenbecker et al. (2006) showed that decaying sinusoidal waveforms can support the identification of material and increase the realism of the tapping. As the feedback model used by Okamura et al. (2001) and Kuchenbecker et al. (2006) are designed to be displayed through haptic devices, we adapted it to be displayed on our device [see equation (1)].
Thereby, the speed at contact moment (c) and the tactor’s amplitude (αc) determine the feedback strength. The decay constant (λ) and the frequency (f) are determined by the object’s material. An object made of rubber would have a lower decay constant (λ) and frequency (f) than a metal object. Figure 5A illustrates, for example, how this rendering technique can be used when tapping a bottle at different heights, and can help determining if the bottle is empty or not.
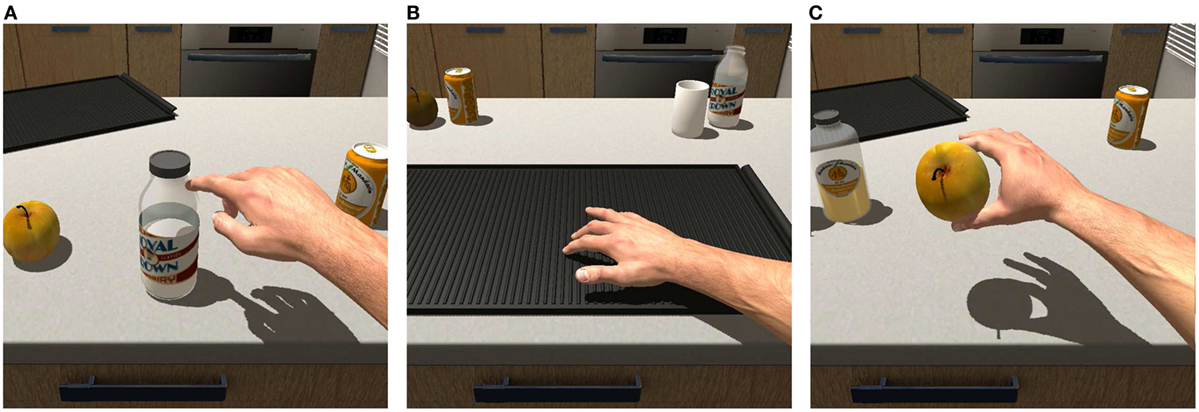
Figure 5. Illustrative use cases: (A) getting in contact and tapping a virtual bottle, (B) touching a surface and feeling its texture, and (C) hefting an object and feeling its weight.
4.2. Touching a Surface
Once the finger is in contact with the object, the user can explore its surface. In this case, the tactile feedback can provide information related to the object’s texture or relief.
Based on the work of Campion et al. (2008), we propose to use two sinusoidal signals to describe the texture of a surface [see equations (2) and (3)]. The variable t is the tangential velocity of the fingertip at instant t. The xx and xy variables correspond to the fingertip position on the surface’s tangent frame of reference. The fx and fy variables determine the spatial frequency of the surface in both tangential directions. The depth of modulation is determined by αx and αy. The coefficient of friction is defined by μ. The σ function gives the normalized direction of the current finger movement or of the last movement, if the finger speed is under the speed threshold k. The value of the threshold k should correspond to a significant amount of speed in order to avoid that a micro displacement be recognized as a voluntary movement. As shown by Campion et al. (2008), the roughness of the texture is determined by the variables α, μ, and f. The larger are α and μ and the smaller is f, the rougher is the texture.
This equation is suited for isotropic, horizontal, and vertical texture patterns. For instance, as illustrated in Figure 5B, when a user is touching a grill plate, the grooves at its surface can be perceived.
4.3. Manipulating an Object
Two different techniques are proposed in order to display different kinds of information when manipulating an object. The first technique is used to display the weight of a manipulated object straightforwardly. The second technique can be used in the context of manipulating a container in order to inform about the content.
4.3.1. Weight Feedback
When an object is lifted, one of the first haptic information we perceive is its weight. Equation (4) is used to simulate the weight sensation a user should feel when lifting and hefting an object (see Figure 5C). In equation (4), the weight variation is obtained by changing the amplitude (αa and αg). A more realistic rendering would require the same value for αa and αg. However, this limits the rendering possibilities and we could observe after preliminary testings that such a metaphorical haptic feedback is well understood by users.
4.3.2. Content Feedback
Another rendering technique is dedicated to the manipulation of objects having contents able to move inside. The movements of the content are transcribed through the tactile feedback. Objects containing a liquid, an inside mechanism, or any contents free to move are suited for this tactile rendering.
where o is the center of gravity of the manipulated object and c is the center of gravity of the content object. This technique relies on the underlying physical engine used and on the mechanical properties of the manipulated object. The tactile feedback varies if the manipulated object contains a liquid, a suspended object or an unconstrained object. The weight of the content can be adjusted through the amplitude parameter (αγ). This feedback was found very informative to determine the presence or absence of content and the nature of this content, as illustrated in Figure 6.
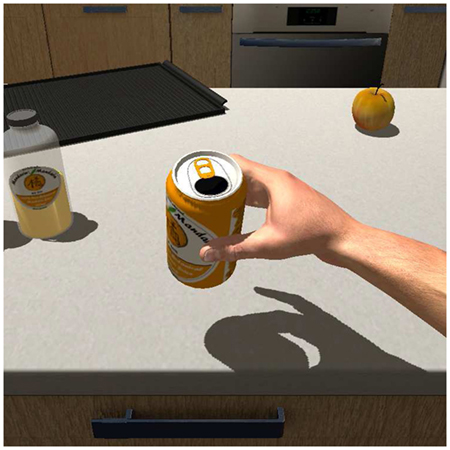
Figure 6. Illustrative use case: shaking a virtual can and perceiving its content.
4.4. 2D Transformation of the Signal
All the proposed rendering techniques provide a 3D displacement vector. With HapTip, this 3D vector must be transformed into a 2D one to match the two DOF of the tactor displacement. In order to provide a weighted and oriented tactile feedback, the device’s orientation and its amplitude features are taken into account, as given by equation (6). Where p is the tactor position (in meter), A is the maximum amplitude of the device (in meter), is the 3D tactor displacement (in meter), T is the fingertip transformation matrix in the virtual world, P is the projection matrix on plane xy, and O is the position of the center of the device referential. The magnitude of the projected tactor displacement is clamped between 0 and 1 in order to avoid any value outside of the device’s maximum amplitude.
4.5. Immersive VR Setup
Finally, we have integrated both our hardware components and our software rendering techniques within a complete and immersive VR platform (see Figure 7). Our platform relies on the Oculus rift DK2 head-mounted display, which seems well suited for hand-based interactions. Then, it uses a GameTrak for position tracking, a Trivision Colibri for orientation tracking, three HapTip devices for tactile feedback, and the Unity 4 engine for visual feedback and simulation. The GameTrak is a direct motion capture device based on two wires tensioned between the device and the user’s hands. The combination of angle and unroll length of the wire allows precise determination of the hand location. The Trivision Colibri is an inertial measurement unit. Its sensors measure acceleration, angular rate, and magnetic field to support orientation tracking. Depending on the interaction context, the GameTrak is used to track the fingertips (getting in contact and touching a surface) or for hand tracking (manipulating an object). More elaborate hand tracking systems could of course be used in order to access the numerous degrees of freedom involved – such as a Vicon’s BONITA motion capture system.
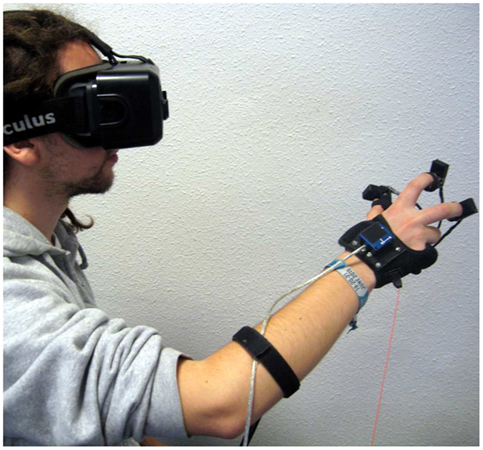
Figure 7. Immersive VR setup used to test the proposed tactile rendering techniques.
As shown in Figures 5 and 6, we have designed several interaction scenarios in order to illustrate the various interaction capabilities offered by the HapTip approach. Our rendering techniques are all working in real-time with observable framerates of 75 Hz using a standard PC configuration (Intel Core i7 4800MQ and Quadro K3100M). The different rendering techniques can be combined and/or activated sequentially depending on the action performed by the user. As an example, the Weight feedback is used if the manipulated object is inert, whereas the Content feedback is used if it contains something. We invite the reader to view the accompanying video for a better illustration of our rendering techniques and use cases. Please note that in the video, the moving cap sometimes rotates when moving it its workspace. In fact, the cap is free to rotate around its axis. The presence of the finger at its contact during use prevents this rotation which is never felt by the user.
5. User Studies
We conducted two user studies in order to assess progressively the potential of our haptic approach. The first study concerns the basic perception of the tactile feedback displayed by one of our fingertip devices. The second study concerns a more complex situation of interaction involving two fingers (and two fingertip devices), and deals with the weight perception of a virtual object.
As the experiment only involved participants interacting with tactile devices while wearing an HMD seated in a chair, we believed that the risk for participants was minimal and we, therefore, did not apply for ethical approval. Also, data gathered in the experiment did not have any personal relevance. However, participants were presented with and signed an informed consent form, including the full details about the experiment, data protection, and other legal requirements.
5.1. Experiment #1: Recognition of Tactile Patterns
The aim of this experiment is to assess the basic capacity of our fingertip device to display a signal that can be perceived by the user. To do so, we conducted a first experiment in order to determine if directional tactile patterns displayed by the HapTip are correctly perceived by users. Different patterns (orientations or directions) as well as the velocity of the tactor and the number of repetitions of the pattern were investigated in this experiment.
5.1.1. Population
Twelve participants (mean age = 28.25, SD = 4.1) performed the experiment. There were 10 men and 2 women, and 2 left-handed participants.
5.1.2. Experimental Apparatus
The experimental setup was composed of a 24-inch screen and a HapTip device fixed in front of it. Participants were asked to hold their dominant hand flat on a table and to put their index finger over the HapTip against which it was fixed with an elastic strap (See Figure 8). The HapTip was fixed on the table in order to avoid unwanted movements. The participants were controlling a mouse with their non-dominant hand in order to indicate the tactile pattern they perceived among the proposed orientations or directions displayed on the screen (see Figure 9).
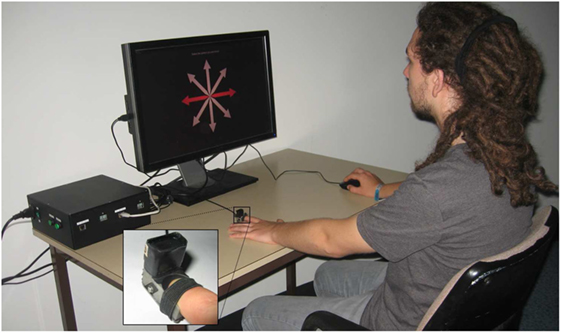
Figure 8. Direction recognition experimental setup (in left handed configuration).
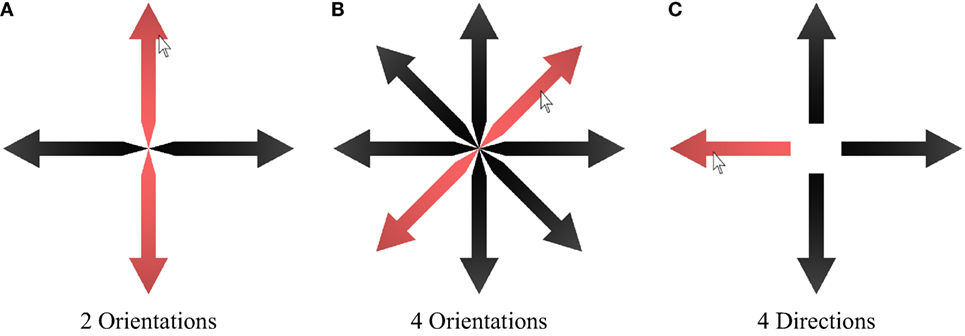
Figure 9. The three different sequences of patterns displayed to the participants. (A) 2 Orientations: horizontal and vertical, (B) 4 Orientations: horizontal, vertical and 2 diagonals, (C) 4 Directions: Up, Right, Down, Left.
5.1.3. Experimental Procedure
Before the experiment started, participants could visually observe the tactor moving in the four possible orientations (horizontal, vertical, and two diagonals) and directions (left, right, up, and down). In order to prevent any confusion, the correspondence between the tactor movements and the arrows displayed on the screen (See Figure 9) were also indicated to the participants. A short training session with random patterns was then performed by the participants to confirm their understanding of the instructions. During the experiment, different tactile patterns were displayed to the participants. For each trial, they had to wait the end of a complete signal period before answering and selecting the orientation/direction they perceived. There was no limit of time to answer. They could take a break at any moment if they asked for it. Finally, at the end of the experiment, a short questionnaire was given to each participant in order to evaluate their subjective perception. The whole experiment lasted ~25 min for each participant.
5.1.4. Experimental Design
The experiment was composed of three varying conditions: the pattern displayed by the tactor, the velocity of the tactor movement, and the repetition mode.
Three separated sequences of tactile patterns (2 orientations, 4 orientations, and 4 directions) were displayed to the participants. For the “2 orientations” pattern, the tactor could move in two orientations: up-down and left-right. For the “4 orientations” pattern, the two diagonals were added. For the “4 directions” pattern, the tactor could move in four directions, starting at the center position: left, right, up, and down. All the displayed patterns were sinusoidal movements. The orientation patterns (vertical, horizontal, and diagonals) were displayed according to equation (7) and the direction patterns (left, right, up, or down) were displayed according to equation (8).
where p the tactor position (in millimeter), O the center of the working space, A the tactor’s movement amplitude, f the frequency (in Hertz), t the time (in seconds), θ the pattern angle (in radius), R the rotation matrix of angle θ, and a unit vector . For the experiment, the amplitude is set at 1.5 mm, which is three times the minimum amplitude recommended by Gleeson et al. (2010b). All the patterns started and ended at point O. Thereby, the patterns indicating an orientation used a peak-to-peak amplitude of 3.0 mm, while the patterns indicating a direction only used a peak-to-peak amplitude of 1.5 mm. The effector velocity depends on the frequency f and the amplitude A. The repetition of the pattern is controlled through the time variable t.
Each pattern was displayed with three different mean velocities: 3 mm s−1 (f = 0.5 Hz), 6 mm s−1 (f = 1 Hz), and 12 mm s−1 (f = 2 Hz). Each pattern was also displayed with two repetition modes: one-pulsed mode (one single period) or a repeated mode (signal displayed until answer).
Each pattern was repeated three times. Thus, participants had to answer 180 perception tests [(2 + 4 + 4) orientations/directions pattern × 3 velocities × 2 repetition modes × 3 trials]. The 180 trials took approximately 15 min to complete. The order of orientations and directions sequences was counterbalanced. The different velocities and repetition modes were presented in a random order.
5.1.5. Collected Data
For each trial and each participant, we recorded the recognition answer to the displayed pattern. We then computed a recognition rate defined as the percentage of times a pattern was correctly recognized. At the end of the experiment, participants were asked to answer a subjective questionnaire composed of six questions and using a 7-point Likert scale. The questions for each sequence of patterns were as follows:
• Two orientations – Did you manage to differentiate the horizontal and vertical movements? (1, Not at all; 7, Yes every time.)
• Four orientations – Did you manage to differentiate the horizontal, vertical, and diagonal movements? (1, Not at all; 7, Yes every time.)
• Four directions – Did you manage to differentiate the right, left, up, and down directions? (1, Not at all; 7, Yes every time.)
The three other questions were common to all the patterns. The criteria were: the evolution of the sensitivity during the experiment, the comfort during the use of the device, and the fatigue.
• Sensitivity – How has evolved your tactile sensitivity during the experiment? (1, Strong decrease of sensitivity; 7, Strong increase of sensitivity.)
• Comfort – Did you feel comfortable with the device? (1, Not at all; 7, Yes totally.)
• Fatigue – Did you feel tired using the device? (1, Not at all; 7, Yes totally.)
5.1.6. Results
Concerning the recognition rate, we used a logistic model to measure the effect of the displayed pattern, the velocity, and the repetition mode. Our results showed a significant effect for the displayed pattern (p < 0.001) and the repetition mode (p < 0.001) on the recognition rate of the different patterns. A post hoc analysis using a Tukey test showed that the recognition rate was higher for the “2 orientations” sequence of patterns than for the “4 directions” and “4 orientations” sequences of patterns (p < 0.001). The recognition rate was higher for the “4 directions” sequence of patterns compared to the “4 orientations” sequence of patterns (p < 0.001). Concerning the repetition mode, the post hoc analysis showed that the recognition rate was higher for the repeated mode compared to the one-pulsed mode (p < 0.001).
Concerning the “2 orientations” sequence of patterns, we performed an analysis of deviance that showed a significant effect for the pattern (p = 0.04) but not for the velocity (p = 0.35) and the repetition mode (p = 0.24). The mean recognition rates were 99.54% for the “Left-Right” orientation and 97.22% for the “Up-Down” orientation. The recognition rates in function of the different velocities and repetition modes are given in Table 3.
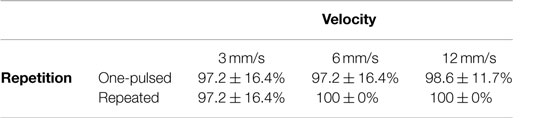
Table 3. Recognition rates (mean and SD) for the “2 orientations” sequence of patterns, in function of the velocity and the repetition mode.
Concerning the “4 orientations” sequence of patterns, we performed an analysis of deviance that showed a significant effect for the pattern (p < 0.001), the repetition mode (p < 0.001), and an interaction effect between the velocity and the pattern (p < 0.001). There was no significant effect for the velocity (p = 0.76). A post hoc analysis using a Tukey test showed that the orientation “Up-Down” (mean = 88.4%) has a significantly higher recognition rate than the first diagonal “Bottom left-Top right” (mean = 67.1%) (p = 0.006). There was no other significant difference between the other orientations. Table 4 shows the confusion matrix gathering the recognition rates and errors for each of the four orientations. Concerning the repetition mode, the post hoc analysis showed that the recognition rate was higher for the repeated mode compared to the one-pulsed mode (p < 0.001). Table 5 shows the recognition rates in function of the different velocities and repetition modes.
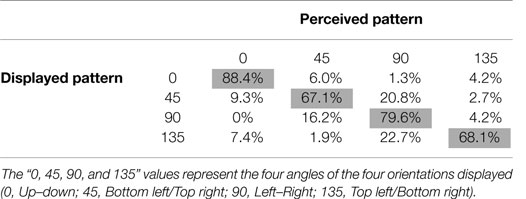
Table 4. Confusion matrix gathering the mean recognition rates and errors for the “4 orientations” sequence of patterns.
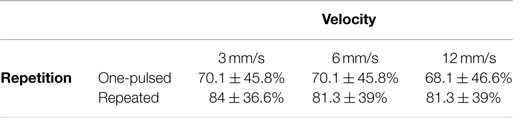
Table 5. Recognition rates (mean and SD) for the “4 orientations” sequence of patterns, in function of the velocity and the repetition mode.
Concerning the “4 directions” sequence of patterns, we performed an analysis of deviance that showed a significant effect for the pattern (p < 0.001) only. A post hoc analysis revealed that the two directions “Up” and “Right” have a significantly higher recognition rate than the two directions “Left” and “Down” (p < 0.001 for all the combinations). There was no significant difference between the directions “Up” and “Right” (p = 0.09) as well as between the directions “Left” and “Down” (p = 0.10). Table 6 shows the confusion matrix gathering the recognition rates and errors for each of the four directions. Table 7 shows the recognition rates in function of the different velocities and repetition modes.

Table 6. Confusion matrix gathering the mean recognition rates and errors for the “4 directions” sequence of patterns.
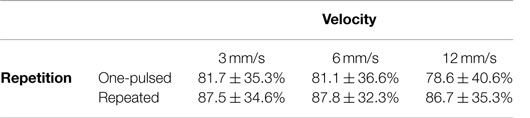
Table 7. Recognition rates (mean and SD) for the “4 directions” sequence of patterns, in function of the velocity and the repetition mode.
Concerning the subjective questionnaire, the results are shown in Figure 10. The “4 orientations” sequence of patterns (Median = 5) has the lowest ranking score among the three different sequences of pattern. Questions Comfort and Fatigue revealed that using the device is considered as comfortable (Median = 5.5) and almost fatigue-free (Median = 2.5). The question Sensitivity showed a large variation of responses, 5 participants felt an increase of tactile sensitivity and 5 felt a decrease of sensitivity.
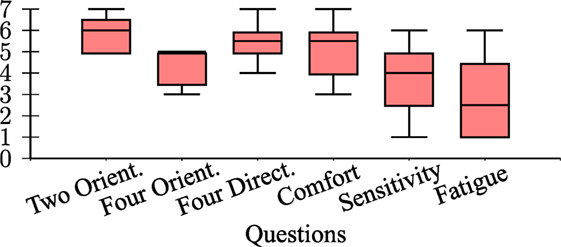
Figure 10. Box plots of the subjective questionnaire answers (7-point Likert scale). Each box plot is delimited by the quartiles (25 and 75%). The whiskers indicate the farthest values that are within 3/2 times the interquartile range.
5.1.7. Discussion
The results of experiment #1 clearly indicate that the HapTip device is able to convey basic directions and orientations. The best recognition rate obtained with the 4 directions cues was 86.1% with a speed of 6 mm/s and a tactor displacement of 1.5 mm. As for Gleeson et al. (2010a), we observed that a repeated pattern improves the recognition rate and that users have a better recognition rate for the same orientations (“Up” and “Right” orientations). Unlike Gleeson et al. (2010a), we did not observe any effect of the velocity, however, we used higher velocities of tactor movements that might be better perceived.
5.2. Experiment #2: Weight Discrimination
The aim of this second experiment is to assess the fingertip devices in a multi-finger configuration and within a virtual object interaction task. This experiment tries to determine if the HapTip can display one of the most fundamental haptic feedback in a manipulation task: the object’s weight. In this experiment, participants had to lift and sort four virtual cubes with different simulated weights. The weight variation only relies on the tactile feedback provided by two HapTip devices and, thus, by two haptic stimulations felt simultaneously by both the index finger and the thumb.
5.2.1. Population
Twelve participants (Mean age = 26.6, SD = 2.9) performed the experiment. Among the 12 participants, there were 10 men and 2 women, and they were all right handed.
5.2.2. Experimental Apparatus
In order to control spacing between the two fingertip positions, we designed an experimental apparatus able to provide a back-to-back tactile feedback to the thumb and index finger. This experimental apparatus is composed of a 5 cm large cube made of foam and two HapTip devices inserted at the surface of this cube (See Figure 11). The tracking system and visual display used in this experiment were the same as introduced in Section 4.5. The only difference was the tracked targets. Instead of tracking the fingertips, the hand position was tracked by a GameTrak and the cube orientation was tracked by a Trivision Colibri inserted inside the cube (see Figures 11B,C). A virtual scene with a table, four cubes, and a virtual hand manipulating a cube was displayed to the participant (see Figure 11A).
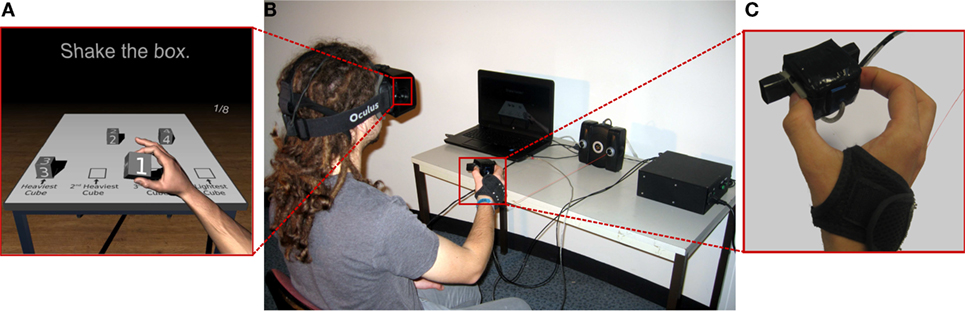
Figure 11. (A) User’s view: a virtual scene composed of four cubes that the participant can shake is displayed in a head-mounted display. (B) Experimental setup of the weight recognition experiment. (C) Close up on the manipulated cube: the real cube is composed of two HapTip and is manipulated by the dominant hand of the participant.
5.2.3. Experimental Procedure
Participants were asked to hold the cubes with the index and the thumb of their dominant hand, as shown in Figure 11. They could move or rotate their hand as they wished but they had to maintain the same grasping position during the whole experiment. In the virtual environment, they could see and control the position and the orientation of a virtual forearm holding the different virtual cubes. Grabbing the cubes was not part of the experiment, the different cubes were directly transferred from the virtual presentation table to the virtual hand. No information concerning the way participants were supposed to interpret the tactile feedback was given.
During the experiment, participants were free to manipulate each cube as they wished during 7 s. The only requirement was to shake each cube a minimum amount of time, four acceleration peaks of 0.3 mm/s2 were required. The manipulation time was extended until this shaking requirement was achieved. Moreover, participants were instructed that tangential movements should be favored because the tactile device could not display normal forces.
The task consisted in sorting a group of four virtual cubes according to their perceived weights. The sorting task consisted of three iterations: in the first iteration, the user had to lift sequentially each cube. After the participant had lifted all four cubes, he or she had to pick the number of the heaviest cube. No limitation of time was imposed to perform the picking. The selected virtual cube was then removed from the group and only three cubes were remaining for the second iteration. The user had to repeat this process two times more in order to sort all the cubes.
Finally, at the end of the experiment, a short questionnaire was given to each participant in order to evaluate their subjective perception. Each participant performed the experiment in one session lasting around 20 min.
5.2.4. Experimental Design
The experiment consists in one varying condition: the cube virtual weight. Four different weights were simulated through the equations (4) and (6) proposed in Section 4. Four amplitudes αa were tested to simulate the four different weights: 1/3, 1, 3, and 9. As they are arbitrary values and as such feedback has no equivalent in reality, there is no real physical weights that can be associated to these acceleration coefficients. The amplitude applied on the gravity αg was set to 0.1 during the whole experiment.
Each participant performed eight sorting tasks. The order of the four weights was randomized and counterbalanced for each sorting task to avoid any learning effect.
5.2.5. Collected Data
For each sorting task and each participant, we recorded the sorting order of each weight. Based on this record, we computed two measures: the recognition rate and the sorting error. The recognition rate is defined as the percentage of times a weight is correctly sorted. In order to measure the sorting quality of the four weights at the same time, a sorting error is calculated as in Gomez Jauregui et al. (2014) by using equation (9). This measure gives an error scaled between 0 for perfect ordering and 20 for a complete inverted order.
where E is the sorting error, Pi is the correct sorting position of virtual cube i, and the chosen sorting position of virtual cube i. At the end of the experiment, participants were asked to answer five questions by using a 7-point Likert scale. The questions were as follows:
• Perception – Was it difficult to perceive differences between weights? (1, Not at all; 7, Yes totally.)
• Sensitivity – How has evolved your tactile sensitivity during the experiment? (1, Strong decrease of sensitivity; 7, Strong increase of sensitivity.)
• Comfort – Did you feel comfortable with the device? (1, Not at all; 7, Yes totally.)
• Fatigue – Did you feel tired using the device? (1, Not at all; 7, Yes totally.)
• Appreciation – Did you like the device? (1, Not at all; 7, Yes totally.)
5.2.6. Results
Concerning the sorting task, the box plot of the sorting error is shown in Figure 12. The average sorting error is 2.2 over 20 with a median value at 2. A median sorting error of 2 indicates that the most common mistake was the inversion of the order of two weights. The maximum sorting error observed is 18 which corresponds to one single participant that inverted the sorting of the lightest and the heaviest objects.
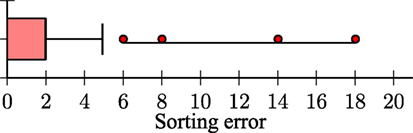
Figure 12. Box plot of the sorting error. The red dots indicate every value that is more than 1.5 times the interquartile range from the end of the box.
Figure 13 shows the rate of correct sorting according to the weight coefficient. A Wilcoxon rank sum test with a Bonferroni correction showed that the two lightest weights (1/3 and 1) are significantly easier to sort than the two heaviest weights (p < 0.001 for weight 1/3 compared with 1, 3, and 9; p = 0.006 for weight 1 compared with 3; p = 0.046 for weight 1 compared with 9). However, there is no significant difference between the two heaviest weights (p = 1.0). Thereby, most of the time the two inverted sorting were the two heaviest weights.
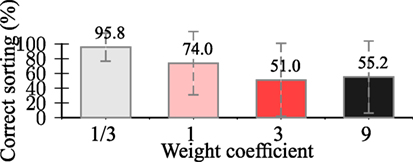
Figure 13. Correct sorting rate and SD by weights.
Concerning the subjective questionnaire, the results are displayed in Figure 14. The first question (Perception) revealed that the sorting task was considered of medium difficulty (median = 5). Four participants confirmed that sorting the heaviest weights was the most difficult part of the task.
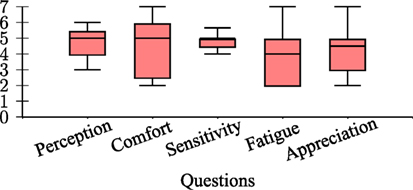
Figure 14. Box plots of the subjective questionnaire answers.
Questions Comfort and Fatigue revealed that the task was considered as moderately comfortable (median = 5) and slightly tiring (median = 4). The Sensitivity question indicates an increase of the perceived tactile sensitivity (median = 5). Finally, the Appreciation question revealed a median of 4.5 for the global appreciation of the device.
5.2.7. Discussion
The results of experiment #2 highlight that our approach enables to simulate different weights. However, the difference between the two heaviest weights was not recognized. Indeed, with the heaviest weights the device’s maximum amplitude was reached easily by fast manipulation movements. The participants applied an acceleration much higher than the minimum required value. In order to support the perception of four weights, the used acceleration coefficients should be downscaled to fit in a shorter window of values. However, this modification could reduce the discrimination rate between the other weights. The questionnaire indicates that the sensitivity of participants increased during the experiment. It is likely that participants were surprised and confused at the beginning, then they progressively got used to the tactile feedback and they could finally better understood what they perceived. We only focused on using the effect of movement acceleration to simulate weight variations. However, changing the effect of gravity according to the weight could enhance the weight discrimination.
Future improvements could first concern the design of novel tactile rendering techniques. We could notably design asymmetrical stimulations between opposed fingers in order to simulate 3 DoF haptic feedback. Thereby, when a user is moving a virtual object in a direction perpendicular to the surface of contact, the difference of feedback between the two fingers could simulate the missing degree of feedback. Providing tactile feedback to three fingertips or more might be more effective too. Also, we would like to study the influence of the number of fingers (and thus the number of fingertip devices) on the final perception and performance of users.
6. Conclusion
We introduced a modular approach for simulating tactile sensations at fingertips when interacting in virtual environments called HapTip. Our approach relies on a wearable tactile device able to display shear forces at the fingertip surface with 2 degrees of freedom. Several hardware modules can be used at the same time in order to address multi-finger and/or bimanual scenarios. We also designed several tactile rendering algorithms, in order to simulate haptic effects occurring when the user gets in contact, touches a surface or manipulates a virtual object. HapTip was integrated within an immersive virtual reality setup with head-mounted display and hand tracking. We designed several illustrative use-cases in which users can feel, in real-time, the tactile cues produced by Haptip when either: scratching a virtual surface or hefting virtual bottles with different weights or contents. We also conducted two experiments to assess the potential of our approach. We first found that the direction and orientation of the tactor displacement produced by our device were well perceived by the participants with high recognition rates. Then, we found that participants could already discriminate three to four different levels of weight of virtual objects using our tactile rendering techniques. Taken together, our results suggest that HapTip is a promising approach that could be used in various VR applications involving haptic sensations related to touching or manipulating virtual objects. Therefore, we would like to study the use of HapTip in concrete VR applications, such as in virtual prototyping or virtual training contexts.
Author Contributions
AG: software development, tactile rendering, experiment design, and paper writing. MM: experiment design, tactile rendering and paper writing. FG: device design and paper writing. AC: device design. FL: controller design and paper writing. AL: experiment design, tactile rendering and paper writing.
Conflict of Interest Statement
The authors declare that the research was conducted in the absence of any commercial or financial relationships that could be construed as a potential conflict of interest.
Acknowledgments
This research was partly supported by the Agence Nationale de la Recherche (Mandarin project – ANR-12-CORD-0011, labeled by Cap Digital Paris Région, the French cluster for digital contents and services).
Supplementary Material
The Supplementary Material for this article can be found online at https://www.frontiersin.org/article/10.3389/fict.2016.00006
References
Campion, G., Gosline, A. H. C., and Hayward, V. (2008). “Does judgement of haptic virtual texture roughness scale monotonically with lateral force modulation?” in 6th International Conference, EuroHaptics 2008, ed. M. Ferre (Madrid: Springer-Verlag), 718–723.
Chinello, F., Malvezzi, M., Pacchierotti, C., and Prattichizzo, D. (2012). “A three DoFs wearable tactile display for exploration and manipulation of virtual objects,” in Proceedings of IEEE Haptics Symposium (Vancouver, BC: IEEE), 71–76.
Cini, G., Frisoli, A., Marcheschi, S., Salsedo, F., and Bergamasco, M. (2005). “A novel fingertip haptic device for display of local contact geometry,” in Proceedings of First Joint Eurohaptics Conference and Symposium on Haptic Interfaces for Virtual Environment and Teleoperator Systems (Pisa: IEEE), 602–605.
Cutkosky, M. (1989). On grasp choice, grasp models, and the design of hands for manufacturing tasks. IEEE Trans. Rob. Autom. 5, 269–279. doi: 10.1109/70.34763
Drewing, K., Fritschi, M., Zopf, R., Ernst, M. O., and Buss, M. (2005). First evaluation of a novel tactile display exerting shear force via lateral displacement. ACM Trans. Appl. Percept. 2, 118–131. doi:10.1145/1060581.1060586
Gleeson, B., Stewart, C., and Provancher, W. (2011). Improved tactile shear feedback: tactor design and an aperture-based restraint. IEEE Trans. Haptics 4, 253–262. doi:10.1109/TOH.2010.56
Gleeson, B. T., Horschel, S. K., and Provancher, W. R. (2010a). Perception of direction for applied tangential skin displacement: effects of speed, displacement, and repetition. IEEE Trans. Haptics 3, 177–188. doi:10.1109/TOH.2010.20
Gleeson, B., Horschel, S., and Provancher, W. (2010b). Design of a fingertip-mounted tactile display with tangential skin displacement feedback. IEEE Trans. Haptics 3, 297–301. doi:10.1109/TOH.2010.8
Gomez Jauregui, D., Argelaguet, F., Olivier, A.-H., Marchal, M., Multon, F., and Lecuyer, A. (2014). Toward “pseudo-haptic avatars”: modifying the visual animation of self-avatar can simulate the perception of weight lifting. IEEE Trans. Vis. Comput. Graph. 20, 654–661. doi:10.1109/TVCG.2014.45
Gonzalez, F., Bachta, W., and Gosselin, F. (2015). “Smooth transition-based control of encounter-type haptic devices,” in Proceedings of IEEE International Conference on Robotics and Automation (Seattle, WA: IEEE), 291–297.
Gonzalez, F., Gosselin, F., and Bachta, W. (2014). Analysis of hand contact areas and interaction capabilities during manipulation and exploration. IEEE Trans. Haptics 7, 415–429. doi:10.1109/TOH.2014.2321395
Guinan, A., Caswell, N., Drews, F., and Provancher, W. (2013a). “A video game controller with skin stretch haptic feedback,” in Proc. IEEE International Conference on Consumer Electronics (Daejeon: IEEE), 456–457.
Guinan, A., Hornbaker, N., Montandon, M., Doxon, A., and Provancher, W. (2013b). “Back-to-back skin stretch feedback for communicating five degree-of-freedom direction cues,” in Proceedings of World Haptics Conference (Las Vegas, NV: IEEE), 13–18.
Gwilliam, L., Doxon, A., and Provancher, W. (2013). “Haptic matching of directional force and skin stretch feedback cues,” in Proceedings of World Haptics Conference (Daejeon: IEEE), 19–24.
Hafez, M. (2007). Tactile interfaces: technologies, applications and challenges. Vis. Comput. 23, 267–272. doi:10.1007/s00371-007-0102-2
Horvath, S., Galeotti, J., Wu, B., Klatzky, R., Siegel, M., and Stetten, G. (2014). Fingersight: fingertip haptic sensing of the visual environment. IEEE J. Transl. Eng. Health. Med. 2, 1–9. doi:10.1109/JTEHM.2014.2309343
Inaba, G., and Fujita, K. (2006). “A pseudo-force-feedback device by fingertip tightening for multi-finger object manipulation,” in Proceedings of the EuroHaptics Conference, 475–478.
Keyson, D., and Houtsma, A. (1995). Directional sensitivity to a tactile point stimulus moving across the fingerpad. Percept. Psychophys. 57, 738–744. doi:10.3758/BF03213278
Kuchenbecker, K., Ferguson, D., Kutzer, M., Moses, M., and Okamura, A. (2008). “The touch thimble: providing fingertip contact feedback during point-force haptic interaction,” in Proceedings of Symposium on Haptic Interfaces for Virtual Environment and Teleoperator Systems (Reno, NE: IEEE), 239–246.
Kuchenbecker, K., Provancher, W., Niemeyer, G., and Cutkosky, M. (2004). “Haptic display of contact location,” in Proceedings of Symposium on Haptic Interfaces for Virtual Environment and Teleoperator Systems (Chicago, IL: IEEE), 40–47.
Kuchenbecker, K. J., Fiene, J., and Niemeyer, G. (2006). Improving contact realism through event-based haptic feedback. IEEE Trans. Vis. Comput. Graph 12, 219–230. doi:10.1109/TVCG.2006.32
Kurita, Y., Yonezawa, S., Ikeda, A., and Ogasawara, T. (2011). “Weight and friction display device by controlling the slip condition of a fingertip,” in Proceedings of IEEE/RSJ International Conference on Intelligent Robots and Systems (San Francisco, CA: IEEE), 2127–2132.
Leonardis, D., Solazzi, M., Bortone, I., and Frisoli, A. (2015). “A wearable fingertip haptic device with 3 dof asymmetric 3-rsr kinematics,” in IEEE World Haptics Conference (Evanston, IL: IEEE), 388–393.
Massie, T. H., and Salisbury, K. J. (1994). “The phantom haptic interface: a device for probing virtual objects,” in Proceedings of the ASME Dynamic Systems and Control Division (Chicago, IL: ASME), 295–301.
Meli, L., Scheggi, S., Pacchierotti, C., and Prattichizzo, D. (2014). “Wearable haptics and hand tracking via an rgb-d camera for immersive tactile experiences,” in Proceedings of ACM SIGGRAPH Posters (Vancouver, BC: ACM), 1–56.
Minamizawa, K., Fukamachi, S., Kajimoto, H., Kawakami, N., and Tachi, S. (2007). “Gravity grabber: wearable haptic display to present virtual mass sensation,” in Proceedings of ACM SIGxGRAPH Emerging Technologies. New York, NY: ACM.
Minamizawa, K., Prattichizzo, D., and Tachi, S. (2010). “Simplified design of haptic display by extending one-point kinesthetic feedback to multipoint tactile feedback,” in Proceedings of IEEE Haptics Symposium (San Diego, CA: ACM), 257–260.
Okamura, A., Cutkosky, M., and Dennerlein, J. (2001). Reality-based models for vibration feedback in virtual environments. IEEE/ASME Trans. Mechatron. 6, 245–252. doi:10.1109/3516.951362
Pacchierotti, C., Chinello, F., Malvezzi, M., Meli, L., and Prattichizzo, D. (2012). “Two finger grasping simulation with cutaneous and kinesthetic force feedback,” in Proceedings of the International Conference on Haptics: Perception, Devices, Mobility, and Communication (Tampere: Springer Berlin Heidelberg), 373–382.
Perez, A. G., Lobo, D., Chinello, F., Cirio, G., Malvezzi, M., San Martín, J., et al. (2015). “Soft finger tactile rendering for wearable haptics,” in Proceedings of World Haptics Conference. Evanston IL: IEEE.
Prattichizzo, D., Pacchierotti, C., Cenci, S., Minamizawa, K., and Rosati, G. (2010). “Using a fingertip tactile device to substitute kinesthetic feedback in haptic interaction,” in Proceedings of the 2010 International Conference on Haptics: Generating and Perceiving Tangible Sensations, Part I (Amsterdam: Springer-Verlag), 125–130.
Quek, Z. F., Schorr, S., Nisky, I., Provancher, W., and Okamura, A. (2015). Sensory substitution and augmentation using 3-degree-of-freedom skin deformation feedback. IEEE Trans. Haptics 8, 209–221. doi:10.1109/TOH.2015.2398448
Scheggi, S., Meli, L., Pacchierotti, C., and Prattichizzo, D. (2015). “Touch the virtual reality: using the leap motion controller for hand tracking and wearable tactile devices for immersive haptic rendering,” in Proceedings of ACM SIGGRAPH Posters (Los Angeles, CA: ACM), 1–31.
Scheibe, R., Moehring, M., and Froehlich, B. (2007). “Tactile feedback at the finger tips for improved direct interaction in immersive environments,” in Proceedings of IEEE Symposium on 3D User Interfaces. Charlotte, NC: IEEE.
Tsetserukou, D., Hosokawa, S., and Terashima, K. (2014). “Linktouch: a wearable haptic device with five-bar linkage mechanism for presentation of two-DoF force feedback at the fingerpad,” in Proceedings of IEEE Haptics Symposium (Houston, TX: IEEE), 307–312.
Vitello, M., Ernst, M., and Fritschi, M. (2006). “An instance of tactile suppression: active exploration impairs tactile sensitivity for the direction of lateral movement,” in Proceedings of the EuroHaptics Conference (Paris: EH Society), 351–355.
Keywords: virtual reality, haptic rendering, wearable tactile devices, tactile perception
Citation: Girard A, Marchal M, Gosselin F, Chabrier A, Louveau F and Lécuyer A (2016) HapTip: Displaying Haptic Shear Forces at the Fingertips for Multi-Finger Interaction in Virtual Environments. Front. ICT 3:6. doi: 10.3389/fict.2016.00006
Received: 09 February 2016; Accepted: 06 April 2016;
Published: 22 April 2016
Edited by:
Daniel Thalmann, Nanyang Technological University, SingaporeReviewed by:
Ryan Patrick McMahan, University of Texas at Dallas, USAJohn Quarles, University of Texas at San Antonio, USA
Copyright: © 2016 Girard, Marchal, Gosselin, Chabrier, Louveau and Lécuyer. This is an open-access article distributed under the terms of the Creative Commons Attribution License (CC BY). The use, distribution or reproduction in other forums is permitted, provided the original author(s) or licensor are credited and that the original publication in this journal is cited, in accordance with accepted academic practice. No use, distribution or reproduction is permitted which does not comply with these terms.
*Correspondence: Adrien Girard, adrien.girard@inria.fr;
Maud Marchal, maud.marchal@irisa.fr;
Anatole Lécuyer, anatole.lecuyer@inria.fr