 Carina Visser
 Simon Frederick Lashmar
 Jason Reding
 Donagh P. Berry
 Esté van Marle-Köster
- 1Department of Animal Science, Faculty of Natural and Agricultural Sciences, University of Pretoria, Pretoria, South Africa
- 2Animal and Grassland Research and Innovation Centre, Teagasc, Co. Cork, Ireland
The erosion of genetic diversity limits long-term genetic gain and impedes the sustainability of livestock production. In the South African (SA) dairy industry, the major commercial dairy breeds have been applying estimated breeding values (EBVs) and/or have been participating in Multiple Across Country Evaluations (MACE). The transition to genomic estimated breeding values (GEBVs) in selection strategies requires monitoring of the genetic diversity and inbreeding of current genotyped animals, especially considering the comparatively small population sizes of global dairy breeds in SA. This study aimed to perform a homozygosity-based evaluation of the SA Ayrshire (AYR), Holstein (HST), and Jersey (JER) dairy cattle breeds. Three sources of information, namely 1) single nucleotide polymorphism (SNP) genotypes (3,199 animals genotyped for 35,572 SNPs) 2) pedigree records (7,885 AYR; 28,391 HST; 18,755 JER), and 3) identified runs of homozygosity (ROH) segments were used to quantify inbreeding related parameters. The lowest pedigree completeness was for the HST population reducing from a value of 0.990 to 0.186 for generation depths of one to six. Across all breeds, 46.7% of the detected ROH were between 4 megabase pairs (Mb) and 8 Mb in length. Two conserved homozygous haplotypes were identified in more than 70% of the JER population on Bos taurus autosome (BTA) 7. The JER breed displayed the highest level of inbreeding across all inbreeding coefficients. The mean (± standard deviation) pedigree-based inbreeding coefficient (FPED) ranged from 0.051 (±0.020) for AYR to 0.062 (±0.027) for JER, whereas SNP-based inbreeding coefficients (FSNP) ranged from 0.020 (HST) to 0.190 (JER) and ROH-based inbreeding coefficients, considering all ROH segment coverage (FROH), ranged from 0.053 (AYR) to 0.085 (JER). Within-breed Spearman correlations between pedigree-based and genome-based estimates ranged from weak (AYR: 0.132 between FPED and FROH calculated for ROH <4Mb in size) to moderate (HST: 0.584 between FPED and FSNP). Correlations strengthened between FPED and FROH as the ROH length category was considered lengthened, suggesting a dependency on breed-specific pedigree depth. The genomic homozygosity-based parameters studied proved useful in investigating the current inbreeding status of reference populations genotyped to implement genomic selection in the three most prominent South African dairy cattle breeds.
1 Introduction
The early migration of cattle to Southern Africa and the introduction of exotic cattle into the native landscape are still debated (Orton et al., 2013). Although it is commonly believed that dairy cattle were first introduced to South Africa (SA) by the Dutch East India Company (VOC) during the 17th century to supply fresh milk to crews of ships passing the Cape of Good Hope, Felius et al. (2014) reported that the first Friesian cattle were only introduced to South Africa in 1850. The first Holstein-Friesian was registered in 1906 with SA Stud Book, and the Breeders’ Society was founded in 1912 (Duvenhage, 2017).
The years 1881 and 1890 have been reported as the most probable dates for the arrival of the first Jersey and Ayrshire cattle in South Africa, respectively (SA Stud Book, 2004). The Ayrshire Cattle Breeders’ Society of South Africa was established in 1916, followed by the South African Jersey Cattle Breeders’ Society in 1920 (Nel, 1968). It can, therefore, be concluded that European dairy cattle have been farmed in South Africa for more than a century. No additional breed development was performed in South Africa, apart from normal selection practices. The SA dairy populations have strong international genetic linkage due to extensive use of artificial insemination. The composition of the breeding objectives is similar to those of other international populations (Cole & VanRaden, 2018).
Official animal recording for dairy cattle in South Africa dates back to 1917, with the inception of a milk recording scheme (Van Marle-Köster and Visser, 2018), which was developed over time to include contemporary comparison methods in the 1970s, followed by the implementation of the Best Linear Unbiased Prediction (BLUP) sire model in 1987 (Mostert et al., 2004). Since the early 1990s, routine genetic evaluations have provided the Ayrshire (AYR), Holstein (HST), and Jersey (JER) breeders with estimated breeding values (EBVs) to be used in selection decisions. Routine participation in INTERBULL for Multiple Across Country Evaluations followed in 2004 (Mostert et al., 2006).
The breeding objectives for all three breeds include milk yield, milk quality, fertility, and functional traits (Banga et al., 2014; SA Stud Book, 2022a; SA Stud Book, 2022b; SA Stud Book, 2022c). More recently, funding initiatives such as the Dairy Genomics Program (DGP) have facilitated the establishment of single nucleotide polymorphism (SNP)-genotyped reference populations to help generate genomic breeding values for these breeds (Van der Westhuizen and Mostert, 2020).
Inbreeding results from consanguineous mating inevitably leading to an increased frequency of homozygosity. The phenomenon of reduced performance due to inbreeding known as inbreeding depression has been reported for a plethora of traits in dairy cows including milk production, reproduction, and fitness (e.g., survival), thereby impacting overall herd profitability (Doekes et al., 2019; Makanjuola et al., 2021). Historically, inbreeding was measured using pedigree information, based on the calculation of the probability that an individual has inherited alleles identical by descent (Wright, 1978). This measure of inbreeding is, however, dependent on both accurate and deep ancestry records (Ablondi et al., 2022; Saif-ur-Rehman et al., 2022). With the growing availability of genome-wide genotype information on large populations of animals, genome-based estimates of inbreeding are replacing pedigree-based estimates as the statistics of choice.
Runs of homozygosity (ROH) segments are detected using genome-wide genotype information with the profiling of these segments providing a well-established methodology to quantify genetic autozygosity and genetic diversity (Gautason et al., 2021; Ablondi et al., 2022; Mulim et al., 2022). Detected ROH are identifiable as continuous segments of homozygous nucleotide sequences that are highly correlated with mutation loads (Makanjuola et al., 2021) and can be indicative of the age of inbreeding based on their length characteristics (Gautason et al., 2021). Additionally, shared ROH segments, harboring SNP haplotypes that have a higher incidence compared to a certain population-specific threshold (Gorssen et al., 2021), may help guide the localization and/or identification of chromosomal regions under artificial or natural selection.
The widespread use of certain local and international bulls may contribute to greater genome-wide and location-specific homozygosity with downstream repercussions on productivity. In the South African dairy industry, the majority of bull semen used is of foreign origin with more than 40% of Holstein semen imported from the United States of America (USA); Canadian bloodlines predominate in the Ayrshire bulls used in South Africa while most Jersey bulls used in South Africa are of USA origin. Semen from countries such as Great Britain, Denmark, France, the Netherlands, Australia, and New Zealand have also contributed to the South African dairy cattle gene pool (Opoola et al., 2020). The ancestral information of these sires is available through Interbull; the depth of pedigree available is, however, dependent on each participating organization (International Bull Evaluation Service—INTERBULL, 2022). South Africa, with a relatively small dairy population compared to many other countries, needs to be able to manage the extent of genetic diversity within its dairy sector. Having access to genome-wide genotype information on individual animals provides an opportunity to evaluate the genetic diversity and inbreeding of the local South African dairy populations.
The objectives of the present study were to 1) classify and quantify runs of homozygosity in three South African dairy cattle populations; 2) estimate inbreeding coefficients using various sources of information, and 3) compare the inbreeding statistics generated from either recorded ancestry or genomic information.
2 Materials and methods
Ethical approval was granted by the University of Pretoria’s Ethics Committee for external data use (EC170627-135). Consent was provided from the respective breeders’ societies to allow access to the available pedigree and genotypic data.
2.1 Pedigree data
Pedigree data of the genotyped South African Ayrshire (AYR), Holstein (HST), and Jersey (JER) populations used in the present study were provided by SA Stud Book. The pedigree information included 7,885 AYR (5,654 females, 2,231 males), 28,391 HST (20,921 females, 7,470 males), and 18,755 JER (14,138 females, 4,617 males) records as summarized in Table 1. The pedigree depth was up to 24, 30, and 26 generations deep for the genotyped AYR, HST, and JER breeds, respectively. The optiSel (Wellmann and Bennewitz, 2019) R package was utilized to calculate the complete generation equivalent (CGE) and the pedigree completeness index (PCI) for each of the individual genotyped animals.
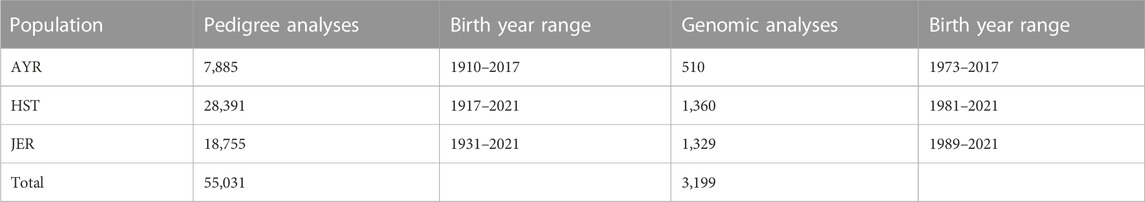
TABLE 1. A summary of the number of animals included in the pedigree analyses and genomic analyses for the Ayrshire (AYR), Holstein (HST), and Jersey (JER) breeds.
2.2 Single nucleotide polymorphism (SNP) genotypic data and quality control
A total of 3,199 genotyped animals (2,732 female, and 467 male cattle) with a sample call rate above 95% were available for this study consisting of 510 AYR, 1,360 HST, and 1,329 JER cattle. The animals included in this study originated from the national Dairy Genomic Program (DGP) with the aim of establishing reference populations for genomic selection. Animals that were included in this program represented the local populations and were selected based on EBV accuracies of at least 60%. The data structure of the genotyped populations is summarized in Table 1. The year of birth of genotyped animals ranged from 1973 to 2017 for the AYR, 1981 to 2021 for the HST, and 1989 to 2021 for the JER. For pedigree depth and inbreeding estimates, only the pedigree of the genotyped animals was considered.
All AYR animals were genotyped using the BovineSNP50-24 version 3 (Illumina, Inc. San Diego, CA 92122 USA) array containing 53,218 SNPs. Genotypes of HST and JER animals originated from five different genotyping panels, namely, the Bovine SNP50 versions 1 (54,001 SNPs) and 3 (53,218 SNPs), GeneSeek® Genomic Profiler™ 150K (139,480 SNPs), International Dairy and Beef (IDB) version 3 (53,450 SNPs), Weatherbys Scientific VersaSNP 50K™ (49,788 SNPs), and the Unistel-SA Stud Book 50K version 1 (54,394 SNPs) panels. The GeneSeek® Genomic Profiler™ 150K genotypes were generated through the South African DGP that was initiated in 2016 to benefit herds that participate in pedigree-based genetic evaluations and/or milk recording schemes provided by the Agricultural Research Council (ARC) or SA Stud Book. Genotype calling was done through various local and international service providers using their respective protocols, and the raw genotype files were converted into PLINK software version 1.9 (Purcell et al., 2007) input files. A common set of 36,887 SNPs were extracted for each population and the data sets were merged for the across-population analyses.
Sample- and marker-based quality control edits were performed using PLINK software version 1.9 (Purcell et al., 2007) to filter out non-autosomal and low-quality (SNP call rate<95%) SNPs from the dataset. As suggested by Meyermans et al. (2020) for ROH detection, neither minor allele frequency (MAF) nor linkage disequilibrium (LD) filtering was applied. No SNP edits were performed based on Hardy-Weinberg Equilibrium (HWE). The post-editing data set consisted of 3,199 animals with 35,572 autosomal SNP genotypes and all subsequent analyses were undertaken using this data set. The same animals were thus used for the pedigree and genomic analyses.
2.3 Genomic relatedness
GCTA version 1.24 (Genome-wide Complex Trait Analysis; Yang et al., 2011) was used to estimate genetic relatedness between individuals from the set of 35,572 autosomal genome-wide SNPs. A genomic relationship matrix was calculated using the method by Yang et al. (2010) and was followed by the estimation of eigenvalues and eigenvectors for a principal component analysis (PCA). The eigenvectors per animal were plotted as a scatter plot to visualize genomic relatedness.
2.4 Runs of homozygosity detection
Runs of homozygosity (ROH) for all genotyped animals were detected using the R package detectRUNS (Biscarini et al., 2019) by executing both the consecutive-SNP-based detection method (CR) and sliding window approach (SW; Marras et al., 2015). The SW approach, and more specifically its application in PLINK software (Purcell et al., 2007), is generally the most common ROH detection approach (and, hence, resource for FROH estimation) used across all livestock species (Peripolli et al., 2017) and has previously proven to outperform other methods (e.g., Howrigan et al., 2011). Dixit et al. (2020), for example, reported similar results for the detectRUNS SW approach to that of PLINK. The CR algorithm, which executes a window-free SNP-by-SNP approach, has received less research attention, however, has previously been shown to produce FROH patterns similar to that of both PLINK and detectRUNS’ SW approaches despite discrepancies in the number of ROH identified (Dixit et al., 2020). Both approaches were, therefore, tested in this study for a more comprehensive profiling of ROH.
For CR, the following ROH defining parameters were set: i) a minimum length of 1Mb, ii) a maximum distance (gap) between consecutive SNPs of 500kb, iii) a lower density limit of one SNP per 75kb, and iv) a maximum of two missing and no opposing (heterozygous) genotypes were allowed. The aforementioned parameters were the same for the SW approach, but, the sliding window size was set to 50 SNPs. The minimum number of SNP that constituted an ROH segment was set to 54 based on the formula implemented by Purfield et al. (2012):
where ns and ni were the numbers of SNPs and individuals, respectively, α represented the proportion of false-positive identifications (set to 0.05) and
2.5 Inbreeding coefficients
Three methods were used to estimate the inbreeding coefficients of all genotyped individuals: 1) FPED represented a pedigree-derived estimate, 2) FSNP represented an SNP-by-SNP excess in homozygosity, and 3) FROH represented genome-wide ROH coverage. The FPED and FSNP coefficients were calculated using optiSel (Wellmann and Bennewitz, 2019) and PLINK software version 1.9 (Purcell et al., 2007), respectively. The FPED coefficient was calculated using the summary.Pedig function in optiSel, which estimates the inbreeding coefficient as defined by Meuwissen and Luo (1992). For FSNP, the --het function in PLINK was executed, which is based on the formula
All FROH coefficients were based on the ROH detected with the SW approach for comparability. The FROH coefficient was estimated as (McQuillan et al., 2008):
where LROH represented the length of ROH in one individual, and LAUTO represented the length of the genome covered by SNPs, excluding the centromeres. Separate FROH coefficients were additionally calculated based on the length categories previously described and were labeled
2.6 Effective population size
The effective population size (Ne) of an actual population can be defined as the size of a hypothetical ideal population resulting in the same amount of genetic diversity as is present in the real population (Wright, 1978). The Ne based on both pedigree and SNP data were estimated separately. The estimated Ne based solely on pedigree information is limited by the pedigree depth (and accuracy of recording), whereas the SNP-based method is able to estimate both historical and recent Ne but is limited by the extent of LD captured (and hence, the SNP genotyping panel density as well as the number of animals genotyped). The pedigree-based Ne was calculated using the optiSel (Wellmann and Bennewitz, 2019) R package (R Core Team, 2013) for the last 10 complete generations. The SNP-based estimates of historical (highest number of generations ago) and recent Ne (least number of generations ago) were calculated using SNeP v.1.1 software (Barbato et al., 2015) based on linkage disequilibrium (LD) and by implementing the approximation proposed by Sved (1971) as a recombination rate modifier.
3 Results
3.1 Pedigree completeness and pedigree-based population structure
The mean, interquartile range (IQR), and median years of birth for the genotyped AYR population was 1974, 1956 to 1994, and 1972, respectively; 1973, 1953 to 1992, and 1969 for the genotyped HST population, respectively and 1980, 1960 to 1998, and 1982 for the JER population, respectively. The mean pedigree completeness index (PCI) of the genotyped populations was 0.976 for the AYR, 0.967 for the HST, and 0.993 for the JER populations. The average pedigree depth based on CGE was equal to 9.75 for AYR, 11.70 for HST, and 10.05 for JER.
The mean six-generation deep pedigree completeness for genotyped animals born in the 10-year period between 2011 and 2021 for the HST and JER breeds, and between 2007 and 2017 for the AYR breed is summarized in Table 2. These animals represented between 9% and 11% of the fully-traced back pedigree of the genotyped populations. The genotyped HST breed consistently showed the lowest pedigree completeness from six to two generations ago at 0.186 to 0.544 while the genotyped AYR (0.288–0.702) and genotyped JER (0.278–0.682) breeds had similar pedigree completeness six to two generations ago.
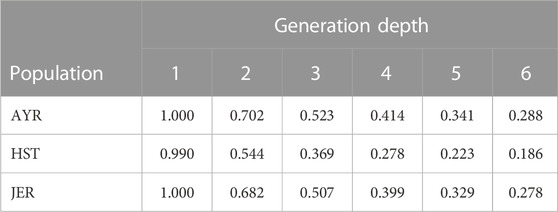
TABLE 2. The mean six-generation deep pedigree completeness for the genotyped South African Holstein (HST) and Jersey (JER) animals born within the period 2011 to 2021 as well as Ayrshire (AYR) animals born within the period 2007 to 2017.
3.2 Genome-based genetic relatedness
The first and second principal components of the autosomal SNP genotypes explained 8.3% and 4.6% of the genetic variation between all individuals and grouped the animals into three distinct clusters that corresponded with the three separate breeds. For the first principal component, the standard deviation of the eigenvectors ranged from 0.4 × 10⁻³ for AYR to 0.002 for JER (Figure 1). The number of outliers (encircled with gray dotted lines in Figure 1), defined as animals with eigenvectors outside the boundaries of mean ± 3 standard deviations for the first and/or second principal components, were three, 15, and 11 for the AYR, HST, and JER populations, respectively. While all identified outliers in the AYR and HST populations were South African animals, five of the JER outliers were international bulls (two from New Zealand and three from Denmark).
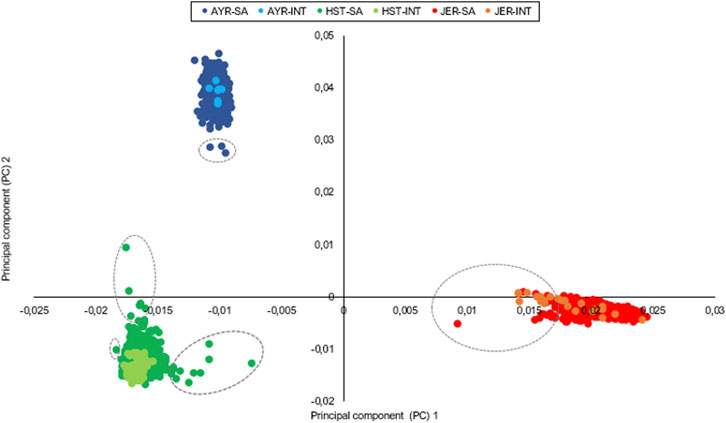
FIGURE 1. Principal components illustrate the genetic relatedness between and within the sampled Ayrshire (AYR), Holstein (HST), and Jersey (JER) populations with outliers encircled. INT, international animals; SA, South African animals.
3.3 Identified runs of homozygosity (ROH)
The per-breed statistics of the identified ROH are summarized in Table 3. Irrespective of breed, the CR ROH detection method identified more homozygous runs compared to the SW approach. For both detection methods, the majority of detected ROH was in the JER, followed by the HST and AYR breeds. The mean (±standard deviation) per individual ROH counts was 17.99 ± 4.96, 16.67 ± 5.47, and 28.30 ± 6.30 for the AYR, HST, and JER populations, respectively when the SW ROH detection approach was employed (CR method: AYR = 25.05 ± 6.89, HST = 23.70 ± 7.57, JER = 39.54 ± 8.32). The mean (±standard deviation) length ROH detected was the largest for the HST population (SW method: 8.66 Mb ± 6.82 Mb) and the smallest for the AYR populations (SW method: 7.69 Mb ± 5.99 Mb). However, the mean (±standard deviation) genome-wide ROH coverage (i.e., the total length of the genome covered by ROH) was the greatest for JER (SW method: 221.15 Mb ± 69.27 Mb) and the lowest for AYR (SW method: 7.69 Mb ± 5.99 Mb).
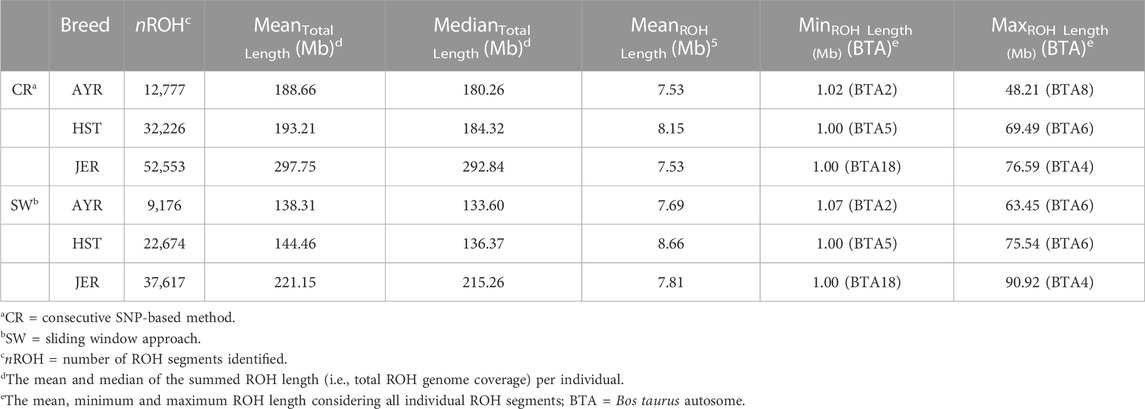
TABLE 3. Summary statistics of runs of homozygosity (ROH) identified for the Ayrshire (AYR), Holstein (HST), and Jersey (JER) dairy breeds using two ROH detection methods.
The autosome-wide distribution of the total number of ROH as well as the percentage coverage per autosome is illustrated in Supplementary Material S1. For all breeds, the most ROH were detected on BTA1 (range: 708 ROH for AYR to 3,475 ROH for JER), which is the largest autosome (158.2 Mb), whilst the fewest ROH (range: 110 for AYR to 440 for JER) were detected on BTA28 (46.2 Mb). For all breeds, the percentage of ROH coverage showed an increasing trend towards smaller autosomes (line graph in Supplementary Material S1) and peaked for BTA25, with values of 20.8%, 17.2%, and 16.3% estimated for the AYR, HST, and JER breeds, respectively. The lowest overall percentage autosomal coverage was observed for BTA5 (across all breeds: 6.84%).
Across all breeds, and for both detection methods, the majority of detected ROH were within the 4 ≤ ROH<8 Mb length category. The distribution of ROH within different length (in Mb) categories is depicted in Figure 2. Despite the variation in the number of ROH identified per breed (e.g., SW method: 13,498 more ROH for HST compared to AYR and 14,943 more segments for JER compared to HST), the differences in the number per length category were negligible between AYR and JER. In comparison to the other breeds, the HST breed had a greater number of large (≥16 Mb) ROH identified by both detection methods (CR: 0.079; SW: 0.109).
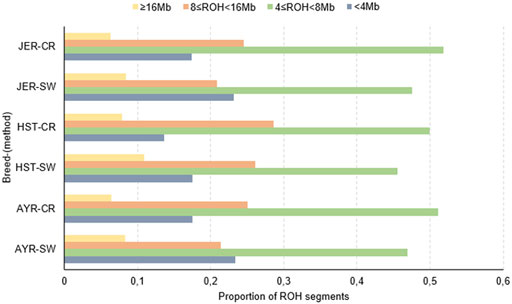
FIGURE 2. The proportions of all detected runs of homozygosity (ROH) in different length categories for the Ayrshire (AYR), Holstein (HST), and Jersey (JER) dairy breeds. CR, consecutive SNP-based method; SW, sliding window approach.
The proportion of times an SNP resided within a detected ROH was estimated per population. Two ROH haplotypes on BTA7 were identified in 70.96% of the JER population. The first preserved region consisted of 20 SNPs spanning 1.19 Mb and the second of 31 SNPs spanning 2.60 Mb. The first region encompasses 35 protein-coding genes, including LYPD8 (Gram-negative bacteria defense response) and various olfactory receptor genes, whilst the second region encompassed 82 protein-coding genes, including HSPA4 (heat-shock protein), ELANE (immune response), and LEAP2 (antimicrobial humoral immune response). Manhattan plots of the incidence of each SNP within detected ROH per breed are illustrated in Figure 3. For the AYR breed, the highest occurring consensus ROH haplotype was on BTA6 (base pairs position: 90,665,860-90,902,316) in 28.82% of the population. The 0.236 Mb AYR region contains seven protein-coding genes, including the PPEF2 (Hsp90 protein binding), as well as the CXCL9 and CXCL10 (both antimicrobial humoral immune responses). Three smaller ROH haplotypes, close in proximity, were identified on BTA20 (base pair position ranges: 38,453,649–38,487,130, 38,578,200–39,046,015, and 38,761,711–38,920,878) in 28.31%, 28.16%, and 28.09% of the HST population, respectively. These 0.054Mb, 0.181Mb, and 0.112 Mb regions contained two, four, and three SNPs, respectively. The 0.181 Mb genomic region overlaps with the SPEF2 (sperm flagella 2 protein) protein-coding gene, whereas the 0.112 Mb overlaps with PRLR, a prolactin receptor.
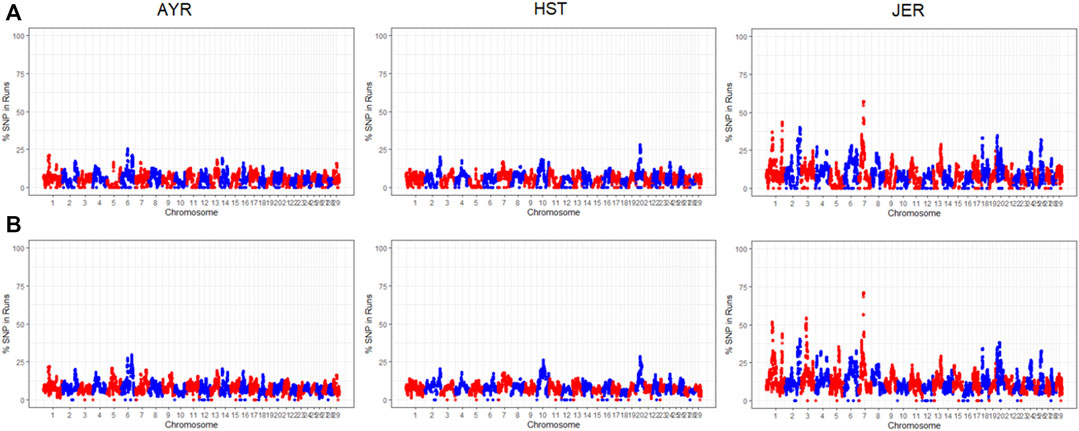
FIGURE 3. The chromosome-wide proportion of times each SNP resided within a detected ROH for the Ayrshire (AYR), Holstein (HST), and Jersey (JER) breeds using both the sliding window (A) and consecutive SNP-based (B) detection methods.
3.4 Inbreeding coefficients
The variability in animal-specific inbreeding coefficients per breed for the genotyped animals is illustrated by box and whisker plots in Figure 4. Furthermore, a contingency table for pedigree versus genome-based estimates (i.e., FSNP and FROH) is included in Supplementary Material S2.
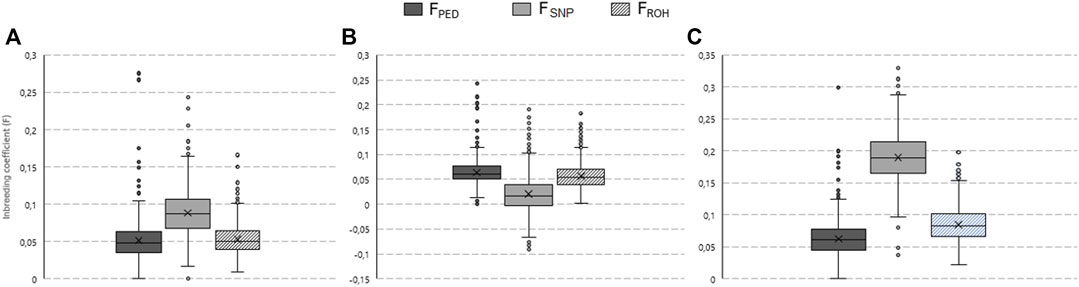
FIGURE 4. Box and whisker plots of the pedigree (FPED), single nucleotide polymorphism (FSNP), and runs of homozygosity (FROH) based inbreeding coefficients estimated for the South African Ayrshire (A), Holstein (B), and Jersey (C) populations.
The mean FPED for the AYR, HST, and JER genotyped populations was 0.051, 0.064, and 0.062, respectively. The highest frequency of AYR, HST, and JER animals fell within the 0.04-0.05, 0.05-0.06, and 0.07-0.08 coefficient classes, respectively. The greatest observed heterozygosity was in HST (HO = 0.356) while the lowest was in JER (HO = 0.332); hence, the FSNP-based inbreeding coefficient ranked the JER breed as the most inbred (FSNP = 0.190) followed by the AYR (FSNP = 0.088) and HST (FSNP = 0.020) breeds. For the JER breed, for example, the majority of animals (1,323 animals of the population of 1,329 animals) were categorized as having high FSNP values (>0.1) despite most of them having low (31.9% of animals) or moderate (62.7% of animals) FPED values (Supplementary Material S2). The rank order of breeds (from largest to smallest mean) was different for the ROH-based inbreeding coefficients observed; FROH was the highest for the JER breed (mean FROH=0.085), followed by the HST (mean FROH = 0.056) which was similar to the AYR (mean FROH = 0.053) breeds. The most AYR animals had FROH values in the 0.04 to 0.05 interval, whereas for HST and JER, most animals had FROH values of 0.05–0.06 and 0.06 to 0.07, respectively.
All FROH coefficients, irrespective of what length category was used to calculate the ROH, were highest for the JER population; the largest FROH statistic was obtained for FROH calculated for ROH that were larger than (or equal to) 4 Mb but smaller than 8 Mb (
The Spearman correlations (ρ) between FPED and genome-based F-statistics are given in Table 4. The correlation coefficients among all F statistics were strongest between the genome-based inbreeding estimates irrespective of the breed; the pairwise FSNP-FROH correlations ranged from ρ = 0.857 for AYR to ρ = 0.896 for JER. The FPED coefficient was weak to moderately correlated with FSNP and FROH within all breeds; the pairwise correlations between FPED and each of the genome-based coefficients were similar (e.g., for AYR, ρ = 396 for both the FPED-FSNP and FPED-FROH comparisons). The FPED coefficient was most strongly related to
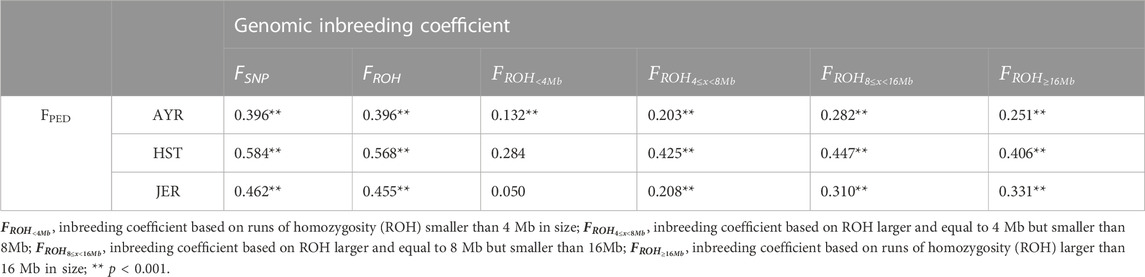
TABLE 4. Spearman correlations between the pedigree-based inbreeding coefficient (FPED) and various genomics-based inbreeding coefficients for the Ayrshire (AYR), Holstein (HST), and Jersey (JER) breeds.
3.5 Effective population size
The pedigree-based Ne estimates increased for all three dairy cattle populations in this study (Figure 5) from 85 animals (generation 1) to 497 animals (generation 10) for HST, with a similar trend in the AYR and JER populations. The JER breed had the lowest pedigree-based estimates for the oldest (376 animals) and the youngest generation (57 animals). The AYR population experienced a large difference in Ne (362 animals) between generation 9 (419 animals) and generation 1 (57 animals). The most recent (12 generations ago) LD-based Ne was lowest for the AYR breed (Ne = 131) and the largest for JER (Ne = 149).
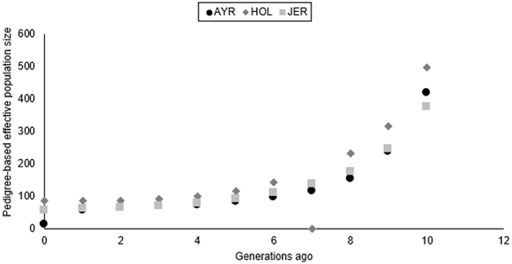
FIGURE 5. Pedigree-based estimates of effective population size (Ne) for the Ayrshire (AYR), Holstein (HST), and Jersey (JER) populations ten generations ago.
4 Discussion
To ensure sustainable breeding programs within the South African dairy industry, and to optimize the adoption of genome-based selection strategies, it is important to characterize and routinely monitor the genetic variability and inbreeding levels of the prominent dairy breeds (Howard et al., 2017). In the global dairy industry, strong directional selection, achieved by means of methodologies that favor the overuse of a few elite families (e.g., BLUP), as well as the application of advanced reproductive technologies (e.g., artificial insemination (AI)), has resulted in the accumulation of inbreeding, and hence, homozygosity (Maltecca et al., 2020). South Africa historically followed this trend of data-driven breeding programs, making use of international semen from a limited number of genetically elite bulls. In 2003, up to 36% of all dairy calves born in South Africa originated from foreign sires (Maiwashe et al., 2006). Due to the widespread use of AI, and easy access to phenotypic data and routine genotyping, the global dairy industry was the first livestock industry to embrace genome-wide enabled selection (GS) (Wiggans et al., 2011). However, in South Africa, genotyping on a commercial scale was only possible post-2016 for the dairy sector with the establishment of a DGP (Van Marle-Koster & Visser, 2018). This program was fundamental for the establishment of reference populations for the most popular dairy breeds used in the South African dairy industry (i.e., the AYR, HST, and JER breeds). The South African training populations remain small compared to many developed countries, but reflect the breed demographics on the national level and contain sufficient genotypes to assist in the genomic management of the populations. This study aimed to quantify homozygosity-based parameters of the AYR, HST, and JER populations in South Africa by using their pedigrees as well as 35,572 autosomal SNPs.
4.1 Pedigree completeness
Results from the present study indicate growing pedigree completeness over the past 10 generations with greater overall completeness in the AYR and JER populations. Traditionally, pedigree data has been used in the estimation of population diversity, but limitations on the quality and pedigree depth present limitations (the present study; Ablondi et al., 2022).
The high CGE calculated for the HST breed in this study (CGE = 11.70) aligns with previous studies of Canadian Holstein (CGE = 15.5, Stachowicz et al., 2011), Dutch Holstein (CGE = 12.5, Doekes et al., 2019), and Italian Holstein (CGE = 10.67, Ablondi et al., 2022). The JER population in this study (CGE = 10.05) is similar to that reported for Canadian Jerseys at 9.8 (Stachowicz et al., 2011) and higher than documented in Danish Jerseys (7.36; Sorensen et al., 2005). These studies, however, included data from animals born in earlier years when pedigree recording may not have been so ubiquitous. No literature was available on CGE for a genotyped AYR population. The lower CGEs for AYR and JER in the present study can be attributed to shallower pedigree depths in comparison to the HST breed due to CGE being dependent on the sum of the proportion of known ancestors over all generations traced (Wellmann and Bennewitz, 2019).
4.2 Within-breed genomic relatedness
Results of the autosomal SNP-based principal component analysis suggested a strong genetic influence of international bulls on the South African gene pool within all breeds. This result supports the fact that for all three of the studied breeds, the 25 most used AI sires (i.e., with the most daughters per breed with completed first lactations in 2021) were predominantly of international descent (SA Stud Book, 2022a; SA Stud Book, 2022b; SA Stud Book, 2022c). The greater observed heterozygosity in the HST population supported the more dispersed PCA clustering (and more outliers) and could be explained by the inclusion of more herds compared to the other breeds (1,360 animals from 411 herds for HST compared to only 510 genotyped animals from 31 herds for AYR), which would inevitably increase the extent of variation captured within the sampled population. The relatedness between a genomic selection reference population and the current (and active) population subjected to directional selection should be maintained and is integral to the accuracy of the produced genomic estimated breeding values (GEBVs) (Goddard & Hayes, 2009). Considering that genetic progress is directly related to, amongst other factors, the extent of genetic variation in a given population (Bourdon, 2000), the PCA-based results may serve as guidelines for future sampling and/or genotyping strategies to optimize genetic relatedness in genomic selection pipelines.
4.3 Runs of homozygosity detected
The profiling of genome-wide ROH has become an increasingly popular parameter for explaining genetic differences between populations; many ROH-based analyses have been conducted on global dairy breeds (e.g., Purfield et al., 2012; Mastrangelo et al., 2018; Doekes et al., 2020). Comparing these studies is, however, not trivial due to differences in the extent of genomic information available (higher density genotypes are expected to capture ROH profiles more comprehensively) and the methodologies used to detect ROH including the parameters specified when detecting an ROH (Gautason et al., 2021; Mulim et al., 2022). Interbreed differences in ROH number and length characteristics indicate historical differences between breeds within a certain country or region, or due to recent management actions (Xu et al., 2019). Although the HST and JER populations in the present study had similar numbers of individuals genotyped, 66% more ROH was detected in the JER (37,617 for JER compared to 22,674 for HST). The difference in the abundance of ROH segments relative to the AYR in the present study could have been influenced by the much smaller genotyped AYR population. Taking the sample sizes into account, the JER still had the most ROH per individual, but the AYR had more ROH per individual than the HST, irrespective of the detection method.
Despite the higher ROH counts observed for the JER population, the percentage genome coverage by autozygotic segments was the highest for the HST population (10.02%), followed by the AYR (8.80%) and JER (8.78%) populations. The percentage coverage was similar to the 10% reported by Kim et al. (2013) in US Holsteins and the 9.8% documented by Gautason et al. (2021) in Icelandic cattle. The higher proportion of large ROH segments (≥16 Mb) in the present study, representing inbreeding effects introduced up to ∼6 generations ago (Ferenčaković, 2015), observed for the HST population (CR: 0.079; SW: 0.109) implies a greater influence of more recent inbreeding in the population studied. Conversely, the higher proportion of short (<4 Mb in size) ROHs is indicative of older inbreeding effects and/or, possibly, recent admixture (and, hence, recombination) that could result in the breakdown of larger ROH (Purfield et al., 2012; Liu et al., 2021). Liu et al. (2021), for example, reported that ROHs as short as <1 Mb may be a result of ancestral inbreeding that occurred up to 50 generations ago; these related mating would be almost impossible to capture with pedigree information alone (especially considering the poor participation of South African dairy breeds in pedigree recording). It is clear that an analysis of ROH abundance and distribution can, therefore, be used to more comprehensively (and descriptively) explore genetic diversity within and between populations.
The percentage occurrence of SNPs residing within identified ROH was analyzed to identify overlapping genomic regions of autozygosity among animals within breeds. These overlapping regions could be the result of positive selection and could be indicative of adaptation to specific environmental conditions (Xu et al., 2019). The most frequent overlapping region identified in the present study was similar to those documented by Lozada-Soto et al. (2022) for North American dairy breeds; in agreement with Lozada-Soto et al. (2022), ROH hotspots (i.e., containing the highest SNP incidence within ROH segments) were also identified on BTA6 for AYR, BTA20 for HST, and BTA7 for JER. Two hotspots of homozygosity on BTA7 (base pairs: 41417884-42609605, and 42811272-45412030 base pairs) were in 70.96% and 70.88%, respectively, of the JER breed in the present study; these regions fall within the most gene-dense ROH island also documented for US Jersey (BTA7: 39.76-45.56Mb; Lozada-Soto et al., 2022).
Amongst the 35 protein-coding genes located in the first preserved region identified in the present study, is the LYPD8 gene, which has been suggested to play a role in intestinal immunity in mice (Hsu et al., 2021) and more recently in sheep (Chen et al., 2022). The HSPA4 gene, identified within the second most conserved region in the JER, is a heat shock protein (HSP) 70 gene and is well known for its integral role in cellular stress response to heat (Deb et al., 2014). Because of its lower body weight and, consequently, lower maintenance requirements, the JER breed is growing in popularity globally, especially given concerns over climate change and the expected increase in environmental stressors. The identification of conserved ROH segments containing genes, such as the prolactin receptor (PRLR) gene, highlights the higher selective pressure for milk productivity (Zhang et al., 2008) in HST. Regions overlapping with genes that are associated with heat stress and immune response (e.g., PPEF2 for AYR as well as ELANE, and LEAP2 for JER) further support the integral role that these breeds may play in the future sustainability of the South African dairy industry.
4.4 Inbreeding coefficients
As would be expected for dairy cattle populations, given factors such as the increased utilization of AI and other reproductive technologies compared to, for example, beef cattle, all inbreeding coefficients estimated in the present study suggested inbreeding is occurring. The FPED values were generally lower than inbreeding estimates calculated from the genomic data. Perfect concordance was not expected between the FPED values and those estimated using genomic information for several reasons including: 1) pedigree information will not always be complete all the way to the founder population, 2) the Meuwissen and Luo (1992) algorithm to estimate inbreeding assumes that animals in the pedigree with no recorded parents are unrelated and non-inbred, 3) pedigree errors undoubtedly exist (e.g., Sanarana et al., 2021), and 4) FPED are based on expected relationships among individuals and cannot consider the variability that exists around this expectation owing to Mendelian sampling during gametogenesis (Kenny et al., 2023). The discrepancy between FSNP and FROH may be attributed to the fact that FSNP does not differentiate between alleles that are identical by descent (IBD) or identical by state (IBS) (Forutan et al., 2018) whereas FROH is influenced by, among other factors, the genome build (i.e., the reported position of each SNP relative to others) and SNP genotyping panel density. The suitability of each of the genomic measures is, therefore, dependent on the data available. The FROH coefficient is, however, more informative because of the additional information that the ROH length, for example, provides about the inbreeding history.
However, the means for FPED (ranging from 0.051 for AYR to 0.064 for HST), as well as FSNP (ranging from 0.02 for HST to 0.19 for JER) and FROH (ranging from 0.053 for AYR to 0.085 for JER), were similar in trend (albeit slightly lower in values) to those observed by Lozada-Soto et al. (2022) for North American dairy cattle; Lozada-Soto et al. (2022) reported FPED means ranging from 0.06 for AYR to 0.08 for HST and JER, and FROH means ranging from 0.11 for AYR to 0.17 for JER. The effect of incomplete pedigree on the estimates of inbreeding is well documented (e.g., Lutaaya et al., 1999; Marshall et al., 2002; Cassell et al., 2003), and it is generally accepted that incomplete and inaccurate pedigree recording leads to an underestimation of pedigree-based inbreeding coefficients. Tested against FPED per breed, the Spearman correlations with both FSNP and length-specific FROH estimates were weak to moderate and slightly weaker than, but comparable to, those reported by, for example, Gautason et al. (2021) using a 50,000 SNP genotyping panel on over 8,000 Icelandic cattle (ρ for FPED-FIS = 0.52; ρ for FPED-FROH = 0.63). Cortes-Hernández et al. (2021) observed similarly weak correlations between FPED and genome-based coefficients (e.g., 0.39 with FSNP and 0.30 with FROH) in a small Mexican Holstein population genotyped for 100,806 SNPs. Nonetheless, the pairwise correlations between FPED and FROH improved as ROH length increased. Irrespective of breed, the correlation between FPED and FROH<4MB was the weakest of all correlations between FPED and length-specific FROH coefficients. This observation agrees with previous suggestions that correlations between FPED and FROH strengthen when the shortest ROH fragments (typically those less than 4 Mb) are not considered in the calculation (Purfield et al., 2012). The phenomenon of a strengthening correlation between FPED and FROH as ROH length increases suggests that the relationship between FPED and FROH is probably influenced by the breed-specific pedigree depth (Cortes-Hernández et al., 2021). Many previous studies have reported stronger FPED-FROH correlations for populations with deeper recorded pedigree (e.g., Purfield et al., 2012; Ferenčaković, 2015; Peripolli et al., 2018), as was the case with the HST (pedigree depth = 11.70; ρ for FPED-FROH≥16Mb = 0.406) compared to AYR (pedigree depth = 9.75; ρ for FPED-FROH≥16Mb = 0.251). Considering the generally low within-breed participation in pedigree recording for South African dairy breeds (as low as 24%; Van Marle-Köster & Visser, 2018), the accuracy of pedigree-based inbreeding coefficients (and by extension relationships between individuals) should be interpreted with caution.
4.5 Effective population size
Factors that influence Ne estimates include the constant change in the real population size, unequal sex ratios, and the variance in the number of offspring per parent (Nielsen and Slatkin, 2013). A reduction in Ne in livestock is generally the consequence of selection pressure on traits of economic importance, exacerbated by the use of a few high-impact sires via reproductive technologies (Mulim et al., 2022). The pedigree-based Ne estimates of the youngest animals in the present study all exceed the FAO guideline of 50 animals (OECD-FAO, 2019) but it must be noted that they have all reduced substantially over the last 10 generations. Canadian, Danish, Dutch, Irish, Italian, and US HST populations have reported pedigree-based Ne of the youngest generation to be 39, 70, 49, 75, and 39 (Weigel, 2001; Sorensen et al., 2005; McParland et al., 2007; Makanjuola et al., 2020; Ablondi et al., 2022) animals, respectively. The South African HST population had the highest Ne (i.e., 85) of the three South African dairy breeds investigated in the present study which may be a consequence of the greater completeness of the pedigree used and/or the use of a larger number of genetically dissimilar sires sourced from multiple countries. Sorensen et al. (2005) reported the pedigree-based Ne of Danish Jersey cattle to be 116 while Stachowicz et al. (2011) reported a pedigree-based Ne of 54 for Canadian Jersey. A more recent study on Canadian Jersey cattle populations suggested an Ne of 49 animals (Makanjuola et al., 2020). Estimates of Ne for the South African Jersey yielded a similar low of 57 animals, as well as South African AYR with a Ne of 57 nine generations ago which points to lower genetic diversity within these two breeds in comparison to the HST breed. Although previously reported Ne estimates vary widely amongst populations, Brotherstone & Goddard (2005) reported that the Ne of most modern dairy cattle populations is circa. 100. The predictions for the South African dairy populations are also between 50 and 100 animals. Because of the hyperbolic relationship between LD (r2) and Ne, more recent (i.e., fewer generations ago), estimates of genome-based Ne are possible with a greater density of SNPs and, therefore, is better at capturing population-wide LD (Barbato et al., 2015). Genomic optimum contribution selection may be a viable tool for dairy breeding programs as it will increase genetic merit while maintaining genetic diversity (Clark et al., 2013). Genetic gain of South African dairy breeds may increase due to the current use of GEBVs (Van der Westhuizen and Mostert, 2020) and will aid in minimizing the loss of fitness by preventing any further reduction in Ne. Although the current Ne rates indicate that inbreeding is well-managed, it should still be monitored regularly to avoid adverse effects in future generations.
5 Conclusion
The South African AYR has always been a small population serving a niche market, while the South African HST and JER breeds are mainly responsible for the fresh milk supply. It will be important for these breeds to grow and maintain their reference populations and ensure that international bull families and genotypes are available for genetic evaluations and continuous monitoring of diversity and inbreeding. This study confirmed the usefulness of SNP genotypes for accurately assessing autozygosity and inbreeding levels, and the impact of these on the management of genetic resources. The analyzed results support the influence of globalized dairy germplasm and their observed influences on the genetic diversity within the JER, HST, and AYR reference populations in South Africa thus far. Since the erosion of genetic diversity limits long-term genetic gain and impedes resilience and sustainability amidst future challenges, these results may assist in strategies to improve and update reference populations for genomic selection.
Data availability statement
The data analyzed in this study is subject to the following licenses/restrictions: Genomic data was obtained from SA Stud Book, a local service provider of genetic and genomic analyses in South Africa. The data thus belongs to third parties (SA Stud Book and Breed Societies). Requests to access these datasets should be directed to the corresponding authors.
Ethics statement
The animal study was reviewed and approved by University of Pretoria’s Ethics Committee (EC170627-135). Written informed consent was obtained from the owners for the participation of their animals in this study.
Author contributions
CV conceptualized the project. CV and SL prepared the first draft. SL and JR performed the statistical analyses. All authors contributed to writing the discussion and editing the final manuscript.
Funding
All dairy cattle genotypes used in the analyses were generated within the SA Dairy Genomic Program funded by the Technology Innovation Agency (Grant number: DGP004).
Acknowledgments
Authors wish to acknowledge the permission from the respective breed societies to use the genotypes for this study.
Conflict of interest
The authors declare that the research was conducted in the absence of any commercial or financial relationships that could be construed as a potential conflict of interest.
Publisher’s note
All claims expressed in this article are solely those of the authors and do not necessarily represent those of their affiliated organizations, or those of the publisher, the editors and the reviewers. Any product that may be evaluated in this article, or claim that may be made by its manufacturer, is not guaranteed or endorsed by the publisher.
Supplementary material
The Supplementary Material for this article can be found online at: https://www.frontiersin.org/articles/10.3389/fgene.2023.1136078/full#supplementary-material
Supplementary Material S1 | A figure showing the number of run of homozygosity (ROH) per chromosome on the primary axis (bar graphics), as well as the chromsome-wise ROH coverage on the secondary axis (line graphs), for the Ayrshire (AYR), Holstein (HST), AND Jersey (JER) population.
Supplementary Material S2 | Contingency tables of the frequency of animals within different classes of pedigree-based inbreeding coefficients (FPED) that fell within three categories (low, medium, and high) of genomics-based inbreeding coefficients (FSNP, and FROH) for the Ayrshire (AYR), Holstein (HST), and Jersey (JER) breeds.
References
Ablondi, M., Sabbioni, A., Stocco, G., Cipolat-Gotet, C., Dadousis, C., van Kaam, J-T., et al. (2022). Genetic diversity in the Italian Holstein dairy cattle based on pedigree and SNP data prior and after genomic selection. Front. Vet. Sci. 8, 773985. doi:10.3389/fvets.2021.773985
Banga, C., Neser, F. W. C., and Garrick, D. J. (2014). Breeding objectives for Holstein cattle in South Africa South African. J. Animal Sci. 44 (3), 199–214. doi:10.4314/sajas.v44i3.1
Barbato, M., Orozco-terWengel, P., Tapio, M., and Bruford, M. W. (2015). SNeP: A tool to estimate trends in recent effective population size trajectories using genome-wide SNP data. Front. Genet. 6, 109. doi:10.3389/fgene.2015.00109
Biscarini, F., Cozzi, P., Gaspa, G., and Marras, G. (2019). detectRUNS: an R package to detect runs of homozygosity and heterozygosity in diploid genomes. Available at: https://cran.rproject.org/web/packages/detectRUNS/vignettes/detectRUNS.vignette.html#references.
Bourdon, R. M. (2000). Understanding animal breeding (Vol. 2). Upper Saddle River, NJ: Prentice-Hall.
Brotherstone, S., and Goddard, M. (2005). Artificial selection and maintenance of genetic variance in the global dairy cow population. Philosophical Trans. R. Soc. Biol. Sci. 360, 1479–1488. doi:10.1098/rstb.2005.1668
Cassell, B. G., Adamec, V., and Pearson, R. E. (2003). Effect of incomplete pedigrees on estimates of inbreeding and inbreeding depression for days to first service and summit milk yield in Holsteins and Jerseys. J. Dairy Sci. 86 (9), 2967–2976. doi:10.3168/jds.S0022-0302(03)73894-6
Chen, W., Lv, X., Zhang, W., Hu, T., Cao, X., Ren, Z., et al. (2022). Insights into long non-coding RNA and mRNA expression in the jejunum of lambs challenged with Escherichia coli F17. Front. Vet. Sci. 9, 819917. doi:10.3389/fvets.2022.819917
Clark, S. A., Kinghorn, B. P., Hickey, J. M., and van der Werf, J. H. (2013). The effect of genomic information on optimal contribution selection in livestock breeding programs. Genet. Sel. Evol. 45, 1–8.
Cole, J. B., and VanRaden, P. M. (2018). Symposium review: Possibilities in an age of genomics: The future of selection indices. J. Dairy Sci. 101 (4), 3686–3701. doi:10.3168/jds.2017-13335
Cortes-Hernández, J., García-Ruiz, A., Vásquez-Peláez, C. G., and Ruiz-Lopez, F. D. J. (2021). Correlation of genomic and pedigree inbreeding coefficients in small cattle populations. Animals 11 (11), 3234. doi:10.3390/ani11113234
Deb, R., Sajjanar, B., Singh, U., Kumar, S., Singh, R., Sengar, G., et al. (2014). Effect of heat stress on the expression profile of Hsp90 among sahiwal (Bos indicus) and frieswal (Bos indicus× Bos taurus) breed of cattle: A comparative study. Gene 536 (2), 435–440. doi:10.1016/j.gene.2013.11.086
Dixit, S. P., Singh, S., Ganguly, I., Bhatia, A. K., Sharma, A., Kumar, N. A., et al. (2020). Genome-wide runs of homozygosity revealed selection signatures in Bos indicus. Front. Genet. 11, 92. doi:10.3389/fgene.2020.00092
Doekes, H. P., Veerkamp, R. F., Bijma, P., de Jong, G., Hiemstra, S. J., and Windig, J. J. (2019). Inbreeding depression due to recent and ancient inbreeding in Dutch Holstein–Friesian dairy cattle. Genet. Sel. Evol. 51 (1), 54–16. doi:10.1186/s12711-019-0497-z
Doekes, H. P., Bijma, P., Veerkamp, R. F., De Jong, G., Wientjes, Y. C. J., and Windig, J. J. (2020). Inbreeding depression across the genome of Dutch Holstein Friesian dairy cattle. Genet. Sel. Evol. 52, 64. doi:10.1186/s12711-020-00583-1
Duvenhage, H. (2017). How well do you know your Holstein history? Dairy Mail 24 (2), 112–113. doi:10.10520/EJC-59ed8f8ff
Felius, M., Beerling, M. L., Buchanan, D. S., Theunissen, B., Koolmees, P. A., and Lenstra, J. A. (2014). On the history of cattle genetic resources. Diversity 6 (4), 705–750. doi:10.3390/d6040705
Ferenčaković, M. (2015). Molecular dissection of inbreeding depression for semen quality traits in cattle. Doctoral dissertation. University of Zagreb. Faculty of Agriculture.
Forutan, M., Ansari Mahyari, S., Baes, C., Melzer, N., Schenkel, F. S., and Sargolzaei, M. (2018). Inbreeding and runs of homozygosity before and after genomic selection in North American Holstein cattle. BMC Genomics 19, 98–12. doi:10.1186/s12864-018-4453-z
Gautason, E., Schönherz, A. A., Sahana, G., and Guldbrandtsen, B. (2021). Genomic inbreeding and selection signatures in the local dairy breed Icelandic Cattle. Anim. Genet. 52, 251–262. doi:10.1111/age.13058
Goddard, M. E., and Hayes, B. J. (2009). Mapping genes for complex traits in domestic animals and their use in breeding programmes. Nat. Rev. Genet. 10 (6), 381–391. doi:10.1038/nrg2575
Gorssen, W., Meyermans, R., Janssens, S., and Buys, N. (2021). A publicly available repository of ROH islands reveals signatures of selection in different livestock and pet species. Genet. Sel. Evol. 53 (1), 2–10. doi:10.1186/s12711-020-00599-7
Howard, R., Carriquiry, A. L., and Beavis, W. D. (2017). Application of response surface methods to determine conditions for optimal genomic prediction. G3: Genes, Genomes, Genet. 7 (9), 3103–3113. doi:10.1534/g3.117.044453
Howrigan, D. P., Simonson, M. A., and Keller, M. C. (2011). Detecting autozygosity through runs of homozygosity: A comparison of three autozygosity detection algorithms. BMC genomics 12 (1), 1–15. doi:10.1186/1471-2164-12-460
Hsu, C-C., Okumura, R., Motooka, D., Sasaki, R., Nakamura, S., Iida, T., et al. (2021). Alleviation of colonic inflammation by Lypd8 in a mouse model of inflammatory bowel disease. Int. Immunol. 33 (7), 359–372. doi:10.1093/intimm/dxab012
INTERBULL (2022). International bull evaluation service (INTERBULL). https://interbull.org/ib/cop_chap2 (Accessed November 22, 2022).
Kenny, D., Berry, D. P., Pabiou, T., and Rafter, P. (2023). Variation in the proportion of the segregating genome shared between full-sibling cattle and sheep. Genetics, Selection, Evolution. (in Press).
Kim, E. S., Cole, J. B., Huson, H., Wiggans, G. R., Van Tassell, C. P., Crooker, B. A., et al. (2013). Effect of artificial selection on runs of homozygosity in US Holstein cattle. PloSone 8 (11), e80813. doi:10.1371/journal.pone.0080813
Liu, D., Chen, Z., Zhao, W., Guo, L., Sun, H., Zhu, K., et al. (2021). Genome-wide selection signatures detection in Shanghai Holstein cattle population identified genes related to adaption, health and reproduction traits. BMC Genomics 22, 747. doi:10.1186/s12864-021-08042-x
Lozada-Soto, E. A., Tiezzi, F., Jiang, J., Cole, J. B., VanRaden, P. M., and Maltecca, C. (2022). Genomic characterization of autozygosity and recent inbreeding trends in all major breeds of US dairy cattle. J. Dairy Sci. 105 (11), 8956–8971. doi:10.3168/jds.2022-22116
Lutaaya, B. E., Misztal, I., Bertrand, J. K., and Mabry, J. W. (1999). Inbreeding in populations with incomplete pedigrees. J. Animal Breed. Genet. 116 (6), 475–480. doi:10.1046/j.1439-0388.1999.00210.x
Maiwashe, A., Nephawe, K. A., Van der Westhuizen, R. R., Mostert, B. E., and Theron, H. E. (2006). Rate of inbreeding and effective population size in four major South African dairy cattle breeds. South Afr. J. Animal Sci. 36 (1), 50–57. doi:10.4314/sajas.v36i1.3986
Makanjuola, B. O., Miglior, F., Abdalla, E. A., Maltecca, C., Schenkel, F. S., and Baes, C. F. (2020). Effect of genomic selection on rate of inbreeding and coancestry and effective population size of Holstein and Jersey cattle populations. J. Dairy Sci. 103 (6), 5183–5199. doi:10.3168/jds.2019-18013
Makanjuola, B. O., Maltecca, C., Miglior, F., Marras, G., Abdalla, E. A., Schenkel, F. S., et al. (2021). Identification of unique ROH regions with unfavorable effects on production and fertility traits in Canadian Holsteins. Genet. Sel. Evol. 53 (1), 68–11. doi:10.1186/s12711-021-00660-z
Maltecca, C., Tiezzi, F., Cole, J. B., and Baes, C. (2020). Symposium review: Exploiting homozygosity in the era of genomics—selection, inbreeding, and mating programs. J. Dairy Sci. 103 (6), 5302–5313. doi:10.3168/jds.2019-17846
Marras, G., Gaspa, G., Sorbolini, S., Dimauro, C., Ajmone-Marsan, P., Valentini, A., et al. (2015). Analysis of runs of homozygosity and their relationship with inbreeding in five cattle breeds farmed in Italy. Anim. Genet. 46 (2), 110–121. doi:10.1111/age.12259
Marshall, T. C., Coltman, D. W., Pemberton, J. M., Slate, J., Spalton, J. A., Guinness, F. E., et al. (2002). Estimating the prevalence of inbreeding from incomplete pedigrees. Proc. R. Soc. Lond. Ser. B: Biol. Sci. 269 (1500), 1533–1539. doi:10.1098/rspb.2002.2035
Mastrangelo, S., Sardina, M. T., Tolone, M., Di Gerlando, R., Sutera, A. M., Fontanesi, L., et al. (2018). Genome-wide identification of runs of homozygosity islands and associated genes in local dairy cattle breeds. Animal 12 (12), 2480–2488. doi:10.1017/S1751731118000629
McParland, S., Kearney, J. F., Rath, M., and Berry, D. P. (2007). Inbreeding effects on milk production, calving performance, fertility, and conformation in Irish Holstein-Friesians. J. Dairy Sci. 90, 4411–4419. doi:10.3168/jds.2007-0227
McQuillan, R., Leutenegger, A. L., Abdel-Rahman, R., Franklin, C. S., Pericic, M., Barac-Lauc, L., et al. (2008). Runs of homozygosity in European populations. Am. J. Hum. Genet. 83 (3), 359–372. doi:10.1016/j.ajhg.2008.08.007
Meuwissen, T. H. E., and Luo, Z. (1992). Computing inbreeding coefficients in large populations. Genet. Sel. Evol. 24, 305–313. doi:10.1186/1297-9686-24-4-305
Meyermans, R., Gorssen, W., Buys, N., and Janssens, S. (2020). How to study runs of homozygosity using PLINK? A guide for analyzing medium density SNP data in livestock and pet species. BMC Genomics 21 (1), 94–14. doi:10.1186/s12864-020-6463-x
Mostert, B. E., Groeneveld, E., and Kanfer, F. H. J. (2004). Testday models for production traits in dairy cattle. South Afr. J. Animal Sci. 24 (2), 35–37. doi:10.10520/EJC94421
Mostert, B. E., Theron, H. E., Kanfer, F. H. J., and van Marle-Köster, E. (2006). Test-day models for South African dairy cattle for participation in international evaluations. South Afr. J. Animal Sci. 36, 1. doi:10.4314/sajas.v36i1.3987
Mulim, H. A., Brito, L. F., Pinto, L. F. B., Ferraz, J. B. S., Grigoletto, L., Silva, M. R., et al. (2022). Characterization of runs of homozygosity, heterozygosity-enriched regions, and population structure in cattle populations selected for different breeding goals. BMC Genomics 23, 209. doi:10.1186/s12864-022-08384-0
Nel, G. D. (1968). Historical origin of Jerseys (extract from “Jerseys of S.A.”). Available at: https://www.jerseysa.co.za/Breed-History.htm (Accessed November 10, 2022).
Nielsen, R., and Slatkin, M. (2013). An introduction to population genetics: theory and applications. Sunderland, MA, United States: Sinauer.
Opoola, O., Banos, G., Ojango, J. M., Mrode, R., Simm, G., Banga, C. B., et al. (2020). Joint genetic analysis for dairy cattle performance across countries in sub-Saharan Africa. South Afr. J. Animal Sci. 50 (4), 507–520. doi:10.4314/sajas.v50i4.3
Orton, J., Mitchell, P., Klein, R., Steele, T., and Horsburgh, K. A. (2013). An early date for cattle from namaqualand, South Africa: Implications for the origins of herding in southern Africa. Antiquity 87, 108–120. doi:10.1017/S0003598X00048651
Peripolli, E., Munari, D. P., Silva, M. V. G. B., Lima, A. L. F., Irgang, R., and Baldi, F. (2017). Runs of homozygosity: Current knowledge and applications in livestock. Anim. Genet. 48 (3), 255–271. doi:10.1111/age.12526
Peripolli, E., Stafuzza, N. B., Munari, D. P., Lima, A. L. F., Irgang, R., Machado, M. A., et al. (2018). Assessment of runs of homozygosity islands and estimates of genomic inbreeding in Gyr (Bos indicus) dairy cattle. BMC Genomics 19, 34. doi:10.1186/s12864-017-4365-3
Purcell, S., Neale, B., Todd-Brown, K., Thomas, L., Ferreira, M. A., Bender, D., et al. (2007). Plink: A tool set for whole-genome association and population-based linkage analyses. Am. J. Hum. Genet. 81 (3), 559–575. doi:10.1086/519795
Purfield, D. C., Berry, D. P., McParland, S., and Bradley, D. G. (2012). Runs of homozygosity and population history in cattle. BMC Genet. 13 (1), 70–11. doi:10.1186/1471-2156-13-70
R Core Team (2013). R: A language and environment for statistical computing. Vienna: R Foundation for Statistical Computing. Available at: http://www.R-project.org/.
SA Stud Book (2022a). SA Stud Book Ayrshire and related types annual report 2021–2022. Pretoria, South Africa.
SA Stud Book (2022b). SA Stud Book Holstein, friesland and related types annual report 2021–2022. Pretoria, South Africa.
SA Stud Book (2022c). SA Stud Book Jersey and related types annual report 2021–2022. Pretoria, South Africa.
Saif-ur-Rehman, M., Hassan, F. U., Reecy, J., and Deng, T. (2022). Whole-genome SNP markers reveal runs of homozygosity in indigenous cattle breeds of Pakistan. Anim. Biotechnol. [Preprint], 1–13. doi:10.1080/10495398.2022.2026369
Sanarana, Y. P., Maiwashe, A., Berry, D. P., Banga, C., and van Marle-Köster, E. (2021). Evaluation of the International Society for Animal Genetics bovine single nucleotide polymorphism parentage panel in South African Bonsmara and Drakensberger cattle. Trop. Animal Health Prod. 53, 32–38. doi:10.1007/s11250-020-02481-6
Sorensen, A. C., Sorenson, M. K., and Berg, P. (2005). Inbreeding in Danish dairy cattle breeds. J. Dairy Sci. 94 (10), 1865–1872. doi:10.3168/jds.S0022-0302(05)72861-7
Stachowicz, K., Sargolzaei, M., Miglior, F., and Schenkel, F. S. (2011). Rates of inbreeding and genetic diversity in Canadian Holstein and Jersey cattle. J. Dairy Sci. 94 (10), 5160–5175. doi:10.3168/jds.2010-3308
Sved, J. A. (1971). Linkage disequilibrium and homozygosity of chromosome segments in finite populations. Theor. Popul. Biol. 2 (2), 125–141. doi:10.1016/0040-5809(71)90011-6
Van der Westhuizen, R. R., and Mostert, B. (2020). Authentic South African genomic breeding values for the local dairy industry. Stockfarm 10 (6), 47. doi:10.10520/EJC-1f6450d139
Van Marle-Köster, E., and Visser, C. (2018). Genetic improvement in South African livestock: Can genomics bridge the gap between the developed and developing sectors? Front. Genet. 9, 331. doi:10.3389/fgene.2018.00331
Weigel, K. A. (2001). Controlling inbreeding in modern breeding programs. J. Dairy Sci. 84, E177–E184. doi:10.3168/jds.S0022-0302(01)70213-5
Wellmann, R., and Bennewitz, J. (2019). Key genetic parameters for population management. Front. Genet. 10, 667. doi:10.3389/fgene.2019.00667
Wiggans, G. R., Cooper, T. A., VanRaden, P. M., and Cole, J. B. (2011). Technical note: Adjustment of traditional cow evaluations to improve accuracy of genomic predictions. J. Dairy Sci. 94 (12), 6188–6193. doi:10.3168/jds.2011-4481
Wright, S. (1978). Variability within and among Natural Population, 4. Chicago, IL: University of Chicago Press.Evolution and the genetics of populations
Xu, L., Zhao, G., Yang, L., Zhu, B., Chen, Y., Zhang, L., et al. (2019). Genomic patterns of homozygosity in Chinese local cattle. Sci. Rep. 9, 16977. doi:10.1038/s41598-019-53274-3
Yang, J., Benyamin, B., McEvoy, B. P., Gordon, S., Henders, A. K., Nyholt, D. R., et al. (2010). Common SNPs explain a large proportion of the heritability for human height. Nature genet. 42 (7), 565–569. doi:10.1038/ng.608
Yang, J., Lee, S. H., Goddard, M. E., and Visscher, P. M. (2011). Gcta: A tool for genome-wide complex trait analysis. Am. J. Hum. Genet. 88 (1), 76–82. doi:10.1016/j.ajhg.2010.11.011
Keywords: autozygosity, cattle, inbreeding, pedigree, runs of homozigosity, single nucleotide polymorphism
Citation: Visser C, Lashmar SF, Reding J, Berry DP and van Marle-Köster E (2023) Pedigree and genome-based patterns of homozygosity in the South African Ayrshire, Holstein, and Jersey breeds. Front. Genet. 14:1136078. doi: 10.3389/fgene.2023.1136078
Received: 02 January 2023; Accepted: 02 March 2023;
Published: 17 March 2023.
Edited by:
Isidore Houaga, University of Edinburgh, United KingdomReviewed by:
Tesfaye Getachew, International Center for Agriculture Research in the Dry Areas (ICARDA), EthiopiaEui-Soo Kim, Recombinetics, United States
Copyright © 2023 Visser, Lashmar, Reding, Berry and van Marle-Köster. This is an open-access article distributed under the terms of the Creative Commons Attribution License (CC BY). The use, distribution or reproduction in other forums is permitted, provided the original author(s) and the copyright owner(s) are credited and that the original publication in this journal is cited, in accordance with accepted academic practice. No use, distribution or reproduction is permitted which does not comply with these terms.
*Correspondence: Carina Visser, carina.visser@up.ac.za