 Saba Akram*
 Maria Ghaffar
 Ayesha Wadood
 Sajid Shokat
 Amjad HameedMuhammad Qandeel Waheed
 Mian Abdur Rehman Arif*
- Nuclear Institute for Agriculture and Biology College, Pakistan Institute of Engineering and Applied Sciences (NIAB-C, PIEAS), Faisalabad, Pakistan
High salinity levels affect 20% of the cultivated area and 9%–34% of the irrigated agricultural land worldwide, ultimately leading to yield losses of crops. The current study evaluated seven salt tolerance-related traits at the seedling stage in a set of 138 pre-breeding lines (PBLs) and identified 63 highly significant marker-trait associations (MTAs) linked to salt tolerance. Different candidate genes were identified in in silico analysis, many of which were involved in various stress conditions in plants, including glycine-rich cell wall structural protein 1-like, metacaspase-1, glyceraldehyde-3-phosphate dehydrogenase GAPA1, and plastidial GAPA1. Some of these genes coded for structural protein and participated in cell wall structure, some were linked to programmed cell death, and others were reported to show abiotic stress response roles in wheat and other plants. In addition, using the Multi-Trait Genotype-Ideotype Distance Index (MGIDI) protocol, the best-performing lines under salt stress were identified. The SNPs identified in this study and the genotypes with favorable alleles provide an excellent source to impart salt tolerance in wheat.
Introduction
Salt stress is caused by an abundance of sodium chloride (NaCl) from irrigation with brackish water and crop evaporation (Flowers and Flowers, 2005). A saline soil can be characterized as one with electric conductivity (EC) >4 dS m−1 at 25°C and 15% exchangeable sodium. As much as 20% of the cultivated area and 9%–34% of the irrigated agricultural land worldwide is affected by high salinity (Ghassemi et al., 1995), which ultimately leads to yield losses in crops (Jamil et al., 2011). Salinity affects >20% of modern agriculture (Li et al., 2020), making it a significant hurdle for sustainable agriculture production (Shokat and Großkinsky, 2020). Salinity affects plant growth by affecting two basic components of mineral transportation; initially, plants experience osmotic stress, which results in ion deposition and ensuing toxicity (Flowers and Flowers, 2005; Verslues et al., 2006; Munns and Tester, 2008).
While the wheat plant (Triticum aestivum L.) has moderate tolerance to salinity (Saddiq et al., 2019), significant yield losses still occur due to soil salinization (Oyiga et al., 2016). At 6–8 dS m−1 (Royo and Abió, 2003), wheat plants undergo metabolic changes that alter their life functions (Chen et al., 2016; Acosta-Motos et al., 2017). Furthermore, due to excess Na+ ion accumulation and low water potential of soil, hyperosmotic and hyper-ionic stress occur, in addition to primary stresses (Huang et al., 2010). These results manifest as decreased germination percentage, reduced growth, reduced yield, and changes in reproductive behavior (Hasanuzzaman et al., 2017). Among important field crops, salinity causes more damage to wheat throughout its life cycle starting from germination to maturity. Moreover, the flowering to grain filling period is the most affected stage under salt stress, which eventually leads to low grain production. In Pakistan, average wheat yield losses of up to 65% are reported in moderately saline soils (Shafi et al., 2010). Thus, it is necessary to convene all available tools of conventional and modern plant breeding tools as well as agronomic practices to hasten the development of salt-tolerant cultivars that can meet this increasing demand (Ashraf and Harris, 2004; El Sabagh et al., 2021).
Different genes are involved in the regulation of salt stress and play roles in improving plant performance under salt stress by regulating diverse mechanisms including the antioxidant defense system, Na+ exclusion, maintenance of Na+/K+ homeostasis, transpiration efficiency, and cytosolic K+ retention (Shabala and Munns, 2012; Rahman et al., 2016). Several strategies are used to increase yield under salt stress using conventional breeding tools (Hasanuzzaman et al., 2017). Several characteristics are used as indicators for wheat salinity tolerance (Colmer et al., 2006), including Na+ exclusion (the ability to minimize Na+ concentrations entering the xylem) (Munns, 2005). Salt tolerance is a quantitative trait for which numerous quantitative trait loci (QTL) have been reported in wheat at the germination, seedling, and maturity stages, as well as plant survival (Zhou et al., 2012). Previous studies suggested that the shoot Na+ exclusion phenotype is associated with two genes: Nax1 (present at 2A) and Nax2 (present at 5A) in durum wheat, a close relative of bread wheat (James et al., 2011). Many QTLs linked to salt stress tolerance in wheat have been studied previously; e.g., 65 QTLs linked to 13 different seedling traits of wheat have been identified (Masoudi et al., 2015). Similarly, QTLs associated with NAX were mapped to chromosome 2A and were responsible for a 10% increase in wheat biomass under salinity stress. Two QTLs—qRNAX.7 A.3 and qSNAX.7A.3—mapped on chromosome 7A both showed 11% and 16% increases in salinity tolerance in wheat (Hussain et al., 2017). GWAS studies have also been conducted to identify QTLs and candidate genes linked to salinity stress in barley. Xue et al. (2009) identified 30 QTLs linked to ten different traits under salinity stress that accounted for 3%–30% the total phenotypic variation. Additionally, HvNaX3 was mapped on the 7H chromosome of barley and was linked to salt stress tolerance (Sayed et al., 2021).
Due to the involvement of only two parents in the development of bi-parental populations, the QTL mapping approach fails to disclose the entire genetic architecture for salt tolerance (Shi et al., 2017). Therefore, genome-wide association studies (GWAS) were devised in which natural populations of hundreds of individuals with low genetic relationships are used to map desirable markers, known as marker-trait associations (MTAs) (Liu et al., 2017; Akram et al., 2021). The principle of GWAS is the linkage disequilibrium (LD), which is used to identify the relationship associations between a large number of DNA variants and traits in several genotypes from natural populations (Hu et al., 2011; Mwando et al., 2020). GWAS is a useful tool to genetically dissect biotic (Jighly et al., 2015; Arif et al., 2022; Dababat et al., 2021) and abiotic stress tolerance (Arif et al., 2012; Turki et al., 2015), physiological (Arif et al., 2021) adaptability traits (Akram et al., 2021), and nutrient uptake (Sharma et al., 2022) in wheat. While a plethora of indices has been devised to identify the best genotypes under a given environment/stress, many challenges still exist (Bizari et al., 2017). Owing to the limitations posed by previous indices (Céron-Rojas and Crossa, 2018), a new index was recently proposed based on genotype-ideotype distance and factorial analysis, which focused on the selection of superior genotypes based on multiple traits (Olivoto and Nardino, 2021).
The results of these investigations and identifications may allow the improvement of salt stress tolerance in wheat cultivars. The present study investigated a set of 138 wheat genotypes for salt-stress tolerance at the seedling stage. GWAS was applied to determine the extent of variation in response to salt stress, to identify molecular markers linked to salt tolerance, to search for candidate genes favorable for salt tolerance, and to identify salt-tolerant genotypes.
Materials and methods
The study was conducted on a set of 138 diverse wheat pre-breeding lines (PBLs) developed at CIMMYT (Supplementary Table S1). These 138 lines were selected from a larger set of 312 PBLs previously reported (Akram et al., 2021). This germplasm was the product of a large project, the “SeeDs of Discovery”, which was implemented at CIMMYT, Mexico (Singh et al., 2018) where each line was the product of two elite (best/approved cultivars) and one exotic line (GenBank accession). The current investigation used seeds obtained from the 2018–2019 harvest.
Experimental design and measured morphological traits
This investigation followed a completely randomized design (CRD). Initially, seeds from each line were treated with 10% NaOCl for 5 minutes followed by three washes with distilled water. In a growth chamber (Sanyo-Gallenkamp, United Kingdom) with controlled temperature of 28 ± 2°C and a 10-h photoperiod, 25 seeds of each genotype were grown on Whatman no. 1 filter paper moistened with a salt solution (Zafar et al., 2015). The experiment was conducted at three NaCl concentrations: 0, 150, and 250 mM NaCl corresponding to the control (S0), treatment 1 (S1), and treatment 2 (S2) groups, respectively.
On the eighth day of germination tests, the performance of the seedlings was assessed by recording the following morphological characteristics (Table 1). The mean value of each trait in each treatment was used for association analysis.
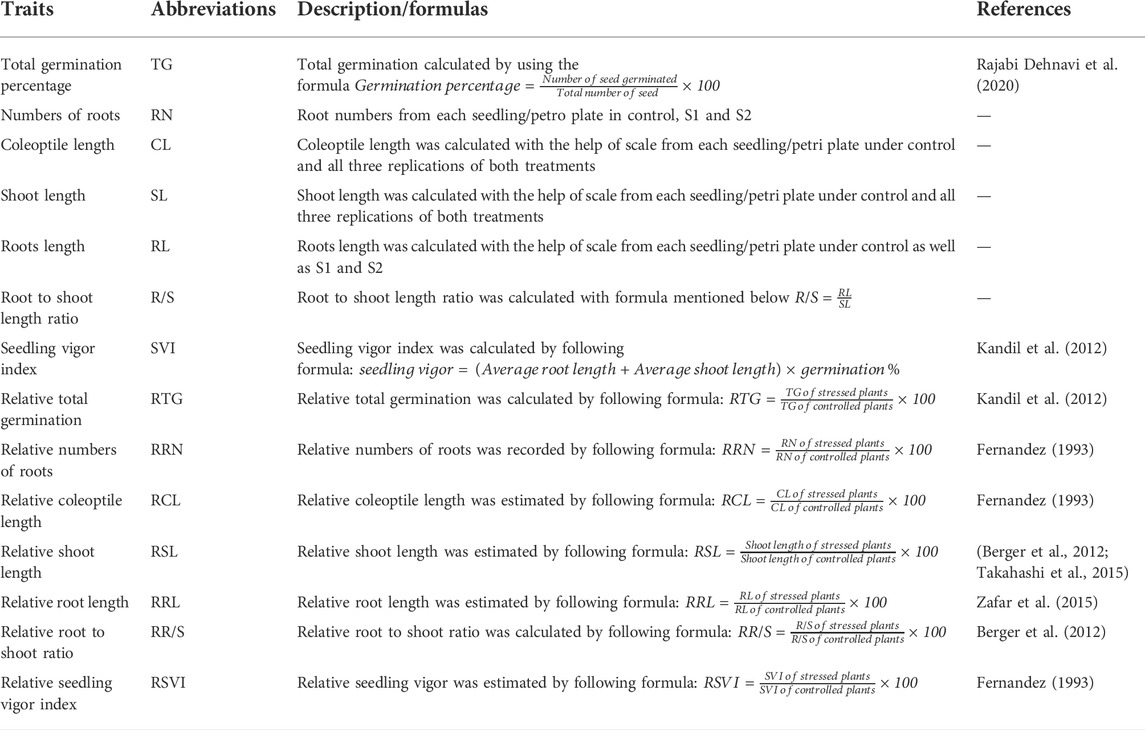
TABLE 1. Parameters measured to assess salinity tolerance.
DNA extraction and genotyping
The genotyping used the flag leaves at the booting stage of TC1F5 plants. DNA was extracted using the cetrylmethylammonium bromide (CTAB) method and quantified on a Nano-Drop instrument (http://www.diversityarrays.com/dart-application-dartseq), as described by Akram et al. (2021). A total of 58,378 high-quality SNP markers were generated, which were condensed to 6,887 SNPs by applying various stringent criteria including call rate (quality of genotyping) and reproducibility (marker consistency over replicated assays). the chromosomes, orders, and genetic distances of the mapped SNPs were obtained from the 100K-marker DArT-seq consensus map (http://www.diversityarrays.com/sequence-maps).
Statistical analysis
SPSS 16.0 was used to generate the descriptive statistics. All other analyses, including three way ANOVA, phenotypic histograms (using the “ggplot2” package) (Wickham, 2016), circular Manhattan plot (“CMplot”) (Yin et al., 2021), and correlation (“qgraph”) (Epskamp et al., 2012) were performed in RStudio version1.0.153. To assess the association of the genotypes with the expressed phenotypes, principal component analysis (PCA) was performed using the “factoextra” package in R version 4.1.3 to reduce the dimensionality of the data (Kassambara and Mundt, 2017).
Genetic analysis
We used STRUCTURE version 2.3.4 to analyze population structure (Pritchard et al., 2003) where the K values ranged from 1 to 9 according to Akram et al. (2021). The online Structure Harvester software was used (Earl, 2012) to obtain the result files from STRUCTURE. The bar charts of population structure were plotted using STRUCTURE PLOT (Ramasamy et al., 2014).
TASSEL V5.2.43 software was used to perform marker-trait associations using the mean data for each treatment (Bradbury et al., 2007). The current study employed an MLM model that used population structure (Q-matrix generated by the structure) and kinship (K-matrix generated by TASSEL v 5.0) matrix as covariates to avoid false positives. Markers with p-values <10−3 were defined as significant, whereas markers p-values less than the reciprocal of the number of markers (<1.45 × 10⁻⁴) were defined as highly significant associations (after Bonferroni correction) (Holm, 1979; Arif and Börner, 2020; Akram et al., 2021).
Identification of candidate genes
Sixty-nine base-pair-length sequences for each highly significant marker including 48 bp flanking regions of SNP marker were subjected to BLAST (Basic Local Alignment Search Tool) using the NCBI (National Center for Biotechnology Information) database. The BLAST search was conducted using the genome assembly IWGSC RefSeq v2.1 (Zhu et al., 2021). Hits with 100% identity and e-values < 10−4 were selected.
Selection of tolerant wheat genotypes
The “metan” (Olivoto and Lúcio, 2020) package in R was used to differentiate the lines according to the MGIDI, where each trait (rXij) was standardized initially. This was followed by factor analysis to characterize the ideotype matrices. In the final step, an MGIDI index was computed by measuring the Euclidean distance between genotypes and ideotype scores using the following equation:
where γij represents the score represents of ith genotype (i = 1, 2,… ,t) in the jth factor (j = 1,2,… , f) and t and f are the number of genotypes and factors, respectively. The score of the ideal genotype was represented by γj. The lower the MGIDI value of a genotype, the closer it is to the ideal genotype (Olivoto and Nardino, 2021). A ∼10% selection intensity (SI) was set to select the genotypes. Based on the ideotype concept, the traits were rescaled by assigning 0–100 values for all traits, in which 0 corresponded to the least valuable trait, and 100 to the most valuable/desired trait, to define the ideotype. In the present investigation, all traits were assigned with increasing values defining the quantitative morphological traits, which directly or indirectly affected the wheat response towards salt stress.
Results
Phenotypic variations
Salt stress significantly affected all traits. For example, TG decreased from 91.10 to 68.84 and 53.22 in S1 and S2, respectively, while the RTG after S1 and S2 were 75.06 and 57.71, respectively. In contrast, RN increased from 4.52 to 5.12 in S1 and 2.12 in S2, while the corresponding RRN was 114 in both treatments (S1 and S2). The CL in S1 was higher (2.94) than those in S0 and S2 (2.76 and 2.34, respectively). The RCL in S1 was also higher (106.78) than that in S2 (85.62). Among all traits, the highest decrease was observed in SL, which decreased from 9.38 (S0) to 6.08 (S1) and 3.25 (S2). The values for RSL_S1 and RSL_S2 were 67.30 and 33.02, respectively. A decreasing trend was also observed in RL, from 9.35 (S0) to 6.08 (S1) and 3.25 (S2). In contrast, the RRL in S1 was 65.67 and 35.36 in S2. The mean R/S in the control group was higher (1.14) than those for the S1 (0.98) and S2 (1.11) treatments. The relative R/S was higher in S2 (112.64) compared to that in S1 (99.50). The highest SVI was observed in the control group, with a mean value of 1708, followed by S1 (877, a decrease of 48% from the control) and S2 (353, a 91% decrease from the control). The mean RSVI in S1 (50.77) decreased to 20.38 in S2 (Figure 1; Supplementary Table S2).
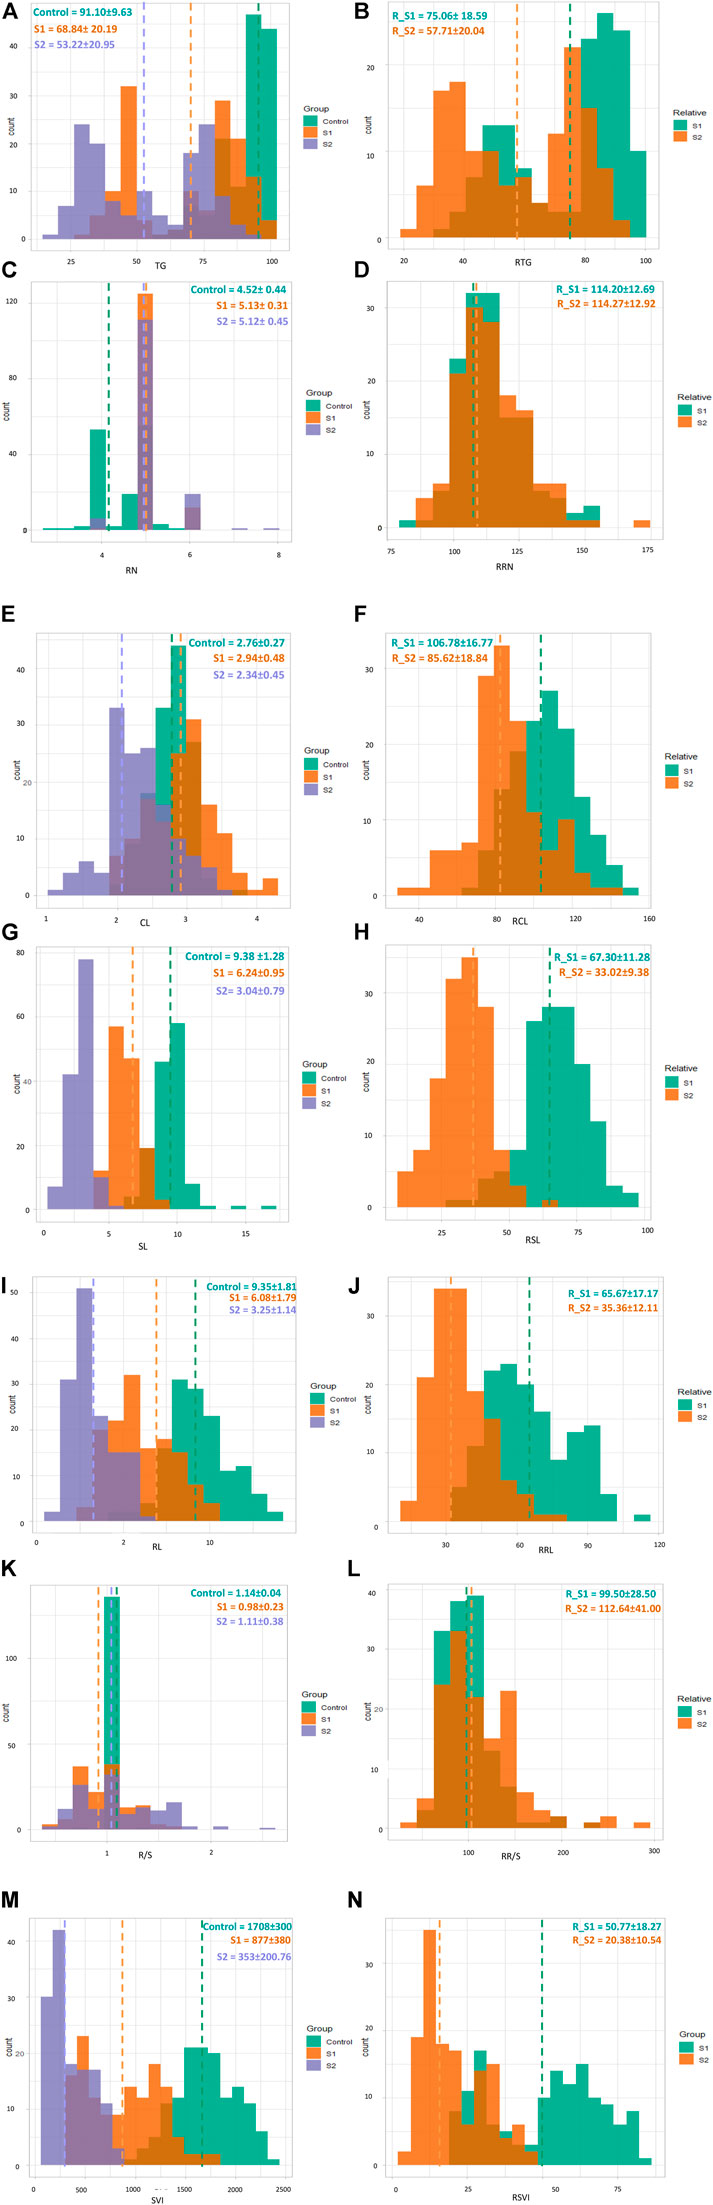
FIGURE 1. Overlaid histograms showing frequency distributions of TG (A), RTG (relative) (B), RN (C), RRN (relative) (D), CL (E) RCL (relative) (F), SL (G), RSL (relative) (H), RL (I), RRL (relative) (J), R/S (K), RR/S (relative) (L), SVI (M), and RSVI (relative) (N) across control (green), S1 (brown), and S2 (purple, for relative traits S1 (green) and S2 (brown). The vertical dotted lines indicate the mean values of each trait.
Genotypes (G), treatments (T), and GxT showed significant differences in TG, RN, CL, SL, RL, R/S, SVI, RCL, RSL, RRL, RR/S, and RSVI. Among G and T, RTG showed highly significant differences, whereas no significant differences were observed for G×T. Only genotypes differed significantly in RRN, as compared to treatment plus G×T (Figure 1; Supplementary Table S2).
Correlations
Most traits were positively correlated in the untreated control, although SL_S0 was negatively correlated with TG_S0 and R/S_S0 (Figure 2; Supplementary Table S4). Likewise, R/S_S0 was also negatively correlated with SVI_S0. In contrast, all traits in S1 were positively correlated except for RN_S1 which did not show any correlation with any trait. Similar trends were observed in S2, except for RN_S2, which did not show any correlation with any other trait. In addition, SL_S2 was negatively correlated with R/S_S2. The relative traits were also positively correlated in most instances with their corresponding traits under salt stress.
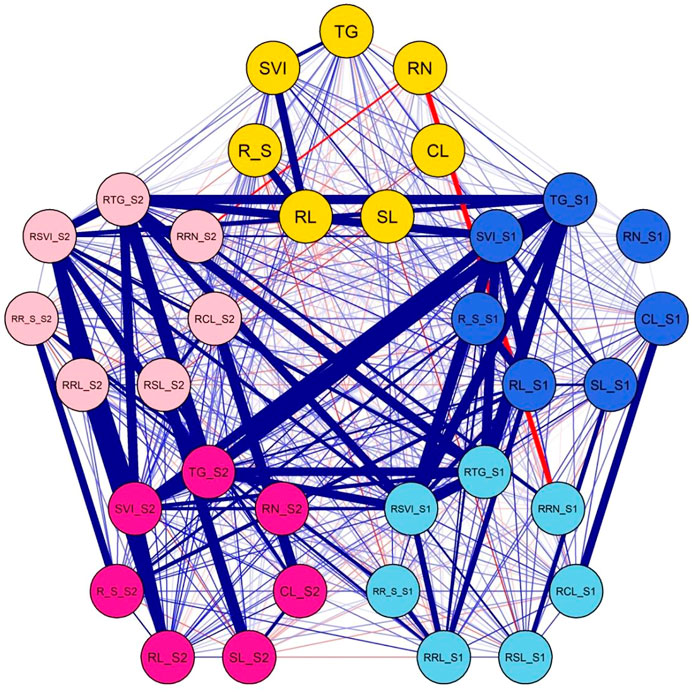
FIGURE 2. Correlations among matrixes of various traits under normal and salt-stress treatments. Yellow circle: traits under control. Blue circle: traits under S1. Sky blue circle: relative traits under S1. Bright pink circle: traits under S2. Light pink circle: relative traits under S2. Thick blue lines: highly significant correlations. Thin blue lines: significant correlations. Thick red lines: highly significant negative correlations. Thin red lines: significant negative correlations.
Structure analysis
To correctly estimate the numbers of sub-groups in our germplasm, we plotted ΔK with a constant number of K sub-groups on the x-axis (Evanno et al., 2005), which showed a maximum ΔK value for K = 2 (Supplementary Figure S1). This value rose again at 5 and remained stable afterward. Therefore, we concluded that our germplasm carried five sub-populations (Supplementary Figure S2). The highest numbers of PBLs were observed in the second sub-group (Q2) followed by Q1, Q4, Q3, and Q5, with 27, 25, 23, and 18 PBLs, respectively. Supplementary Table S1 also provides information on the accessions regarding the pedigree and Q groups as identified from the STRUCTURE analysis, where the STRUCTURE results were consistent with the pedigrees of the collection. According to the pedigree, accessions with a last-crossed parent of Baj#1 were grouped in Q1 whereas most accessions with a last-crossed parent of KIRITATI were grouped in Q2. Accessions with last-crossed parents of Baj1, KACHU, and KIRITATI were grouped in Q3. The fourth subgroup included accessions in which the last-cross parent included VILLA JUARE2 F2009, while all other accessions with SUP152 as a parent in the last cross were grouped in Q5 (Supplementary Table S1).
Association mapping
A total of 195 MTAs showed an LOD of ≥3 (p < 10−3) for the different traits observed in this study (Figure 3; Table 2). After Bonferroni correction, the number of associations decreased to 63 for all traits except for TG, CL, and SVI which did not show any association with any marker. Associations with p <1 × 10⁻³ were considered significant, while those with p <1.452 × 10⁻⁴ were considered highly significant.
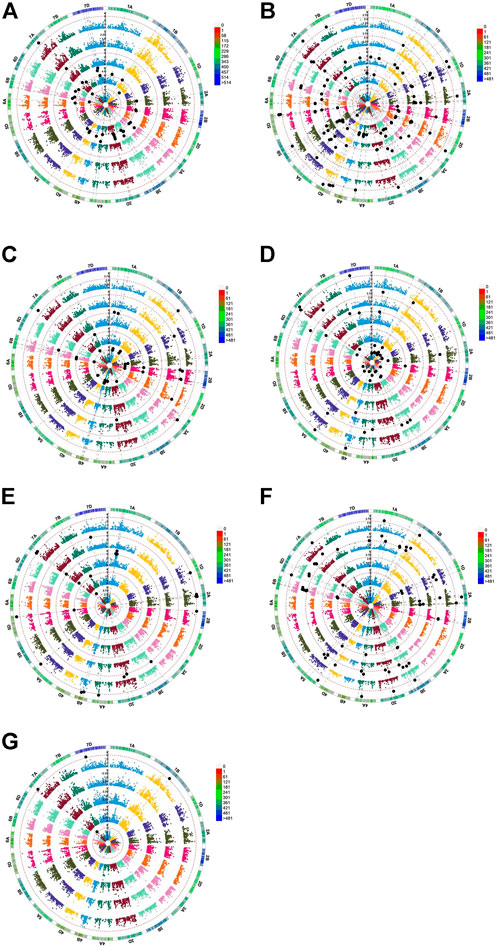
FIGURE 3. Genome-wide scan (GWAS analysis) of (A) TG, (B) RN, (C) CL, (D) SL, (E) RL, (F) R/S, and (G) SVI. S0 (inner circle), S1 (first outer circle), S2 (second outer circle), R_S1 (third outer circle), and R_S2 (fourth outer circle) are circular Manhattan plots in which the chromosomes are plotted at the outermost circle. The thin dotted red line indicates significance at p < 0.001 (−log10 = 3 or more) beyond which an association is counted as a true association (highlighted black dots). The scale between chromosomes 7D and 1A indicates the LOD threshold. The colored boxes outside on the top right side indicate the SNP density across the genome where green to red indicates less to more dense.

TABLE 2. Chromosome-wide distributions of markers associated with various traits at p < 1 × 10⁻³ (normal text) and p < 1.452 × 10⁻⁴ (bold text).
The distributions of these MTAs in the wheat genome varied considerably. For example, chromosome 3B exhibited the highest (18 including nine highly significant) number, whereas chromosomes 3A (three including one highly significant), 6A (three including two highly significant) and 7B (three significant) exhibited the lowest numbers of MTAs (Table 2). Sixteen MTAs each were detected on chromosomes 2A (including six highly significant associations) and 1B (including four highly significant associations). Chromosome 4A carried 15 MTAs, including seven that were highly significant. There were 13 MTAs on each of chromosomes 5A (including five highly significantly) MTAs. Chromosome 2B also carried 13 MTAs, including two that were highly significant. Likewise, chromosomes 7A and 1A had 12 MTAs each, with six and one highly significant MTA, respectively. Similarly, 10 MTAs were detected on chromosomes 1D (including four highly significant associations) and 4B (including seven highly significant associations), respectively. Chromosome 2D showed eight significant MTAs, including one that was highly significant. Chromosomes 5B, 5D, 6D, and 7D each showed seven MTAs; each chromosome contained three highly significant MTAs except for 7D, which showed no highly significant MTAs. In addition, six MTAs were detected on chromosomes 3D (including two highly significant MTAs), while 6B showed five (including one highly significant) MTAs. Finally, four (including three highly significant MTAs) MTAs were detected on chromosome 4D (Figure 4).
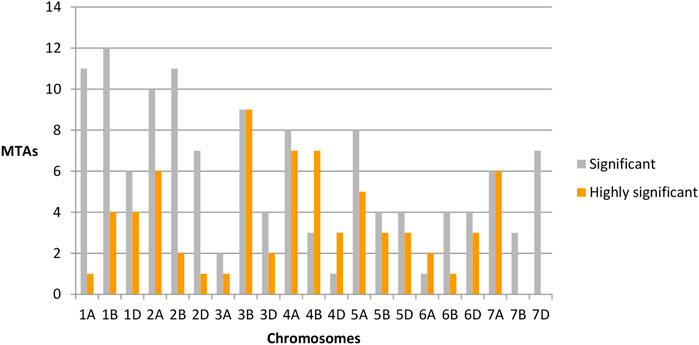
FIGURE 4. Chromosome-wide distribution of significant (gray) and highly significant (orange) marker-trait associations.
Regarding traits, RN_S2 showed the highest number of MTAs (35 including thirteen that were highly significant), whereas RL_S0, RN_S0, RTG_S2, SL_S1, SVI_S0, TG_S2, and TG_S0 showed the lowest numbers of MTAs (one) for each trait. Twenty-eight MTAs (including eighteen that were highly significant) and 22 MTAs (including six that were highly significant) were detected for RR/S_S1 and RN_S1 respectively. We also detected 20 MTAs associated with SL_S0, thirteen with RRN_S2, and seven with RSL_S1 including eleven, eight, and two that were highly significantly MTAs respectively. Nine MTAs associated with SL_S0 (with no highly significant association), while six MTAs were detected for R/S_S2, RCL_S1 (including one significant MTA), and RRN_S1. Five MTAs were linked with RL_S2 (one significantly MTA) and SL_S0 (with no highly significant association). RR/S_S2 and CL_S2 were linked to four markers. RR/S_S2 was associated with one highly significant MTA. We also detected three MTAs for CL_S1, RL_S1, RRL_S2, and RSL_S2 and two MTAs for RCL_S2, RRL_S1, and RSVI_S2, with no highly significant association (Table 2).
Candidate genes
BLAST was performed for highly significant SNP markers. Hits with 100% identity and e-values < 10−4 were selected. Twelve candidate genes were identified through this analysis. These included putative disease resistance RPP13-like protein 1, disease resistance protein RGA2-like (involved in conferring disease resistance), glycine-rich cell wall structural protein 1-like (part of the cell wall that acts as a structural protein), two metacaspase-1-like proteins (play roles in programmed cell death), sphinganine C4 monooxygenase 1-like (plays a role in sphingolipid biosynthesis), two 60S ribosomal protein L22-like proteins (ribosomal proteins), glyceraldehyde-3-phosphate dehydrogenase GAPA1, subtilisin-like protease SBT1.7, mRNA-decapping enzyme-like protein, and calmodulin-binding protein 60 D-like (involved in different stress responses, including biotic and abiotic responses). These candidate genes along with their physical locations and functions are shown in Table 3.
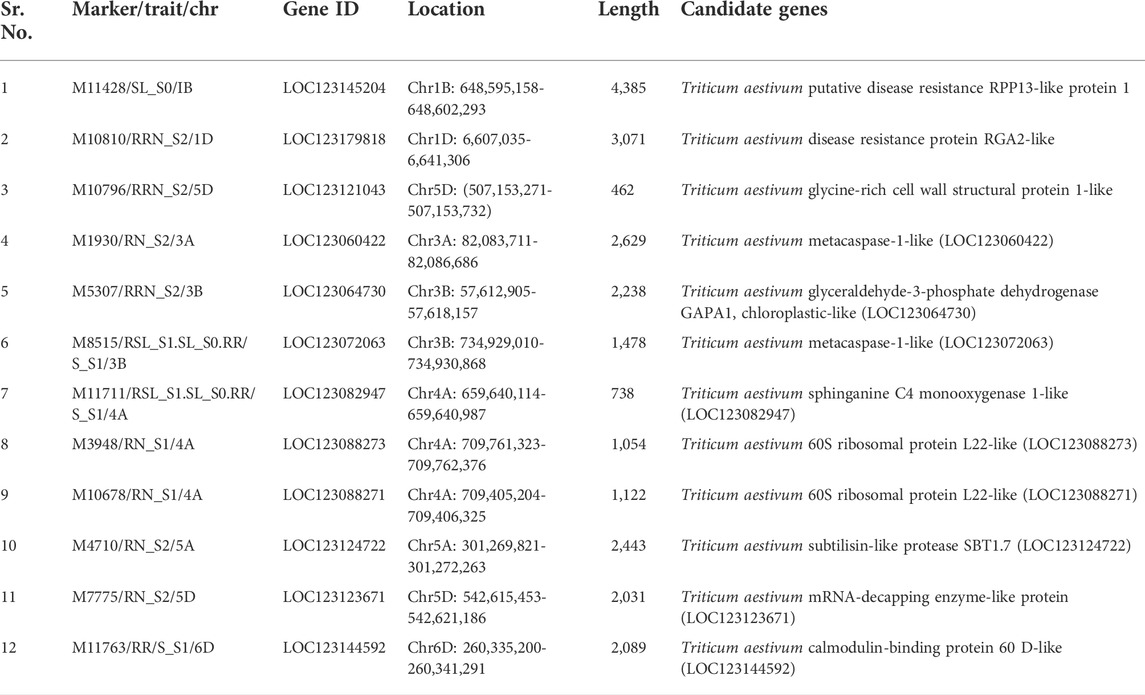
TABLE 3. Identification of candidate genes involved in stress tolerance.
Multivariate analysis
The first two principal components explained significant variation (73.9% of the overall variation), with eigenvalues ≥1 (Figure 5), where PC1 accounted for 57.2% of the total variation and was positively correlated with all traits except RN. The second PC explained 16.7% of the total variation and was mainly influenced by R_S, TG, RL, and SVI. All traits were sorted into three groups (I–III) based on their distributions in the PCA biplot quadrants: group I included R_S, TG, RL, and SVI; group II consisted of SL and CL; and group III contained only RN (Figure 6). The bi-plot analysis also highlighted the correlation between the examined traits: The sharp angle between trait vectors indicated a positive correlation, while obtuse and right angles indicated negative and no correlations between the parameters, respectively.
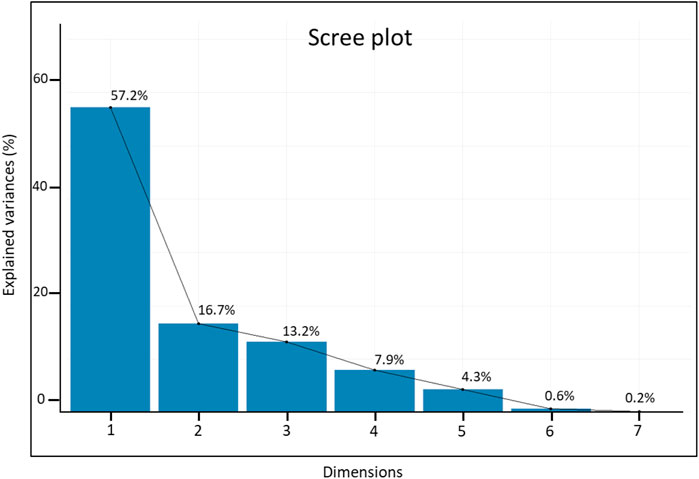
FIGURE 5. Scree plot showing the contributions of the first seven principal components.
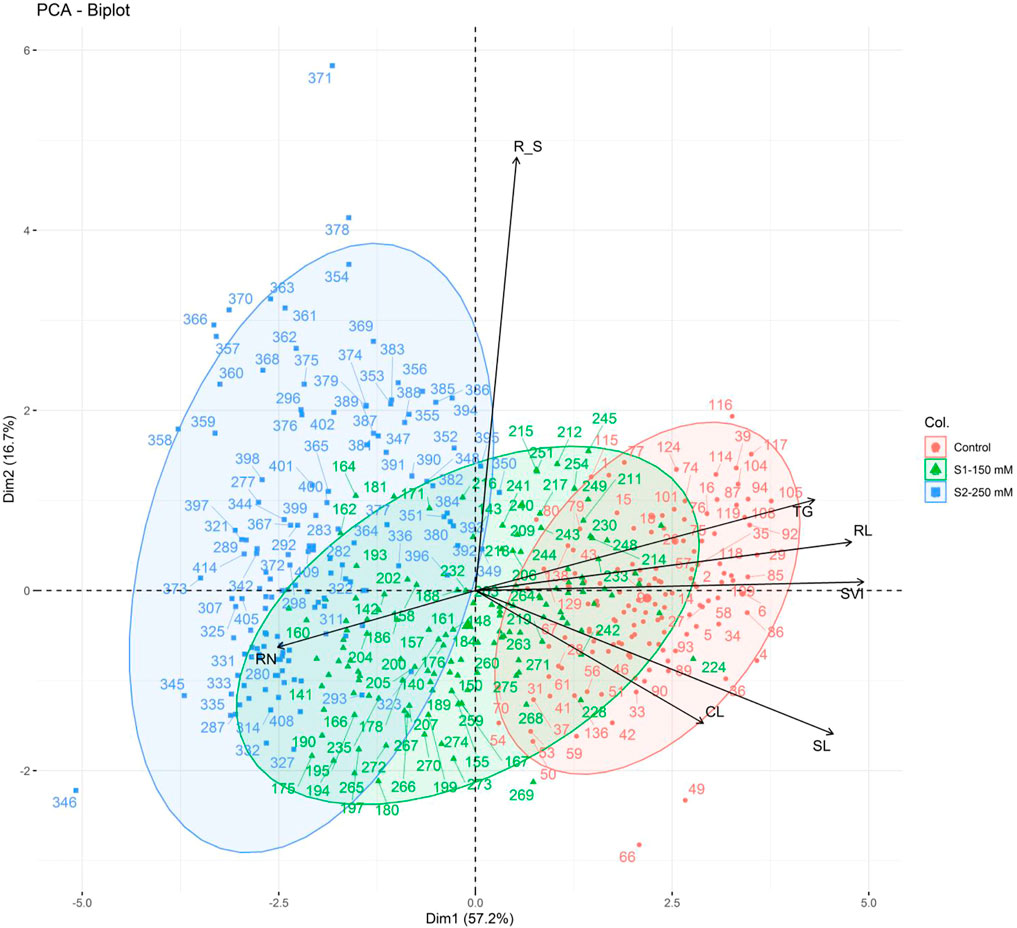
FIGURE 6. PCA of the morphological traits measured in 138 wheat genotypes in control (red) and salt stress [S1-150 Mm NaCl (blue) and S2-250 Mm NaCl)] conditions based on the first two components. TG, total germination percentage; RN, numbers of roots; CL, coleoptile length; SL, shoot length; RL, root length; R_S, root to shoot length ratio; SVI, seedling vigor index.
Discussion
Wheat seedling development has three parts: germination, emergence, and early growth. All three stages are especially sensitive to salinity stress (Jamil et al., 2005). The most crucial stage of plant development is germination (Song et al., 2008). Salinity tolerance at the germination stage may provide the ultimate yield gains in terms of grains produced (Jajarmi, 2009). Salt stress also significantly affected the overall performance of the germplasm in the present study. TG decreased by 24% and 42% in S1 and S2 compared to the control. TG was also highly correlated with RN, CL, SL, RL, and SVI. Highly significant differences between genotypes and treatments were observed for all traits. The same trends were also observed for the relative values of all traits under all treatments. Salinity stress affected all genotypes during S1 and S2 treatments compared to the control. The most adverse effects of salt stress were observed at S2, in which the TG dropped to 68% (TG_S2) from 91% (TG_S0). Other important seedling traits like CL, SL, RL, and SVI also decreased in the presence of elevated salt stress (S2), consistent with the findings reported by El Hehdaey et al. (2011).
Owing to the significance of the germination stage in plant tolerance against salinity stress (Munns and James, 2003; Singh et al., 2012), germination tests are among the most suited approaches for the early-stage screening of germplasm collections for salt tolerance (Munns et al., 2006; Aflaki et al., 2017). In the present study, chromosomes 1B (at 384.13 cM) and 7A (at 145.43) carried MTAs associated with TG under control and salt stress, respectively. Batool et al. (2018) also reported one QTL associated with standard germination on chromosome 1B. A recent report also underscored the importance of loci on chromosome 2B with respect to germination under post-abiotic stress in wheat (Arif and Börner, 2020). Likewise, a QTL related to germination under abiotic stress (experimental aging) has also been reported on chromosome 7A (Arif et al., 2012).
The root is the first plant organ that experiences salt stress; thus, it plays a significant role in sensing the salinity level in the nearby environment (Galvan-Ampudia et al., 2013; Robbins et al., 2014) by signal transduction (Jiang et al., 2012; Choi et al., 2014). During salt stress, the cell cycle activity of the root meristem is reduced, resulting in reduced growth (West et al., 2004). Hence, RN and RL are important criteria in estimating the salinity tolerance in wheat. In our study, RN increased by 13% in both S1 and S2 compared to S0, with significant differences between G, T, and GXT. In contrast to RN, RL showed a significant decrease in S1 (35%) and S2 (65%) compared to the control. The same drop in RL was observed for relative traits, consistent with previous reports (Duan et al., 2013; Julkowska and Testerink, 2015). RL was highly correlated with SVI, whereas RN showed highly positive correlations with CL, SL, RL, and R/S. Previous studies have provided evidence of reduced root length due to elevated salt stress. A total of 58 MTAs linked to RN were detected on all chromosomes except for 1A, 4D, and 7B. Literature related to RN under salinity stress is scarce. However, our findings are consistent with those reported by Li et al. (2011), Salem and Mattar (2014), and Rufo et al. (2020). Likewise, chromosomes 1A, 1D, 3D, 4B, 5D, 7A, 7B, and 7D carried MTAs for RL and RRL under control and salt stress, similar to the results reported by Batool et al. (2018) and Salem and Mattar (2014). Marker M4090 present on 5D at 228.94 cM was linked to RL and RN, which showed a pleiotropic effect by controlling two characters on the same chromosome and location Markers controlling more than one trait are important for the improvement of salt stress tolerance in wheat (Batool et al., 2018).
The coleoptile protects the first leaf of the future wheat plant, which also functions as the driver to propel the leaf outside the soil crust. Coleoptile strength and success is tantamount to the successful establishment and early plant vigor. Stress, may enhance the CL and shorten the SL (Zhang and Wang, 2012). In the present study, a 6% increase in coleoptile length was observed at S1 compared to S0. A 15% decrease was observed at S2 compared to S0. The CL also showed highly significant positive correlations with SL, RL, and R/S. Saboora et al. (2006) also observed the same trends in CL increases and decreases at moderate (75 mM) and higher levels of salt stress (150, 225, 300, and 375 mM). Moud and Maghsoudi (2008) reported that salt stress inhibited CL more than root growth. MTAs linked with CL under various conditions were detected on the chromosomes of group three and chromosomes 1A, 2A, 2B, 4A, and 4B. Li et al. (2011) reported QTLs associated with CL on chromosome 4B and 6B. In addition, two major QTLs of CLs were reported on chromosome 4B and 4D (Sidhu et al., 2019), corroborating our findings. Salem and Mattar (2014) reported QTLs related to CL under salinity stress at NaCl concentrations of 0 (on chromosome 1D), 150 (on 1D and 3BS), and 250 (on 1D, 4B, and 7D) mM; however, we detected no MTA for CL on chromosome 1D.
SL showed highly significant differences among treatments, with 33% and 68% decreases in S1 and S2, respectively. SL showed highly significant positive correlations with RL and R/S and a highly significant negative correlation with SVI. Bilkis et al. (2016) reported a 6%–36% decrease in shoot length under salt treatment. These findings were also similar to those of Datta et al. (2009) and Alom et al. (2016), who reported significantly reduced SL and RL at salinity levels <125 mM NaCl. SL is an important factor in the selection of genotypes against salt stress. The 20 MTAs of SL in various conditions were distributed on 14 different chromosomes, corroborating previous findings (Ghaedrahmati et al., 2014; Batool et al., 2018; Liu et al., 2018). The MTAs on chromosome 4B for SL_S0 (M8833 at 108.27 cM) and SL_S2 (M10038 at 90.17 cM) corresponded to the dwarfing gene Rht-B1 on chromosome 4BS (Arif et al., 2021; Mo, 2018).
The R/S ratio is also disturbed under salt stress; however, this response is more tied to water stress than to salt stress (Hsiao and Xu, 2000). Increased RL as compared to SL may lead to the preservation of a large proportion of toxic ions in the roots and ameliorate their movement to the shoot, thus helping plant survival under salt stress (Cassaniti et al., 2009; Cassaniti et al., 2012). Çamlıca and Yaldız (2017) reported a decreased root/shoot length ratio with increasing salinity doses, with a greater reduction in root length than shoot length. In other words, the root length was more negatively affected than shoot length by increasing salinity doses. Landjeva et al. (2008) identified two QTLs on chromosome 3DL (QRSRc.ipk-3D.1 and QRSRc.ipk-3D.2) and one QTL on chromosome 6DL (QRSRp.ipk-6D) that were associated with the R/S ratio under osmotic stress. We detected two highly significant MTAs (M1987 at 107.75 cM and M1019 at 116.66 cM) in S1 and S2 on chromosome 3D. Two MTAs, M11763 at 90.8 cM and M1188 at 121.22 in S1, were also detected on chromosome 6D, suggesting that both these loci were associated with R/S control under both salt and osmotic stresses.
Damaged plants show decreased viability, as represented by SVI (Copeland and McDonald, 2012). This is the most important trait for screening against salt stress. SVI is the product of many different factors and is related to genetics and environmental influences. The results of the current study showed highly significant differences between G, T, and G×T. SVI dropped by 48% and 91% at S1 and S2, respectively, from S0, implying that S2 was critical and damaging. A similar decrease was reported in Brassica napus (Batool et al., 2015) and Hibiscus species (Rashmi and Naik, 2014). In contrast (Batool et al., 2015), various QTLs associated with SVI at 150 mM NaCl on chromosomes 2A (QSVI.2A.SG), 4A (QSVI.4A.SG), 6D (QSVI.6D.SG) and 7B (QSVI.7B.SG) have been reported. We detected one MTA (M38 at 214.7 cM) on chromosome 7A that was associated with SVI_S0 on chromosome 7A. M38 was also associated with RL. Likewise, two MTAs (M7489 at 258.98 cM on chromosome 1B and M3286 at 113.89 on chromosome 7A) were also detected with RSVI_S2 on chromosome 7A, indicating that a wide variety of loci determine the SVI in wheat and are strongly dependent on RL and SL.
The BLAST search against the highly significant SNP markers identified in the present study revealed candidate genes involved in various stress conditions in plants. One such candidate gene (glycine-rich cell wall structural protein 1-like) was found on chromosome 5D. Glycine-rich proteins (GRP) are reportedly involved in stress responses including salinity, drought, etc., in many plants (Czolpinska and Rurek, 2018). Moreover, two candidate genes on chromosome 1B and 1D are involved in disease resistance. Additionally, multiple SNP markers matched candidate genes; i.e., metacaspase-1-like protein. Metacaspase-1 has a predominant role in the regulation of programmed cell death. The endoplasmic reticulum (ER) regulates protein synthesis. High salinity levels cause ER stress through the accumulation of misfolded proteins, which can lead to unfolded protein response (UPR) as a stress response mechanism. The UPR mechanism reverses misfolded proteins. UPR failure activates programmed cell death (Yusof et al., 2021). Metacaspase genes are key regulators of programmed cell death and might be the cardinal components of the saline stress pathway. Another candidate stress response gene (glyceraldehyde-3-phosphate dehydrogenase GAPA1, chloroplastic-like) located on chromosome 3B was also detected. Plastidial GAPA1 has an abiotic stress response role in wheat and other plants (Chang et al., 2015; Li et al., 2019) and was associated with the M5307 marker related to RRN in S2 treatment at chromosome 3B. Munoz-Bertomeu et al. (2009) described the role of plastidial GAPA1 in root development as this gene is involved in the biosynthesis of serine, which is essential for root development. The present study also showed the association of plastidial GAPA1 in root development. Another gene, sphinganine C4-monooxygenase 1-like, involved in sphingolipid biosynthesis was also identified. Sphingolipids are ubiquitous and present in all types of plants. They comprise parts of plant cell membranes and endo-membranes. They also play roles in plant stress responses (Huby et al., 2020). Furthermore, another important candidate gene, calmodulin-binding protein 60 D-like, aligned to the M11763/RR/S_S1/6D marker. which corresponds to the shoot-to-root length ratio and is also involved in environmental stress responses in plants (Zeng et al., 2015). Calmodulin binding proteins play a significant role in plant growth, which corresponds to the results of the present study. Another stress response gene, subtilisin-like protease SBT1.7, was identified by the analysis in the present study. This gene plays a role in biotic stress response (Meyer et al., 2016). In addition, mRNA-decapping enzyme-like protein and 60S ribosomal protein L22-like were also identified as candidate genes. Kawa and Testerink (2017) and Liu et al. (2019) reported the role of both genes in salt stress response. Moreover, mRNA-decapping contributes to the regulation of ABA signaling (Munoz-Bertomeu et al., 2009). ABA mediates many developmental programs in plants, including seed dormancy or root growth (Finkelstein, 2013). The analysis of the M7775/RN_S2/5D marker in this study also suggested the involvement of the mRNA-decapping enzyme-like protein in root development.
PCA analysis disentangles a large data set into a small number of unrelated groups that can easily be plotted along independent linear axes. Closely linked variables in the same group may hint at latent relationships among them. Multiple traits often make it difficult to choose the best-performing genotypes. Therefore, several counter multivariate approaches such as cluster analysis, factor analysis, and PCA including other indices (Hazel, 1943; Williams, 1962) have been devised; however, each has limitations. We applied the MGIDI index for each treatment to identify superior genotypes. The analysis identified ten genotypes for further assessments; among these ten genotypes, only one was common to all three treatments. G58 showed the best ideotype, with positive genetic gains for all traits (Figure 7). MGIDI is a novel way to select genotypes. Other researchers have used this approach in different crops including strawberry, wheat, barley, guar, and soybean (Gabriel et al., 2019; Olivoto et al., 2021; Lima et al.; Farhad et al., 2022; Pour-Aboughadareh et al., 2021; Benakanahalli et al., 2021; Maranna et al., 2021).
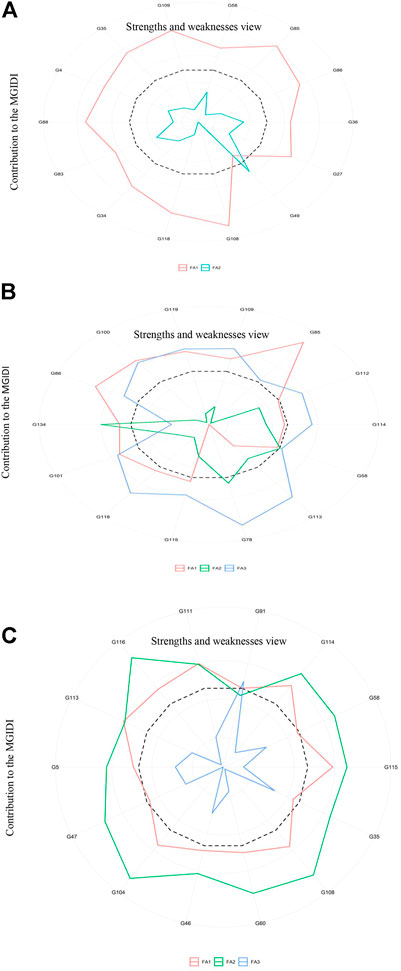
FIGURE 7. Strengths and weaknesses of the stable genotypes identified in the control (A), S1 (150 mM) (B), and S2 (250 mM) (C) groups.
According to the IMGIDI-based selection of genotypes, we identified the 10 best accessions (58, 85, 86, 108, 118, 35, 109, 113, 115, and 114) for all treatments (Figure 8). We observed the genotypic profile of these genotypes with respect to the highly significant MTAs discussed above. The identified genotypes carried from 37 to 44 positive alleles out of 48 possible positive alleles, with accessions 109 (GID: 7642809) and 115 (GID: 7642901) carrying the maximum numbers (44) of positive alleles. The phenotypic profiles of these accessions under both salinity levels (150 and 250 mM NaCl) indicated a percent increase in all traits except RN_S0, Sl_S0, RL_S0, R/S_S0, and SL_S2. After excluding these traits, all traits showed a mean increase of approximately 9.9% from the population mean (Supplementary Table S6). The use of accessions with more favorable alleles in wheat breeding can aid in improving salinity tolerance traits.
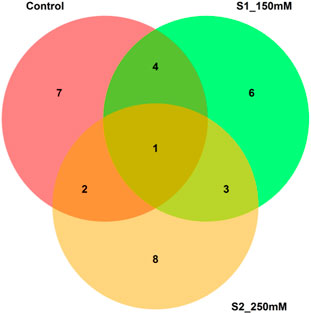
FIGURE 8. Venn diagram of the common genotypes shared across the treatments.
Conclusion
This study comprehensively dissected the performance of diverse bread wheat germplasm against different levels of salt stress. A total of 138 lines were screened at the seedling stage for seven traits at 0, 150, and 250 mM NaCl. We identified 195 significant SNPs/loci and 63 highly significant loci related to different traits. Most of the associations were present on the A genome, especially on chromosome 2A, and strengthened our findings regarding salinity tolerance. A total of 12 candidate genes were associated with highly significant SNP markers. The chromosomal localization of many of the important candidate genes such as Plastidial GAPA1, Metacaspase-1, etc., and their role in salt stress were also reported previously. These results of the extensive study of salt stress tolerance in Triticum aestivum L. could be a valuable reference for future studies. The best-performing lines with desirable allele combinations can be incorporated into wheat breeding programs.
Author’s note
This experiment/research paper is a part of Saba Akram’s PhD study.
Data availability statement
The original contributions presented in the study are included in the article/Supplementary Material, and further inquiries can be directed to the corresponding authors.
Author contributions
Basic idea, MA and AH; experimentation and theory, SA and MW; software, SA, MG, and AW; formal analysis, SA, MG, and AW; writing, SA, MG, AW, and SS; review and editing, MA and AH; supervision, MA and AH.
Acknowledgments
The author wants to acknowledge NIAB-C, PIEAS management for their help to complete the research work.
Conflict of interest
The authors declare that the research was conducted in the absence of any commercial or financial relationships that could be construed as a potential conflict of interest.
Publisher’s note
All claims expressed in this article are solely those of the authors and do not necessarily represent those of their affiliated organizations, or those of the publisher, the editors, and the reviewers. Any product that may be evaluated in this article, or claim that may be made by its manufacturer, is not guaranteed or endorsed by the publisher.
Supplementary material
The Supplementary Material for this article can be found online at: https://www.frontiersin.org/articles/10.3389/fgene.2022.997901/full#supplementary-material
References
Acosta-Motos, J. R., Ortuño, M. F., Bernal-Vicente, A., Diaz-Vivancos, P., Sanchez-Blanco, M. J., and Hernandez, J. A. (2017). Plant responses to salt stress: Adaptive mechanisms. Agronomy 7 (1), 18. doi:10.3390/agronomy7010018
Aflaki, F., Sedghi, M., Pazuki, A., and Pessarakli, M. (2017). Investigation of seed germination indices for early selection of salinity tolerant genotypes: A case study in wheat. Emir. J. Food Agric. 29, 222–226. doi:10.9755/ejfa.2016-12-1940
Akram, S., Arif, M. A. R., and Hameed, A. (2021). A GBS-based GWAS analysis of adaptability and yield traits in bread wheat (Triticum aestivum L.). J. Appl. Genet. 62 (1), 27–41. doi:10.1007/s13353-020-00593-1
Alom, R., Hasan, M. A., Islam, M. R., and Wang, Q.-F. (2016). Germination characters and early seedling growth of wheat (Triticum aestivum L.) genotypes under salt stress conditions. J. Crop Sci. Biotechnol. 19 (5), 383–392. doi:10.1007/s12892-016-0052-1
Arif, M. A. R., and Börner, A. (2020). An SNP based GWAS analysis of seed longevity in wheat. Cereal Res. Commun. 1–8. doi:10.1007/s42976-020-00025-0
Arif, M. A. R., Liaqat, M., Imran, M., Waheed, M. Q., Arif, A., Singh, S., et al. (2021). Genetic basis of some physiological traits and yield in early and late sowing conditions in bread wheat (Triticum aestivum L.). J. Appl. Genet. 62 (4), 601–605. doi:10.1007/s13353-021-00643-2
Arif, M. A. R., Waheed, M. Q., Lohwasser, U., Shokat, S., Alqudah, A. M., Volkmar, C., et al. (2022). Genetic insight into the insect resistance in bread wheat exploiting the untapped natural diversity. Front. Genet. 13, 828905. doi:10.3389/fgene.2022.828905
Arif, R., Nagel, M., Neumann, K., Kobiljski, B., Lohwasser, U., and Börner, A. (2012). Genetic studies of seed longevity in hexaploid wheat using segregation and association mapping approaches. Euphytica 186 (1), 1–13. doi:10.1007/s10681-011-0471-5
Ashraf, M., and Harris, P. (2004). Potential biochemical indicators of salinity tolerance in plants. Plant Sci. 166 (1), 3–16. doi:10.1016/j.plantsci.2003.10.024
Batool, N., Ilyas, N., Shahzad, A., Hauser, B. A., and Arshad, M. (2018). Quantitative trait loci (QTLs) mapping for salt stress tolerance in wheat at germination stage. Pak. J. Agric. Sci. 55 (1). doi:10.21162/pakjas/18.5426
Batool, N., Noor, T., Ilyas, N., and Shahzad, A. (2015). Salt stress impacts on seed germination and seedling growth of Brassica napus L. Pab 4 (3), 398–406. doi:10.19045/bspab.2015.43016
Benakanahalli, N. K., Sridhara, S., Ramesh, N., Olivoto, T., Sreekantappa, G., Tamam, N., et al. (2021). A framework for identification of stable genotypes basedon MTSI and MGDII indexes: An example in guar (Cymopsis tetragonoloba L.). Agronomy 11 (6), 1221. doi:10.3390/agronomy11061221
Berger, B., de Regt, B., and Tester, M. (2012). Trait dissection of salinity tolerance with plant phenomics. Plant salt Toler. 913, 399–413. doi:10.1007/978-1-61779-986-0_27
Bilkis, A., Islam, M., Hafiz, M., and Hasan, M. (2016). Effect of NaCl induced salinity on some physiological and agronomic traits of wheat. Pak. J. Bot. 48 (2), 455–460.
Bizari, E. H., Val, B. H. P., Pereira, E. d. M., Mauro, A. O. D., and Unêda-Trevisoli, S. H. (2017). Selection indices for agronomic traits in segregating populations of soybean1. Rev. Cienc. Agron. 48, 110–117. doi:10.5935/1806-6690.20170012
Bradbury, P. J., Zhang, Z., Kroon, D. E., Casstevens, T. M., Ramdoss, Y., and Buckler, E. S. (2007). Tassel: Software for association mapping of complex traits in diverse samples. Bioinformatics 23 (19), 2633–2635. doi:10.1093/bioinformatics/btm308
Çamlıca, M., and Yaldız, G. (2017). Effect of salt stress on seed germination, shoot and root length in Basil (Ocimum basilicum). Int. J. Second. Metab. 4 (3), 69–76. doi:10.21448/ijsm.356250
Cassaniti, C., Leonardi, C., and Flowers, T. J. (2009). The effects of sodium chloride on ornamental shrubs. Sci. Hortic. 122 (4), 586–593. doi:10.1016/j.scienta.2009.06.032
Cassaniti, C., Romano, D., and Flowers, T. J. (2012). The response of ornamental plants to saline irrigation water, 131–158.Irrigation Water Manag. Pollut. Altern. Strategies
Céron-Rojas, J. J., and Crossa, J. (2018). Linear selection indices in modern plant breeding. Springer Nature.
Chang, L., Guo, A., Jin, X., Yang, Q., Wang, D., Sun, Y., et al. (2015). The beta subunit of glyceraldehyde 3-phosphate dehydrogenase is an important factor for maintaining photosynthesis and plant development under salt stress-Based on an integrative analysis of the structural, physiological and proteomic changes in chloroplasts in Thellungiella halophila. Plant Sci. 236, 223–238. doi:10.1016/j.plantsci.2015.04.010
Chen, W., Guo, C., Hussain, S., Zhu, B., Deng, F., Xue, Y., et al. (2016). Role of xylo-oligosaccharides in protection against salinity-induced adversities in Chinese cabbage. Environ. Sci. Pollut. Res. 23 (2), 1254–1264. doi:10.1007/s11356-015-5361-2
Choi, W.-G., Toyota, M., Kim, S.-H., Hilleary, R., and Gilroy, S. (2014). Salt stress-induced Ca 2+ waves are associated with rapid, long-distance root-to-shoot signaling in plants. Proc. Natl. Acad. Sci. U.S.A. 111 (17), 6497–6502. doi:10.1073/pnas.1319955111
Colmer, T., Munns, R., and Flowers, T. (2006). Improving salt tolerance of wheat and barley: Future prospects. Aust. J. Exp. Agric. 45 (11), 1425–1443. doi:10.1071/EA04162
Copeland, L. O., and McDonald, M. F. (2012). Principles of seed science and technology. Springer Science & Business Media.
Czolpinska, M., and Rurek, M. (2018). Plant glycine-rich proteins in stress response: An emerging, still prospective story. Front. Plant Sci. 9, 302. doi:10.3389/fpls.2018.00302
Datta, J., Nag, S., Banerjee, A., and Mondai, N. (2009). Impact of salt stress on five varieties of wheat (Triticum aestivum L.) cultivars under laboratory condition. J. Appl. Sci. Environ. Manag. 13 (3). doi:10.4314/jasem.v13i3.55372
Duan, L., Dietrich, D., Ng, C. H., Chan, P. M. Y., Bhalerao, R., Bennett, M. J., et al. (2013). Endodermal ABA signaling promotes lateral root quiescence during salt stress inArabidopsisSeedlings. Plant Cell 25 (1), 324–341. doi:10.1105/tpc.112.107227
Earl, D. A., and vonHoldt, B. M. (2012). Structure harvester: A website and program for visualizing STRUCTURE output and implementing the evanno method. Conserv. Genet. Resour. 4 (2), 359–361. doi:10.1007/s12686-011-9548-7
El Hendawy, S., Hu, Y., Sakagami, J.-I., and Schmidhalter, U. (2011). Screening Egyptian wheat genotypes for salt tolerance at early growth stages, 283–298.
El Sabagh, A., Islam, M. S., Skalicky, M., Ali Raza, M., Singh, K., Anwar Hossain, M., et al. (2021). Salinity stress in wheat (Triticum aestivum L.) in the changing climate: Adaptation and management strategies. Front. Agron. 3, 661932. doi:10.3389/fagro.2021.661932
Epskamp, S., Cramer, A. O., Waldorp, L. J., Schmittmann, V. D., and Borsboom, D. (2012). qgraph: Network visualizations of relationships in psychometric data. J. Stat. Softw. 48, 1–18. doi:10.18637/jss.v048.i04
Evanno, G., Regnaut, S., and Goudet, J. (2005). Detecting the number of clusters of individuals using the software STRUCTURE: A simulation study. Mol. Ecol. 14 (8), 2611–2620. doi:10.1111/j.1365-294x.2005.02553.x
Farhad, M., Tripathi, S. B., Singh, R. P., Joshi, A. K., Bhati, P. K., Vishwakarma, M. K., et al. (2022). Multi-trait selection of bread wheat ideotypes for adaptation to early sown condition. Crop Sci. 62 (1), 67–82. doi:10.1002/csc2.20628
Fernandez, G. C. (1993). Adaptation of food crops to temperature and water stress, 13–181992257270.Effective selection criteria for assessing plant stress tolerance
Finkelstein, R. (2013). Abscisic acid synthesis and response. Arab. Book 11, e0166. doi:10.1199/tab.0166
Flowers, T., and Flowers, S. (2005). Why does salinity pose such a difficult problem for plant breeders? Agric. Water Manag. 78 (1-2), 15–24. doi:10.1016/j.agwat.2005.04.015
Gabriel, A., Resende, J. T., Zeist, A. R., Resende, L. V., Resende, N. C., and Zeist, R. A. (2019). Phenotypic stability of strawberry cultivars based on physicochemical traits of fruits. Hortic. Bras. 37, 75–81. doi:10.1590/s0102-053620190112
Galvan-Ampudia, C. S., Julkowska, M. M., Darwish, E., Gandullo, J., Korver, R. A., Brunoud, G., et al. (2013). Halotropism is a response of plant roots to avoid a saline environment. Curr. Biol. 23 (20), 2044–2050. doi:10.1016/j.cub.2013.08.042
Ghaedrahmati, M., Mardi, M., Naghavi, M., Haravan, E. M., Nakhoda, B., Azadi, A., et al. (2014). Mapping QTLs associated with salt tolerance related traits in seedling stage of wheat (Triticum aestivum L.). J. Agric. Sci. Tech. 16, 1413–1428.
Ghassemi, F., Jakeman, A. J., and Nix, H. A. (1995). Salinisation of land and water resources: Human causes, extent, management and case studies. Wallingford, Oxfordshire: CAB international.
Großkinsky, D. K., Roitsch, T., and Liu, F. (2020). Higher activity of monodehydroascorbate reductase and lower activities of leaf and spike vacuolar invertase and glutathione S-transferase reveals higher number of grains per spike in spring wheat genotypes grown under well-watered and drought conditions. BMC Plant Biol.
Hasanuzzaman, M., Nahar, K., Rahman, A., Anee, T. I., Alam, M. U., Bhuiyan, T. F., et al. (2017). Approaches to enhance salt stress tolerance in wheat. Wheat improvement, management and utilization, 151–187.
Hazel, L. N. (1943). The genetic basis for constructing selection indexes. Genetics 28 (6), 476–490. doi:10.1093/genetics/28.6.476
Holm, S. (1979). A simple sequentially rejective multiple test procedure. Scand. Stat. Theory Appl. 65–70.
Hsiao, T. C., and Xu, L. K. (2000). Sensitivity of growth of roots versus leaves to water stress: Biophysical analysis and relation to water transport. J. Exp. Bot. 51 (350), 1595–1616. doi:10.1093/jexbot/51.350.1595
Hu, V. W., Addington, A., and Hyman, A. (2011). Novel autism subtype-dependent genetic variants are revealed by quantitative trait and subphenotype association analyses of published GWAS data. PLoS One 6 (4), e19067. doi:10.1371/journal.pone.0019067
Huang, Y., Bie, Z., He, S., Hua, B., Zhen, A., and Liu, Z. (2010). Improving cucumber tolerance to major nutrients induced salinity by grafting onto Cucurbita ficifolia. Environ. Exp. Bot. 69 (1), 32–38. doi:10.1016/j.envexpbot.2010.02.002
Huby, E., Napier, J. A., Baillieul, F., Michaelson, L. V., and Dhondt‐Cordelier, S. (2020). Sphingolipids: Towards an integrated view of metabolism during the plant stress response. New Phytol. 225 (2), 659–670. doi:10.1111/nph.15997
Hussain, B., Lucas, S. J., Ozturk, L., and Budak, H. (2017). Mapping QTLs conferring salt tolerance and micronutrient concentrations at seedling stagein wheat. Sci. Rep. 7, 15662. doi:10.1038/s41598-017-15726-6
Jajarmi, V. (2009). Effect of water stress on germination indices in seven wheat cultivar. World Academy of Science. Eng. Technol. 49, 105–106.
James, R. A., Blake, C., Byrt, C. S., and Munns, R. (2011). Major genes for Na+ exclusion, Nax1 and Nax2 (wheat HKT1;4 and HKT1;5), decrease Na+ accumulation in bread wheat leaves under saline and waterlogged conditions. J. Exp. Bot. 62 (8), 2939–2947. doi:10.1093/jxb/err003
Jamil, A., Riaz, S., Ashraf, M., and Foolad, M. (2011). Gene expression profiling of plants under salt stress. Crit. Rev. Plant Sci. 30 (5), 435–458. doi:10.1080/07352689.2011.605739
Jamil, M., Lee, C. C., Rehman, S. U., Lee, D. B., Ashraf, M., and Rha, E. S. (2005). Salinity (NaCl) tolerance of Brassica species at germination and early seedling growth. Electronic Journal of Environmental. J. Agric. Food Chem. 4 (4), 970–976.
Jiang, C., Belfield, E. J., Mithani, A., Visscher, A., Ragoussis, J., Mott, R., et al. (2012). ROS-mediated vascular homeostatic control of root-to-shoot soil Na delivery inArabidopsis. EMBO J. 31 (22), 4359–4370. doi:10.1038/emboj.2012.273
Jighly, A., Oyiga, B. C., Makdis, F., Nazari, K., Youssef, O., Tadesse, W., et al. (2015). Genome-wide DArT and SNP scan for QTL associated with resistance to stripe rust (Puccinia striiformis f. sp. tritici) in elite ICARDA wheat (Triticum aestivum L.) germplasm. Theor. Appl. Genet. 128 (7), 1277–1295. doi:10.1007/s00122-015-2504-2
Julkowska, M. M., and Testerink, C. (2015). Tuning plant signaling and growth to survive salt. Trends Plant Sci. 20 (9), 586–594. doi:10.1016/j.tplants.2015.06.008
Kandil, A., Sharief, A., and Elokda, M. (2012). Germination and seedling characters of different wheat cultivars under salinity stress. J. Basic Appl. Sci. 8 (2), 585–596. doi:10.6000/1927-5129.2012.08.02.52
Kassambara, A., and Mundt, F. (2017). Package ‘factoextra. Extr. Vis. results Multivar. data analyses 76 (2).
Kawa, D., and Testerink, C. (2017). Regulation of mRNA decay in plant responses to salt and osmotic stress. Cell. Mol. Life Sci. 74 (7), 1165–1176. doi:10.1007/s00018-016-2376-x
Landjeva, S., Neumann, K., Lohwasser, U., and Börner, A. (2008). Molecular mapping of genomic regions associated with wheat seedling growth under osmotic stress. Biol. Plant. 52 (2), 259–266. doi:10.1007/s10535-008-0056-x
Li, P., Chen, J., Wu, P., Zhang, J., Chu, C., See, D., et al. (2011). Quantitative trait loci analysis for the effect ofRht-B1Dwarfing gene on coleoptile length and seedling root length and number of bread wheat. Crop Sci. 51 (6), 2561–2568. doi:10.2135/cropsci2011.03.0116
Li, W., Zhang, H., Zeng, Y., Xiang, L., Lei, Z., Huang, Q., et al. (2020). A salt tolerance evaluation method for sunflower (Helianthus annuus L.) at the seed germination stage. Sci. Rep. 10 (1), 10626–10629. doi:10.1038/s41598-020-67210-3
Li, X., Wei, W., Li, F., Zhang, L., Deng, X., Liu, Y., et al. (2019). The plastidial glyceraldehyde-3-phosphate dehydrogenase is critical for abiotic stress response in wheat. Ijms 20 (5), 1104. doi:10.3390/ijms20051104
Lima, G. W., e Silva, C. M., Mezzomo, H. C., Casagrande, C. R., Olivoto, T., Borem, A., et al. (2022). Genetic diversity in tropical wheat germplasm and selection via multi‐trait index. J. Agron. 114 (2), 887–899. doi:10.1002/agj2.20991
Liu, J., He, Z., Rasheed, A., Wen, W., Yan, J., Zhang, P., et al. (2017). Genome-wide association mapping of black point reaction in common wheat (Triticum aestivum L.). BMC Plant Biol. 17, 220. doi:10.1186/s12870-017-1167-3
Liu, Y., Liu, Y., Zhang, Q., Fu, B., Cai, J., Wu, J., et al. (2018). Genome-wide association analysis of quantitative trait loci for salinity-tolerance related morphological indices in bread wheat. Euphytica 214 (10), 176. doi:10.1007/s10681-018-2265-5
Liu, Z., Zou, L., Chen, C., Zhao, H., Yan, Y., Wang, C., et al. (2019). iTRAQ-based quantitative proteomic analysis of salt stress in Spica Prunellae. Sci. Rep. 9, 9590. doi:10.1038/s41598-019-46043-9
Maranna, S., Nataraj, V., Kumawat, G., Chandra, S., Rajesh, V., Ramteke, R., et al. (2021). Breeding for higher yield, early maturity, wider adaptability and waterlogging tolerance in soybean (Glycine max L.): A case study. Sci. Rep. 11, 22853. doi:10.1038/s41598-021-02064-x
Masoudi, B., Mardi, M., Hervan, E. M., Bihamta, M. R., Naghavi, M. R., Nakhoda, B., et al. (2015). QTL mapping of salt tolerance traits with different effects at the seedling stage of bread wheat. Plant Mol. Biol. Rep. 33, 1790–1803. doi:10.1007/s11105-015-0874-x
Meyer, M., Huttenlocher, F., Cedzich, A., Procopio, S., Stroeder, J., Pau-Roblot, C., et al. (2016). The subtilisin-like protease SBT3 contributes to insect resistance in tomato. Exbotj 67 (14), 4325–4338. doi:10.1093/jxb/erw220
Mo, Y. (2018). Exploring natural and induced genetic variation controlling plant height in wheat. Davis: University of California.
Moud, A. M., and Maghsoudi, K. (2008). Salt stress effects on respiration and growth of germinated seeds of different wheat (Triticum aestivum L.) cultivars. World J. Agric. Sci. 4 (3), 351–358.
Munns, R. (2005). Genes and salt tolerance: Bringing them together. New Phytol. 167 (3), 645–663. doi:10.1111/j.1469-8137.2005.01487.x
Munns, R., James, R. A., and Läuchli, A. (2006). Approaches to increasing the salt tolerance of wheat and other cereals. J. Exp. Bot. 57 (5), 1025–1043. doi:10.1093/jxb/erj100
Munns, R., and James, R. A. (2003). Screening methods for salinity tolerance: A case study with tetraploid wheat. Plant soil 253 (1), 201–218. doi:10.1023/a:1024553303144
Munns, R., and Tester, M. (2008). Mechanisms of salinity tolerance. Annu. Rev. Plant Biol. 59, 651–681. doi:10.1146/annurev.arplant.59.032607.092911
Muñoz-Bertomeu, J., Cascales-Miñana, B., Mulet, J. M., Baroja-Fernández, E., Pozueta-Romero, J., Kuhn, J. M., et al. (2009). Plastidial glyceraldehyde-3-phosphate dehydrogenase deficiency leads to altered root development and affects the sugar and amino acid balance in Arabidopsis. Plant Physiol. 151 (2), 541–558. doi:10.1104/pp.109.143701
Mwando, E., Han, Y., Angessa, T. T., Zhou, G., Hill, C. B., Zhang, X.-Q., et al. (2020). Genome-wide association study of salinity tolerance during germination in barley (Hordeum vulgare L.). Front. Plant Sci. 11, 118. doi:10.3389/fpls.2020.00118
Olivoto, T., Diel, M. I., Schmidt, D., and Lúcio, A. D. C. (2021). Multivariate analysis of strawberry experiments: Where are we now and where can we go? BioRxiv 2020. doi:10.2012/2030.424876
Olivoto, T., and Lúcio, A. D. C. (2020). metan: An R package for multi-environment trial analysis. Methods Ecol. Evol. 11 (6), 783–789. doi:10.1111/2041-210x.13384
Olivoto, T., and Nardino, M. (2021). Mgidi: Toward an effective multivariate selection in biological experiments. Bioinformatics 37 (10), 1383–1389. doi:10.1093/bioinformatics/btaa981
Oyiga, B. C., Sharma, R., Shen, J., Baum, M., Ogbonnaya, F., Léon, J., et al. (2016). Identification and characterization of salt tolerance of wheat germplasm using a multivariable screening approach. J. Agro Crop Sci. 202 (6), 472–485. doi:10.1111/jac.12178
Pour-Aboughadareh, A., and Poczai, P. (2021). Dataset on the use of MGIDI index in screening drought-tolerant wild wheat accessions at the early growth stage. Data Brief 36, 107096. doi:10.1016/j.dib.2021.107096
Pour-Aboughadareh, A., Sanjani, S., Nikkhah-Chamanabad, H., Mehrvar, M. R., Asadi, A., and Amini, A. (2021). Identification of salt-tolerant barley genotypes using multiple-traits index and yield performance at the early growth and maturity stages. Bull. Natl. Res. Cent. 45 (1), 1–16. doi:10.1186/s42269-021-00576-0
Rahman, A., Nahar, K., Hasanuzzaman, M., and Fujita, M. (2016). Calcium supplementation improves Na+/K+ ratio, antioxidant defense and glyoxalase systems in salt-stressed rice seedlings. Front. Plant Sci. 7, 609. doi:10.3389/fpls.2016.00609
Rajabi Dehnavi, A., Zahedi, M., Ludwiczak, A., Cardenas Perez, S., and Piernik, A. (2020). Effect of salinity on seed germination and seedling development of sorghum (Sorghum bicolor (L.) Moench) genotypes. Agronomy 10 (6), 859. doi:10.3390/agronomy10060859
Ramasamy, R. K., Ramasamy, S., Bindroo, B. B., and Naik, V. G. (2014). Structure plot: A program for drawing elegant STRUCTURE bar plots in user friendly interface. SpringerPlus 3 (1), 431–433. doi:10.1186/2193-1801-3-431
Rashmi, G., and Naik, G. (2014). A comparative study on the effect of salt stress on seed germination and early seedling growth of two Hibiscus species. IOSR J. Agric. Vet. Sci. 7, 90–96.
Robbins, N. E., Trontin, C., Duan, L., and Dinneny, J. R. (2014). Beyond the barrier: Communication in the root through the endodermis. Plant Physiol. 166 (2), 551–559. doi:10.1104/pp.114.244871
Royo, A., and Abió, D. (2003). Salt tolerance in durum wheat cultivars. Span. J. Agric. Res. 1 (3), 27–35. doi:10.5424/sjar/2003013-32
Rufo, R., Salvi, S., Royo, C., and Soriano, J. M. (2020). Exploring the genetic architecture of root-related traits in mediterranean bread wheat landraces by genome-wide association analysis. Agronomy 10 (5), 613. doi:10.3390/agronomy10050613
Saboora, A., Kiarostami, K., Behroozbayati, F., and Hajihashemi, S. (2006). Salinity (NaCl) tolerance of wheat genotypes at germination and early seedling growth. Pak. J. Biol. Sci. 9 (11), 2009–2021. doi:10.3923/pjbs.2006.2009.2021
Saddiq, M. S., Iqbal, S., Afzal, I., Ibrahim, A. M., Bakhtavar, M. A., Hafeez, M. B., et al. (2019). Mitigation of salinity stress in wheat (Triticum aestivum L.) seedlings through physiological seed enhancements. J. Plant Nutr. 42 (10), 1192–1204. doi:10.1080/01904167.2019.1609509
Salem, K. F., and Mattar, M. Z. (2014). Identification of microsatellite alleles for salt tolerance at seedling stage in wheat (Triticum aestivum L.). Life Sci. 11 (12).
Sayed, M. A., Nassar, S. M., Moustafa, E. S., Said, M. T., Börner, A., and Hamada, A. (2021). Genetic mapping reveals novel exotic and elite QTL alleles for salinity tolerance in barley. Agronomy 11 (9), 1774. doi:10.3390/agronomy11091774
Shabala, S., and Munns, R. (2012). Salinity stress: Physiological constraints and adaptive mechanisms. Plant Stress Physiol. 1, 59–93. doi:10.1079/9781845939953.0059
Shafi, M., Bakhat, J., Khan, M. J., Khan, M. A., and Anwar, S. (2010). Effect of salinity on yield and ion accumulation of wheat genotypes. Pak. J. Bot. 42 (6), 4113–4121.
Sharma, A., Arif, M. A. R., Shamshad, M., Rawale, K. S., Brar, A., Burgueño, D., et al. (2022). Preliminary dissection of grain yield and related traits at differential nitrogen levels in diverse pre-breeding wheat germplasm through association mapping. Mol. Biotechnol. doi:10.1007/s12033-022-00535-8
Shi, Y., Gao, L., Wu, Z., Zhang, X., Wang, M., Zhang, C., et al. (2017). Genome-wide association study of salt tolerance at the seed germination stage in rice. BMC Plant Biol. 17 (1), 92. doi:10.1186/s12870-017-1044-0
Shokat, S., and Großkinsky, D. K. (2019). Tackling salinity in sustainable agriculture—What developing countries may learn from approaches of the developed world. Sustainability 11 (17), 4558.
Sidhu, J. S., Singh, D., Gill, H. S., Brar, N. K., Qiu, Y., Halder, J., et al. (2019). Genome-wide association study uncovers novel genomic regions associated with coleoptile length in hard winter wheat. Front. Genet. 10, 1345. doi:10.3389/fgene.2019.01345
Singh, J., Sastry, E. D., and Singh, V. (2012). Effect of salinity on tomato (Lycopersicon esculentum Mill.) during seed germination stage. Physiol. Mol. Biol. Plants. 18 (1), 45–50. doi:10.1007/s12298-011-0097-z
Singh, S., Vikram, P., Sehgal, D., Burgueño, J., Sharma, A., Singh, S. K., et al. (2018). Harnessing genetic potential of wheat germplasm banks through impact-oriented-prebreeding for future food and nutritional security. Sci. Rep. 8, 12527. doi:10.1038/s41598-018-30667-4
Song, J., Fan, H., Zhao, Y., Jia, Y., Du, X., and Wang, B. (2008). Effect of salinity on germination, seedling emergence, seedling growth and ion accumulation of a euhalophyte Suaeda salsa in an intertidal zone and on saline inland. Aquat. Bot. 88 (4), 331–337. doi:10.1016/j.aquabot.2007.11.004
Takahashi, F., Tilbrook, J., Trittermann, C., Berger, B., Roy, S. J., Seki, M., et al. (2015). Comparison of leaf sheath transcriptome profiles with physiological traits of bread wheat cultivars under salinity stress. PLoS One 10 (8), e0133322. doi:10.1371/journal.pone.0133322
Turki, N., Shehzad, T., Harrabi, M., and Okuno, K. (2015). Detection of QTLs associated with salinity tolerance in durum wheat based on association analysis. Euphytica 201 (1), 29–41. doi:10.1007/s10681-014-1164-7
Verslues, P. E., Agarwal, M., Katiyar-Agarwal, S., Zhu, J., and Zhu, J. K. (2006). Methods and concepts in quantifying resistance to drought, salt and freezing, abiotic stresses that affect plant water status. Plant J. 45 (4), 523–539. doi:10.1111/j.1365-313x.2005.02593.x
West, G., Inzé, D., and Beemster, G. T. (2004). Cell cycle modulation in the response of the primary root of Arabidopsis to salt stress. Plant Physiol. 135 (2), 1050–1058. doi:10.1104/pp.104.040022
Wickham, H. (2016). “Data analysis,” in ggplot2 (Springer), 189–201. doi:10.1007/978-3-319-24277-4_9
Williams, J. (1962). The evaluation of a selection index. Biometrics 18 (3), 375–393. doi:10.2307/2527479
Xue, D., Huang, Y., Zhang, X., Wei, K., Westcott, S., Li, C., et al. (2009). Identification of QTLs associated with salinity tolerance at late growth stage in barley. Euphytica 169 (2), 187–196. doi:10.1007/s10681-009-9919-2
Yin, L., Zhang, H., Tang, Z., Xu, J., Yin, D., Zhang, Z., et al. (2021). rMVP: a memory-efficient, visualization-enhanced, and parallel-accelerated tool for genome-wide association study. Genomics, Proteomics Bioinforma. 19 (4), 619–628. doi:10.1016/j.gpb.2020.10.007
Yusof, N. F. M., Saparin, N. F., Seman, Z. A., Ab Rahman, Z., Sew, Y. S., Shaharuddin, N. A., et al. (2021). Overexpression of rice metacaspase, OsMC4, increases endoplasmic reticulum stress tolerance in transgenic rice calli.
Zafar, S., Ashraf, M. Y., Niaz, M., Kausar, A., and Hussain, J. (2015). Evaluation of wheat genotypes for salinity tolerance using physiological indices as screening tool. Pak. J. Bot. 47 (2), 397–405.
Zeng, H., Xu, L., Singh, A., Wang, H., Du, L., and Poovaiah, B. (2015). Involvement of calmodulin and calmodulin-like proteins in plant responses to abiotic stresses. Front. Plant Sci. 6, 600. doi:10.3389/fpls.2015.00600
Zhang, H., and Wang, H. (2012). Evaluation of drought tolerance from a wheat recombination inbred line population at the early seedling growth stage. Afr. J. Agric. Res. 7 (46), 6167–6172. doi:10.5897/AJAR12.2004
Zhou, G., Johnson, P., Ryan, P. R., Delhaize, E., and Zhou, M. (2012). Quantitative trait loci for salinity tolerance in barley (Hordeum vulgare L.). Mol. Breed. 29 (2), 427–436. doi:10.1007/s11032-011-9559-9
Keywords: GBS, abiotic stress, salt tolerance, association mapping, Triticum aestivum L., candidate genes, MGIDI, SNP
Citation: Akram S, Ghaffar M, Wadood A, Shokat S, Hameed A, Waheed MQ and Arif MAR (2022) A GBS-based genome-wide association study reveals the genetic basis of salinity tolerance at the seedling stage in bread wheat (Triticum aestivum L.). Front. Genet. 13:997901. doi: 10.3389/fgene.2022.997901
Received: 19 July 2022; Accepted: 15 August 2022;
Published: 27 September 2022.
Edited by:
Reyazul Rouf Mir, Sher-e-Kashmir University of Agricultural Sciences and Technology, IndiaReviewed by:
Kalpana Singh, Indian Agricultural Statistics Research Institute (ICAR), IndiaDalia Z. Alomari, Aarhus University, Denmark
Pradeep Kumar Bhati, The International Maize and Wheat Improvement Center (CIMMYT), India
Shamseldeen Shehabeldin Eltaher, University of Sadat City, Egypt
Copyright © 2022 Akram, Ghaffar, Wadood, Shokat, Hameed, Waheed and Arif. This is an open-access article distributed under the terms of the Creative Commons Attribution License (CC BY). The use, distribution or reproduction in other forums is permitted, provided the original author(s) and the copyright owner(s) are credited and that the original publication in this journal is cited, in accordance with accepted academic practice. No use, distribution or reproduction is permitted which does not comply with these terms.
*Correspondence: Saba Akram, sabaakram3463@yahoo.com; Mian Abdur Rehman Arif, m.a.rehman.arif@gmail.com