 Fubo Ma1†
 Ming Xiao2†
 Lin Zhu3†Wen Jiang2Jizhe Jiang2
 Peng-Fei Zhang4,5Kang Li1,6
 Min Yue7*
 Le Zhang2,8,9*
- 1West China Biomedical Big Data Center, West China Hospital, Sichuan University, Chengdu, China
- 2College of Computer Science, Sichuan University, Chengdu, China
- 3China Animal Health and Epidemiology Center, Qingdao, Shandong, China
- 4Department of Medical Oncology, Cancer Center, West China Hospital, Sichuan University, Chengdu, China
- 5Med-X Center for Informatics, Sichuan University, Chengdu, China
- 6Shanghai Artificial Intelligence Laboratory, Shanghai, China
- 7Hainan Institute of Zhejiang University, Sanya, China
- 8Key Laboratory of Systems Biology, Hangzhou Institute for Advanced Study, University of Chinese Academy of Sciences, Chinese Academy of Sciences, Hangzhou, China
- 9Key Laboratory of Systems Health Science of Zhejiang Province, Hangzhou Institute for Advanced Study, University of Chinese Academy of Sciences, Hangzhou, China
Motivation: Brucella, the causative agent of brucellosis, is a global zoonotic pathogen that threatens both veterinary and human health. The main sources of brucellosis are farm animals. Importantly, the bacteria can be used for biological warfare purposes, requiring source tracking and routine surveillance in an integrated manner. Additionally, brucellosis is classified among group B infectious diseases in China and has been reported in 31 Chinese provinces to varying degrees in urban areas. From a national biosecurity perspective, research on brucellosis surveillance has garnered considerable attention and requires an integrated platform to provide researchers with easy access to genomic analysis and provide policymakers with an improved understanding of both reported patients and detected cases for the purpose of precision public health interventions.
Results: For the first time in China, we have developed a comprehensive information platform for Brucella based on dynamic visualization of the incidence (reported patients) and prevalence (detected cases) of brucellosis in mainland China. Especially, our study establishes a knowledge graph for the literature sources of Brucella data so that it can be expanded, queried, and analyzed. When similar “epidemiological comprehensive platforms” are established in the distant future, we can use knowledge graph to share its information. Additionally, we propose a software package for genomic sequence analysis. This platform provides a specialized, dynamic, and visual point-and-click interface for studying brucellosis in mainland China and improving the exploration of Brucella in the fields of bioinformatics and disease prevention for both human and veterinary medicine.
1 Introduction
Brucellosis is one of the most prevalent infectious diseases worldwide; it is common in low- and middle-income countries, including China, and infects both humans and animals. It is caused by Brucella, a Gram-negative bacterium that does not form spores and is generally non-motile. Brucellosis is often linked to animal reservoirs and has significant zoonotic potential. Brucella spp. Could infect humans through animals via different routes of contact (Assenga et al., 2015), including mucous membranes, the gastrointestinal tract, the respiratory tract, abraded skin, or the consumption of foods of animal origin (Zhou et al., 2020).
Detection of brucellosis is conducted by various methods, including cultural isolation, serodiagnosis, and molecular diagnosis (Yagupsky et al., 2019). Besides, researchers have used bioinformatics approaches to explore brucellosis based on the molecular biological properties of Brucella, such as by computationally analyzing the surface properties of Brucella outer membrane protein for vaccine design (Chen et al., 2021) or the correlation of the virulence with structural features of Brucella subtypes (Paci et al., 2020). At present, the development of sequencing technologies has obvious advantages in providing digital data in a cost-effective manner (Mardis, 2017) as well as in delivering high-resolution sequencing results, which is a portable precondition for comparative purposes. Next-generation sequencing followed by bioinformatics analysis (Zhang et al., 2019c; Fan et al., 2019; Liu G.-D. et al., 2020; Badai et al., 2020; Liu G. et al., 2020; Zhao et al., 2020; Wolkenhauer, 2021; You et al., 2022) has become the gold standard for epidemiological analysis of pathogenic microorganisms, including zoonotic bacteria.
The established approach for streamline analysis is well recognized. First, bacterial genomic DNA is extracted and subjected to sequencing according to the guidelines of the commercial platform; then, the obtained results are analyzed using bioinformatics software (Zhang et al., 2019a; Zhang et al., 2019d; Lei et al., 2020; Wu et al., 2020; You et al., 2020; Zhang et al., 2021a; Gao et al., 2021; Lei Zhang et al., 2021) or suitable platform databases (Xiao et al., 2020; Zhang et al., 2021b; Xiao et al., 2021) for the assembly and annotation of genomes, determination of SNPs, identification of antimicrobial resistance genes (Lv et al., 2021) and virulence-associated factors, building phylogenetic trees, etc. (Seemann, 2014; Johansen et al., 2018; Yasuhiro et al., 2018; Ledwaba et al., 2021; Liu et al., 2021). However, massive sequencing has led to the accumulation of genomes in databases without optimal exploration, which requires the development of suitable analysis software and integrated platforms to better understand the dynamic epidemiology of zoonotic bacteria.
Although analytic software for either genomic or epidemiological purposes is available, such as the software for genome alignment (Marçais et al., 2018), phylogenetic tree construction (Minh et al., 2020) and gene similarity comparison (Krzywinski et al., 2009), the analytic approach always takes the form of a static data presentation, lacking a dynamic data presentation and an interactive component. By integrating five commonly used genome analysis applications (Shovill, Prokka, Snippy, ABRicate and FastTree) for the study of Brucella, we can provide the user with a friendly and interactive graphical interface. Furthermore, national-scale, spatiotemporal surveillance databases are generally lacking in most countries throughout the world.
To address these existing limitations, we developed a comprehensive information platform for Brucella, which has two main innovations.
1) The software package is based on a combination of multiple visualized genome sequence analytic software programs for Brucella, allowing the splicing of the genome with Shovill (version 1.1.0), the annotation of genomes by Prokka (version 1.14.5), the identification of single nucleotide polymorphisms by Snippy (version 4.6.0), the location the antimicrobial resistance genes by ABRicate (version 1.0.0), and the construction of an evolutionary tree with FastTree (version 2.1.9); this combination provides users with a specialized software package to compute and analyse Brucella-related data with a point-and-click interface (Figure 1).
2) There is a visual interface for the incidence (reported disease cases) and the prevalence (detected cases) of brucellosis in China, that presents the spatiotemporal distribution of brucellosis incidence and the aggregation of each region using a map based on the years and hosts and incorporates the dynamic evolution and chronological prevalence of brucellosis in humans and animals through previous data collected from the literature; this allows the analysis of an epidemic situation of human and animal brucellosis in dynamic time (Figure 1).
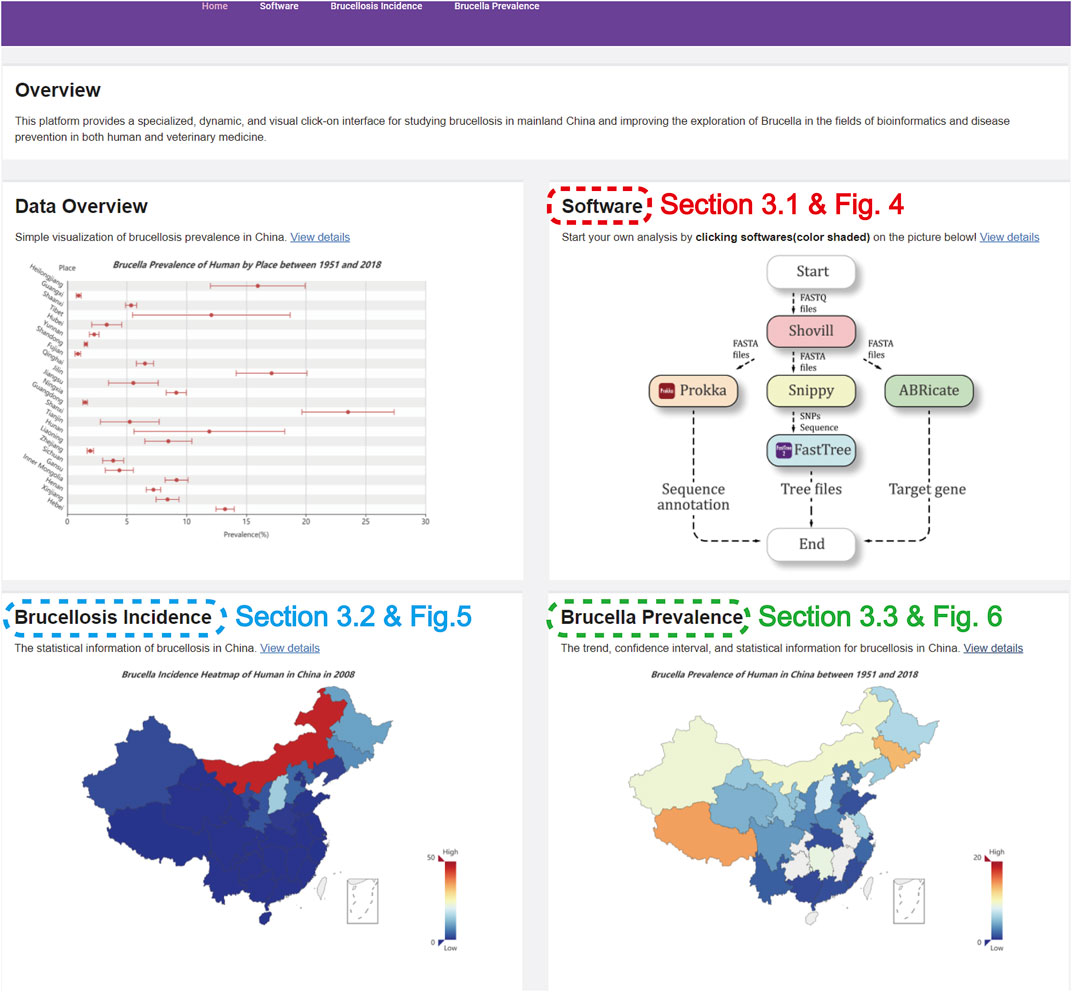
FIGURE 1. The homepage of the website.
Figure 1 describes the homepage of the comprehensive information platform of Brucella, which consists of an “Overview” and three functional modules.
The “Overview” introduces our work regarding Brucella, which shows the prevalence distribution of human brucellosis and animal brucellosis in various provinces of China. The “Software” module has five software programs for Brucella genome analysis and is detailed in Section 3.1. The “Brucellosis Incidence” module presents the spatial distribution of brucellosis incidence in mainland China and the aggregation of each region in map form and is detailed in Section 3.2. The “Brucella Prevalence” module visualizes and presents the brucellosis prevalence in mainland China using previous data collection based on the literature and is detailed in Section 3.3.
Overall, this platform integrates professional analytic software to provide easy, efficient, and rapid data analysis operations for the Brucella genome while also visualizing the incidence and prevalence of brucellosis in mainland China in an intuitive and interactive format. Moreover, this platform could provide high-performance computational extensions for future therapeutic research on brucellosis and may have advantages for brucellosis source tracking in the future.
2 Materials and methods
2.1 Website development
The Integrated Platform for Brucella was developed on the Linux server (CentOS 7.5.1804), which employs MySQL (version 8.0.20) as the database server. The back and front ends of the website are based on the Django framework (version 3.1.1) and bootstrap framework (version 4.4.1), respectively. We deployed the website (Figure 1) on http://www.combio-lezhang.online/brucella/index/to provide open access.1.2 Data collection and preprocessing.
The annual data on the incidence of human brucellosis are from the China Health Statistics Yearbook (Supplementary Table S1).
The annual data of the incidence of animal brucellosis are from the Qingdao Municipal Health Commission; incidence is calculated by the number of animals (stock) and the number of cases (Supplementary Table S2).
The Brucella prevalence data were collected from the College of Animal Sciences, Zhejiang University (Zhou et al., 2020), covering a total of 14,005 articles (Supplementary Table S3). These articles included 12,723 Chinese articles and 1,282 English articles, all of which were published before July 2018.
Figure 2 shows how to collect and organize Brucella prevalence information from 1,405 articles, which includes 357 high-quality articles and 688 data items related to this topic. Considering the significant discrepancies of different epidemiological studies in publication information, subjects, backgrounds and results (Messina et al., 2017; Xu et al., 2020), our study also establishes a knowledge graph for the literature sources of Brucella data so that it can be expanded, queried, and analyzed. Details of the knowledge graph and datasets can be accessed or downloaded from http://www.combio-lezhang.online/brucella/sample_page/.
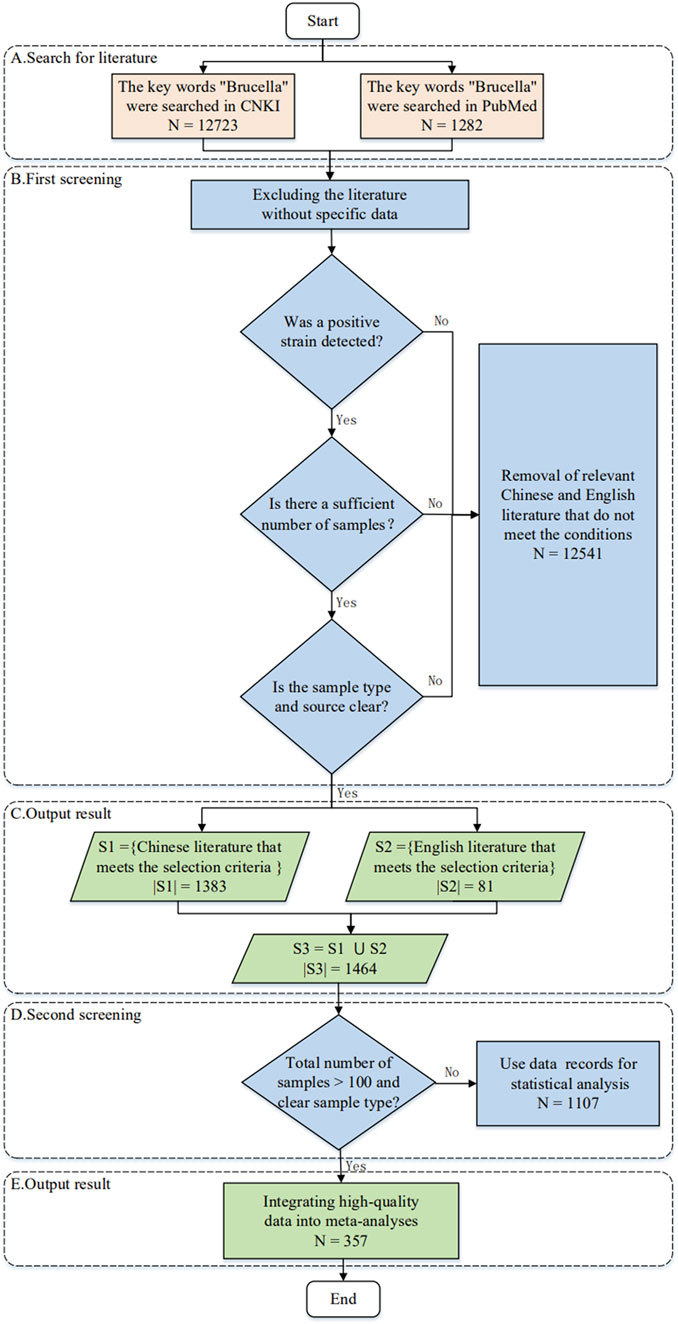
FIGURE 2. Flow chart for literature collection.
2.2 Computing methods for Brucella-related data
The study of the genome of Brucella can help us understand its interspecies and intraspecies evolutionary relationships and plays an important role in screening important genes and investigating their genetic mechanisms. The “Software” module integrates five genomic analysis software programs. Figure 3 illustrates the software workflow of the comprehensive information platform of Brucella as follows. First, users upload the sequenced FASTQ sequence file or FASTA sequence file onto the website and use the corresponding genome software step by step. The formats of the FASTQ and FASTA sequences are listed in Supplementary Tables S4, S5, respectively. The resulting file can be downloaded as a zip archive file.
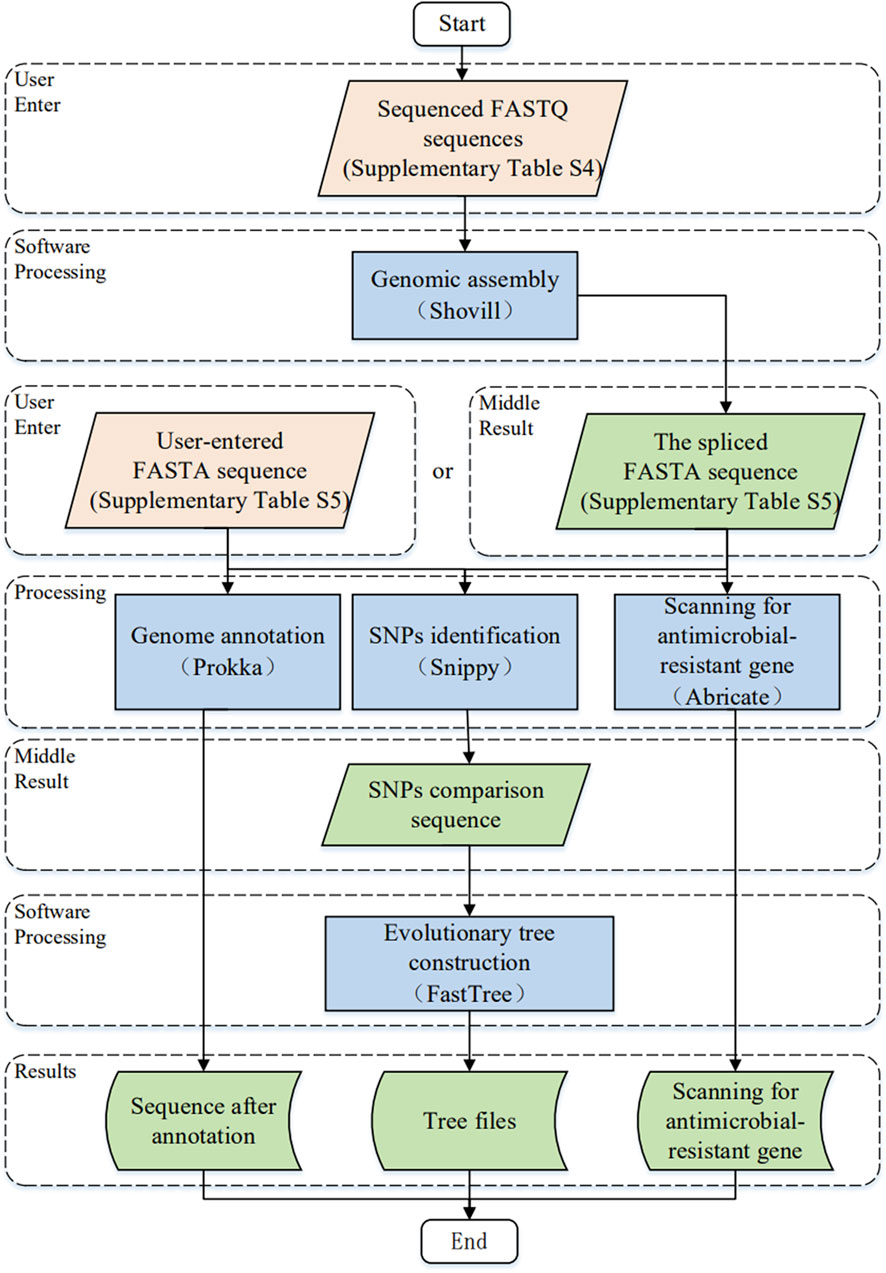
FIGURE 3. The workflow for software module development.
With respect to the study of Brucella (Zhou et al., 2020), we chose five commonly used applications (Shovill, Prokka, Snippy, ABRicate and FastTree) for data processing. Figure 3 illustrates the key input parameters of the platform based on the developed comprehensive information platform of Brucella; the advanced features for each genome analysis software program are detailed by Shovill (Seemann, 2018), Prokka (Seemann, 2014), Snippy (Seemann, 2019), ABRicate (Seemann, 2017) and FastTree (Price et al., 2009).
1) Genomic assembly: Shovill (version 1.1.0) is a pipeline for the assembly of bacterial isolate genomes from Illumina paired-end reads, which is detailed in section 4.1.1.
2) Genome annotation: Prokka (version 1.14.5) is used to provide genome annotation services, which are detailed in section 4.1.2.
3) Identification of single nucleotide polymorphisms: Snippy (version 4.6.0) is used for SNP identification, which is described in detail in section 4.1.3.
4) Scanning for antimicrobial resistant genes: ABRicate (version 1.0.0) is used to scan the antimicrobial resistant genes, which is detailed in section 4.1.4.
5) Evolutionary tree construction: FastTree (version 2.1.9) is used to provide the phylogenetic tree construction service, which is detailed in section 4.1.5.
2.3 Computing methods for the incidence of Brucella
The workflow for brucellosis incidence development can be referred on Supplementary Figure S1. Here, we use local Moran’s I to carry out an autocorrelation analysis of brucellosis on local areas, which is a commonly used method in the field of public health (Zhang et al., 2013; Chen et al., 2017; Yin et al., 2018). After data input, Eq. 1 is used to calculate the local Moran’s I (Waller and Gotway, 2004) for each region of mainland China. Next, these computed local Moran’s I value are input into Eqs 2–4 for z-score computations. Finally, the software package PySAL is used to compute the statistical significance of the local autocorrelation coefficients.
Equation. 1 is used to compute local Moran’s I.
Here,
The investigation of the local clustering of Brucella incidence in China can be then realized by the Z-test (Upton and Cook, 2008) of local Moran’s I in region
Where
Under the assumption that local Moran’s I follows the normal distribution, it can be considered statistically significant when
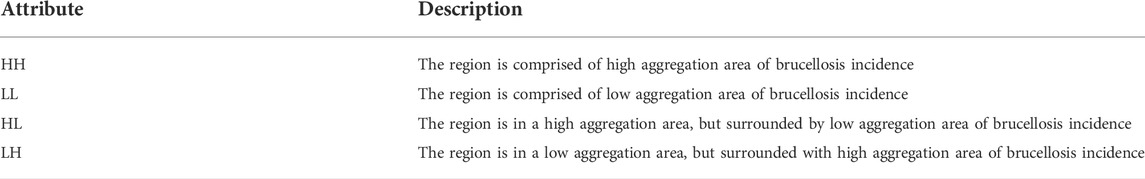
TABLE 1. Illustration of HH, LL, HL and LH.
2.4 Computing methods for the prevalence of Brucella
Investigating the prevalence of brucellosis can provide scientific data for the prevention of susceptible populations and serve as a reference to monitor epidemic prevention and the decontamination of breeding sites for brucellosis.
The workflow of the prevalence visualization module development for Brucella is described on Supplementary Figure S2. First, users can input the time interval and host. The input is then checked as to whether the collected prevalence of Brucella data is met (Supplementary Table S3). If it is met, Eq. 5 is used to compute the prevalence rate for each time interval and region. Simultaneously, Eqs 6, 7 and the software package Statsmodels (Seabold and Perktold, 2010) are used to compute the confidence interval of the prevalence rate for each time interval and region. The software package Echarts (version 4.8.0) (Bond and Goguen, 2002) is then used for prevalence visualization.
Equation 5 is used to compute the prevalence (Beaglehole et al., 1993), where
Equation. 6 is used to compute the prevalence for each test record i, where
3 Results
3.1 Software interface overview
In order to start a new Brucella analysis, users can click on the “software” link at the top of each page or the button of specific software on the flowchart (Figure 1).
Here, Figure 4A describes the analysis procedure. Especially, Figures 4B–D show our developed “automatic data filling function”, which can avoid the inconvenience of repeatedly submitting result files during a single analysis.
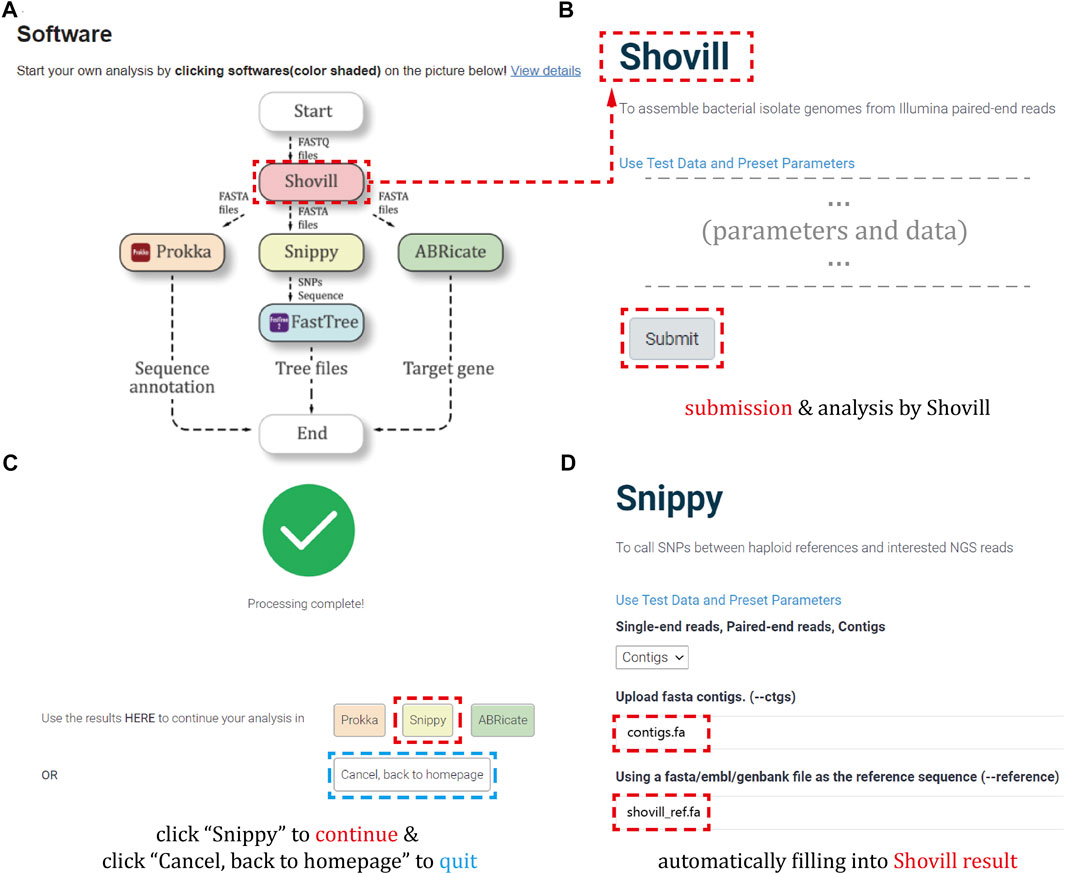
FIGURE 4. Analysis workflow. (A) The flowchart of the software analysis procedures on the homepage. (B) The example of starting a genomic analysis by data submission and parameter selection. (C) The interface of selecting corresponding software to continue the workflow when the analysis is completed. (D) The example of automatically filling results from previous step to the current software.
Next, we will sequentially introduce the background and the requested parameters for each software integrated in the platform (Supplementary Figures S4–S8).
3.1.1 Genomic assembly: Shovill
Shovill can help users assemble bacterial isolate genomes from Illumina paired-end reads for further comparison and analysis in the graphical tool of the phylogenetic tree (Seemann, 2018), which is described in Figure S4. Shovill uses SPAdes at its core, but alters the steps before and after the primary assembly step to obtain the similar results in less time.
Shovill shows 7 parameters. Among them, users must input “Forward reads (R1)” and “Reverse reads (R2)” entries. For example, users should upload the sequence files obtained by paired-end sequencing onto “Forward reads (R1)” and “Reverse reads (R2)”.
For another 5 parameters, including “Trim reads”, “Contig name format”, “Depth”, “Minimum contig length”, and “Minimum contig coverage”, if users click the sample file option “Use Test Data and Preset Parameters”, they can use the default parameters.
After users complete the parameter setting and click the “Submit” button, the system will generate 5 files in the specified output directory, which are shown in https://github.com/Rainbow-24/Brucella-supplementary. Each file has a common prefix, listed within Supplementary Table S6.
3.1.2 Genome annotation: Prokka
Prokka can help users quickly annotate the genomes of bacteria, archaea and viruses for further analysis or viewing in the genome browser and produce standards-compliant output files (Seemann, 2014), which is described in Supplementary Figure S5.
Prokka shows 15 parameters. Among them, users must input “Contigs to annotate” and “Kingdom (--kingdom)” entries. For example, users should upload the FASTA genome sequence file onto the “Contigs to annotate” and select the species type for “Kingdom (--kingdom)”.
For another 13 parameters, including “Locus tag prefix (--locustag)”, “Locus tag counter increment (--increment)”, “GFF version (--gffver)”, “Force GenBank/ENA/DDJB compliance (--compliant)”, “Add ; features for each “CDS” feature (--addgenes)”, “Minimum contig size (--mincontiglen)”, “Sequencing centre ID (--centre)”, “Genus name (--genus)”, “Species name (--species)”, “Strain name (--strain)”, “Plasmid name or identifier (--plasmid)”, “Use genus-specific BLAST database (--usegenus)”, and “Optional FASTA file of trusted proteins to first annotate from (--proteins)”, users can select the default parameters by clicking the sample file option Use Test (--Data and Parters)”.
After users complete the parameter setting and click the “Submit” button, the system will generate 12 files in the specified output directory, which are shown in https://github.com/Rainbow-24/Brucella-supplementary. Each file has a common prefix, listed within Supplementary Table S7.
3.1.3 Identification of single nucleotide polymorphisms: Snippy
Snippy can help users find SNPs between a reference genome and NGS sequence reads. Snippy will use as many CPUs as researcher can give it on a single computer (tested to 64 cores), and it is designed with speed in mind, and produces a consistent set of output files, including a core SNP alignment, in a single folder (and ultimately a phylogenomic tree) (Seemann, 2019), which is described in Supplementary Figure S6.
Snippy shows that users need to input 5 parameters. Among them, users need mandatory to input “Upload fasta contigs. (--ctgs)” and “Using a fasta/embl/genbank file as the reference sequence (--reference)” entries. For example, users should upload the FASTA genome sequence file onto the “Upload fasta contigs. (--ctgs)” and a reference sequence onto the “Using a file as the reference sequence (--reference)”.
For another 3 parameters, such as “Single-end reads, Paired-end reads, Contigs”, “Minimum mapping quality”, “Minimum coverage”, if users click the sample file option “Use Test Data and Preset Parameters”, they can use default parameters.
After users complete the parameter setting and click the “Submit” button, the system will generate 16 files in the specified output directory, which are in https://github.com/Rainbow-24/Brucella-supplementary. Each file has a common prefix, listed within Supplementary Table S8.
3.1.4 Scanning for antimicrobial-resistant genes: ABRicate
ABRicate, which comes bundled with multiple databases (NCBI, CARD, ARG-ANNOT, Resfinder, MEGARES, EcOH, PlasmidFinder, Ecoli_VF and VFDB), can help users mass screen contigs for antimicrobial resistance or virulence genes (Seemann, 2017), as described in Supplementary Figure S7. Abricate was used in monitoring the spread of multidrug-resistant genes (Arnott et al., 2018) and searching for drug-resistant plasmid carriage in E. coli (Zong et al., 2018).
ABRicate shows 5 parameters. Among them, users must input “Input file (Fasta, GenBank or EMBL file)” and “Database to use - default is ‘resfinder'” entries. For example, users should upload the genome sequence file of antimicrobial resistant genes into the “Input file (Fasta, GenBank or EMBL file)” and select the database for “Database to use - default is “resfinder”.
For another 3 parameters, such as “Suppress header“, “Minimum DNA %identity (0–100)“, “Minimum DNA %coverage (0–100)“, if users click the sample file option “Use Test Data and Preset Parameters“, they can use default parameters.
After users complete the parameter setting and click the “Submit“ button, the system will generate a tap-separated in the specified output directory, which is in https://github.com/Rainbow-24/Brucella-supplementary. It contains multiple columns, listed within Supplementary Table S9.
3.1.5 Evolutionary tree construction: FastTree
FastTree can help users infer approximate maximum-likelihood phylogenetic trees from the alignments of nucleotide or protein sequences to further estimate their reliability (Price et al., 2009), which is described in Supplementary Figure S8. For large alignments, FastTree is 100–1,000 times faster than previous methods, and is much more accurate than the distance-matrix methods that are traditionally used for large alignments.
FastTree shows 6 parameters. Among them, users must input “FASTA file“ and “Protein or nucleotide alignment“ entries. For example, users should upload a multiple sequence alignment file onto the “FASTA file” and select the sequence alignment type for “Protein or nucleotide alignment”.
For another 4 parameters, including “Aligned sequences file (FASTA or Phylip format)”, “Allow spaces and other restricted characters (but not ') in sequence and quote names in the output tree”, “Set starting tree”, and “Nucleotide evolution model”, if users click the sample file option “Use Test Data and Preset Parameters”, they can use the default parameters.
After users complete the parameter setting and click the “Submit” button, the system will generate a Tree file in Newick format in the specified output directory, which is shown in https://github.com/Rainbow-24/Brucella-supplementary.
3.2 Visualization of brucellosis incidence
The brucellosis incidence visualization module can show users the statistical information for brucellosis in China. After clicking the “Brucellosis Incidence” link on the homepage (Figure 1), the distribution and aggregation of brucellosis incidence in China can be queried, as shown in Figure 5.
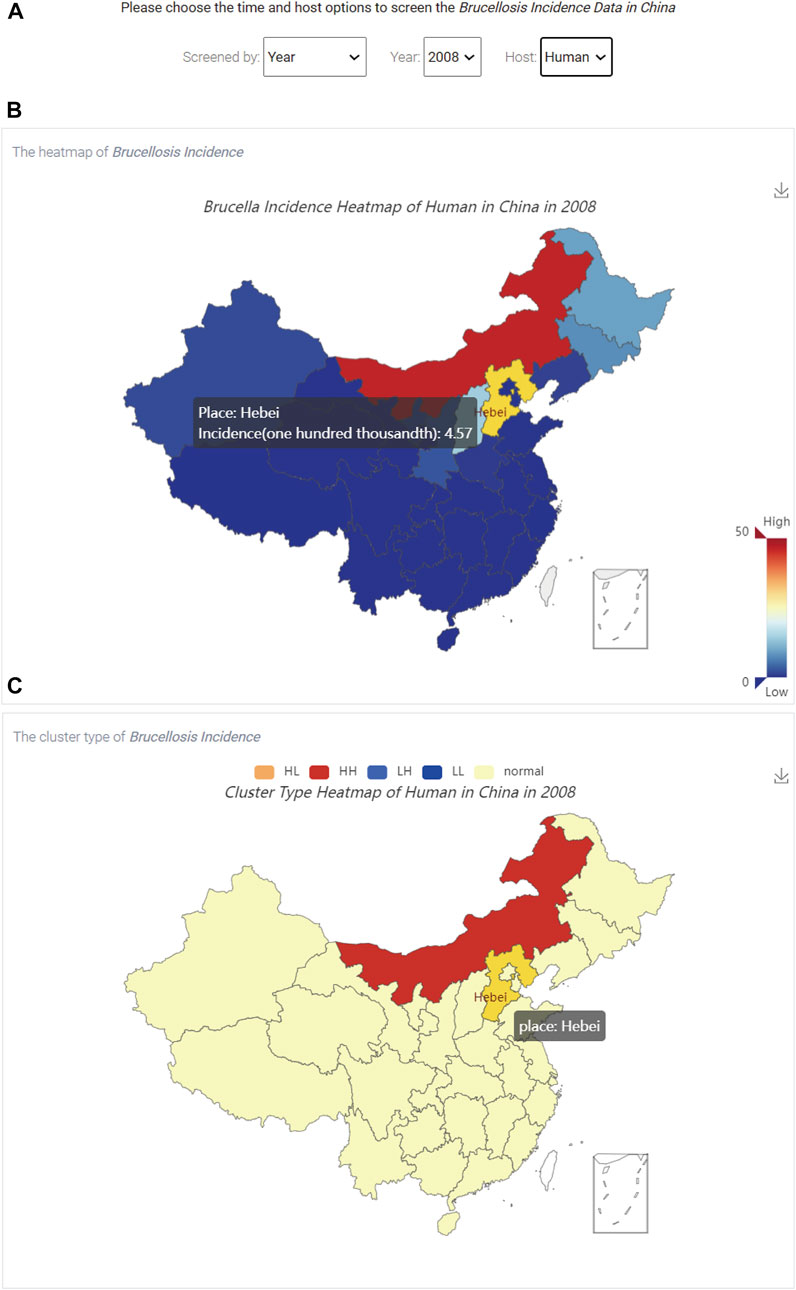
FIGURE 5. The visualization of brucellosis incidence in China. (A) The three option boxes; (B) The spatial distribution of brucellosis incidence; (C) The aggregation of brucellosis incidence.
Figure 5A shows that there are three options, including “Screened by”, “Year” and “Host” at the top of Figure 5, which represent the screening type (a specific year or a specific time interval), time and host, respectively. In addition, users can use the hyperlink in the upper right corner of Figure 5B to save the results in the specified output directory.
When users select the time and host, Figure 5B shows the spatial distribution of brucellosis incidence, and the colour of the box in the lower right corner represents the incidence rate from low to high. By hovering the mouse over different regions on the map of China, users can dynamically view the name of the region and brucellosis incidence data. Figure 5C shows the aggregation of brucellosis incidence. The five coloured boxes on the top represent the clustering or dispersion of brucellosis incidence, which are described in Table 1.
3.3 Visualization of Brucella prevalence
The prevalence in the Brucella visualization module can show the trend, confidence interval, and statistical information for brucellosis in China. After clicking the “Brucella Prevalence” link on the homepage (Figure 1), the visualization of Brucella prevalence in China can be queried, as shown in Figure 6.
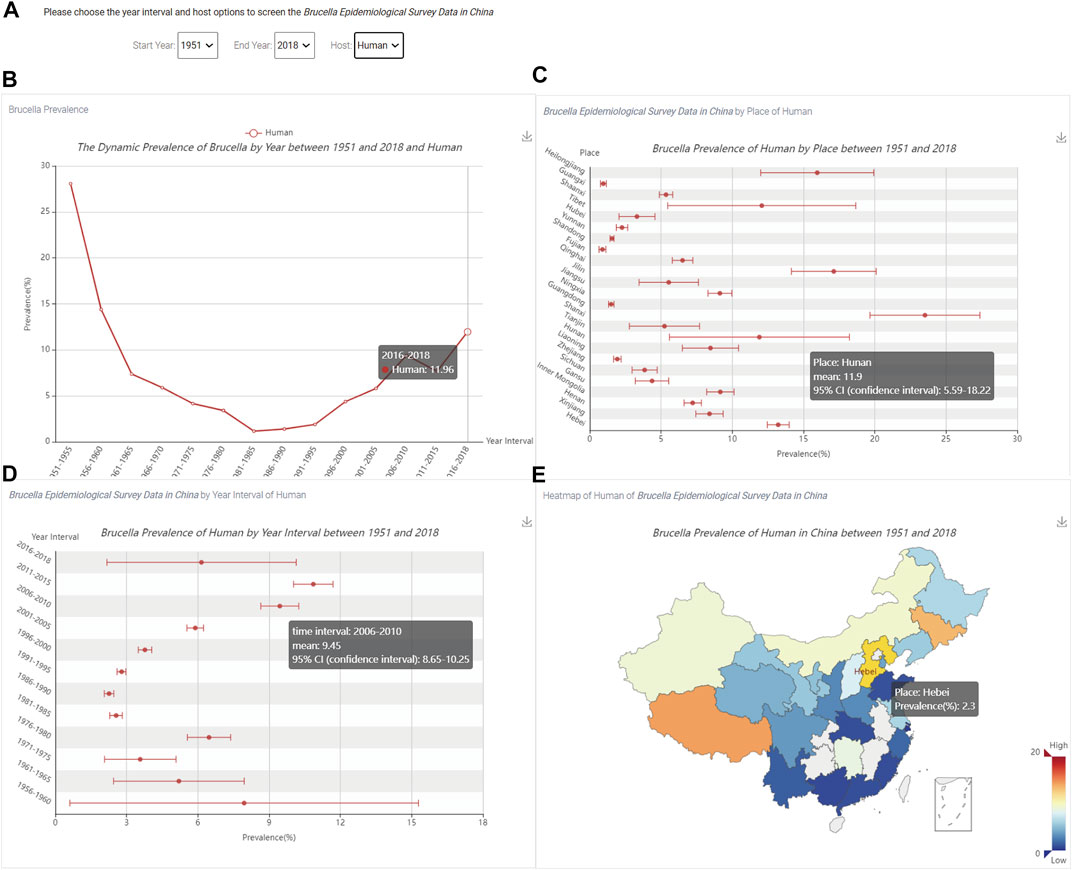
FIGURE 6. The visualization of the prevalence of Brucella in China. (A) The three option boxes; (B) The trend of human Brucella prevalence level; (C) The prevalence of Brucella by region; (D) The prevalence of Brucella for each time period; (E) The spatial distribution of the prevalence of Brucella.
Figure 6A shows three options: “Start Year”, “End Year” and “Host”. In addition, users can use the hyperlink in the upper right corner of Figures 6B–E to save the results in the specified output directory.
When users select the time and host, Figure 6B shows the trend of human Brucella prevalence level; the X-axis is the time period and Y-axis is the percent prevalence. By hovering the mouse over different time periods, users can dynamically view the Brucella prevalence by time period. Figure 6C shows the Brucella prevalence for each region; the X-axis is the percent prevalence, and the Y-axis is the name of each province in China. By hovering the mouse over different regions, users can dynamically view the province name, mean prevalence and 95% confidence interval. Figure 6D shows the Brucella prevalence for each time period; the X-axis is the percent prevalence, and the Y-axis is the time period. By hovering the mouse over different time periods, users can dynamically view the time period, mean prevalence and 95% confidence interval. Figure 6E shows the spatial distribution of Brucella prevalence, and the colour of the box in the lower right corner represents the prevalence from low to high. By hovering the mouse over different regions on the map of China, users can dynamically view the prevalence of Brucella for individual regions.
4 Discussion and conclusion
To the best of our knowledge, there is no previous visualization website for brucellosis (or other infectious agents) in China or elsewhere in the world that provides a framework to query the trend and predicted direction of the incidence of infectious diseases.
Therefore, we developed this platform to integrate five commonly used genomic applications for convenient Brucella-related genomic analysis and to dynamically visualize the incidence (reported patients) and prevalence (detected cases) of brucellosis in mainland China.
Especially, our study establishes a knowledge graph for the literature sources of Brucella data so that it can be expanded, queried and analyzed. When similar “epidemiological comprehensive platforms” are established in the distant future, we can use knowledge graph to share its information.
Importantly, the current incidence dataset (the reported cases) and the prevalence dataset, (the detected positive cases) have generally good agreement for the different geographic regions (Supplementary Figures S9, S10).
Moreover, the newly developed, national-scale database for Brucella could offer an essential toolkit for primary genomic analysis and, more importantly, establish a framework to understand the burden of brucellosis regarding humans vs animals in a dynamic way, over a long period of time (1953–2018), for 31 different geographic locations.
However, the current platform can only provide a reference for the genomic analysis process and cannot be fully embedded into all aspects of the bioinformatics analysis process; data on the incidence and prevalence of brucellosis are relatively fixed and do not allow for real-time updates of relevant data.
For these reasons, we will apply more sophisticated bioinformatics applications (Zhang et al., 2017a; Zhang et al., 2017b; Gao et al., 2017; Li et al., 2017; Xia et al., 2017; Zhang and Zhang, 2017; Zhang et al., 2018; Zhang et al., 2019b) to brucellosis research in the future to improve the scalability of the platform’s algorithms and the projection of dynamic data.
Data availability statement
The datasets presented in this study can be found in online repositories. The names of the repository/repositories and accession number(s) can be found in the article/Supplementary Material.
Ethics statement
Ethical review and approval was not required for the study on human participants in accordance with the local legislation and institutional requirements. Written informed consent for participation was not required for this study in accordance with the national legislation and the institutional requirements. Ethical review and approval was not required for the animal study because this manuscript contains the annual data of the incidence of animal brucellosis. All data in this paper is publicly available and does not refer to specific institutions, organizations or individuals.
Author contributions
LZ and MY conceived the project; FM, MX, and WJ developed the website; LZ collected literatures; JJ and PZ visualized the prevalence and incidence of brucella; FM and M. X designed the software workflow; FM, MX, KL, and LZ wrote the paper, LZ and MY supervised the project.
Funding
This work was supported by the National Program on Key Research Project of China (2021YFF1201200, 2019YFE0103900, and 2018ZX10201002), the European Union’s Horizon 2020 Research and Innovation Program under Grant Agreement (No. 861917–SAFFI), China Postdoctoral Science Foundation (2020M673221, China), Fundamental Research Funds for the Central Universities (2020SCU12056, China) and the Sichuan Science and Technology Program (2022YFS0048).
Conflict of interest
The authors declare that the research was conducted in the absence of any commercial or financial relationships that could be construed as a potential conflict of interest.
Publisher’s note
All claims expressed in this article are solely those of the authors and do not necessarily represent those of their affiliated organizations, or those of the publisher, the editors and the reviewers. Any product that may be evaluated in this article, or claim that may be made by its manufacturer, is not guaranteed or endorsed by the publisher.
Supplementary material
The Supplementary Material for this article can be found online at: https://www.frontiersin.org/articles/10.3389/fgene.2022.981633/full#supplementary-material
References
Arnott, A., Wang, Q., Bachmann, N., Sadsad, R., Biswas, C., Sotomayor, C., et al. (2018). Multidrug-resistant Salmonella enterica 4, [5], 12:i:- sequence type 34, new south wales, Australia, 2016-2017. Emerg. Infect. Dis. 24 (4), 751–753. doi:10.3201/eid2404.171619
Assenga, J. A., Matemba, L. E., Muller, S. K., Malakalinga, J. J., and Kazwala, R. R. (2015). Epidemiology of Brucella infection in the human, livestock and wildlife interface in the Katavi-Rukwa ecosystem, Tanzania. BMC Vet. Res. 11 (189), 189–211. doi:10.1186/s12917-015-0504-8
Badai, J., Bu, Q., and Zhang, L. (2020). Review of artificial intelligence applications and algorithms for brain organoid research. Interdiscip. Sci. 12 (4), 383–394. doi:10.1007/s12539-020-00386-4
Beaglehole, R., Bonita, R., and Kjellström, T. (1993). Basic epidemiology. Geneva: World Health Organization.
Bond, G. W., and Goguen, H. (2002). “ECharts: Balancing design and implementation,” in Proceedings of the 6 th IASTED international conference on software engineering and applications, 149–155.
Chen, X., Shao, S., Tian, Z., Xie, Z., and Yin, P. (2017). Impacts of air pollution and its spatial spillover effect on public health based on China's big data sample. J. Clean. Prod. 142, 915–925. doi:10.1016/j.jclepro.2016.02.119
Chen, Z., Zhu, Y., Sha, T., Li, Z., Li, Y., Zhang, F., et al. (2021). Design of a new multi-epitope vaccine against Brucella based on T and B cell epitopes using bioinformatics methods. Epidemiol. Infect. 149, e136. doi:10.1017/S0950268821001229
Fan, J., Fu, A., and Zhang, L. (2019). Progress in molecular docking. Quant. Biol. 7 (2), 83–89. doi:10.1007/s40484-019-0172-y
Feng, Y., Chen, L., and Chen, X. (2019). The impact of spatial scale on local Moran’s I clustering of annual fishing effort for Dosidicus gigas offshore Peru. J. Oceanol. Limnol. 37 (1), 330–343. doi:10.1007/s00343-019-7316-9
Gao, H., Yin, Z., Cao, Z., and Zhang, L. (2017). Developing an agent-based drug model to investigate the synergistic effects of drug combinations. Molecules 22 (12), 2209. doi:10.3390/molecules22122209
Gao, J., Liu, P., Liu, G.-D., and Zhang, L. (2021). Robust needle localization and enhancement algorithm for ultrasound by deep learning and beam steering methods. J. Comput. Sci. Technol. 36 (2), 334–346. doi:10.1007/s11390-021-0861-7
Johansen, T. B., Lonneke, S., Jensen, V. K., Jon, B., and Feruglio, S. L. (2018). Whole-genome sequencing and antimicrobial resistance in Brucella melitensis from a Norwegian perspective. Sci. Rep. 8 (1), 8538. doi:10.1038/s41598-018-26906-3
Krzywinski, M., Schein, J., Birol, I., Connors, J., Gascoyne, R., Horsman, D., et al. (2009). Circos: An information aesthetic for comparative genomics. Genome Res. 19 (9), 1639–1645. doi:10.1101/gr.092759.109
Ledwaba, M. B., Glover, B. A., Matle, I., rofiti, G. P., Heerden, H. V., Casadio, R., et al. (2021). Whole genome sequence analysis of Brucella abortus isolates from various regions of south Africa. Microorganisms 9 (3), 570. doi:10.3390/microorganisms9030570
Lei, W., Zeng, H., Feng, H., Ru, X., Li, Q., Xiao, M., et al. (2020). Development of an early prediction model for subarachnoid hemorrhage with genetic and signaling pathway analysis. Front. Genet. 11, 391. doi:10.3389/fgene.2020.00391
Lei Zhang, J. L., Xiao, M., Yang, L., and Zhang, L. (2021). Exploring the underlying mechanism of action of a traditional Chinese medicine formula, Youdujing ointment, for cervical cancer treatment. Quant. Biol. 9 (3), 292–302. doi:10.15302/j-qb-021-0236
Li, T., Cheng, Z., and Zhang, L. (2017). Developing a novel parameter estimation method for agent-based model in immune system simulation under the framework of history matching: A case study on influenza A virus infection. Int. J. Mol. Sci. 18 (12), 2592. doi:10.3390/ijms18122592
Liu, G.-D., Li, Y.-C., Zhang, W., and Zhang, L. (2020a). A brief review of artificial intelligence applications and algorithms for psychiatric disorders. Engineering 6 (4), 462–467. doi:10.1016/j.eng.2019.06.008
Liu, G., Li, Y. C., Wang, Y., Liu, J. X., Sang, Y. S., Zhang, W., et al. (2020b). Research on psychological scales based on the multitheory fusion. Curr. Bioinform. 15 (7), 741–749. doi:10.2174/1574893615666191227091641
Liu, Y., Jiang, J., Xia, L., -Dra, A., Li, X., Yue, M., et al. (2021). Prevalence and genomic investigation of Salmonella isolates recovered from animal food-chain in xinjiang, China. Food Res. Int. 142, 110198. doi:10.1016/j.foodres.2021.110198
Lv, J., Deng, S., and Zhang, L. (2021). A review of artificial intelligence applications for antimicrobial resistance. Biosaf. Health 3 (01), 22–31. doi:10.1016/j.bsheal.2020.08.003
Marçais, G., Delcher, A. L., Phillippy, A. M., Coston, R., Salzberg, S. L., and Zimin, A. (2018). MUMmer4: A fast and versatile genome alignment system. PLoS Comput. Biol. 14 (1), e1005944. doi:10.1371/journal.pcbi.1005944
Mardis, E. R. (2017). DNA sequencing technologies: 2006-2016. Nat. Protoc. 12 (2), 213–218. doi:10.1038/nprot.2016.182
Messina, A., Pribadi, H., Stichbury, J., Bucci, M., Klarman, S., and Urso, A. (2017). “BioGrakn: A knowledge graph-based semantic database for biomedical sciences,” in Conference on complex, intelligent, and software intensive systems (Springer), 299–309.
Minh, B. Q., Schmidt, H. A., Chernomor, O., Schrempf, D., Woodhams, M. D., Von Haeseler, A., et al. (2020). IQ-TREE 2: New models and efficient methods for phylogenetic inference in the genomic era. Mol. Biol. Evol. 37 (5), 1530–1534. doi:10.1093/molbev/msaa015
Paci, V., Krasteva, I., Orsini, M., Di Febo, T., Luciani, M., Perletta, F., et al. (2020). Proteomic analysis of Brucella melitensis and Brucella ovis for identification of virulence factor using bioinformatics approachs. Mol. Cell. Probes 53, 101581. doi:10.1016/j.mcp.2020.101581
Price, M. N., Dehal, P. S., and Arkin, A. P. (2009). FastTree: Computing large minimum evolution trees with profiles instead of a distance matrix. Mol. Biol. Evol. 26 (7), 1641–1650. doi:10.1093/molbev/msp077
Seabold, S., and Perktold, J. (2010). Statsmodels: Econometric and statistical modeling with Python. Python Sci. Conf. 10, 25080.
Seemann, T. (2017). ABRicate: Mass screening of contigs for antimicrobial resistance or virulence genes. [Online][Accessed] Available at: https://github.com/tseemann/abricate.
Seemann, T. (2014). Prokka: Rapid prokaryotic genome annotation. Bioinformatics 30 (14), 2068–2069. doi:10.1093/bioinformatics/btu153
Seemann, T. (2018). Shovill: Assemble bacterial isolate genomes from Illumina paired-end reads. [Online][Accessed] Available at: https://github.com/tseemann/shovill.
Seemann, T. (2019). Snippy: Rapid haploid variant calling and core genome alignment. [Online][Accessed] Available at: https://github.com/tseemann/snippy.
Waller, L. A., and Gotway, C. A. (2004). Applied spatial Statistics for public health data. John Wiley & Sons.
Wolkenhauer, O. (2021). Systems medicine: Integrative qualitative and computational approaches. USA: Academic Press.
Wu, W., Song, L., Yang, Y., Wang, J., Liu, H., and Zhang, L. (2020). Exploring the dynamics and interplay of human papillomavirus and cervical tumorigenesis by integrating biological data into a mathematical model. BMC Bioinforma. 21 (7), 152–158. doi:10.1186/s12859-020-3454-5
Xia, Y., Yang, C., Hu, N., Yang, Z., He, X., Li, T., et al. (2017). Exploring the key genes and signaling transduction pathways related to the survival time of glioblastoma multiforme patients by a novel survival analysis model. BMC Genomics 18 (1), 950–1011. doi:10.1186/s12864-016-3256-3
Xiao, M., Liu, G., Xie, J., Dai, Z., Wei, Z., Ren, Z., et al. (2021). 2019nCoVAS: Developing the web service for epidemic transmission prediction, genome analysis, and psychological stress assessment for 2019-nCoV. IEEE/ACM Trans. Comput. Biol. Bioinform. 18 (4), 1250–1261. doi:10.1109/TCBB.2021.3049617
Xiao, M., Yang, X., Yu, J., and Zhang, L. (2020). CGIDLA:Developing the web server for CpG island related density and LAUPs (Lineage-Associated underrepresented permutations) study. IEEE/ACM Trans. Comput. Biol. Bioinform. 17 (6), 2148–2154. doi:10.1109/TCBB.2019.2935971
Xu, J., Kim, S., Song, M., Jeong, M., Kim, D., Kang, J., et al. (2020). Building a PubMed knowledge graph. Sci. Data 7 (1), 205–215. doi:10.1038/s41597-020-0543-2
Yagupsky, P., Morata, P., and Colmenero, J. D. (2019). Laboratory diagnosis of human brucellosis. Clin. Microbiol. Rev. 33 (1), e00073–00019. doi:10.1128/CMR.00073-19
Yasuhiro, T., Takatomo, F., and Yasukazu, N. (2018). Dfast: A flexible prokaryotic genome annotation pipeline for faster genome publication. Bioinformatics 34 (6), 1037–1039. doi:10.1093/bioinformatics/btx713
Yin, C., He, Q., Liu, Y., Chen, W., and Gao, Y. (2018). Inequality of public health and its role in spatial accessibility to medical facilities in China. Appl. Geogr. 92, 50–62. doi:10.1016/j.apgeog.2018.01.011
You, Y., Lai, X., Pan, Y., Zheng, H., Vera, J., Liu, S., et al. (2022). Artificial intelligence in cancer target identification and drug discovery. Signal Transduct. Target. Ther. 7 (1), 156–224. doi:10.1038/s41392-022-00994-0
You, Y., Ru, X., Lei, W., Li, T., Xiao, M., Zheng, H., et al. (2020). Developing the novel bioinformatics algorithms to systematically investigate the connections among survival time, key genes and proteins for Glioblastoma multiforme. BMC Bioinforma. 21 (13), 383–414. doi:10.1186/s12859-020-03674-4
Zhang, L., Bai, W., Yuan, N., and Du, Z. (2019a). Comprehensively benchmarking applications for detecting copy number variation. PLoS Comput. Biol. 15 (5), e1007069. doi:10.1371/journal.pcbi.1007069
Zhang, L., Dai, Z., Yu, J., and Xiao, M. (2021a). CpG-island-based annotation and analysis of human housekeeping genes. Brief. Bioinform. 22 (1), 515–525. doi:10.1093/bib/bbz134
Zhang, L., Li, J., Yin, K., Jiang, Z., Li, T., Hu, R., et al. (2019b). Computed tomography angiography-based analysis of high-risk intracerebral haemorrhage patients by employing a mathematical model. BMC Bioinforma. 20 (7), 193–116. doi:10.1186/s12859-019-2741-5
Zhang, L., Li, Z., Li, P., Yang, X., Yu, J., and Zhao, J. (2019c). Research progress on the three-dimensional structure of genome. Sci. Sin. -Vitae. 50 (5), 484–496. doi:10.1360/ssv-2019-0115
Zhang, L., Liu, G., Kong, M., Li, T., Wu, D., Zhou, X., et al. (2019d). Revealing dynamic regulations and the related key proteins of myeloma-initiating cells by integrating experimental data into a systems biological model. Bioinformatics 37, 1554–1561. doi:10.1093/bioinformatics/btz542
Zhang, L., Liu, Y., Wang, M., Wu, Z., Li, N., Zhang, J., et al. (2017a). EZH2-CHD4-and IDH-linked epigenetic perturbation and its association with survival in glioma patients. J. Mol. Cell Biol. 9 (6), 477–488. doi:10.1093/jmcb/mjx056
Zhang, L., Xiao, M., Zhou, J., and Yu, J. (2018). Lineage-associated underrepresented permutations (LAUPs) of mammalian genomic sequences based on a Jellyfish-based LAUPs analysis application (JBLA). Bioinformatics 34 (21), 3624–3630. doi:10.1093/bioinformatics/bty392
Zhang, L., Zhang, L., Guo, Y., Xiao, M., Feng, L., Yang, C., et al. (2021b). Mcdb: A comprehensive curated mitotic catastrophe database for retrieval, protein sequence alignment, and target prediction. Acta Pharm. Sin. B 11 (10), 3092–3104. doi:10.1016/j.apsb.2021.05.032
Zhang, L., and Zhang, S. (2017). Using game theory to investigate the epigenetic control mechanisms of embryo development: Comment on: "Epigenetic game theory: How to compute the epigenetic control of maternal-to-zygotic transition" by qian wang et al. Phys. Life Rev. 20, 140–142. doi:10.1016/j.plrev.2017.01.007
Zhang, L., Zheng, C. Q., Li, T., Xing, L., Zeng, H., Li, T. T., et al. (2017b). Building up a robust risk mathematical platform to predict colorectal cancer. Complexity 2017, 1. doi:10.1155/2017/8917258
Zhang, W. Y., Wang, L. Y., Ding, F., Hu, W. B., Soares Magalhaes, R. J., Sun, H. L., et al. (2013). Scrub typhus in mainland China, 2006-2012: The need for targeted public health interventions. PLoS Negl. Trop. Dis. 7 (12), e2493. doi:10.1371/journal.pntd.0002493
Zhao, J., Cao, Y., and Zhang, L. (2020). Exploring the computational methods for protein-ligand binding site prediction. Comput. Struct. Biotechnol. J. 18, 417–426. doi:10.1016/j.csbj.2020.02.008
Zhou, K., Wu, B., Pan, H., Paudyal, N., Jiang, J., Zhang, L., et al. (2020). One health approach to address zoonotic brucellosis: A spatiotemporal associations study between animals and humans. Front. Vet. Sci. 7, 521. doi:10.3389/fvets.2020.00521
Keywords: Brucella, genomic analysis, epidemiology, databases, visualization
Citation: Ma F, Xiao M, Zhu L, Jiang W, Jiang J, Zhang P-F, Li K, Yue M and Zhang L (2022) An integrated platform for Brucella with knowledge graph technology: From genomic analysis to epidemiological projection. Front. Genet. 13:981633. doi: 10.3389/fgene.2022.981633
Received: 29 June 2022; Accepted: 30 August 2022;
Published: 14 September 2022.
Edited by:
Xuefeng Cui, Shandong University, ChinaReviewed by:
Junwei Luo, Henan Polytechnic University, ChinaBin Liu, Beijing Institute of Technology, China
Copyright © 2022 Ma, Xiao, Zhu, Jiang, Jiang, Zhang, Li, Yue and Zhang. This is an open-access article distributed under the terms of the Creative Commons Attribution License (CC BY). The use, distribution or reproduction in other forums is permitted, provided the original author(s) and the copyright owner(s) are credited and that the original publication in this journal is cited, in accordance with accepted academic practice. No use, distribution or reproduction is permitted which does not comply with these terms.
*Correspondence: Le Zhang, zhangle06@scu.edu.cn; Min Yue, myue@zju.edu.cn
†These authors have contributed equally to this work and share first authorship