 Yanfei Wang
 Jacqueline Chyr
 Pora Kim
 Weiling Zhao
- Center for Computational Systems Medicine, School of Biomedical Informatics, The University of Texas Health Science Center at Houston, Houston, TX, United States
Background: Osteoarthritis (OA) is a common cause of disability and pain around the world. Epidemiologic studies of family history have revealed evidence of genetic influence on OA. Although many efforts have been devoted to exploring genetic biomarkers, the mechanism behind this complex disease remains unclear. The identified genetic risk variants only explain a small proportion of the disease phenotype. Traditional genome-wide association study (GWAS) focuses on radiographic evidence of OA and excludes sex chromosome information in the analysis. However, gender differences in OA are multifactorial, with a higher frequency in women, indicating that the chromosome X plays an essential role in OA pathology. Furthermore, the prevalence of comorbidities among patients with OA is high, indicating multiple diseases share a similar genetic susceptibility to OA.
Methods: In this study, we performed GWAS of OA and OA-associated key comorbidities on 3366 OA patient data obtained from the Osteoarthritis Initiative (OAI). We performed Mendelian randomization to identify the possible causal relationship between OA and OA-related clinical features.
Results: One significant OA-associated locus rs2305570 was identified through sex-specific genome-wide association. By calculating the LD score, we found OA is positively correlated with heart disease and stroke. A strong genetic correlation was observed between knee OA and inflammatory disease, including eczema, multiple sclerosis, and Crohn’s disease. Our study also found that knee alignment is one of the major risk factors in OA development, and we surprisingly found knee pain is not a causative factor of OA, although it was the most common symptom of OA.
Conclusion: We investigated several significant positive/negative genetic correlations between OA and common chronic diseases, suggesting substantial genetic overlaps between OA and these traits. The sex-specific association analysis supports the critical role of chromosome X in OA development in females.
Introduction
As one of the top reasons for morbidity and disability, osteoarthritis (OA) has affected over 32.5 million adults in the United States (Barbour et al., 2017). In 2004, the cost of OA management was $336 billion, or 3% of the United States’ GDP. As the most common form of arthritis, the economic burden of OA is quickly growing due to obesity prevalence and aging. By 2030, an estimated 20 percent of Americans (about 70 million people) will be at risk of developing this disease (Chu et al., 2012; Yelin et al., 2016). OA is a disease of the whole joint based on the characterized degenerative changes in bone, cartilages, menisci, and ligaments (Zhang et al., 2016; Chen et al., 2017; Zhang et al., 2019). The subsequent pain and stiffness usually cause inconveniences in patients’ daily lives. Unfortunately, OA is still an irreversible degenerative disease without effective disease-specific drugs (Sharma et al., 2001a; Boer et al., 2021), and current treatment focuses on ameliorating symptoms such as pain relief. The pathology of OA disease is still unclear. Thus, there is an urgent need to understand disease etiopathology and identify new drug targets.
Twin studies and family-based epidemiologic studies have revealed the heritability of OA susceptibility (Palotie et al., 1989; Spector et al., 1996; Felson et al., 1998). One sibling study estimated the heritability for knee OA at 0.62 (Neame et al., 2004), suggesting a substantial involvement of genetic factors in the development of the OA. Many efforts have been devoted to identifying the genetic biomarkers for the diagnosis of OA, where they used Kellgren-Lawrence (KL) grade (KL ≥ 2) to define OA occurrence. Several candidate genes have been identified to be associated with the diagnosis of knee OA such as GDF5, NCOA3, CHST11, FTO, and ALDH1A2 (Valdes et al., 2011; Loughlin, 2015; Yau et al., 2017; Takuwa et al., 2018). Zengini et al. reported nine genetic loci over the genome-wide significance threshold in GWAS (Zengini et al., 2018). Rs3815148 on chromosome 7 is found to influence susceptibility for the prevalence of OA (Kerkhof et al., 2010; Evangelou et al., 2011).
Most OA-related studies have focused on the influence of genetic factors on OA, and few studies have explored the genetic links between OA and other chronic diseases. Like other aging diseases, the prevalence of comorbidities among patients with OA is high. A recent epidemiological study found that patients with OA have twice as many comorbid conditions as those without OA. (Marshall et al., 2019). A meta-analysis of 42 studies reports that thirty-five percent of OA patients have cardiovascular disease, sixteen percent have ulcers and 14 percent have diabetes (Louati et al., 2015; Swain et al., 2020). Although the dominant approach of GWAS is to identify the association between one single-nucleotide polymorphism (SNP) and a binary disease indicator, multiple studies have revealed some diseases may be genetically correlated (Piva et al., 2015; Courties and Sellam, 2016; Barowsky et al., 2021; Zhang et al., 2022). In another word, these diseases may share the same genetic variants. Therefore, we conducted a phenotype-genotype comorbidity analysis of patients with a high risk of OA using the Osteoarthritis Initiative (OAI) data. We also performed multi-genotype tests to detect OA genetic variations related to OA clinical phenotypes. Despite the higher prevalence of OA in women, traditional GWAS often excludes sex chromosomes, leading to the unknown role of the chromosome X in OA (Laitner et al., 2021). Therefore, we performed sex-specific GWAS to fill this gap.
Materials and methods
Study design and analysis plan
To identify the potential genetic biomarkers associated with OA in Caucasians, genome-wide associations were performed on the OAI dataset using logistic regression in PLINK (Chang et al., 2015). In this cohort, participants aging between 45 and 79 years old were recruited from five different clinical sites, including the University of Maryland School of Medicine, the Ohio State University, the University of Pittsburgh, Memorial Hospital of Rhode Island, and the University of California (https://nda.nih.gov/oai). Longitudinal MRI/CT images, genotyping data, and clinical information was analyzed to evaluate potential biomarkers and characterize OA incidents and progression (Peterfy et al., 2008; Eckstein et al., 2012; Eckstein et al., 2014). The assessed GWAS results were adjusted for age, gender, and BMI. The results with a p-value
Phenotype definition and study populations
Population stratification is a primary confounder in GWAS, causing false-positive signals. Therefore, we performed principal component analysis (PCA) on two major races, Caucasian and African American, to identify the population structure with common variants. The structure of genetic variants of the two populations is significantly different in Figure 1A. A total number of 3366 OA Caucasian patients were selected from the OAI database. 1,498 patients are males and 1868 are females. To identify the genetic variants associated with OA, we conducted a GWAS based on this dataset. The OA disease was defined as KL score
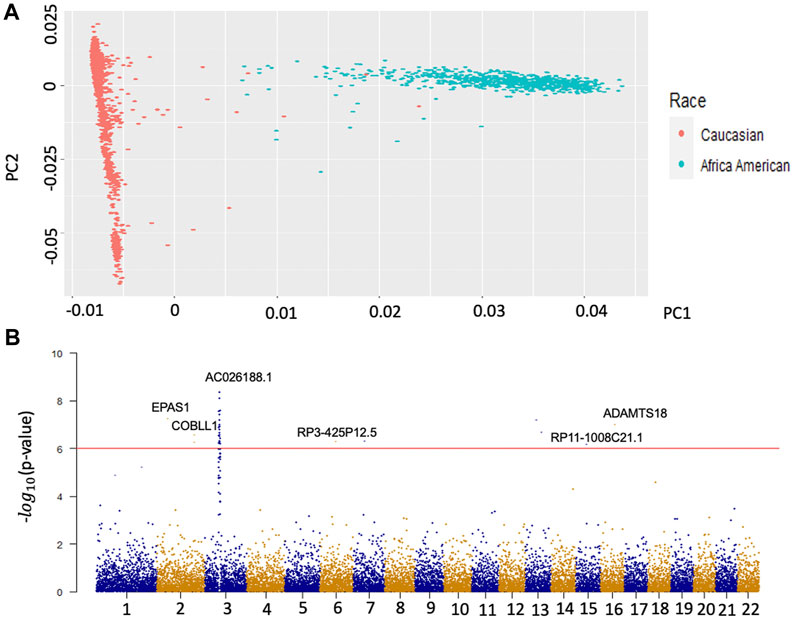
FIGURE 1. Population Stratification of two main races and Manhattan plots of GWAS for OA. Panel A is the result of the first two principal components. The red dots represent the population structure of Caucasians on the whole genotype matrix. The green dots represent the population structure of African Americans on the whole genotype matrix. Panel B is the Manhattan plot of the results from the GWAS of Caucasian OA. The y axis represents –log (p values) for the association of variants with OA. The horizontal red line represents the threshold for genome-wide significance.
In addition to these binary disease indicators, continuous OA-related phenotypes such as The Western Ontario and McMaster Universities Osteoarthritis (WOMAC) pain score, WOMAC stiffness, knee alignment, the total area of subchondral bone, and medial bone mineral density (BMD) were included. These participants were the same group of available KL score population. The most common symptoms of OA are pain and stiffness. WOMAC pain score, ranging from 0 to 20, uses five questionnaires to self-assess pain levels with activities of daily living. WOMAC stiffness, similar to WOMAC pain score, ranges from 0 to 8. Knee alignment (hip-knee-ankle alignment) and BMI are known as risk factors for the incidence and progression of OA with different joint loading measurements (Messier et al., 2014). The pathology of OA is characterized by modeling subchondral bone (Donell, 2019). The total area of subchondral bone and medial BMD are both indicators for the formation of osteophytes (Xiao et al., 2010; Donell, 2019).
Genotyping and imputation
OAI participants were genotyped with Illumina Omni-Quad 2.5 M arrays, including genotype information for 2,440,283 SNPs. SNPs with low minor allele frequency (MAF <1%) were excluded. Genotype imputation was conducted using IMPUTE2 (Browning and Browning, 2016) with 1000 Genomes Project Phase 3 as the reference and 8,248,570 SNPs in OAI were obtained.
Genetic correlation analysis
For phenotype-genotype comorbidity analysis, the complex trait analysis (GCTA) tool (Yang et al., 2011) was used to assess the variance explained by all the SNPs on the whole genome. To identify common diseases that share genetic architecture with OA, linkage disequilibrium (LD) score regression from LD Hub was used (Zheng et al., 2017). The additive genetic covariance between two traits was scaled by the square root of the product of each trait’s genetic variance to determine the genetic correlation (Ni et al., 2018). Instead of using individual-level genotype data, the genetic correlation
Mendelian randomization
To identify the role of exposure (knee alignment/pain) in the susceptibility of OA, two-sample Mendelian randomization (MR) analysis was performed on the MR-Base platform (Walker et al., 2019). MR uses significantly associated SNPs as instrumental variables to quantify causal relationships between risk factors and OA. By including genetic variants, MR reduced the impact of confounding, even “reverse causality” based on Mendel’s second law (Bennett and Holmes, 2017). Specifically, the causal relationship is estimated by computing the association between identified significant SNPs for the risk factor and OA. Figure 5A illustrates the estimation of MR. The causal associations were estimated by three different methods, namely, inverse variance weighted (IVW), MR–Egger (Bowden et al., 2015), and weighted median (WM). The IVW method uses the Wald ratios to estimate the causal effects of each SNP and is easily biased by inverse variance or pleiotropic effects. MR–Egger is a weighted linear regression under the assumption that pleiotropic associations are independent. The WM is useful when at least 50% of effects came from inverse variances. In general, we performed GWAS on pain, and knee alignment using the OAI dataset respectively and obtained SNPs that were strongly associated (
Gene-set and tissue expression analysis by FUMA
FUMA (Watanabe et al., 2017) uses GTEx (Ardlie et al., 2015) data for tissue-specific expression patterns and identifies tissue specificity of prioritized genes. Based on the GWAS summary statistics, FUMA identifies significant independent SNPs and genomic loci based on LD structure. The significant independent SNPs are then annotated on gene function using ANNOVAR (Wang et al., 2010) based on Ensembl and their effects on gene expression using eQTLs of various tissue types. The enrichment of significant genes and functional categories is evaluated by a hypergeometric test.
Results
Identification of genetic loci associated with OA by genome-wide association study
To eliminate unknown population-associated sub-structures, this study focused on the Caucasian population. The OA GWAS result is presented in Figure 1B. We identified 164 significant variants mapped on 79 genes (
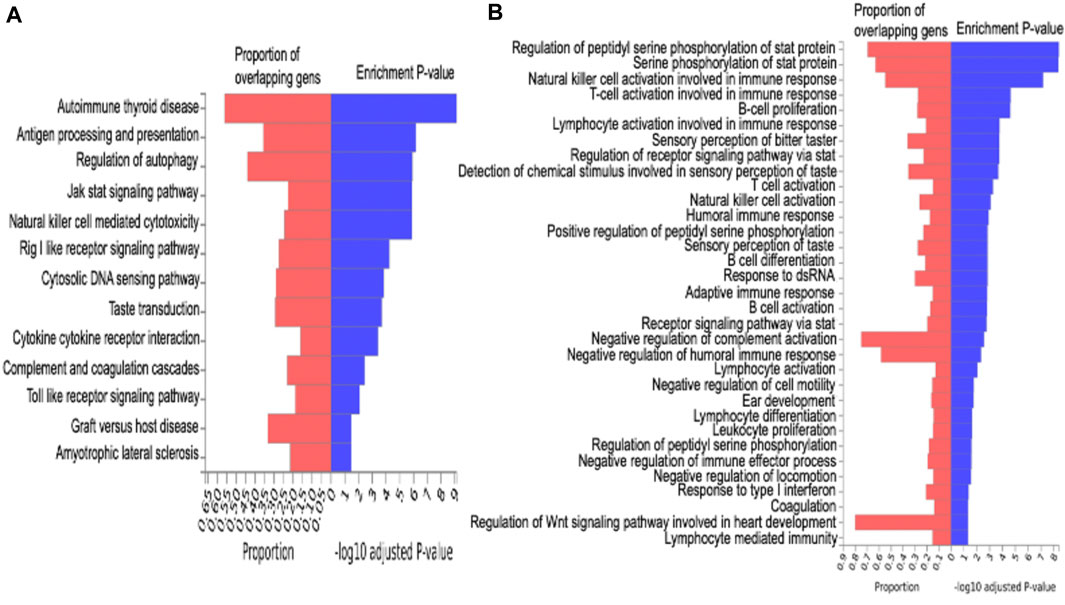
FIGURE 2. Enrichment analysis. Figure A is the KEGG pathway analysis for functional enrichment clustering analysis. Figure B is gene ontology (GO) enrichment analysis.
Local genetic correlation between OA and common comorbidities
As shown in Figure 3, comorbidities are significantly associated with OA severity. For example, strokes were more likely to be found in patients with KL = 1, patients with KL = 2 are more likely to have diabetes and asthma, and heart diseases mostly occurred in patients with KL = 3. To identify the common loci of significance to most comorbidities, we performed the GWAS on different comorbidity diseases. Based on these GWAS results, we found significant positive correlations between OA and heart disease (coefficient = 0.5, se = 0.66) and stroke (coefficient = 0.2, se = 0.88). Table 1 listed the correlation between each significant SNP and common OA comorbidities. The first column is the overall estimated correlation for each single loci in risk factors. The second column is the p-value, while the significant threshold is set as
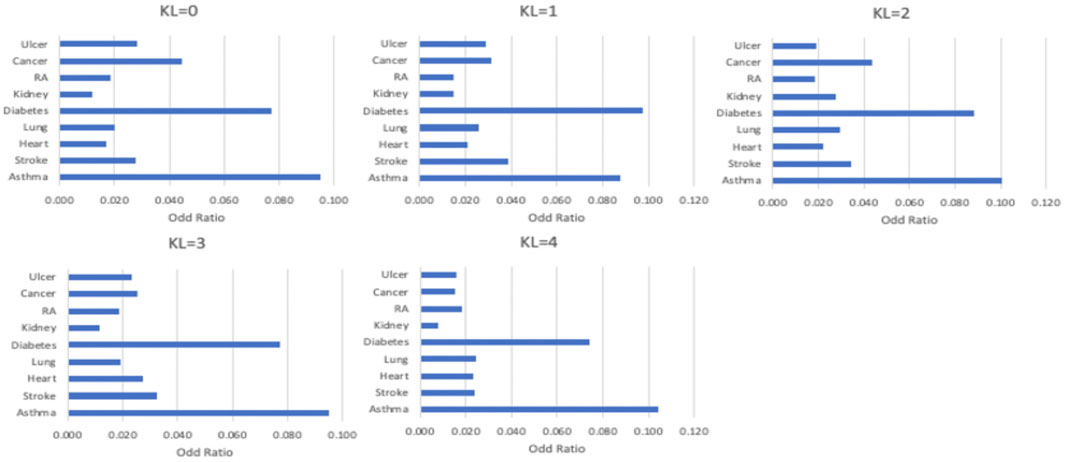
FIGURE 3. The distribution of comorbidity in different OA severity.
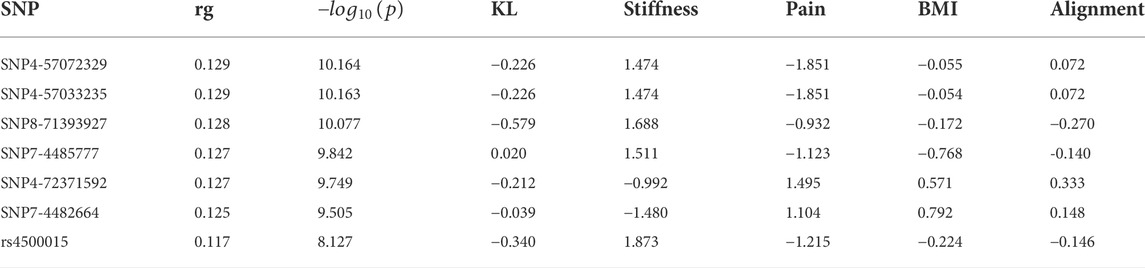
TABLE 1. The lead SNPs at independent loci reaching
Global genetic correlation between osteoarthritis and other complex traits
The correlation matrix between OA and a subset of common diseases is represented in Figure 4. Our analysis highlights eight significant genetic correlations for knee OA (Figure 4). The negative genetic correlation between knee OA and M16 coxarthrosis/arthrosis of the hip (
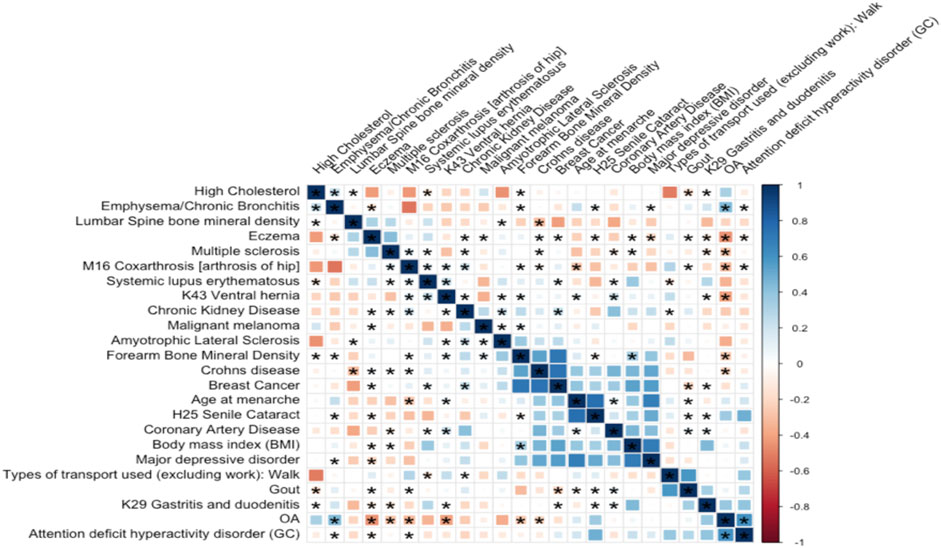
FIGURE 4. Genetic correlation between OA and 23 highly correlated disease traits. The square color corresponds to
Causal relationship between known clinical indicators and osteoarthritis
Pain and abnormal knee alignment are common symptoms of OA. Figure 5A shows the estimated causal associations of clinical indicators (pain, knee alignment) with OA based on Mendelian randomization (MR). The effects of SNP on pain and OA are shown in Figure 5B. There is no causal relationship between pain and risk of knee OA since the slopes of all MR lines were close to 0. In Figure 5C, 4 MR methods, including IVW, simple mode, weighted mode, and weighted median, identified a role for knee alignment in OA risk. Having alignment of more than 5 degrees (in either direction) in both knees at baseline was associated with significantly greater functional deterioration during the 18 months than having alignment of 5 degrees or less in both knees (Sharma et al., 2001b). Figure 5D listed significant SNPs linking knee alignment level and OA.
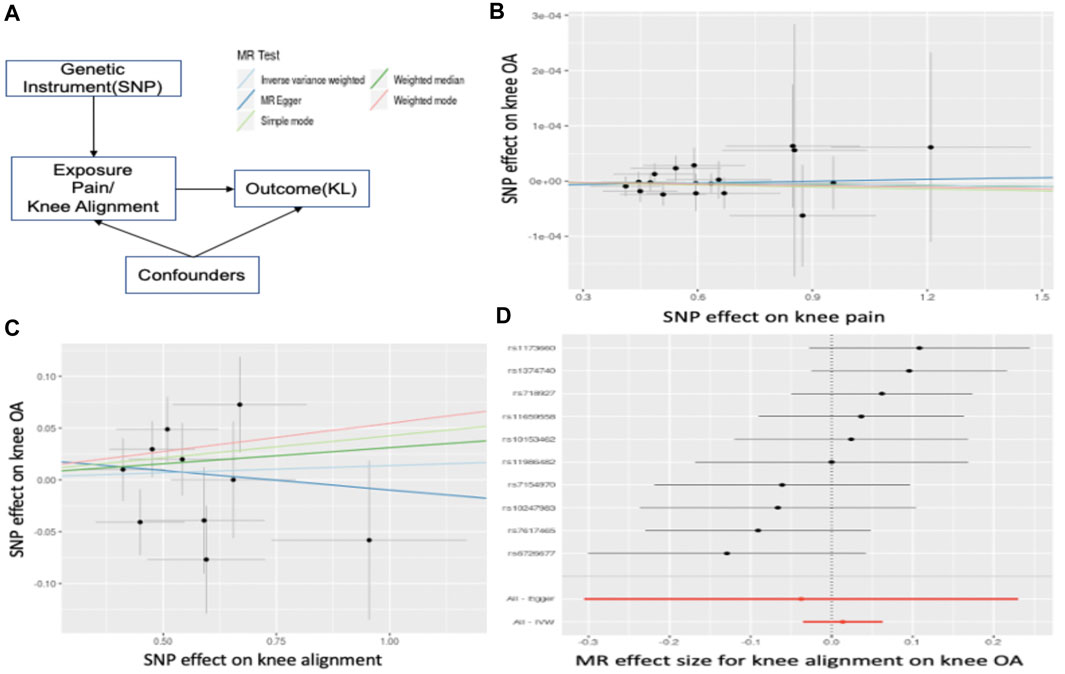
FIGURE 5. Mendelian Randomization. (A) illustrates the estimation of MR. In (B), the x-axis represents the effect of SNPs on pain level and the y-axis is the effect of SNPs on OA. The slope is the estimated causal effect. In (C), the x-axis represents the effect of SNPs on abnormal knee alignment levels and the y-axis is the effect of SNPs on OA. (D) listed significant SNPs linking knee alignment level and OA. Each dot represents a SNP, and the line represents the 95% confidence interval.
Sex-specific genes at identified loci
We conducted an association analysis to estimate the contribution of the chromosome X to OA generic variance. One significant locus rs2305570 was identified to be significantly associated with OA. The different genotypes of this SNP also perform differently on the total area of subchondral bone, and medial bone mineral density (BMD), indicating this locus may be related to the bone area and medial BMD (Figure 6). SNP rs2305570 is in the coding region of KIAA1210 (ENST00000402510.2) and introduces a non-synonymous mutation. SNPs that occur in protein-coding regions, especially non-synonymous SNPs (nsSNPs), can change the amino acid encoding the mutation site and may result in the amino acid variants in proteins (Yates and Sternberg, 2013), leading to structural and functional changes in protein structures. An important paralog of KIAA1210 is SPOCK1 (SPARC/Osteonectin). SPOCK1 is a positive downstream regulator of transforming growth factor-β (TGF-β) (Sun et al., 2020). The TGF-β signaling pathway is critical for maintaining homeostasis in OA-affected joints (van der Kraan, 2018). Based on protein-protein interactions (PPI), TXLNG is highly associated with KIAA1210. TXLNG is found with the ability to regulate bone mass accrual in mouse protein from UniProtKB by inhibiting activating transcription factor 4-mediated transcription.
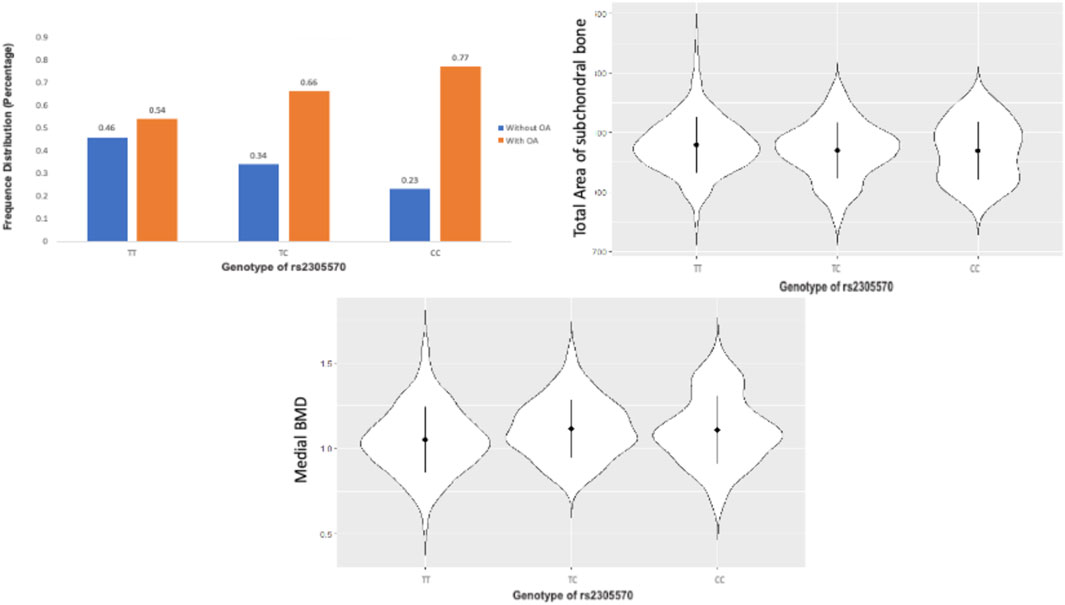
FIGURE 6. The TT, TC, and CC genotypes of rs2305570 had a different performance on the total area of subchondral bone, and medial BMD.
Discussion
Studies have shown that women are more likely to have OA than men (Hame and Alexander, 2013; Tschon et al., 2021; Srikanth et al., 2005; O'Connor, 2006). In general, among people over 60 years old, approximately 10% of men and 13% of women have symptomatic knee OA (Zhang et al., 2010). We identified a novel susceptibility locus at rs2305570 located within the exons of the KIAA1210 gene. KIAA1210 is crucial in regulating bone mass density through an ATF4-dependent pathway. Alteration in KIAA1210 is found to be associated with maintaining homeostasis in joints affected by osteoarthritis.
We also noticed age at menarche was negatively correlated with OA. In other words, the increasing age at menarche reduced the risk of OA. This is also in line with previous clinical trials in which women who started menstruating before age 11 had a 9–15% higher risk of knee replacement surgery as they got older (Bayliss et al., 2017). This may link androgens to knee OA and explain why women are more likely to have OA than men. Therefore, hormone therapy may improve symptoms of knee OA.
We found heart disease and stroke were the two most significant comorbidities genetically related to OA. A previous meta-analysis confirmed a strong (Wang et al., 2016) genetic correlation between OA and heart disease. Obesity is a major contributor to OA and heart disease. Obesity puts extra stress on both the joints and heart, which can cause damage over time. Aging is the major contributor to both OA and stroke. In addition, we found several significant positive and negative genetic correlations between OA and 4 common diseases (emphysema/chronic bronchitis, Crohn’s disease, eczema, and arthrosis of hip), showing that these features may play a role in the genetic etiology of OA. Aside from that, we discovered that knee OA was genetically positively correlated to a long smoking history as it was tied to lifestyle and environment.
We tested whether structural changes and clinical indicators have causal effects on OA. Our results indicate that pain and sometimes stiffness are not causal factors for OA, but abnormal knee alignment is a significant risk factor. By considering the multiple phenotypes together, this method increased statistical power for some SNPs than the univariate tests separately (Cichonska et al., 2016). This joint analysis of the genetic and imaging/clinical features provides an opportunity to uncover the genetic variants of OA development, including genetic factors that are related to OA mechanism. As a result, we have identified seven significant loci significantly associated with OA and its common symptoms (See Table 1).
Although OA is not considered a traditional inflammatory disease, both pathway analysis and GO enrichment terms are shown that immune responses are tightly related to OA. A significant correlation is detected between OA and Crohn’s disease (see Figure 4), which is a common disease of inflammation. These results are generally consistent that OA does involve inflammation. There are several limitations to our study. We excluded rare SNPs with allele frequencies below 1%. This limited our power to detect lower-frequency variants. In addition, this study focused on the genetic correlation between OA and its comorbidities in Caucasians and the results may not be applicable for other sub-populations. Additional samples will be needed for further meta-analysis. Meanwhile, due to genetic confounding, the interpretation of genetic correlation and MR were challenging. For example, in Figure 4, OA was statistically genetically related to multiple inflammation diseases. This could result from a direct causal effect of inflammation → OA could also be caused by an unknown confounder such as inflammation ← G →OA, where G is the set of genetic variants with effects on both inflammation and OA. In summary, we performed GWAS for radiographic knee OA, its comorbidities, and common clinical measurements. We also investigated the genetic correlations and causal effects. Furthermore, we also extended our association analysis of OA to the chromosome X.
Data availability statement
The genotype data used in this article is from this dbGaP Study Accession: phs000955.v1.p1 (Genetic Components of Knee Osteoarthritis (GeCKO) Study: The Osteoarthritis Initiative). Below is the link to this study: https://www.ncbi.nlm.nih.gov/projects/gap/cgi-bin/study.cgi?study_id=phs000955.v1.p1.
Author contributions
YW: data preparation, data analysis, manuscript editing. JC: manuscript editing PK: manuscript review WZ: study design and manuscript review XZ: study design, manuscript editing, and XZ take responsibility for the integrity of this work.
Funding
This work was partially supported by the National Institutes of Health (NIH) under Grant 1R01DE027027-02, Grant 1U01 AR069395-03 (X.Z), Grant 5R01GM123037, Grant U01AR069395, Grant R01DE027027 and Dr. Carl V. Vartian Chair Professorship Funds to Dr. Zhou from the University of Texas Health Science Center at Houston.
Acknowledgments
This is a short text to acknowledge the contributions of specific colleagues, institutions, or agencies that aided the efforts of the authors.
Conflict of interest
The authors declare that the research was conducted in the absence of any commercial or financial relationships that could be construed as a potential conflict of interest.
Publisher’s note
All claims expressed in this article are solely those of the authors and do not necessarily represent those of their affiliated organizations, or those of the publisher, the editors and the reviewers. Any product that may be evaluated in this article, or claim that may be made by its manufacturer, is not guaranteed or endorsed by the publisher.
Supplementary material
The Supplementary Material for this article can be found online at: https://www.frontiersin.org/articles/10.3389/fgene.2022.922658/full#supplementary-material
Supplementary Figure S1 | Study design.
Supplementary Figure S2 | LocusZoom for significant signals for GWAS results (– log10 (p value)) for genotyped SNPs are plotted against genomic position. The circles indicate association results of genotyped SNPs in the region; the color reflects the correlation coefficient (r2) of each genotyped SNP in 1000 Genomes Project of November 2014 Eur. Estimated recombination rates (in cM/Mb) are plotted in blue. The region shown in the plots extends to either 500 kb upstream or downstream of the index SNP.
References
Ardlie, K. G., Deluca, D. S., Segrè, A. V., Sullivan, T. J., Young, T., Gelfand, E. T., et al. (2015). The Genotype-Tissue Expression (GTEx) pilot analysis: Multitissue gene regulation in humans. Science 348, 648–660. doi:10.1126/science.1262110
Barbour, K. E., Helmick, C. G., Boring, M., and Brady, T. J. (2017). Vital signs: Prevalence of doctor-diagnosed arthritis and arthritis-attributable Activity limitation - United States, 2013-2015. MMWR Morb. Mortal. Wkly. Rep. 66, 246–253. doi:10.15585/mmwr.mm6609e1
Barowsky, S., Jung, J.-Y., Nesbit, N., Silberstein, M., Fava, M., Loggia, M. L., et al. (2021). Cross-disorder genomics data analysis elucidates a shared genetic basis between major depression and osteoarthritis pain. Front. Genet. 12, 687687. doi:10.3389/fgene.2021.687687
Bayliss, L. E., Culliford, D., Monk, A. P., Glyn-Jones, S., Prieto-Alhambra, D., Judge, A., et al. (2017). The effect of patient age at intervention on risk of implant revision after total replacement of the hip or knee: A population-based cohort study. Lancet 389, 1424–1430. doi:10.1016/s0140-6736(17)30059-4
Bennett, D. A., and Holmes, M. V. (2017). Mendelian randomisation in cardiovascular research: An introduction for clinicians. Heart 103, 1400–1407. doi:10.1136/heartjnl-2016-310605
Boer, C. G., Hatzikotoulas, K., Southam, L., Stefánsdóttir, L., Zhang, Y., Coutinho de Almeida, R., et al. (2021). Deciphering osteoarthritis genetics across 826,690 individuals from 9 populations. Cell 184, 4784–4818. e17. doi:10.1016/j.cell.2021.07.038
Bowden, J., Davey Smith, G., and Burgess, S. (2015). Mendelian randomization with invalid instruments: Effect estimation and bias detection through egger regression. Int. J. Epidemiol. 44, 512–525. doi:10.1093/ije/dyv080
Browning, B. L., and Browning, S. R. (2016). Genotype imputation with millions of reference samples. Am. J. Hum. Genet. 98, 116–126. doi:10.1016/j.ajhg.2015.11.020
Chan, M. Y., Center, J. R., Eisman, J. A., and Nguyen, T. V. (2014). Bone mineral density and association of osteoarthritis with fracture risk. Osteoarthr. Cartil. 22, 1251–1258. doi:10.1016/j.joca.2014.07.004
Chang, C. C., Chow, C. C., Tellier, L. C., Vattikuti, S., Purcell, S. M., and Lee, J. J. (2015). Second-generation PLINK: Rising to the challenge of larger and richer datasets. GigaSci 4, 7. doi:10.1186/s13742-015-0047-8
Chen, E. Y., Tan, C. M., Kou, Y., Duan, Q., Wang, Z., Meirelles, G. V., et al. (2013). Enrichr: Interactive and collaborative HTML5 gene list enrichment analysis tool. BMC Bioinforma. 14, 128. doi:10.1186/1471-2105-14-128
Chen, D., Shen, J., Zhao, W., Wang, T., Han, L., Hamilton, J. L., et al. (2017). Osteoarthritis: Toward a comprehensive understanding of pathological mechanism. Bone Res. 5, 16044. doi:10.1038/boneres.2016.44
Chu, C. R., Williams, A. A., Coyle, C. H., and Bowers, M. E.M. E. Bowers, and therapy (2012). Early diagnosis to enable early treatment of pre-osteoarthritis. Arthritis Res. Ther. 14, 212. doi:10.1186/ar3845
Cichonska, A., Rousu, J., Marttinen, P., Kangas, A. J., Soininen, P., Lehtimäki, T., et al. (2016). metaCCA: summary statistics-based multivariate meta-analysis of genome-wide association studies using canonical correlation analysis. Bioinformatics 32, 1981–1989. doi:10.1093/bioinformatics/btw052
Courties, A., and Sellam, J. (2016). Osteoarthritis and type 2 diabetes mellitus: What are the links? Diabetes Res. Clin. Pract. 122, 198–206. doi:10.1016/j.diabres.2016.10.021
Donell, S. (2019). Subchondral bone remodelling in osteoarthritis. EFORT Open Rev. 4, 221–229. doi:10.1302/2058-5241.4.180102
Eckstein, F., Wirth, W., and Nevitt, M. C. (2012). Recent advances in osteoarthritis imaging-the Osteoarthritis Initiative. Nat. Rev. Rheumatol. 8, 622–630. doi:10.1038/nrrheum.2012.113
Eckstein, F., Kwoh, C. K., Link, T. M., and i, O. A. I. (2014). Imaging research results from the osteoarthritis initiative (OAI): A review and lessons learned 10 years after start of enrolment. Ann. Rheum. Dis. 73, 1289–1300. doi:10.1136/annrheumdis-2014-205310
Ergül, B., Koçak, E., and Köklü, S. (2012). Arthritis as a presenting symptom of subclinical Crohn's disease. J. Crohn's Colitis 6, 634–635.
Evangelou, E., Valdes, A. M., Kerkhof, H. J. M., Styrkarsdottir, U., Zhu, Y., Meulenbelt, I., et al. O. Translation Research in Europe Applied Technologies for Osteoarthritis (TreatOA) (2011). Meta-analysis of genome-wide association studies confirms a susceptibility locus for knee osteoarthritis on chromosome 7q22. Ann. Rheumatic Dis. 70, 349–355. doi:10.1136/ard.2010.132787
Felson, D. T., Couropmitree, N. N., Chaisson, C. E., Hannan, M. T., Zhang, Y., McAlindon, T. E., et al. (1998). Evidence for a Mendelian gene in a segregation analysis of generalized radiographic osteoarthritis: The Framingham study. Arthritis & Rheumatism 41, 1064–1071. doi:10.1136/ard.2010.13415510.1002/1529-0131(199806)41:6<1064::aid-art13>3.0.co;2-k
Hame, S. L., and Alexander, R. A. (2013). Knee osteoarthritis in women. Curr. Rev. Musculoskelet. Med. 6, 182–187. doi:10.1007/s12178-013-9164-0
Hardcastle, S. A., Dieppe, P., Gregson, C. L., Davey Smith, G., and Tobias, J. H. (2015). Osteoarthritis and bone mineral density: Are strong bones bad for joints? Bonekey Rep. 4, 624. doi:10.1038/bonekey.2014.119
Hellevik, A. I., Nordsletten, L., Johnsen, M. B., Fenstad, A. M., Furnes, O., Storheim, K., et al. (2017). Age of menarche is associated with knee joint replacement due to primary osteoarthritis (The HUNT Study and the Norwegian Arthroplasty Register). Osteoarthr. Cartil. 25, 1654–1662. doi:10.1016/j.joca.2017.06.010
Hochberg, M. C., Lethbridge-Cejku, M., and Tobin, J. D. (2004). Bone mineral density and osteoarthritis: Data from the baltimore longitudinal study of aging. Osteoarthr. Cartil. 12, S45–S48. doi:10.1016/j.joca.2003.09.008
Kellgren, J. H., and Lawrence, J. S. (1957). Radiological assessment of osteo-arthrosis. Ann. Rheumatic Dis. 16, 494–502. doi:10.1136/ard.16.4.494
Kerkhof, H. J. M., Lories, R. J., Meulenbelt, I., Jonsdottir, I., Valdes, A. M., Arp, P., et al. (2010). A genome-wide association study identifies an osteoarthritis susceptibility locus on chromosome 7q22. Arthritis Rheum. 62, 499–510. doi:10.1002/art.27184
Kim, V., and Criner, G. J. (2013). Chronic bronchitis and chronic obstructive pulmonary disease. Am. J. Respir. Crit. Care Med. 187, 228–237. doi:10.1164/rccm.201210-1843ci
König, I. R., Loley, C., Erdmann, J., and Ziegler, A. (2014). How to include chromosome X in your genome-wide association study. Genet. Epidemiol. 38, 97–103.
Laitner, M. H., Erickson, L. C., and Ortman, E. (2021). Understanding the impact of sex and gender in osteoarthritis: Assessing research gaps and unmet needs. J. Womens Health (Larchmt) 30, 634–641. doi:10.1089/jwh.2020.8828
Lee, J. J., McGue, M., Iacono, W. G., and Chow, C. C. (2018). The accuracy of LD Score regression as an estimator of confounding and genetic correlations in genome‐wide association studies. Genet. Epidemiol. 42, 783–795. doi:10.1002/gepi.22161
Li, X., Sjöstedt, C., Sundquist, J., Zöller, B., and Sundquist, K. (2019). Familial association of attention-deficit hyperactivity disorder with autoimmune diseases in the population of Sweden. Psychiatr. Genet. 29, 37–43. doi:10.1097/ypg.0000000000000212
Liu, Z., Cao, H., Shi, Y., and Yang, R. (2019). KIAA1211 plays an oncogenic role in human non-small cell lung cancer. J. Cancer 10, 6747–6753. doi:10.7150/jca.35951
Liu, L., Wang, S., Wen, Y., Li, P., Cheng, S., Ma, M., et al. (2020). Assessing the genetic relationships between osteoarthritis and human plasma proteins: A large scale genetic correlation scan. Ann. Transl. Med. 8, 677. doi:10.21037/atm-19-4643
Louati, K., Vidal, C., Berenbaum, F., and Sellam, J. (2015). Association between diabetes mellitus and osteoarthritis: Systematic literature review and meta-analysis. RMD Open 1, e000077. doi:10.1136/rmdopen-2015-000077
Loughlin, J. (2015). Genetic contribution to osteoarthritis development. Curr. Opin. Rheumatol. 27, 284–288. doi:10.1097/bor.0000000000000171
Marchini, J., Howie, B., Myers, S., McVean, G., and Donnelly, P. (2007). A new multipoint method for genome-wide association studies by imputation of genotypes. Nat. Genet. 39, 906–913. doi:10.1038/ng2088
Marshall, D. A., Liu, X., Barnabe, C., Yee, K., Faris, P. D., Barber, C., et al. (2019). Existing comorbidities in people with osteoarthritis: A retrospective analysis of a population-based cohort in alberta, Canada. BMJ Open 9, e033334. doi:10.1136/bmjopen-2019-033334
Melville, A. M., Pless-Mulloli, T., Afolabi, O. A., and Stenton, S. C. (2010). COPD prevalence and its association with occupational exposures in a general population. Eur. Respir. J. 36, 488–493. doi:10.1183/09031936.00038309
Merceron, C., Ranganathan, K., Wang, E., Tata, Z., Makkapati, S., Khan, M. P., et al. (2019). Hypoxia-inducible factor 2α is a negative regulator of osteoblastogenesis and bone mass accrual. Bone Res. 7, 7. doi:10.1038/s41413-019-0045-z
Messier, S. P., Pater, M., Beavers, D. P., Legault, C., Loeser, R. F., Hunter, D. J., et al. (2014). Influences of alignment and obesity on knee joint loading in osteoarthritic gait. Osteoarthr. Cartil. 22, 912–917. doi:10.1016/j.joca.2014.05.013
Neame, R. L., Muir, K., Doherty, S., and Doherty, M. (2004). Genetic risk of knee osteoarthritis: A sibling study. Ann. Rheumatic Dis. 63, 1022–1027. doi:10.1136/ard.2003.014498
Ni, G., Moser, G., Lee, S. H., Wray, N. R., and Lee, S. H.Schizophrenia Working Group of the Psychiatric Genomics, N.R. Wray (2018). Estimation of genetic correlation via linkage disequilibrium score regression and genomic restricted maximum likelihood. Am. J. Hum. Genet. 102, 1185–1194. doi:10.1016/j.ajhg.2018.03.021
O'Connor, M. I. (2006). Osteoarthritis of the hip and knee: Sex and gender differences. Orthop. Clin. N. Am. 37, 559–568. doi:10.1016/j.ocl.2006.09.004
Palotie, A., Ott, J., Elima, K., Cheah, K. J. L. I., Väisänen, P., Ryhänen, L., et al. (1989). Predisposition to familial osteoarthrosis linked to type II collagen gene. Lancet 333, 924–927. doi:10.1016/s0140-6736(89)92507-5
Peterfy, C. G., Schneider, E., and Nevitt, M. (2008). The osteoarthritis initiative: Report on the design rationale for the magnetic resonance imaging protocol for the knee. Osteoarthr. Cartil. 16, 1433–1441. doi:10.1016/j.joca.2008.06.016
Piva, S. R., Susko, A. M., Khoja, S. S., Josbeno, D. A., Fitzgerald, G. K., and Toledo, F. G. S. (2015). Links between osteoarthritis and diabetes. Clin. Geriatric Med. 31, 67–87. doi:10.1016/j.cger.2014.08.019
Ro, D. H., Lee, J., Lee, J., Park, J.-Y., Han, H.-S., and Lee, M. C. (2019). Effects of knee osteoarthritis on hip and ankle gait mechanics. Adv. Orthop. 2019, 9757369. doi:10.1155/2019/9757369
Saito, T., Fukai, A., Mabuchi, A., Ikeda, T., Yano, F., Ohba, S., et al. (2010). Transcriptional regulation of endochondral ossification by HIF-2α during skeletal growth and osteoarthritis development. Nat. Med. 16, 678–686. doi:10.1038/nm.2146
Sharma, L., Song, J., Felson, D. T., Cahue, S., Shamiyeh, E., and Dunlop, D. D. (2001). The role of knee alignment in disease progression and functional decline in knee osteoarthritis. Jama 286, 188–195. doi:10.1001/jama.286.2.188
Sharma, L., Song, J., Felson, D. T., Cahue, S., Shamiyeh, E., and Dunlop, D. D. (2001). The role of knee alignment in disease progression and functional decline in knee osteoarthritis. Jama 286, 188–195. doi:10.1001/jama.286.2.188
Spector, T. D., Cicuttini, F., Baker, J., Loughlin, J., and Hart, D. (1996). Genetic influences on osteoarthritis in women: A twin study. BMJ 312, 940–943. doi:10.1136/bmj.312.7036.940
Srikanth, V. K., Fryer, J. L., Zhai, G., Winzenberg, T. M., Hosmer, D., and Jones, G. (2005). A meta-analysis of sex differences prevalence, incidence and severity of osteoarthritis. Osteoarthr. Cartil. 13, 769–781. doi:10.1016/j.joca.2005.04.014
Stewart, A., and Black, A. J. (2000). Bone mineral density in osteoarthritis. Curr. Opin. Rheumatol. 12, 464–467. doi:10.1097/00002281-200009000-00021
Sun, L. R., Li, S. Y., Guo, Q. S., Zhou, W., and Zhang, H. M. (2020). SPOCK1 involvement in epithelial-to-mesenchymal transition: A new target in cancer therapy? Cmar Vol. 12, 3561–3569. doi:10.2147/cmar.s249754
Swain, S., Sarmanova, A., Coupland, C., Doherty, M., and Zhang, W. (2020). Comorbidities in osteoarthritis: A systematic review and meta‐analysis of observational studies. Arthritis Care Res. 72, 991–1000. doi:10.1002/acr.24008
Takuwa, H., Uchio, Y., and Ikegawa, S. (2018). Genome-wide association study of knee osteoarthritis: Present and future. Ann. Joint 3 (2018), 64. doi:10.21037/aoj.2018.07.04
Torres, A., Pedersen, B., Cobo, I., Ai, R., Coras, R., Murillo‐Saich, J., et al. (2022). Epigenetic regulation of nutrient transporters in rheumatoid arthritis fibroblast‐like synoviocytes. Arthritis & Rheumatology 74, 1159–1171. doi:10.1002/art.42077
Tschon, M., Contartese, D., Pagani, S., Borsari, V., and Fini, M. (2021). Gender and sex are key determinants in osteoarthritis not only confounding variables. A systematic review of clinical data. J. Clin. Med. 10. 3178. doi:10.3390/jcm10143178
Tseng, C.-C., Chang, S.-J., Tsai, W.-C., Ou, T.-T., Wu, C.-C., Sung, W.-Y., et al. (2016). Increased incidence of rheumatoid arthritis in multiple sclerosis. Medicine 95, e3999. doi:10.1097/md.0000000000003999
Valdes, A. M., Evangelou, E., Kerkhof, H. J., Tamm, A., Doherty, S. A., Kisand, K., et al. (2011). The GDF5 rs143383 polymorphism is associated with osteoarthritis of the knee with genome-wide statistical significance. Ann. Rheumatic Dis. 70, 873–875. doi:10.1136/ard.2010.134155
van der Kraan, P. M. (2018). Differential role of transforming growth factor-beta in an osteoarthritic or a healthy joint. J. Bone Metab. 25, 65–72. doi:10.11005/jbm.2018.25.2.65
Walker, V. M., Davies, N. M., Hemani, G., Zheng, J., Haycock, P. C., Gaunt, T. R., et al. (2019). Using the MR-Base platform to investigate risk factors and drug targets for thousands of phenotypes. Wellcome Open Res. 4, 113. doi:10.12688/wellcomeopenres.15334.2
Wang, K., Li, M., and Hakonarson, H. (2010). Annovar: Functional annotation of genetic variants from high-throughput sequencing data. Nucleic Acids Res. 38, e164. doi:10.1093/nar/gkq603
Wang, H., Bai, J., He, B., Hu, X., and Liu, D. (2016). Osteoarthritis and the risk of cardiovascular disease: A meta-analysis of observational studies. Sci. Rep. 6, 39672. doi:10.1038/srep39672
Watanabe, K., Taskesen, E., van Bochoven, A., and Posthuma, D. (2017). Functional mapping and annotation of genetic associations with FUMA. Nat. Commun. 8, 1826. doi:10.1038/s41467-017-01261-5
Wshah, A., Guilcher, S. J., Goldstein, R., and Brooks, D. (2018). Prevalence of osteoarthritis in individuals with COPD: A systematic review. Copd Vol. 13, 1207–1216. doi:10.2147/copd.s158614
Xiao, D., Luo, Q., He, C., Yang, L., He, H., and Wu, Y. (2010). Effect of osteophytes on bone mineral density of female lumbar spine. Sheng Wu Yi Xue Gong Cheng Xue Za Zhi 27, 586–589.
Yang, J., Lee, S. H., Goddard, M. E., and Visscher, P. M. (2011). GCTA: A tool for genome-wide complex trait analysis. Am. J. Hum. Genet. 88, 76–82. doi:10.1016/j.ajhg.2010.11.011
Yang, C. Y., Chanalaris, A., and Troeberg, L. (2017). ADAMTS and ADAM metalloproteinases in osteoarthritis - looking beyond the 'usual suspects'. Osteoarthr. Cartil. 25, 1000–1009. doi:10.1016/j.joca.2017.02.791
Yates, C. M., and Sternberg, M. J. E. (2013). The effects of non-synonymous single nucleotide polymorphisms (nsSNPs) on protein-protein interactions. J. Mol. Biol. 425, 3949–3963. doi:10.1016/j.jmb.2013.07.012
Yau, M. S., Yerges-Armstrong, L. M., Liu, Y., Lewis, C. E., Duggan, D. J., Renner, J. B., et al. (2017). Genome-wide association study of radiographic knee osteoarthritis in north American Caucasians. Arthritis & Rheumatology 69, 343–351. doi:10.1002/art.39932
Yelin, E., Weinstein, S., and King, T. (2016). The burden of musculoskeletal diseases in the United States. Seminars arthritis rheumatism, 46, 259–260. doi:10.1016/j.semarthrit.2016.07.013
Zengini, E., Hatzikotoulas, K., Tachmazidou, I., Steinberg, J., Hartwig, F. P., Southam, L., et al. (2018). Genome-wide analyses using UK Biobank data provide insights into the genetic architecture of osteoarthritis. Nat. Genet. 50, 549–558. doi:10.1038/s41588-018-0079-y
Zhang, J., Zhou, X., Wang, H., Suffredini, A., Zhang, L., Huang, Y., et al. (2010). Bayesian peptide peak detection for high resolution TOF mass spectrometry. IEEE Trans. Signal Process. 58, 5883–5894. doi:10.1109/tsp.2010.2065226
Zhang, G., Smith, B. P., Plate, J. F., Casanova, R., Hsu, F. C., Li, J., et al. (2016). A systematic approach to predicting the risk of unicompartmental knee arthroplasty revision. Osteoarthr. Cartil. 24, 991–999. doi:10.1016/j.joca.2016.01.004
Zhang, G., You, L., Lan, L., Zeng, N., Chen, W., Poehling, G. G., et al. (2019). Risk prediction model for knee arthroplasty. IEEE Access 7, 34645–34654. doi:10.1109/access.2019.2900619
Zhang, F., Rao, S., and Baranova, A. (2022). Shared genetic liability between major depressive disorder and osteoarthritis. Bone & Jt. Res. 11, 12–22. doi:10.1302/2046-3758.111.bjr-2021-0277.r1
Zheng, J., Erzurumluoglu, A. M., Elsworth, B. L., Kemp, J. P., Howe, L., Haycock, P. C., et al. (2017). LD Hub: A centralized database and web interface to perform LD score regression that maximizes the potential of summary level GWAS data for SNP heritability and genetic correlation analysis. Bioinformatics 33, 272–279. doi:10.1093/bioinformatics/btw613
Keywords: knee osteoarthritis, genome-wide association study, genetic correlation, comorbidities, mendelian randomization
Citation: Wang Y, Chyr J, Kim P, Zhao W and Zhou X (2022) Phenotype-Genotype analysis of caucasian patients with high risk of osteoarthritis. Front. Genet. 13:922658. doi: 10.3389/fgene.2022.922658
Received: 18 April 2022; Accepted: 26 July 2022;
Published: 29 August 2022.
Edited by:
Minjie Chu, Nantong University, ChinaReviewed by:
Alberto López-Reyes, National Institute of Rehabilitation Luis Guillermo Ibarra Ibarra, MexicoAchim Kless, Eli Lilly, United Kingdom
Copyright © 2022 Wang, Chyr, Kim, Zhao and Zhou. This is an open-access article distributed under the terms of the Creative Commons Attribution License (CC BY). The use, distribution or reproduction in other forums is permitted, provided the original author(s) and the copyright owner(s) are credited and that the original publication in this journal is cited, in accordance with accepted academic practice. No use, distribution or reproduction is permitted which does not comply with these terms.
*Correspondence: Xiaobo Zhou, Xiaobo.Zhou@uth.tmc.edu