 Bao-Xing Huang1†
 Zi-Chang Jia2,3†Xue Yang3Chao-Lin Cheng4Xiao-Rong Liu1
 Jianhua Zhang4Mo-Xian Chen2
 Jing-Fang Yang5*Yun-Sheng Chen1*
- 1Clinical Laboratory, Shenzhen Children’s Hospital, Shenzhen, China
- 2Co-Innovation Center for Sustainable Forestry in Southern China and Key Laboratory of National Forestry and Grassland Administration on Subtropical Forest Biodiversity Conservation, College of Biology and the Environment, Nanjing Forestry University, Nanjing, China
- 3State Key Laboratory of Crop Biology, College of Life Science, Shandong Agricultural University, Taian, China
- 4Department of Biology, Hong Kong Baptist University, State Key Laboratory of Agrobiotechnology, The Chinese University of Hong Kong, Shatin, Hong Kong SAR, China
- 5State Key Laboratory for Biology of Plant Diseases and Insect Pests, Institute of Plant Protection, Chinese Academy of Agricultural Sciences, Beijing, China
The gene SYF2—an RNA splicing factor—can interact with Cyclin D-type binding protein 1 (GICP) in many biological processes, including splicing regulation, cell cycle regulation, and DNA damage repair. In our previous study we performed genome-wide identification and functional analysis of SYF2 in plant species. The phylogenetic relationships and expression profiles of SYF2 have not been systematically studied in animals, however. To this end, the gene structure, genes, and protein conserved motifs of 102 SYF2 homologous genes from 91 different animal species were systematically analyzed, along with conserved splicing sites in 45 representative vertebrate species. A differential comparative analysis of expression patterns in humans and mice was made. Molecular bioinformatics analysis of SYF2 showed the gene was conserved and functional in different animal species. In addition, expression pattern analysis found that SYF2 was highly expressed in hematopoietic stem cells, T cells, and lymphoid progenitor cells; in ovary, lung, and spleen; and in other cells and organs. This suggests that changes in SYF2 expression may be associated with disease development in these cells, tissues, or organs. In conclusion, our study analyzes the SYF2 disease resistance genes of different animal species through bioinformatics, reveals the relationship between the SYF2 genotype and the occurrence of certain diseases, and provides a theoretical basis for follow-up study of the relationship between the SYF2 gene and animal diseases.
Introduction
In eukaryotic cells, gene expression can be roughly subdivided into three steps: transcription, splicing, and translation, and is performed by RNA polymerases, spliceosomes, and ribosomes. In 1977, scientists first discovered that adenovirus mRNA and its corresponding DNA transcription template did not form a continuous hybrid double strand, but was instead an extended circular single strand DNA at different locations. This suggests that genetic information is transferred from DNA to mRNA, not only by transcription, but also by RNA splicing (Berget et al., 1977). The pre-mRNA introns and exons produced during transcription are arranged alternately. Only after intron excision and exon splicing is complete can mature mRNA be generated and enter the translation process with coherent information (Chen et al., 2012). This is known as the splicing process. RNA splicing is an important process for regulating cell differentiation, proliferation, and survival, and is equally important in gene regulation. Splicing factors participate in the splicing process of RNA precursors, and their presence causes the final protein products to show different functional and structural characteristics, thereby increasing genetic diversity. In recent years, sequencing technology and transcriptome analyses have revealed that alternative splicing is ubiquitous in various species (Chen et al., 2021; Song et al., 2021), and can lead to profound changes in gene expression patterns during development (Chen M.-X. et al., 2020). The molecular mechanism of RNA splicing consists of a two-step transesterification reaction (Toro et al., 2007; Wan et al., 2016). This deceptively simple chemical reaction is difficult to perform in cells on its own, and it requires a spliceosome to complete it. During RNA splicing, a large and highly dynamic molecular machine in the cell nucleus is pieced together from many different components. It is a ribosomal protein complex that recognizes the splicing site of the RNA precursor, and catalyzes the splicing reaction. Its size is 60 S, and it is mainly dynamically composed of a variety of non-SNRNPs, assembled small nuclear ribonucleoproteins, and RNA (Madhani & Guthrie, 1994; Will & Lührmann, 1997). It is formed at various stages of splicing with the addition of snRNA. In addition, spliceosomes are classified into major and minor spliceosomes due to differences in the proportion of intron excisions they monitor. Approximately 99.5% of intron excision reactions, which are the primary spliceosomes during splicing, are monitored. The major spliceosomes can monitor approximately 99.5% of the intron resection response, while secondary spliceosomes are less efficient in monitoring intron excision reactions, accounting for only 0.5% (Lorkovic et al., 2005; Chen & Moore, 2015). When splicing occurs, there are two steps to the assembly of the spliceosome. First, the identification of the 3′ and 5′ splice sites is completed in a base-complementary manner, and the U2 snRNP is guided to bind to the branch site to form a splice precursor. The resulting product then combines with U4, U5, and U6 snRNP trimers to form a spliceosome (Will & Luhrmann, 2011). The average human body contains approximately 100,000 spliceosomes per cell. Spliceosomes can also be classified into two types, type I and type II. The first spliceosome contains five major snRNP subcomplexes: U1, U2, and U4 to U6. Five snRNPs, U5, U11, U12, U4atac, and U6atac, constitute the type II spliceosome (Chen & Moore, 2015).
SYF2, also called p29, or CBPIN, or NTC31, encodes a nuclear protein. SYF2 interacts with Cyclin D-type binding-protein 1 (GICP), is involved in cell cycle regulation and pre-mRNA splicing, and plays an important role in cancer progression.
As a cell cycle regulator, SYF2 induces the transition of the G1-to-S phase to promote cell proliferation by interacting with cyclin-D-type binding protein 1 (Witzel et al., 2010). Cyclin D1 induces the cell cycle transition of G1-to-S phase by interacting with cyclin-dependent kinase 4/6 (CDK4/6), thereby promoting cell proliferation (Tao et al., 2020).
SYF2 participates in the progress of diverse tumor entities, such as breast cancer (Shi et al., 2017), gastric cancer (GC) (Liu et al., 2019; Tao et al., 2020), human epithelial ovarian cancer (EOC) (Yan et al., 2015), hepatocellular carcinoma (Zhang et al., 2015), esophageal squamous cell carcinoma (ESCC) (Zhu et al., 2014), and glioma (Guo et al., 2014), in a cell cycle-dependent pathway. There is a positive correlation between SYF2 expression and proliferation of cancer, with SYF2 a potential novel tumor marker and an oncogene. SYF2 might potentially be the molecular target for the treatment of cancer, i.e., knocking down SYF2 would lead to cell cycle G1/S phase arrest, and hence to inhibition of cancer cell proliferation.
SYF2 may promote the replication checkpoint and S-phase arrest (slowdown) through both splicing-dependent and independent mechanisms. SYF2 regulates DNA replication and cell cycle progression through AS regulation of ECT2-Ex5 (Tanaka et al., 2020). ECT2 is a protooncogene with an important role in the cytokinesis phase of the cell cycle. The ECT2-Ex5+ isoform promotes S-phase accumulation. The p29 gene is involved in intervertebral disc (IVD) degeneration (Cherif et al., 2022). SYF2 interacts with PRP17, which is involved in the splicing and cell cycle (Ben-Yehuda et al., 2000). SYF2 was hypomethylated in all superovulated oocytes (Huo et al., 2020).
SYF2 is involved in many biological processes, such as splicing regulation, cell cycle regulation, and DNA damage repair. Our previous study performed genome-wide identification and functional analysis of SYF2 in plant species (Tian et al., 2019). However, the phylogenetic relationships and expression profiles of SYF2 in animals have not been systematically studied. In this study, we used a variety of bioinformatics methods to systematically analyze the gene structures, gene and protein motifs, and splicing conservation of the animal SYF2 gene family. The differential expression patterns of SYF2 in different diseases, different organs and tissues, different cells, different developmental stages, and different sampling time points in humans and mice are also discussed. This suggests that SYF2 may be involved in the development of disease, and may be a molecular target for the treatment of cancer. This study aims to reveal the relationship between SYF2 genotypes and biological disease processes from the perspective of bioinformatics, and to provide some basic theories for subsequent research into SYF2 as a novel tumor marker.
Results
Phylogenetic tree construction of animal SYF2 genes
In order to gain a deeper understanding of the function of SYF2, the possible SYF2 genes in different animal species were determined according to the amino acid sequence of human SYF2 (Homo sapiens, ENST00000236273_8). Ultimately, we found by alignment a total of 102 homologous sequences from 91 animal species, including 23 primates, 6 rats and mice, 18 other rodents, 12 carnivores, 11 fish, 8 ungulates, 7 birds and reptiles, 6 other placentals, 4 marsupials and monotremes, 2 lagomorphs, 1 other vertebrate and 4 other species (outgroup) (Supplementary Table S1). For construction of the phylogenetic tree of the SYF2 gene, using the 102 amino acid sequence similarity of 91 animal species, see Figure 1, left. The phylogenetic tree has five main branches: primates, vertebrates, mammals, rodents and lagomorphs, and other species. These five main branches are then subdivided into twelve smaller branches. Among them, rodents and lagomorphs include rats, mice, lagomorphs, and other rodents. Other mammals include other placentals, marsupials, monotremes, carnivores, and ungulates. Other vertebrates include birds, reptiles, and fish.
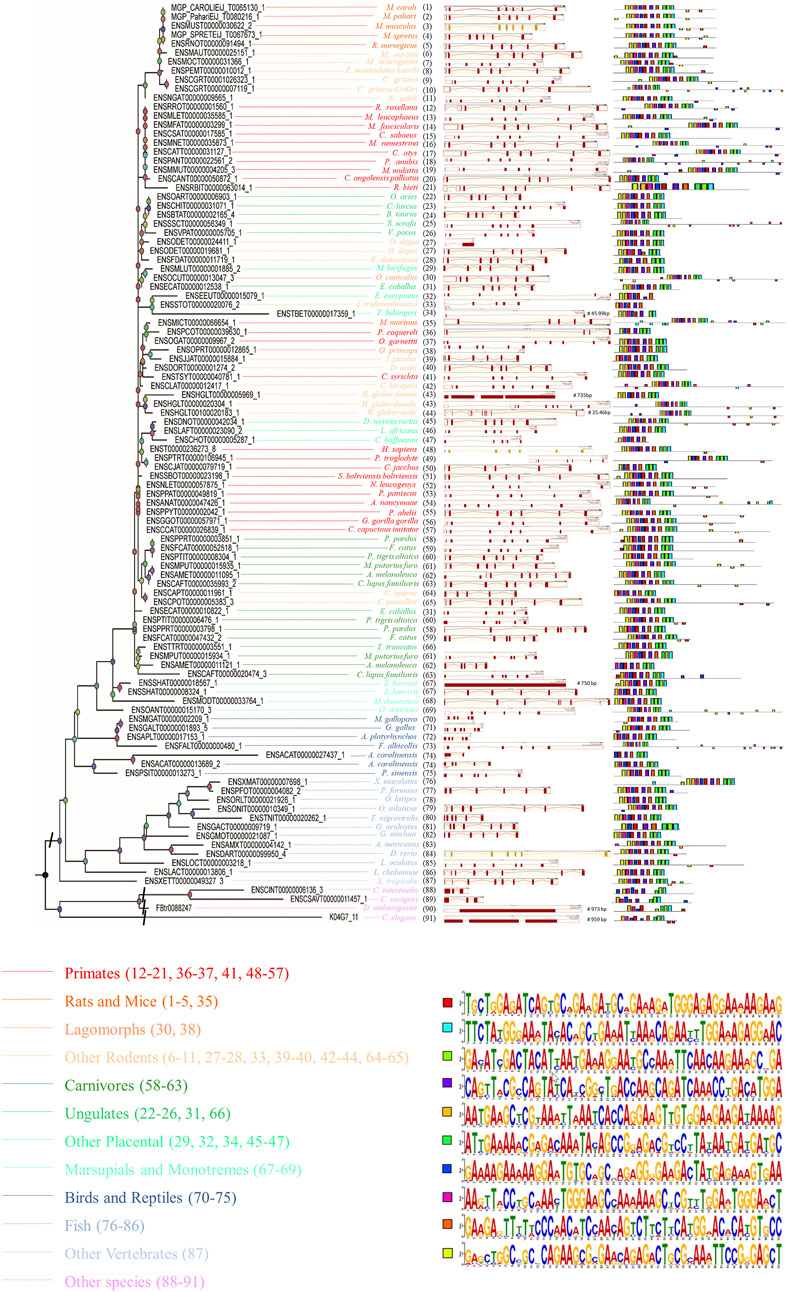
FIGURE 1. The phylogenetic relationship analysis of animal SYF2 genes. The phylogenetic relationship is listed in the left panel. The gene structure is listed in the middle panel, and conserved motifs of cDNA sequences are listed in the right panel. The sequence of each conserved motif is listed below the phylogenetic tree.
Conserved motif analysis of SYF2
To further study the conserved nature of SYF2s in animals, the gene structure, cDNA, and conserved peptide motif of SYF2s were analyzed. The genetic structure of SYF2 of each animal species is shown in Figure 1 and Supplementary Table S2, which shows the number of introns and exons per sequence, and the presence of untranslated regions other than CDS. In general, the gene structure of this family is diverse, with each gene containing from 1 to 9 exons. We found different exon-intron organization in different subgroups within the same general class (Figure 1). For instance, among all SYF2 members, there are two degus, whose sequences exist in a subgroup, where ENSODET00000019681_1 has seven exons and ENSODET00000024411_1 has only one long exon (Figure 1). Similarly, two harrisii exist in the same subgroup, and a similar situation exists: ENSSHAT00000008324_1 has 6 exons, while ENSSHAT00000018567_1 has only one long exon (Figure 1). Overall, the exon-intron distribution pattern of the SYF2 gene varied across all animal species involved in this study and also within the same genus. It is indicated that the changes of gene structure are of great significance to the development and evolution of their gene families. Furthermore, the conserved motifs of each SYF2 were compared and analyzed using MEME software, and it was found that 76 of the 102 sequences shared the same 10 motifs and had similar organizational structures. The remaining 26 sequences had some changes in the number or structure of conserved motifs. In addition, some sequences had less conserved motifs, thus indicating their functional diversity. The sequence of C. angolensis palliatus (ENSCANT00000050872_1), O. degus (ENSODET00000019681_1), M. murinus (ENSMICT00000066654_1), J. jaculus (ENSJJAT00000015884_1), H. glaber-female (ENSHGLT00000005969_1), C. aperea (ENSCAPT00000011961_1), C. lupus familiaris (ENSCAFT00000020474_3), S. harrisii (ENSSHAT00000008324_1), M. gallopavo (ENSMGAT00000002209_1), A. platyrhynchos (ENSAPLT00000017153_1), A. carolinensis (ENSACAT00000013689_2), C. intestinalis (ENSCINT00000006136_3), and C. elegans (K04G7_11) had nine motifs; F. damarensis (ENSFDAT00000011719_1), T. belangeri (ENSTBET00000017359_1), P. troglodyte (ENSPTRT00000106945_1), C. jacchus (ENSCJAT00000079719_1), A. melanoleuca (ENSAMET00000011121_1), G. aculeatus (ENSGACT00000009719_1), C. savignyi (ENSCSAVT00000011457_1), and D. melanogaster (FBtr0088247) had eight motifs; E. europaeus (ENSEEUT00000015079_1), P. coquereli (ENSPCOT00000039630_1), and A. carolinensis (ENSACAT00000027437_1) had seven motifs; I. tridecemlineatus (ENSSTOT00000020076_2) and C. hoffmanni (ENSCHOT00000005287_1) had six motifs, suggesting that the SYF2 gene sequence is diverse in different species. Furthermore, there was no correlation between conserved motifs and gene structure after comparative analysis. For instance, S. harrisii (ENSSHAT00000018567_1) had only one long exon, but contained all 10 motifs, while C. hoffmanni (ENSCHOT00000005287_1) had six exons and five introns. These sequences had only six motifs.
In addition, peptide level analysis was performed. A total of 102 sequences in different species were annotated with the SYF2 domain (Figure 2), and MEME analysis was used to predict unknown protein motifs. Among the 102 animals belonging to different species, the animals with 8 conserved motifs accounted for the majority. Motifs shown in bright red (NERNAKFNKKAERFYGKYTAEIKQNLERGTA), pale green (DYAAAQLRQYHRLTKQIKPDMETYERL) blue (HGEEFFPTSNSLLHGTHVPSTEEIDRMV), green (EKRDKYSRRRPYNDDADIDYI), purple (KKECAARGEDYEKVKLLEISAEDAERWERKKKRKNPDLGFS), ginger (RNEARKLNHQEVVEEDKRLKLPANWEAKKARLEWELQEEEK), and dark blue (AEELAAQKREQRLRKFRELHL) occur in nearly every one of them, accounting for 70% of all motifs analyzed in this paper. Furthermore, the rose red motifs (MAAXAASEVPVDSAEEGSLTA) were concentrated in primate sequences, and only sparsely distributed in sequences of other animal species. The yellow motif (MAAXTEVVVPADGAE) only existed in rat, mouse, fish, and other rodent sequences, but was not detected in other animal sequences. In summary, through the analysis of conserved motifs at the RNA/cDNA and protein levels, it can be found that there is little difference in codon usage among SYF2 orthologs, and the number and position of motifs are obviously similar. This indicates that SYF2 is highly conserved among different proteins and cDNAs in different animal species.
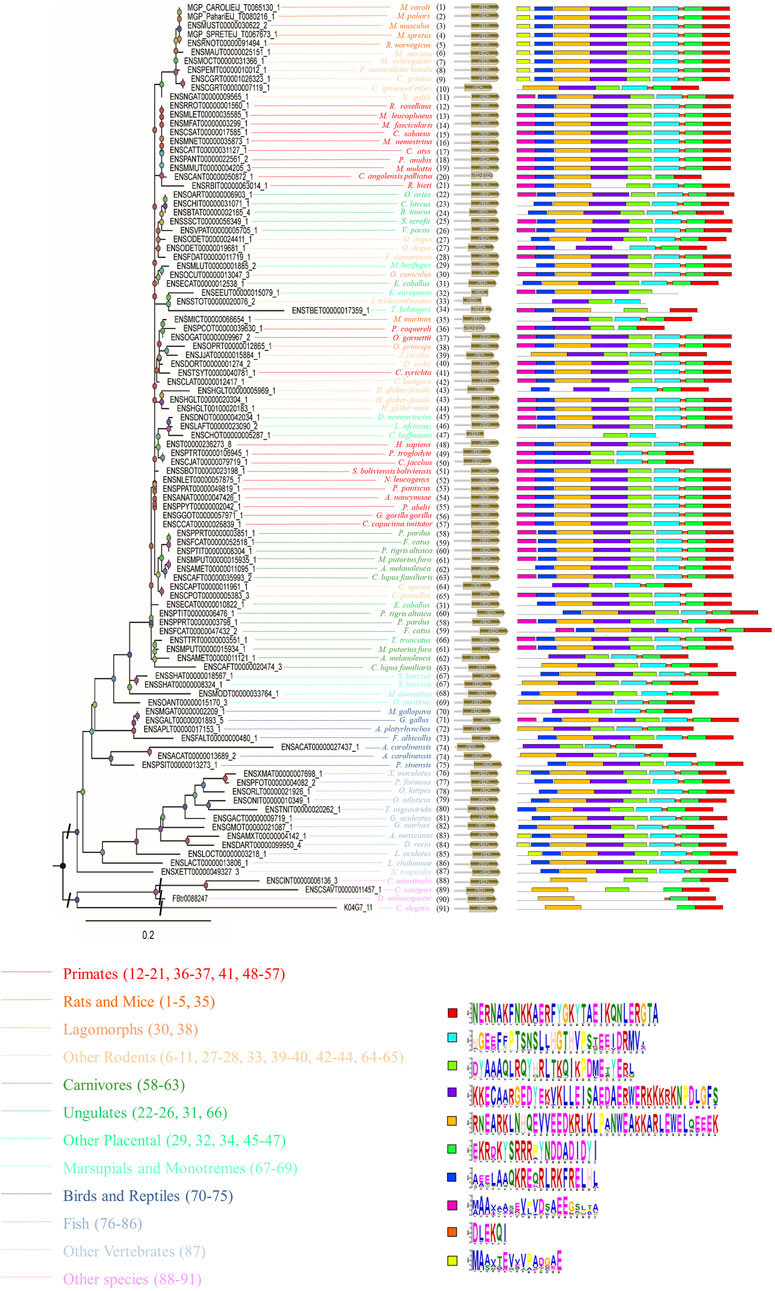
FIGURE 2. The phylogenetic relationship analysis of animal SYF2 proteins. The phylogenetic relationship is listed in the left panel, the peptide structure is listed in the middle panel, and conserved motifs of peptide sequences are listed in the right panel. The sequence of each conserved motif is listed below the phylogenetic tree.
Construction of the SYF2 protein interaction network
We further explored how SYF2 plays a role in biological regulatory processes. Next, we employed the tool STRING to construct a protein interaction network of SYF2 in different species (Figure 3). We used protein intercrops to interact with SYF2 in organisms, including two animal species (Homo sapiens, Mus musculus), yeast, and two plant species (Arabidopsis and Oryza sativa).
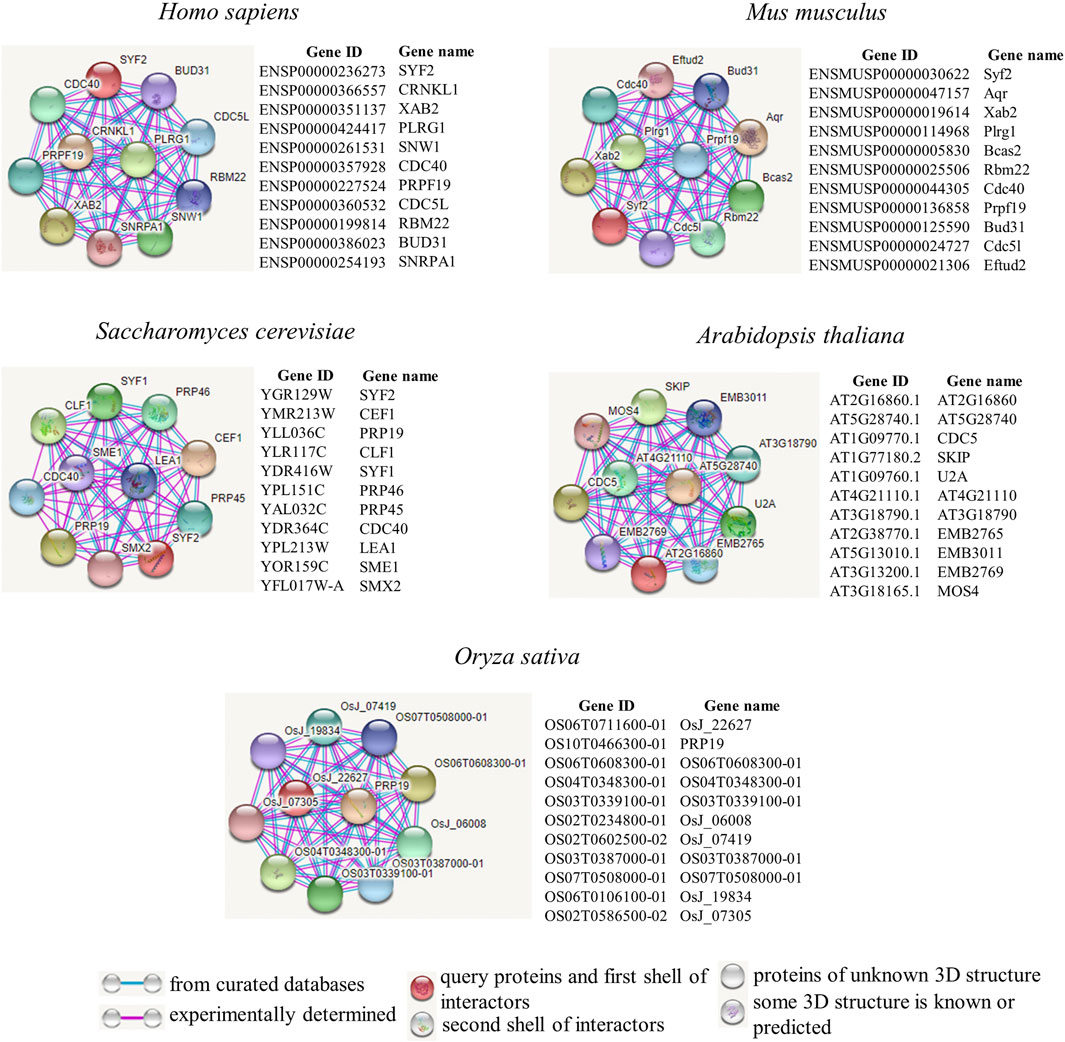
FIGURE 3. Protein interaction network diagrams of representative animal and plant species. Known interactions, either determined by experiments (pink line), or from curated databases (blue line), are presented in protein–protein interaction networks. SYF2s of Homo sapiens, Mus musculus, Saccharomyces cerevisiae, Arabidopsis thaliana, and Oryza sativa were used as query proteins for analysis by the STRING database. Highly scored interactors are presented in the form of a network diagram. Empty notes are proteins with unknown 3D structures, while filled notes are proteins with known or predicted 3D structures in the current database.
Human XAB2 protein is a protein interactor of SYF2. It consists of 15 repeated tetrapeptides, and was identified by interaction with xeroderma pigmentosa histone A (XPA) (Nakatsu et al., 2000; Kuraoka et al., 2008). It is a novel component involved in transcriptional coupling repair and transcription, and plays a role in mitotic cell cycle regulation (Hou et al., 2016). Furthermore, there is also a clear interaction between CDC40 and SYF2. The CDC40 (PRP17) gene in S. cerevisiae, whose mutation results in sensitivity to temperature changes, was originally identified in CDC40-1 (Orna & Martin, 2002). It plays a variety of roles in cell cycle progression. Its mutation causes the cell cycle to stall (Kaplan & Kupiec, 2007). In addition, Cdc40p, Slu7p, Prp22p, Prp18p, Prp16p, and Prp8p acted as pre-mRNA splicing factors during the second splicing reaction stage (Vijayraghavan et al., 1989; Schwer & Gross, 1998).
In the mouse protein interaction map, we also found proteins with high interaction with SYF2. Prpf19 is a functionally diverse protein (Yin et al., 2012), is highly conserved, and participates in splicing as a splicing factor (He et al., 2021).
Analysis of transcript isoforms and conserved splice sites
To further understand the splicing patterns and conserved splicing sites of the SYF2 gene, we extracted some available animal SYF2 gene transcription subtypes from the Ensembl database and then selected 45 representative animals for alternative splicing analysis (Figure 4). A total of 106 splice isomers were obtained from 45 SYF2 genes, with an average of 2–3 transcripts per gene. Among them, the human and Oryctolagus cuniculus SYF2 genes annotated 4 subtypes, the largest number of annotated subtypes in these animals. When comparing the conserved motifs of the transcription subtype with the genome structure (Figure 4, right), it was found that the original transcripts of most genes contained the most motifs, while the remaining replacement transcripts usually contained fewer motifs. Tthe variable splicing event was then analyzed. First, in Mandrillus leucophaeus, Macaca fascicularis, Macaca nemestrina, Cercocebus atys, Colobus angolensis palliatus, Carlito syrichta, Callithrix jacchus, Saimiri boliviensis boliviensis, Pan paniscus, Aotus nancymaae, Gorilla gorilla, Cebus capucinus imitator, Panthera pardus, Felis catus, Panthera Tigris altaica, etc., there was a large amount of exon skipping. Second, an in-depth study found that the number of alternative splicing events of the first exon and the last exon (AFE and ALE), accounted for the bulk of the total alternative splicing events in SYF2, which indirectly led to the generation of many truncated transcript subtypes, such as in Mus caroli, Mus pahari, Rhinopithecus roxellana, Macaca fascicularis, Cercocebus atys, Rhinopithecus bieti, Microcebus murinus, Gorilla gorilla gorilla, Oryctolagus cuniculus, and so on. Moreover, alternative transcription initiation and alternative polyadenylation of several transcripts have been found, such as in Capra hircus, Microcebus Murinus, and Danio rerio.
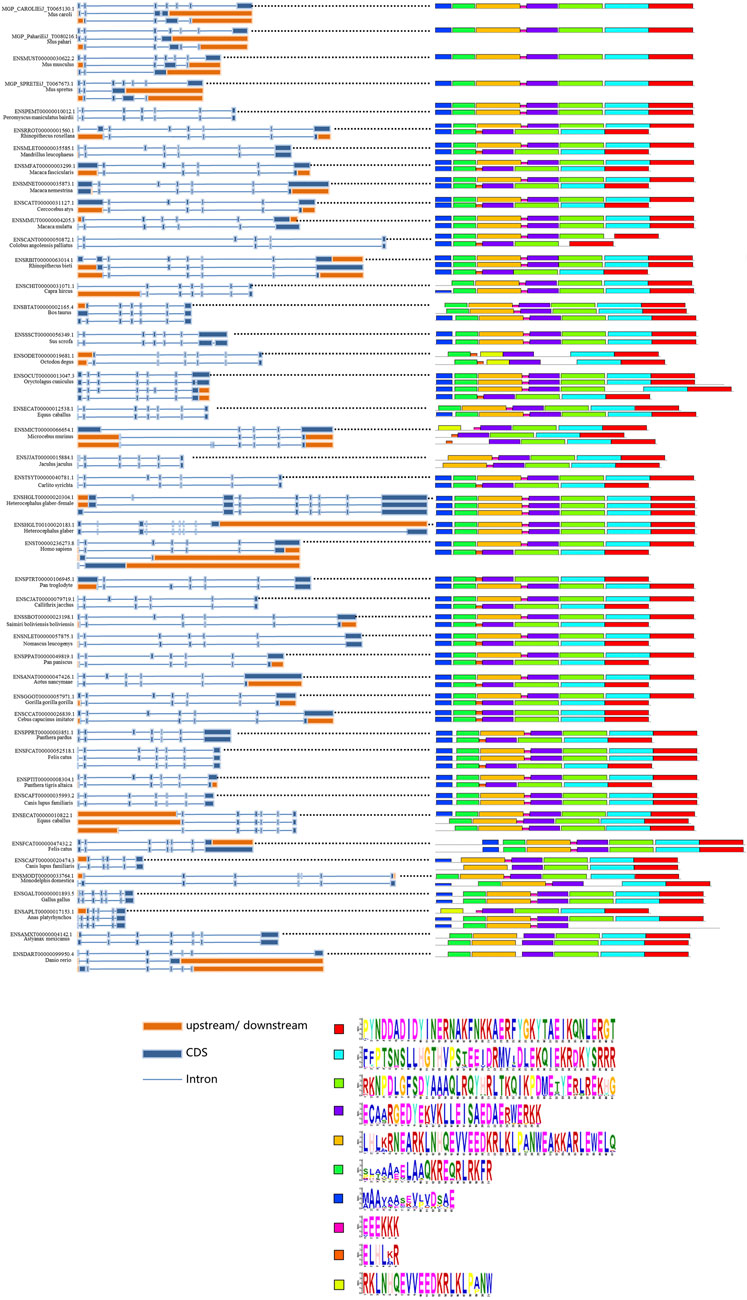
FIGURE 4. Summary of splice isoforms of the animal SYF2 gene. Transcript isoforms from 45 animal SYF2 genes are summarized (left and middle panel). Conserved protein motifs and sequences of potential protein products from splicing isoforms are illustrated (right panel and bottom of the figure, respectively), with additional annotation to define exon–exon boundaries (blue lines between boxes).
Analysis of the SYF2 expression profile in animals
To further investigate the association between the animal SYF2 gene and certain cell, tissue, and organ diseases, we analyzed the expression patterns of the SYF2 gene in different animal species. Mice have genome sequences that are highly similar to humans, with gene homology as high as 78.5%. In addition, mice are close to humans in terms of biological evolution, their tissue and organ structure and cell functions are similar to those of humans, while their placenta formation and early embryonic development are also similar to humans. Therefore, we performed a comparative analysis of SYF2 gene expression patterns in humans and mice. Through the BAR HeatMapper Plus tool, we reconstructed the expression profile to include three aspects: human disease (Figure 5), human and mouse tissues and organs (Figures 6 and 7), and human and mouse cell types and development stages (Supplementary Figures S1–S3).
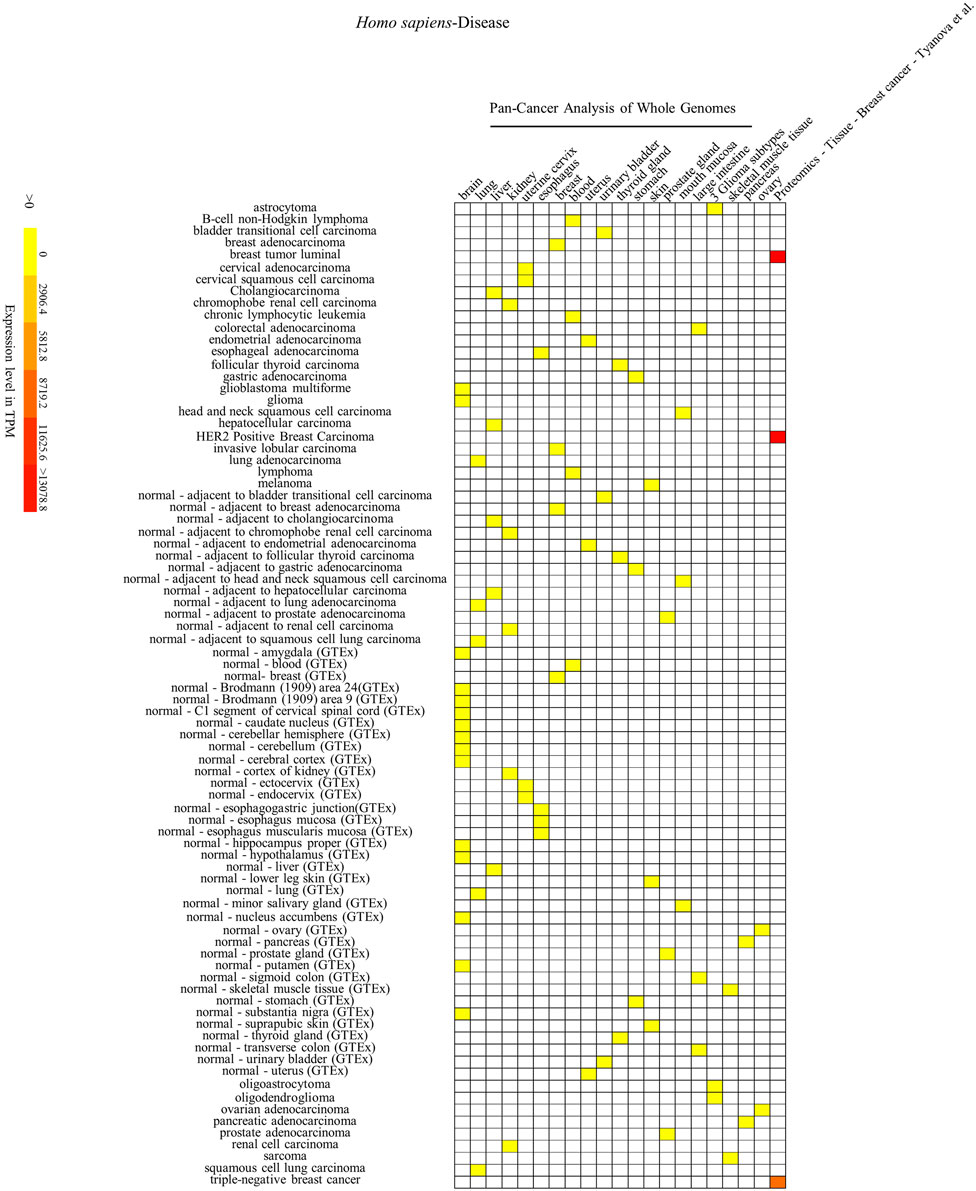
FIGURE 5. Heatmap of Homo sapiens’ SYF2 gene expression in different diseases. Disease database is from the International Cancer Genome project: Pan-Cancer Analysis of Whole Genomes (PCAWG). GTEx means Genotype-Tissue Expression (GTEx) Project. No. 1–21 represent 21 data source projects, which are Pan-Cancer Analysis of Whole Genomes – (brain, lung, liver, kidney, uterine cervix, esophagus, breast, blood, uterus, urinary bladder, thyroid gland, stomach, skin, prostate gland, mouth mucosa, large intestine) (1–16), 3 Glioma subtypes (17), Pan-Cancer Analysis of Whole Genomes – (skeletal muscle tissue, pancreas, ovary) (18–20), Proteomics – Tissue – Breast Cancer – Tyanova (21), respectively. Baseline expression levels are in TPM (transcripts per million). The raw data were reorganized and presented as heatmaps using online BAR HeatMapper Plus software (http://bar.utoronto.ca/ntools/cgi-bin/ntools_heatmapper_plus.cgi).
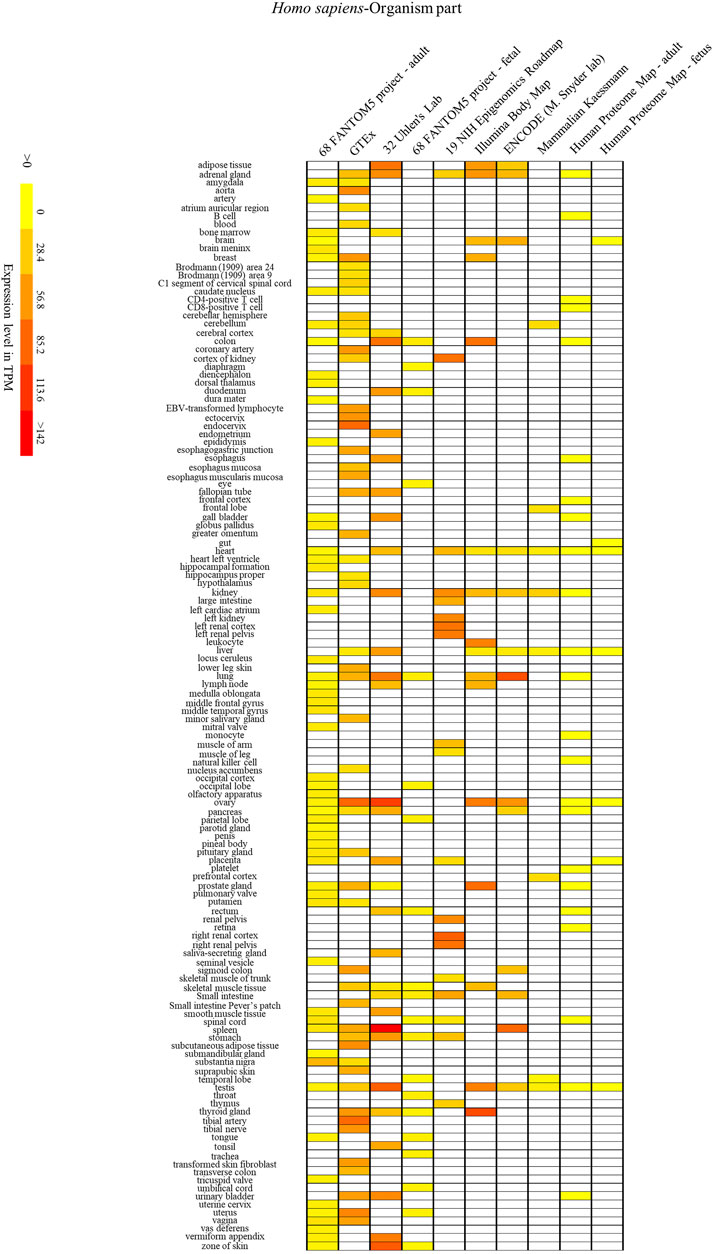
FIGURE 6. The human SYF2 gene is specifically expressed in different organs. Nos. 1–10 represent 10 data source projects, which are 68 FANTOM5 project – adult (1), GTEx (2), 32 Uhlen’s Lab (3), 68 FANTOM5 project – fetal (4), 19 NIH Epigenomics Roadmap (5), Illumina Body Map (6), ENCODE (M. Snyder lab) (7), Mammalian Kaessmann (8), Human Proteome Map – adult (9), Human Proteome Map – fetus (10), respectively. Baseline expression levels are in TPM (transcripts per million). The raw data were reorganized and presented as heatmaps using online BAR HeatMapper Plus software (http://bar.utoronto.ca/ntools/cgi-bin/ntools_heatmapper_plus.cgi).
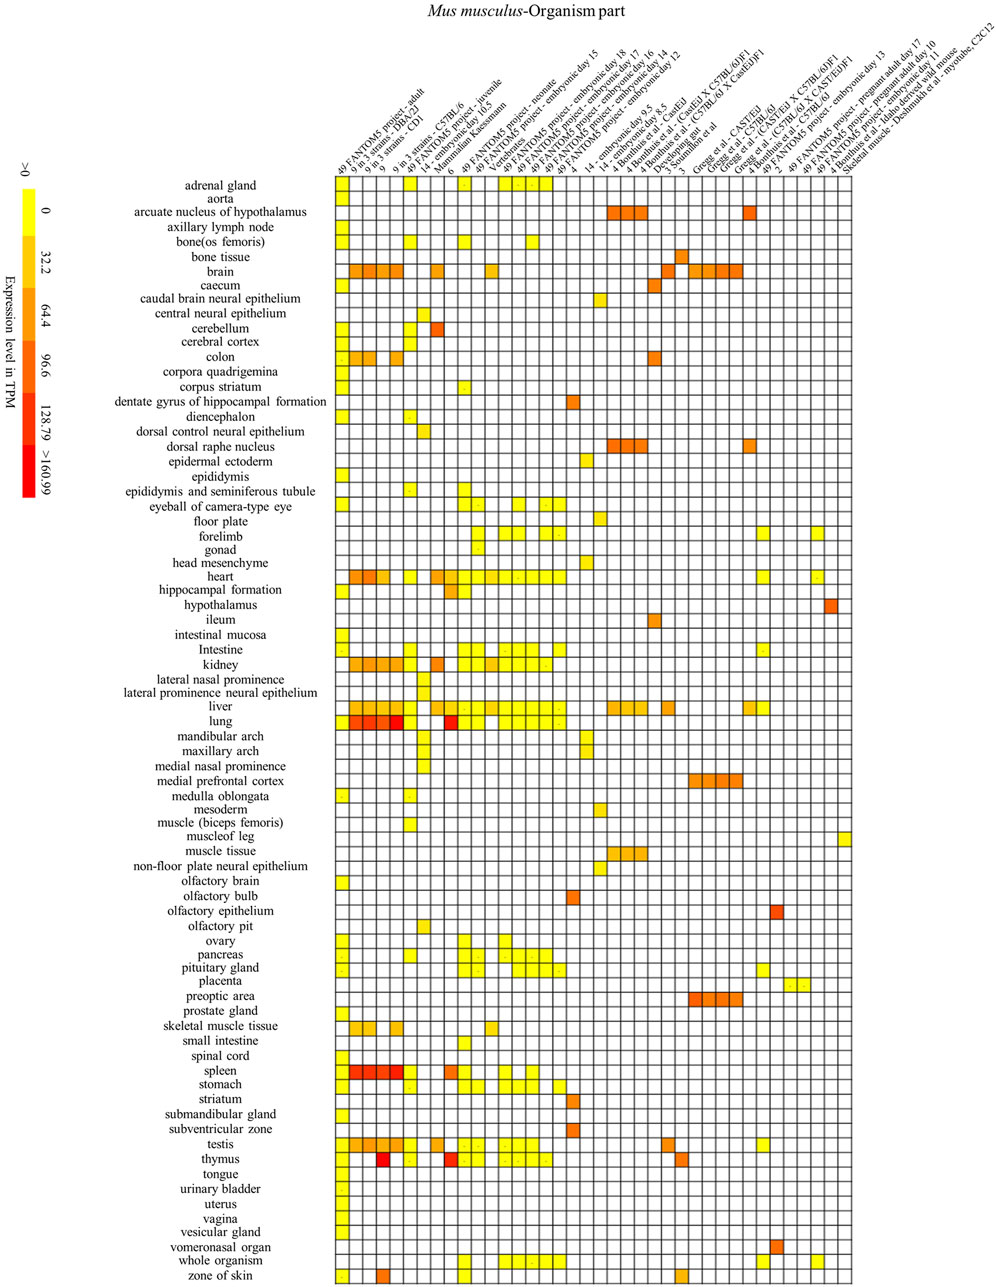
FIGURE 7. Mouse SYF2 is specifically expressed in different organs. Nos. 1–38 represent 38 data source projects, which are 49 FANTOM5 project – adult (1), 9 in 3 strains – (DBA/2J, CD1) (2–3), 9 (4), 9 in 3 strains - C57BL/6 (5), 49 FANTOM5 project – juvenile (6), 14 – embryonic day 10.5 (7), Mammalian Kaessmann (8), 6 (9), 49 FANTOM5 project – (neonate, embryonic day 15) (10–11), Vertebrates (12), 49 FANTOM5 project – (embryonic day 18, 17, 16, 14, 12) (13–17), 4 (18), 14 – (embryonic day 9.5, 8.5) (19–20), 4 Bonthuis et al. – (CastEiJ, (CastEiJ X C57BL/6J) F1), (C57BL/6J X CastEiJ) F1) (21–23), Developing gut (24), 3 Soumillon et al. (25), 3 (26), Gregg et al. – (CAST/EiJ, C57BL/6J, (CAST/EiJ X C57BL/6J) F1, (C57BL/6J X CAST/EiJ)F1) (27–30), 4 Bonthuis et al. – C57BL/6J (31), 49 FANTOM5 project – embryonic day 13 (32), 2 (33), 49 FANTOM5 project – (pregnant adult day 17, 10, embryonic day 11) (34–36), 4 Bonthuis et al. – Idaho derived wild mouse (37), Skeletal muscle – Deshmukh et al. – myotube, C2C12 (38), respectively. Baseline expression levels are in TPM (transcripts per million). The raw data were reorganized and presented as heatmaps using online BAR HeatMapper Plus software (http://bar.utoronto.ca/ntools/cgi-bin/ntools_heatmapper_plus.cgi).
First, accumulation of SYF2 was found in breast tumor lumen, triple-negative breast cancer, and HER2-positive breast cancer (Figure 5). Second, based on multiple datasets, SYF2s were highly expressed in spleen and lung tissue in both humans and mice (Figures 6 and 7). However, there are also differences in the locations and levels of SYF2 expression between humans and mice. Human SYF2 accumulates specifically in the reproductive organs, bladder, thyroid, and colon (Figure 6), while mouse SYF2 is abundant in tissues such as the cerebellum and thymus (Figure 7). Third, analysis of cell-type expression profiles showed that in humans, SYF2 is high in common lymphoid progenitors and hematopoietic stem cells. By contrast, mouse SYF2 accumulates in both native thymus-derived CD4-positive αβ T cells and induced T regulatory cells (Supplementary Figures S1 and S3). Moreover, SYF2 was expressed at high levels in mice of different strains, and at different sampling times, and different developmental and somite stages (Supplementary Figure S2). The developmental map showed a high abundance of human SYF2 in both the fetal and juvenile stages (Supplementary Figure S1). Across the developmental stages in mice, the accumulation of SYF2 was higher in two stages—the embryonic stage and a few days after parturition (Supplementary Figure S2). In summary, the expression patterns of SYF2 in humans and mice are not consistent, indicating that different species have different expression patterns due to the existence of different transcription and translation patterns. However, the study of SYF2 in different species will help to reveal more possible regulatory roles of SYF2, which is conducive to the further analysis of SYF2 function. Comparative analysis of expression patterns in humans and mice can help provide a theoretical basis for research into, and the treatment of some diseases. The comparison of human and mouse SYF2 gene expression patterns across tissues, cell types, and developmental stages is summarized in Table 1.
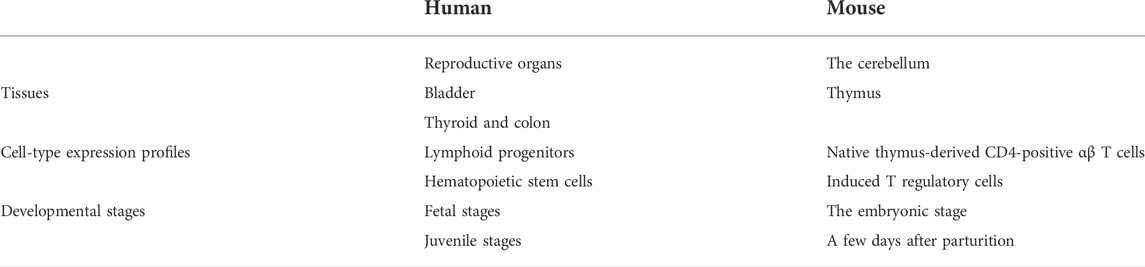
TABLE 1. Comparison of human and mouse SYF2 gene expression patterns in tissues, cell types and developmental stages.
Discussion
Phylogenetic and splicing pattern analysis indicates SYF2 conserved among animals
Numerous existing reports suggest that 15–35% of human disease is caused by mis-splicing or mis-assembly of spliceosome complex proteins (Shi, 2017). However, underlying evidence for how mis-splicing causes disease is lacking. Therefore, understanding the underlying mechanisms of splicing regulation will not only contribute to the decoding of the eukaryotic splicing machinery, but may also provide new targets for clinical drug discovery. We performed phylogenetic and splicing pattern analyses of SYF2 in this work to reveal its structural conservation and potential regulatory mechanisms across different animal species.
Phylogenetic topology shows that SYF2 proteins can be divided into 12 groups: primates, rats and mice, lagomorphs, other rodents, carnivores, ungulates, other placentas, marsupials and monotremes, birds and reptiles, fish, other vertebrates, and other species. In this, all vertebrate species are aggregated into one large group, showing distant relationships with other species, such as Ciona intestinalis, Ciona savignyi, Caenorhabditis elegans, and Drosophila melanogaster (Figure 1). Furthermore, animal SYF2 were subjected to conserved splicing pattern analysis (Figure 4). Similar to SYF2 previously reported in plants (Tian et al., 2019), truncated transcripts exist for the animal SYF2 gene, resulting in the creation of a conserved protein form with N-terminal truncation (Figure 4). Splice site analysis revealed that AFE and ALE were the most prominent AS events in the numerous animal species involved. In terms of the number of transcript isoforms, the SYF2 gene in different animal species generally has more than one transcript isoform, but it is worth noting that each transcript isoform has a similar structure, suggesting that they have similar functions in the regulation of gene expression. Moreover, most protein isoforms corresponding to each transcriptional isoform were considered functional. Therefore, the relevant biological functions of SYF2 protein isoforms in animal species need further study.
Differential expression patterns of animal SYF2s reveal functional diversity
SYF2 induces a transition from the G1 to S phase to promote cell proliferation, and does so by interacting with the cyclin-D-type binding protein 1 (Witzel et al., 2010). Embryonic and juvenile stages are important periods of cell growth and development in the developmental cycle of animals. Human and mouse expression profiling data indicate significant enrichment of SYF2 both in human fetal and juvenile stages, and in mouse embryonic and postpartum periods. Previous studies have also shown that disruption of SYF2 in mice leads to embryonic lethality (Chen et al., 2012). In Arabidopsis, high enrichment of SYF2 was clearly detected in the shoot apex during flowering transformation, but decreased enrichment and repressed expression of SYF2 were found in more mature pollen (Tian et al., 2019). This suggests that SYF2 can participate in embryonic developmental regulation by mediating cell cycle regulation.
The regulation of the cell cycle by SYF2 is also associated with the occurrence of many cancers. In the detection of disease expression profiles, SYF2 was significantly expressed in breast tumor lumen, triple-negative breast cancer, and HER2-positive breast cancer (Figure 5). In addition, in the organ-tissue-related expression profiles, SYF2 was enriched in the human ovary, testis, spleen, lung, bladder, thyroid, and colon (Figure 6), as well as in the mouse cerebellum, thymus, spleen and lung (Figure 7). Among these, many organ diseases caused by abnormal expression of SYF2 have been confirmed. For example, overexpression of SYF2 affects the cell cycle or cell proliferation leading to the occurrence and progress of breast cancer (Shi et al., 2017), non-small cell lung cancer (Liu et al., 2015; Chen et al., 2019), and ovarian cancer (Yan et al., 2015).
Interestingly, the comparative analysis of human and mouse expression data revealed that SYF2 expression patterns were different in different cells, tissues, organs, and developmental stages of humans and mice. These results indicate that the regulatory patterns of transcription and translation vary by species, although this is not absolute. Some similarities have been detected in expression in certain organs and tissues. For instance, high expression of SYF2 was detected in organs such as the lung and spleen of both humans and mice (Figures 6 and 7). These results provide new entry points for the treatment of certain organ diseases.
In this article, we compared and analyzed the expression patterns of humans and mice, and summarized the experimental data in each project by means of bioinformatics. We offered preliminarily speculation on the possible function of SYF2, which is expected to provide a direction and a theoretical basis for research into clinically relevant diseases. Analysis of results may be affected by different experimental and sampling conditions between projects. However, modern SWATH-MS proteomics technology (Chen M. X. et al., 2020; Shen et al., 2021) could be used to study the potential function of SYF2 further, and to verify the existing analysis results. It would be helpful to explore expression of the potential function of SYF2, and in so doing create more possibilities for the treatment of diseases caused by its abnormal expression.
Comparison of SYF2 in animals, yeast, and plants
The SYF2 in animals, yeast, and plants (Arabidopsis, Oryza sativa) was compared. First, by analyzing the interaction network, it was found that there were only 1–2 common interacting proteins among the three species, which indicates that SYF2 has specific regulatory networks in animals, plants, and yeast (Figure 3). Second, transcriptional isoforms of SYF2 averaged 2–3 in animal species (Figure 4), with only one copy in most yeast and plants (Tian et al., 2019). This suggests that SYF2 may play a more important role in animal species. The functional roles of SYF2 in these three species are conserved to some extent.
Conclusion
Throughout the study, we screened 102 SYF2 genes in 91 animal species and analyzed their phylogeny, gene structure, gene and protein motifs, conservation of splicing patterns, and expression patterns. Analysis of related structures, motifs, and splicing patterns showed that SYF2 is highly conserved in many animal species. In addition, the analysis of expression patterns showed that SYF2 is associated with the occurrence of cancer in breast, lung, spleen, and reproductive organs, as well as other diseases. These results are intended to help reveal the possible relationship between the SYF2 genotype and the occurrence of certain diseases, which can provide information about subsequent SYF2 expression in studies where animals provide the basis.
Materials and methods
Identification and screening of SYF2 protein sequences in animals
In the Ensembl database (http://asia.ensembl.org/), protein BLAST was performed based on the Homo sapiens SYF2 protein sequence (ENST00000236273_8) as a template. All available gene sequences were found in animal genomes, and further screening was performed through HMMER 3.2.1 (Johnson et al., 2010).
Construction of the SYF2 gene phylogenetic tree in animals
A phylogenetic tree was constructed using the protein sequences of 102 SYF2 genes obtained from the Ensembl database. Where a gene had more than one transcript, the longest coding sequence was selected. Selected sequences were subjected to comparative analysis by Muscle V3.8 (Edgar, 2004), after which a root phylogenetic tree was constructed using maximum likelihood implemented in PhyML V3.03730 (Gascuel, 2010). Finally, FigTree V1.4.3.3831 was used to edit and present the phylogenetic tree (Morariu et al., 2008). The reliability of the phylogenetic tree was tested by bootstrapping repeated sampling. Nucleotide sites were randomly selected from the original sequence to form a new set of gene sequences, and the same method was used to construct another phylogenetic tree. The topology of this phylogenetic tree was repeatedly compared with the structure of the original tree. Internal branches of the original phylogenetic tree with the same sequence separation as the bootstrap value were assigned a value of 1, while other internal branches were assigned a value of 0. We calculated the percentage of eigenvalue 1 obtained for each internal branch of the original phylogenetic tree to verify the reliability of the phylogenetic tree (Katsura et al., 2017; Fan et al., 2021).
Analysis of gene structures, protein domains and MEME motifs
All necessary SYF2-related gene and protein sequence information, as well as intron and exon structure information, was downloaded from Ensembl. Subsequently, the Gene Structure Display Server 2.0 (http://gsds.gao-lab.org/) was used to reconstruct gene structure (Hu et al., 2014). The HMMER website (https://www.ebi.ac.uk/Tools/hmmer/) was used to predict the protein structure domain (Potter et al., 2018). The cDNA and amino acid sequences of all the screened genes were entered into the MEME (https://meme-suite.org/meme/tools/meme), and the 10 most conserved motifs corresponding to the sequences were systematically predicted and analyzed.
Construction of protein interaction networks
The interacting proteins of Homo sapiens (ENST00000236273_8), Mus musculus (ENSMUST00000030622_2) and Saccharomyces cerevisiae (YGR129W) were analyzed through the STRING online database (https://string-db.org/), and the proteins with high interaction rankings were presented through the protein–protein interaction network. Finally, predicted functional partners (confidence cutoff of 0.900) of SYF2 proteins were presented in the form of an interaction network drawn by Cytoscape 3.8 software.
Analysis and identification of conserved splicing profiles and splice sites
Useful splice isomer sequences for the SYF2 gene were collected from Ensembl. The cDNA sequence information corresponding to the gene was entered into the MEME to obtain the corresponding motif information for each transcript.
Analysis of SYF2 expression by online microarray datasets
The required SYF2 expression data were downloaded through the Expression Atlas (https://www.ebi.ac.uk/gxa/home). The online BAR HeatMapper Plus software (http://bar.utoronto.ca/ntools/cgi-bin/ntools_heatmapper_plus.cgi) (Chen M. X. et al., 2020) was then used to rearrange the obtained original data as required, before finally presenting it in the form of a heatmap.
Data availability statement
The datasets presented in this study can be found in online repositories. The names of the repository/repositories and accession number(s) can be found in the article/Supplementary Material.
Author contributions
Conceptualization, Y-SC, J-FY, and M-XC; writing original draft preparation, XY, Z-CJ, and B-XH; writing review and editing, JZ, X-RL, C-LC, B-XH, Y-SC, and Z-CJ; funding, J-FY and Y-SC. The final version of the manuscript was agreed by all authors.
Funding
This work was supported by the Program for Science Technology and Innovation Committee of Shenzhen (2021N062-JCYJ20210324115408023), the Natural Science Foundation of Jiangsu Province (SBK2020042924), the Scientific Research Innovation Team of Young Scholars in Colleges and Universities of Shandong Province (2019KJE011), the National Natural Science Foundation of China (NSFC32001932), and the Hong Kong Research Grant Council (AoE/M-05/12, AoE/M-403/16, GRF12100318, 12103219, 12103220).
Conflict of interest
The authors declare that the research was conducted in the absence of any commercial or financial relationships that could be construed as a potential conflict of interest.
Publisher’s note
All claims expressed in this article are solely those of the authors and do not necessarily represent those of their affiliated organizations, or those of the publisher, the editors, and the reviewers. Any product that may be evaluated in this article, or claim that may be made by its manufacturer, is not guaranteed or endorsed by the publisher.
Supplementary material
The Supplementary Material for this article can be found online at: https://www.frontiersin.org/articles/10.3389/fgene.2022.873869/full#supplementary-material
References
Ben-Yehuda, S., Dix, I., Russell, C. S., McGarvey, M., Beggs, J. D., and Kupiec, M. (2000). Genetic and physical interactions between factors involved in both cell cycle progression and pre-mRNA splicing in Saccharomyces cerevisiae. Genetics 156, 1503–1517. doi:10.1093/genetics/156.4.1503
Berget, S. M., Moore, C., and Sharp, P. A. (1977). Spliced segments at the 5' terminus of adenovirus 2 late mRNA. Proc. Natl. Acad. Sci. U. S. A. 74, 3171–3175. doi:10.1073/pnas.74.8.3171
Chen, W., and Moore, M. J. (2015). Spliceosomes. Curr. Biol. 25, R181–R183. doi:10.1016/j.cub.2014.11.059
Chen, C. H., Chu, P. C., Lee, L., Lien, H. W., Lin, T. L., Fan, C. C., et al. (2012). Disruption of murine mp29/Syf2/Ntc31 gene results in embryonic lethality with aberrant checkpoint response. PLoS One 7, e33538. doi:10.1371/journal.pone.0033538
Chen, Z. Y., Liu, H. Y., Jiang, N., and Yuan, J. M. (2019). LncRNA HOST2 enhances gefitinib-resistance in non-small cell lung cancer by down-regulating miRNA-621. Eur. Rev. Med. Pharmacol. Sci. 23, 9939–9946. doi:10.26355/eurrev_201911_19560
Chen, M.-X., Zhang, K.-L., Zhang, M., Das, D., Fang, Y.-M., Dai, L., et al. (2020a). Alternative splicing and its regulatory role in woody plants. Tree Physiol. 40, 1475–1486. doi:10.1093/treephys/tpaa076
Chen, M. X., Zhang, K. L., Gao, B., Yang, J. F., Tian, Y., Das, D., et al. (2020b). Phylogenetic comparison of 5' splice site determination in central spliceosomal proteins of the U1-70K gene family, in response to developmental cues and stress conditions. Plant J. 103, 357–378. doi:10.1111/tpj.14735
Chen, M. X., Mei, L. C., Wang, F., Boyagane Dewayalage, I. K. W., Yang, J. F., Dai, L., et al. (2021). PlantSPEAD: a web resource towards comparatively analysing stress-responsive expression of splicing-related proteins in plant. Plant Biotechnol. J. 19, 227–229. doi:10.1111/pbi.13486
Cherif, H., Mannarino, M., Pacis, A. S., Ragoussis, J., Rabau, O., Ouellet, J. A., et al. (2022). Single-cell RNA-seq analysis of cells from degenerating and non-degenerating intervertebral discs from the same individual reveals new biomarkers for intervertebral disc degeneration. Int. J. Mol. Sci. 23, 3993. doi:10.3390/ijms23073993
Edgar, R. C. (2004). MUSCLE: multiple sequence alignment with high accuracy and high throughput. Nucleic Acids Res. 32, 1792–1797. doi:10.1093/nar/gkh340
Fan, T., Zhao, Y. Z., Yang, J. F., Liu, Q. L., Tian, Y., Debatosh, D., et al. (2021). Phylogenetic comparison and splice site conservation of eukaryotic U1 snRNP-specific U1-70K gene family. Sci. Rep. 11, 12760. doi:10.1038/s41598-021-91693-3
Gascuel, O., Dufayard, J. F., Lefort, V., Anisimova, M., and Hordijk, W. (2010). New algorithms and methods to estimate maximum-likelihood phylogenies: assessing the performance of PhyML 3.0. Syst. Biol. 59, 307–321. doi:10.1093/sysbio/syq010
Guo, J., Yang, L., Huang, J., Liu, X., Qiu, X., Tao, T., et al. (2014). Knocking down the expression of SYF2 inhibits the proliferation of glioma cells. Med. Oncol. 31, 101. doi:10.1007/s12032-014-0101-x
He, Y., Huang, C., Cai, K., Liu, P., Chen, X., Xu, Y., et al. (2021). PRPF19 promotes tongue cancer growth and chemoradiotherapy resistance. Acta Biochim. Biophys. Sin. 53, 893–902. doi:10.1093/abbs/gmab059
Hou, S., Li, N., Zhang, Q., Li, H., Wei, X., Hao, T., et al. (2016). XAB2 functions in mitotic cell cycle progression via transcriptional regulation of CENPE. Cell Death Dis. 7, e2409. doi:10.1038/cddis.2016.313
Hu, B., Jin, J., Guo, A. Y., He, Z., Ge, G., and Gao, G. (2014). GSDS 2.0: an upgraded gene feature visualization server. Bioinformatics 31, 1296–1297. doi:10.1093/bioinformatics/btu817
Huo, Y., Yan, Z. Q., Yuan, P., Qin, M., Kuo, Y., Li, R., et al. (2020). Single-cell DNA methylation sequencing reveals epigenetic alterations in mouse oocytes superovulated with different dosages of gonadotropins. Clin. Epigenet. 12, 75. doi:10.1186/s13148-020-00866-w
Johnson, L. S., Eddy, S. R., and Portugaly, E. (2010). Hidden Markov model speed heuristic and iterative HMM search procedure. BMC BioinformaticsBMC Bioinforma. 1111, 431431. doi:10.1186/1471-2105-11-431
Kaplan, Y., and Kupiec, M. (2007). A role for the yeast cell cycle/splicing factor Cdc40 in the G(1)/S transition. Curr. Genet. 51, 123–140. doi:10.1007/s00294-006-0113-y
Katsura, Y., Stanley, C. E., Kumar, S., and Nei, M. (2017). The reliability and stability of an inferred phylogenetic tree from empirical data. Mol. Biol. Evol. 34, 718–723. doi:10.1093/molbev/msw272
Kuraoka, I., Ito, S., Wada, T., Hayashida, M., Tanaka, K., Saijo, M., et al. (2008). Isolation of XAB2 complex involved in pre-mRNA splicing, transcription, and transcription-coupled repair. J. Biol. Chem. 283, 940–950. doi:10.1074/jbc.M706647200
Liu, Y., Ni, T., Xue, Q., Lv, L., Chen, B., Cui, X., et al. (2015). Involvement of p29/SYF2/fSAP29/NTC31 in the progression of NSCLC via modulating cell proliferation. Pathol. Res. Pract. 211, 36–42. doi:10.1016/j.prp.2014.07.013
Liu, B., Li, G., Zhang, Z., and Wu, H. (2019). Influence of miR-376c-3p/SYF2 Axis on the progression of gastric cancer. Technol. Cancer Res. Treat. 18, 1533033819874808. doi:10.1177/1533033819874808
Lorkovic, Z. J., Lehner, R., Forstner, C., and Barta, A. (2005). Evolutionary conservation of minor U12-type spliceosome between plants and humans. RNA 11, 1095–1107. doi:10.1261/rna.2440305
Madhani, H. D., and Guthrie, C. (1994). Dynamic RNA-RNA interactions in the spliceosome. Annu. Rev. Genet. 28, 1–26. doi:10.1146/annurev.ge.28.120194.000245
Morariu, V. I., Srinivasan, B. V., Raykar, V. C., Duraiswami, R., and Davis, L. S. (2008). “Automatic online tuning for fast Gaussian summation,” in Conference on Neural Information Processing Systems.
Nakatsu, Y., Asahina, H., Citterio, E., Rademakers, S., Vermeulen, W., Kamiuchi, S., et al. (2000). XAB2, a novel tetratricopeptide repeat protein involved in transcription-coupled DNA repair and transcription. J. Biol. Chem. 275, 34931–34937. doi:10.1074/jbc.M004936200
Orna, D., and Martin, K. (2002). Mutations in genes of Saccharomyces cerevisiae encoding pre‐mRNA splicing factors cause cell cycle arrest through activation of the spindle checkpoint. Nucleic Acids Res. 30, 4361–4370. doi:10.1093/nar/gkf563
Potter, S. C., Aurélien, L., Eddy, S. R., Youngmi, P., Rodrigo, L., and Finn, R. D. (2018). HMMER web server: 2018 update. Nucleic Acids Res. 46, W200–W204. doi:10.1093/nar/gky448
Schwer, B., and Gross, C. H. (1998). Prp22, a DExH-box RNA helicase, plays two distinct roles in yeast pre-mRNA splicing. Embo J. 17, 2086–2094. doi:10.1093/emboj/17.7.2086
Shen, C. C., Chen, M. X., Xiao, T., Zhang, C., Zhu, F. Y., Zhang, K. L., et al. (2021). Global proteome response to Pb(II) toxicity in poplar using SWATH-MS-based quantitative proteomics investigation. Ecotoxicol. Environ. Saf. 220, 112410. doi:10.1016/j.ecoenv.2021.112410
Shi, F., Cai, F. F., Cai, L., Lin, X. Y., Zhang, W., Wang, Q. Q., et al. (2017). Overexpression of SYF2 promotes cell proliferation and correlates with poor prognosis in human breast cancer. Oncotarget 8, 88453–88463. doi:10.18632/oncotarget.18188
Shi, Y. (2017). Mechanistic insights into precursor messenger RNA splicing by the spliceosome. Nat. Rev. Mol. Cell Biol. 18, 655–670. doi:10.1038/nrm.2017.86
Song, T., Das, D., Ye, N.-H., Wang, G.-Q., Zhu, F.-Y., Chen, M.-X., et al. (2021). Comparative transcriptome analysis of coleorhiza development in japonica and Indica rice. BMC Plant Biol. 21, 514. doi:10.1186/s12870-021-03276-z
Tanaka, I., Chakraborty, A., Saulnier, O., Benoit-Pilven, C., Vacher, S., Labiod, D., et al. (2020). ZRANB2 and SYF2-mediated splicing programs converging on ECT2 are involved in breast cancer cell resistance to doxorubicin. Nucleic Acids Res. 48, 2676–2693. doi:10.1093/nar/gkz1213
Tao, Y., Zhao, Y., Peng, Y., Ma, X., Sun, C., and Xu, K. (2020). MicroRNA-621 inhibits the growth of gastric cancer cells by targeting SYF2. Arch. Biochem. Biophys. 688, 108406. doi:10.1016/j.abb.2020.108406
Tian, Y., Chen, M. X., Yang, J. F., Achala, H. H. K., Gao, B., Hao, G. F., et al. (2019). Genome-wide identification and functional analysis of the splicing component SYF2/NTC31/p29 across different plant species. Planta 249, 583–600. doi:10.1007/s00425-018-3026-3
Toro, N., Jiménez-Zurdo, J. I., and García-Rodríguez, F. M. (2007). Bacterial group II introns: Not just splicing. FEMS Microbiol. Rev. 31, 342–358. doi:10.1111/j.1574-6976.2007.00068.x
Vijayraghavan, U., Company, M., and Abelson, J. (1989). Isolation and characterization of pre-mRNA splicing mutants of Saccharomyces cerevisiae. Genes Dev. 3, 1206–1216. doi:10.1101/gad.3.8.1206
Wan, R., Yan, C., Bai, R., Huang, G., and Shi, Y. (2016). Structure of a yeast catalytic step I spliceosome at 3.4 Å resolution. Science 353, 895–904. doi:10.1126/science.aag2235
Will, C. L., and Lührmann, R. (1997). Protein functions in pre-mRNA splicing. Curr. Opin. Cell Biol. 9, 320–328. doi:10.1016/s0955-0674(97)80003-8
Will, C. L., and Luhrmann, R. (2011). Spliceosome structure and function. Cold Spring Harb. Perspect. Biol. 3, a003707–330. doi:10.1101/cshperspect.a003707
Witzel, I.-I., Koh, Li F., and Perkins, Neil D. (2010). Regulation of cyclin D1 gene expression. Biochem. Soc. Trans. 38, 217–222. doi:10.1042/BST0380217
Yan, S., Deng, Y., Qiang, Y., Xi, Q., Liu, R., Yang, S., et al. (2015). SYF2 is upregulated in human epithelial ovarian cancer and promotes cell proliferation. Tumour Biol. 36, 4633–4642. doi:10.1007/s13277-015-3111-1
Yin, J., Zhu, J. M., and Shen, X. Z. (2012). New insights into pre-mRNA processing factor 19: A multi-faceted protein in humans. Biol. Cell 104, 695–705. doi:10.1111/boc.201200011
Zhang, S., Shi, W., Chen, Y., Xu, Z., Zhu, J., Zhang, T., et al. (2015). Overexpression of SYF2 correlates with enhanced cell growth and poor prognosis in human hepatocellular carcinoma. Mol. Cell. Biochem. 410, 1–9. doi:10.1007/s11010-015-2533-9
Keywords: alternative splicing, SYF2, expression profile, gene family, proteogenomics
Citation: Huang B-X, Jia Z-C, Yang X, Cheng C-L, Liu X-R, Zhang J, Chen M-X, Yang J-F and Chen Y-S (2022) Genome-wide comparison and in silico analysis of splicing factor SYF2/NTC31/p29 in eukaryotes: Special focus on vertebrates. Front. Genet. 13:873869. doi: 10.3389/fgene.2022.873869
Received: 11 February 2022; Accepted: 18 July 2022;
Published: 02 September 2022.
Edited by:
Nikolay Shirokikh, Australian National University, AustraliaReviewed by:
Moaz Ahmad, National Institutes of Health, United StatesShixiang Yao, Southwest University, China
Abdulmojeed Yakubu, Nasarawa State University, Nigeria
Copyright © 2022 Huang, Jia, Yang, Cheng, Liu, Zhang, Chen, Yang and Chen. This is an open-access article distributed under the terms of the Creative Commons Attribution License (CC BY). The use, distribution or reproduction in other forums is permitted, provided the original author(s) and the copyright owner(s) are credited and that the original publication in this journal is cited, in accordance with accepted academic practice. No use, distribution or reproduction is permitted which does not comply with these terms.
*Correspondence: Jing-Fang Yang, yangjf@mail.ccnu.edu.cn; Yun-Sheng Chen, chenyunshenglw@163.com
†These authors contributed equally to this work