 Yunxian Dong
 Zirui Zhao
 Maijimi Simayi3
 Zhongye Xu
 Dongming Lv
 Bing Tang
- 1Department of Burn and Plastic Surgery, The First Affiliated Hospital of Sun Yat-sen University, Guangzhou, Guangdong, China
- 2Department of Gastrointestinal Surgery, The First Affiliated Hospital of Sun Yat-sen University, Guangzhou, Guangdong, China
- 3Department of General Surgery, The First People’s Hospital of Kashgar, Kashgar, China
Background: Immunotherapy with checkpoint inhibitors usually has a low response rate in some cutaneous melanoma (CM) cases due to its cold nature. Hence, identification of hot tumors is important to improve the immunotherapeutic efficacy and prognoses of CMs.
Methods: Fatty acid (FA) metabolism-related genes were extracted from the Gene Set Enrichment Analysis and used in the non-negative matrix factorization (NMF), copy number variation frequency, tumor mutation burden (TMB), and immune-related analyses, such as immunophenoscore (IPS). We generate a risk model and a nomogram for predicting patient prognoses and predicted the potential drugs for therapies using the Connectivity Map. Moreover, the NMF and the risk model were validated in a cohort of cases in the GSE65904 and GSE54467. At last, immunohistochemistry (IHC) was used for further validation.
Results: Based on the NMF of 11 FA metabolism-related DEGs, CM cases were stratified into two clusters. Cluster 2 cases had the characteristics of a hot tumor with higher immune infiltration levels, higher immune checkpoint (IC) molecules expression levels, higher TMB, and more sensitivity to immunotherapy and more potential immunotherapeutic drugs and were identified as hot tumors for immunotherapy. The risk model and nomogram displayed excellent predictor values. In addition, there were more small potential molecule drugs for therapies of CM patients, such as ambroxol. In immunohistochemistry (IHC), we could find that expression of PLA2G2D, ACOXL, and KMO was upregulated in CM tissues, while the expression of IL4I1, BBOX1, and CIDEA was reversed or not detected.
Conclusion: The transcriptome profiles of FA metabolism-related genes were effective for distinguishing CM into hot–cold tumors. Our findings may be valuable for development of effective immunotherapy for CM patients and for proposing new therapy strategies.
1 Introduction
Cutaneous melanoma (CM) is the most malignant of all skin tumors (Bray et al., 2018). Most of the patients with CM are diagnosed already at clinically detectable stage III with or without in-transit metastases, which is called high-risk resectable melanoma, and suffer from a high-risk relapse (up to 70%) when treated with surgery alone (Gershenwald et al., 2017; Schadendorf et al., 2018). Conventional surgical procedures and chemotherapies are difficult to effectively cure CM due to chemotherapy failure and severe adverse effects (Amaria et al., 2019). As a result, patients diagnosed at an advanced stage of CM have an extremely poor prognosis, with a 5-year survival rate of less than 10% (Schadendorf et al., 2018; Allais et al., 2021). Over the past decade, immunotherapy, such as immune checkpoint inhibitors (ICIs), has significantly prolonged CM patients’ overall survival (Hamid et al., 2019; Eggermont et al., 2021). Moreover, those ICIs usually have lower toxicity, high life quality, and treatment compliance in most CM patients. Unfortunately, the therapeutic efficacy and response rate in CM patients remain low. On the other hand, not all CM patients benefit from ICIs, although immunotherapy had achieved a lot. For example, programmed cell death protein 1(PD-1) inhibitor therapy usually has a response rate of one-third in CM (Galon and Bruni, 2019; Salmon et al., 2019; Tang et al., 2020).
The effectiveness of immunotherapy depends on the levels of circulating immune components in the body, CD8+ T cell infiltration, and proliferative ability in the tumors (Galon and Bruni, 2019; Salmon et al., 2019; Lopez de Rodas and Schalper, 2021). According to the immune infiltration level of tumors, we could classify tumors into two categories, “hot” and “cold”. The terms “hot” and “cold” are used to refer to T cell-infiltrated, inflamed but non-infiltrated, and non-inflamed tumors (Galon and Bruni, 2019). The hot tumors with high immune infiltration, particularly for CD8+ T cells, usually are sensitive to immunotherapy because the pre-stored immune cells can effectively attack tumor cells following immunotherapy, such as checkpoint inhibitors (Ochoa de Olza et al., 2020; Too et al., 2021). Therefore, it is necessary to apply different treatment strategies for cold and hot tumors. Actually, early transformation of cold tumors into hot tumors can improve the efficacy of immunotherapy and prognosis of patients (Ji et al., 2021; Li et al., 2021).
It is well known that because of hypoxia and aggressive growth, the TME usually has high oxidation of fatty acid (FA) metabolism. In CM, lipid metabolism is associated with the resistance to targeted therapeutic drugs by altered expression of the FA transporter FATP2 (Alicea et al., 2020). A metabolic reprogramming to FA oxidation (FAO) can regulate the adaptation of BRAF-mutated melanoma to MAPK inhibitors (Aloia et al., 2019). A strong FAO in dendritic cells can attenuate therapeutic responses to anti-PD-1 treatment in melanoma by modulating Wnt5a-β-catenin-PPAR-γ signaling (Zhao et al., 2018). Moreover, the fatty acid receptor GPR120 may be a new marker for human melanoma (Oh et al., 2010; Kleemann et al., 2018).
However, the relationship between FA metabolism-related genes and immunotherapy remains largely unclear in CM. Moreover, there is little information on reliable biomarkers to distinguish cold from hot tumors, including CM (Maleki Vareki, 2018; Long et al., 2022). In this study, we analyzed the FA metabolism-related genes and immune infiltrates in CM and after determining their prognostic values, we generated and validated a risk model and nomogram. In addition, we screened some small-molecule drugs. Our findings indicated the risk model and clusters were valuable for prognosis and predicting immunotherapeutic responses in CM patients.
2 Materials and methods
2.1 Date preparation
The RNA-seq profiles of 471 CM and one non-tumor samples of the cancer genome atlas (TCGA),as well as 555 non-tumor skin specimens of the Genotype-Tissue Expression Project (GTEx), were obtained from the University of California Santa Cruz (UCSC). Batch normalization was performed in the data set by the sva R package. The differentially expressed genes (DEGs) were analyzed using Counts format profiles and converted into TPM format profiles for further analyses using the limma R package (Stupnikov et al., 2021). Their clinical data, such as overall survival (OS), and copy number, were also downloaded from UCSC. Furthermore, RNA-seq profiles, survival status, and OS time of CM patients were obtained from the GSE65904 and GSE54467 datasets for external validation from Gene Expression Omnibus (GEO). To reduce statistical bias, CM samples with missing OS values or short OS values (< 30 days) were excluded from all cohorts. As a result, 447 patients in the TCGA cohort and 278 in the external validation cohort were used for analyses. In addition, the fatty acid (FA) metabolism-related gene sets, including M14568, M22474, M34207, M34208, M29237, M23047, M15179, M16838, M25445, M23048, M13605, M11966, M15385, M16969, M14401, M34091, M13290, M11936, M14177, M12558, M16551, M13480, M15568, M18199, M26370, M26153, M40674, M18978, M26866, M26251, M5935, M36310, M37191, M11673, M29570, M27727, M27719, M14690, M22174, M6999, M13591, M10250, M15813, M25014, M16181, M12334, M17829, M25044, M15938, M23782, M22457, M40405, M40498, M699, M6995, M9927, M15531, M27854, M39440, and M39596, containing 745 fatty acid metabolism-related genes were extracted. Their intersection genes were identified in the TCGA, GTEx, and external validation cohorts using the VennDiagram R package. Moreover, the tumor mutation burden data of these cohorts were obtained from the TCGA database.
2.2 FA DEGs and NMF
FA metabolism-related DEGs between the CM and non-tumor samples were identified, based on the criteria of a false discovery rate (FDR) < 0.05 and an absolute value Log2 fold change >1, using the limma R package in the TCGA and GTEx synthetic Counts matrix (Deng et al., 2021). This synthetic matrix had been normalized for identifying DEGs. Subsequently, 11 FA metabolism-related DEGs were identified using univariate Cox proportional hazard regression, and they had significant prognostic values (all p < 0.05) using the limma and survival R packages in the TCGA cohort (Zheng et al., 2021). These 11 FA metabolism-related DEGs with potent prognostic values were subjected to non-negative matrix factorization (NMF) analyses for sample clustering by NMF and survival R packages (Zhuo et al., 2020). The Kaplan–Meier survival curves of OS, t-distributed stochastic neighbor embedding (t-SNE), and Principal Component Analyses (PCA) of the clusters were analyzed using the survminer, Rtsne, ggplot2, and scatterplot3d R packages. Similar analyses were performed in the external validation cohort.
2.3 Copy number alterations
The copy number variation (CNV) frequencies of these FA metabolism-related prognostic genes were calculated, and their locations in human chromosomes were identified using the RCircos R package. For each prognostic gene, we compared the immune infiltration levels of CM patients with different somatic copy number alterations, such as deep deletion, arm-level deletion, and diploid/normal, using the Tumor Immune Estimation Resource (TIMER) (Kang et al., 2020).
2.4 Functional analysis
The potential functions and pathways of each set of genes in the cluster were analyzed using the Gene Set Enrichment Analyses (GSEA) software (https://www.gsea-msigdb.org/gsea/login jsp) and Curated gene set (kegg. v7. 4. symbols. gmt). Multi-GSEA diagrams were drawn using the plyr, grid, and gridExtra R packages.
2.5 Evaluation of immune infiltration
The immune infiltration of individual patients was analyzed using the CIBERSORT (R scrip v 1.03), and their immune scores, stromal scores, ESTIMATE (microenvironment) scores, and tumor purity were compared using the estimate R package, followed by visualizing them as the pheatmap using the ggtext packages (Gui et al., 2021). Subsequently, the immune cell infiltration, immune functions, and expression of genes for checkpoints were compared using the GSVA, GSEABase, ggpubr, reshape2, and limma R packages.
2.6 Tumor mutation burden analysis
The tumor mutation burden (TMB) data in the “Masked Somatic Mutation” type were processed by VarScan2 and analyzed in clusters using the maftools package (Koboldt et al., 2012). Furthermore, their overall survival was estimated by K–M survival analysis, and a box plot was made using the survminer, survival, ggplot2, ggpubr, and ggExtra R packages.
2.7 Immunotherapy-related exploration
According to the results of comprehensive immunogenomic analyses in The Cancer Immunome Atlas (TCIA), the response of each patient to immunotherapy was predicted and compared using the ggpubr R package (Charoentong et al., 2017). Additionally, the potential immunotherapeutic function of some drugs and their half-maximal inhibitory concentration (IC50) in CM patients were predicted based on the data from Genomics of Drug Sensitivity in Cancer (GDSC) using the pRRophetic R package (Gui et al., 2021).
2.8 Construction and assessment of the risk model and nomogram
CM patients were randomly divided into training and testing sets. A risk model was generated using the least absolute shrinkage and selection operator (LASSO) in the glmnet R package. The risk score formula (Zheng et al., 2021):
The coef (gene) meant the coefficient of the gene in the risk model, and expr (gene) was the expression of the gene in the risk model. The status, survival time, heatmaps, Kaplan–Meier survival analyses, and receiver operating characteristic (ROC) curves of individual patients in the training, testing, and entire sets were also analyzed using the pheatmap, survival, and timeROC R packages. For validation, a risk score of each patient in the external validation cohort was calculated, and their survival was estimated by the Kaplan–Meier survival analysis. The specificity and sensitivity of this risk model were evaluated by ROC analysis.
According to patient's clinical data and risk scores, the independent prognostic factors for worse survival were identified using univariate Cox and multivariate Cox regression analyses and used for the generation of a nomogram using the nomogramEx and nomogramFormula R packages. The concordance of the nomogram was analyzed by the ROC curves using the timeROC and rms R packages.
2.9 Connectivity Map
For predicting potential small-molecule drugs that might reverse high risk in CM, the whole overlapping genes, including the upregulated and downregulated genes, were submitted into the CMap database (https://portals.broadinstitute.org/cmap/). The drugs with enrichment scores between −1 and 0 were considered candidate drugs for CM (all p < 0.05) (Gui et al., 2021).
2.10 Validation of protein expressions of FA metabolism-related genes by the Human Protein Atlas
2.10.1 Database
The protein expression of the FA metabolism-related genes between CM and normal tissues was determined using immunohistochemistry (IHC) from the Human Protein Atlas database (HPA) as well as our own preserved patients’ tissue paraffin slides (Thul and Lindskog, 2018).
2.11 Histopathology
The tumor tissues were fixed in 10% formalin overnight and paraffin-embedded. The tissue sections (5 µm) were regularly stained with immunohistochemistry (IHC) staining. The stained tissue sections were photo-imaged and observed under a light microscope. The primary antibodies were used at 1:200 for CIDEA (Abcam, ab191193), ACOXL (Proteintech, 23366-1-AP), PLA2G2D (Abcam, ab47118), and 1:400 for KMO (Abcam, ab233529).
2.12 Statistical analysis
We made analyses with R version 3.6.3 (http://www.R-project.org) and its appropriate packages. All involved packages were described in MATERIALS AND METHODS. Data were analyzed with standard statistical tests as appropriate, while multiple testing was adjusted by the FDR method by R (Gui et al., 2021). Statistical significance was observed when p < 0.05.
3 Result
3.1 FA metabolism-related differentially expressed genes and NMF clusters
A total of 745 FA metabolism-related genes were identified in CM from the GSEA (Supplementary Table S1). Similarly, 533 of them were identified in CM from the GTEx, TCGA, GSE65904, and GSE54467 (Figure 1A). There were 51 DEGs in the TCGA cohort. Of them, 17 were upregulated and the others were downregulated (Figure 1B). Further analyses indicated that 11 DEGs were associated with the prognosis of CM (all p < 0.05, Figure 1C). Of them, ALOX12B, CYP4F3, ALDH3A1, CIDEA, and BBOX1 were upregulated in CM, while the others were downregulated.
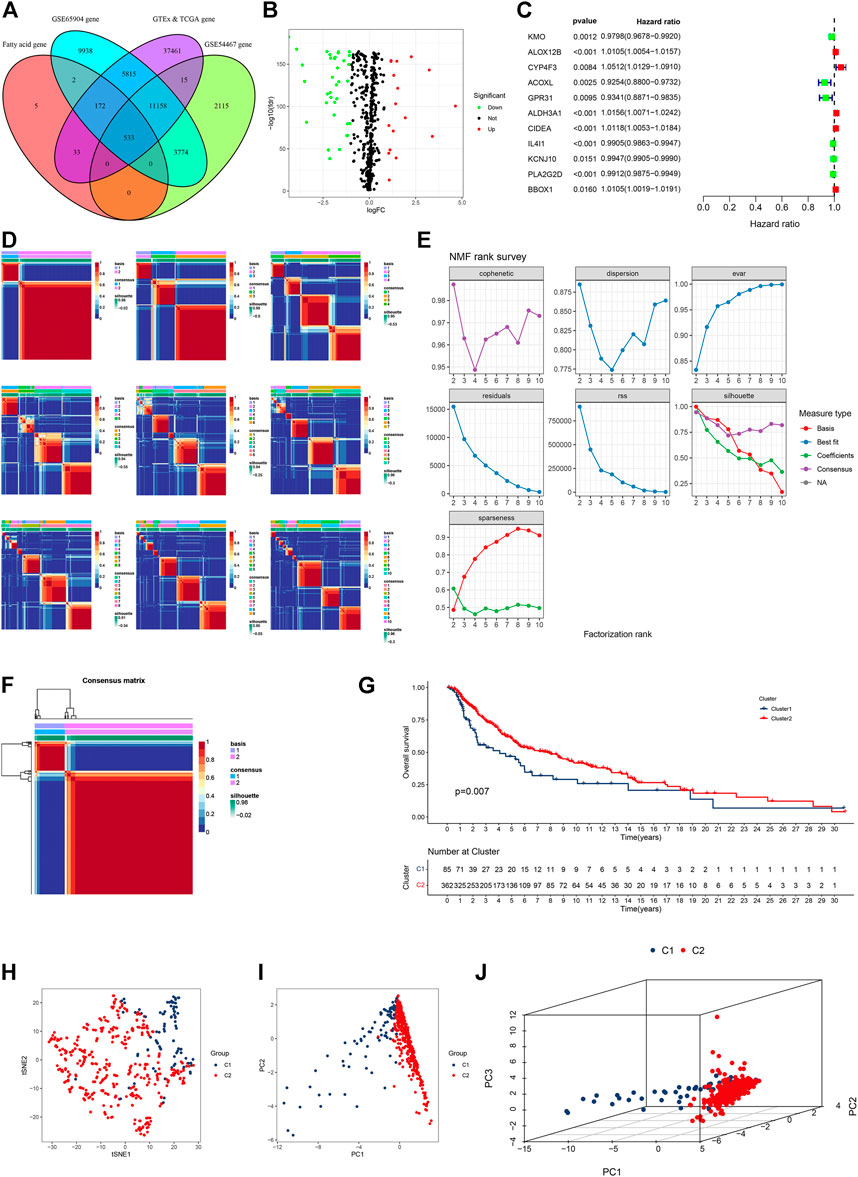
FIGURE 1. Identification of fatty acid metabolism-related genes in four gene subsets and clusters in the TCGA CM cohort. (A) Venn diagram displayed FA metabolism-related genes in CM cases from TCGA, GTEx, GSE65904, and GSE54467. (B) Volcano plot of 51 FA metabolism-related DEGs. (C) Forest plot of prognostic FA metabolism-related DEGs. (D) All the heatmaps of NMF consensus clustering. (E) NMF rank survey of cophenetic, dispersion, evar, residuals, rss, silhouette, and sparseness coefficients. (F) Heatmap of two clusters of CM. (G) Kaplan–Meier survival curves of OS in these clusters of CM cases. (H–J) t-SNE, PCA, and 3D PCA separated two clusters of CM. A p value of <0.05 was considered to indicate a statistically significant difference.
Based on comprehensive correlation coefficients and all heatmaps, we found the optimal total cluster number was set to k = 2 (Figures 1D,E). The heatmap (k = 2) indicated a clear boundary (Figure 1F). Compared with cluster 2, patients in cluster 1 had a worse OS (Figure 1G). To further verify the cluster distribution, the t-SNE, 2D PCA, and 3D PCA analyses clearly separated these prognostic genes (Figures 1H–J).
3.2 External verification of NMF clusters and analyses of copy number in CM
In the external verification cohort, the optimal total cluster number was k = 2 in NMF. The difference between the two clusters and their NMF ranks are displayed (Figure 2A, Supplementary Figures S1A,B). In addition, the t-SNE, PCA, and Kaplan–Meier survival curves of OS analyses revealed their distribution, and patients in cluster B had a worse OS in this population (Figures 2B–E).
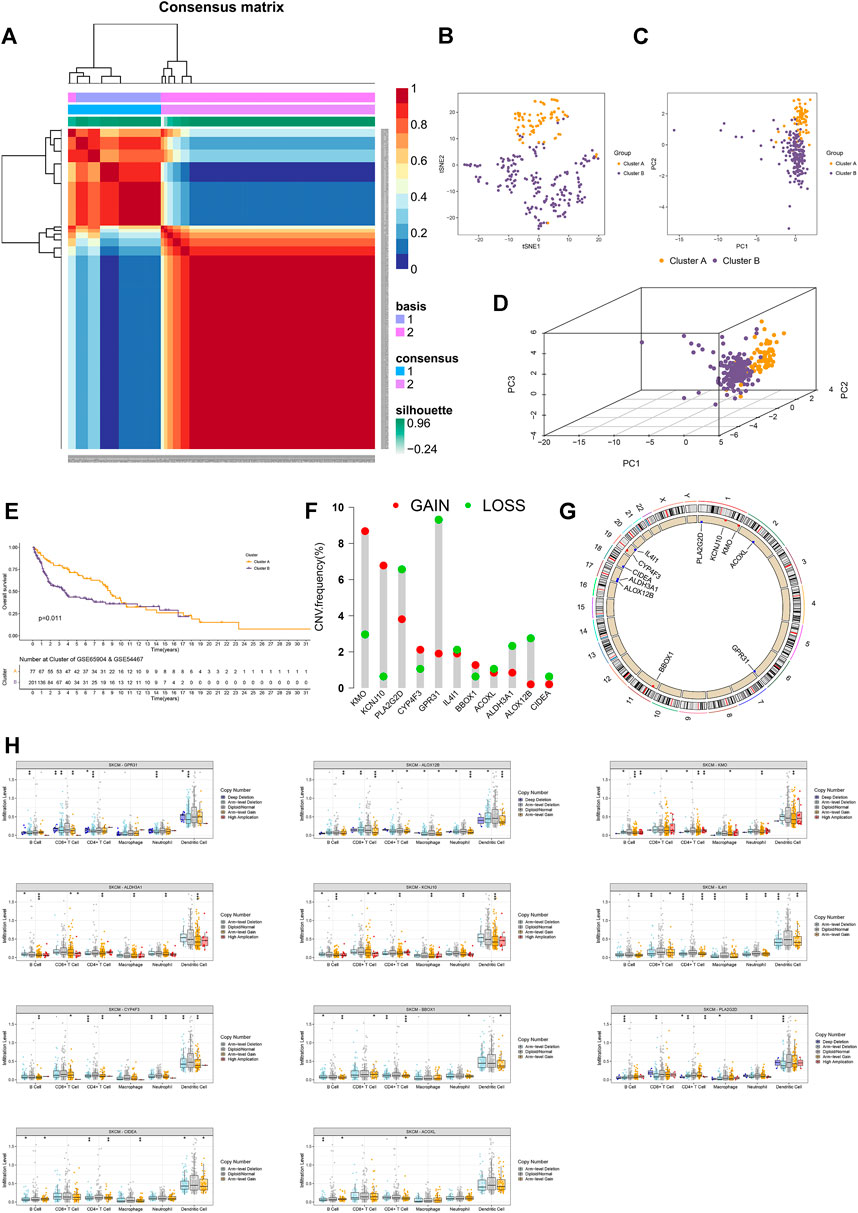
FIGURE 2. External validation and copy number analyses. (A) Heatmap of two clusters of cases in the external validation cohort. (B–D) t-SNE, PCA, and 3D PCA separated two clusters of CM cases in the external validation cohort. (E) Kaplan–Meier survival curves of OS in two clusters of CM cases in the external validation cohort. (F) CNV frequency of 11 FA metabolism-related genes. (G) CNV of prognostic genes on RCircos 2D track plot with the human genome. (H) Different types of immune infiltrates among samples with copy number of the indicated genes. Ns means no significant difference, *p < 0.05, **p < 0.01 and ***p < 0.001. A p value of <0.05 was considered to indicate a statistically significant difference.
Next, we calculated the CNV frequency of 11 prognostic genes and located them in human chromosomes. The percentages of gain CNV of KMO, KCNJ10, CYP4F3, and BBOX1 were higher than those of the loss, while the frequency of gain CNV of PLA2G2D, GPR31, IL4I1, ACOXL, ALDH3A1, ALOX12B, and CIDEA was lower than that of loss (Figure 2F). As a result, the KMO, KCNJ10, CYP4F3, and BBOX1 genes were marked in red, and the PLA2G2D, GPR31, IL4I1, ACOXL, ALDH3A1, ALOX12B, and CIDEA were marked in blue on RCircos 2D track plots (Figure 2G). Furthermore, we explored the changes in immune cell infiltration with a copy number alteration of prognostic genes in CM. Alterations of these genes were associated with infiltration levels of CD8+ T cells or other immune cells (Figure 2H). These indicated that clusters of CM with varying prognostic genes had different immune microenvironments, leading to different responses to immunotherapy (O'Sullivan et al., 2019).
3.3 Analyses of the immune microenvironment and TMB in CM
We performed GSEA to explore the biological functions of these clusters. Cluster 2 and cluster 1 of genes were involved in the top 15 pathways (all p < 0.05, FDR <0.05, |NES|>1.8, Supplementary Figures S1C,D). In cluster 2, almost all of the enriched pathways were associated with immunity, such as chemokine signaling, and natural killer cell-mediated cytotoxicity (Figure 3A) (Chow and Luster, 2014; Taniguchi and Karin, 2018). On the contrary, six out of the top 15 pathways enriched by the genes in cluster 1 were associated with FA metabolism, such as arachidonic acid metabolism, four pathways were related to tumor growth, and two were related to drug metabolism (Figure 3B). According to the heatmap of immune cell infiltration, we felt that the cluster 2 had a higher immune cell infiltration level, lower tumor purity, and more active immunity (Figure 3C). In the immune cell bubble chart, cluster 2 of CM had more immune cell infiltrates (Figure 3D, Supplementary Data Sheet S1). Based on the single-sample GSEA scores for immune cells and immune functions, 13 types of immune cells, such as CD8+ T cells, and 12 immune functions, such as inflammation-promoting and check-point, had a higher score in cluster 2 of CM (ns means no significant difference, *p < 0.05, **p < 0.01, and ***p < 0.001, Figures 3E,F). Of course, almost all immune checkpoint genes, such as CD274 (PD-L1), CTLA4, HAVCR2 (TIME3),and LAG3, displayed a higher activation in cluster 2 (Figure 3G) (Galon and Bruni, 2019). Cluster 2 had a high immune score, stromal score, and ESTIMATE score (microenvironment score, Figure 3H). Therefore, cluster 2 of CM was considered the hot tumor to respond to immunotherapy because cluster 2 of CM displayed the characteristics of hot immune tumors, such as a high degree of CD8+ T cells, high immune score, more active immune functions, and higher expression of CTLA4, TIM3, and LAG3 (Galon and Bruni, 2019; Zheng et al., 2021). Previous studies have shown that a high TMB is significantly associated with improved OS and benefits from immunotherapy, such as CTLA-4 blockade, and the TMB has been considered a potential immunotherapy parameter (Snyder et al., 2014; Mahoney et al., 2015; Chan et al., 2019). Hence, we analyzed the TMB of CM in the TCGA cohort to explore the responses of these clusters of CM to immunotherapy. The TMB frequency in cluster 2 of CM (92.74%) was higher than that of cluster 1 (85.88%) (Figures 3I,J). Consistently, the high-TMB group (H-TMB) of CM patients had better OS than those in the low-TMB group (L-TMB) (Figure 3K). Stratification analysis revealed that CM patients with high TMB displayed a better OS than those with low-TMB in both clusters (Figure 3L).
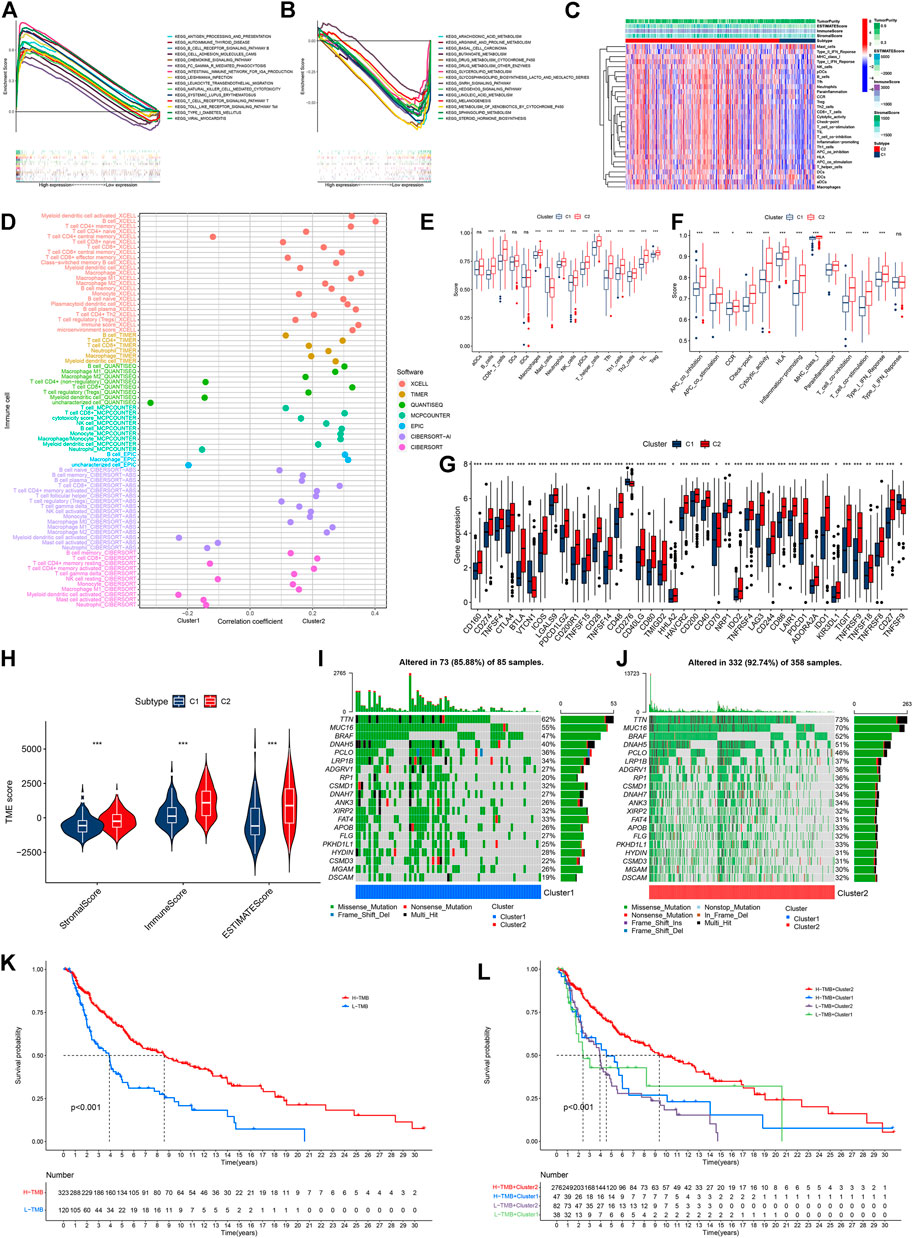
FIGURE 3. Analyses of tumor immune characteristics and TMB in these two clusters of CM cases. (A) Multi-GSEA analyses of cluster 2 CM cases. (B) multi-GSEA analyses of cluster 1 CM cases. (C) Heatmap of immune infiltrates between two clusters of CM cases. (D) Correlation coefficient of immune infiltrates in two clusters of CM cases. (E,F) Single-sample GSEA scores of immune cells and immune functions in two clusters of CM cases. (G) Comparisons of genes for expression of 40 checkpoints between two clusters of CM cases. (H) Comparisons of immune-related scores in two clusters of CM cases. (I,J) Waterfall plot of TMB of individual patients in cluster 1 and cluster 2. (K) Kaplan–Meier analysis of OS between the low- and high-TMB groups of CM cases. (L) Kaplan–Meier analysis of OS among four groups of CM cases. *p < 0.05, **p < 0.01, and ***p < 0.001. A p value of <0.05 was considered to indicate a statistically significant difference.
3.4 Investigation in immunotherapy
Compared with cluster 1, CM in cluster 2 possessed significantly higher TMB (Figure 4A). Accordingly, we investigated immune checkpoint-related scores in these clusters of CM. Compared with cluster 1 CM, cluster 2 CMs had significantly higher both PD-1 and CTLA4 immunophenoscore (IPS, Figure 4B). In addition, CM patients in cluster 2 were likely to be more sensitive to 12 potential immunotherapy-related drugs with lower IC50 than those in cluster 1 (Figure 4C) (Haikala et al., 2019; Song et al., 2019).
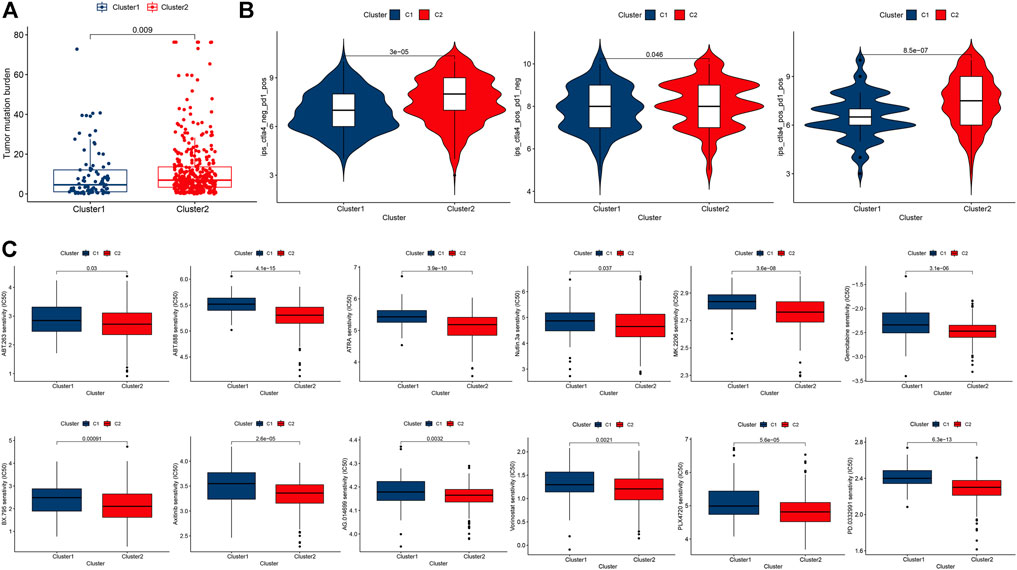
FIGURE 4. Comparisons of TMB, immune checkpoint gene expression, and drug sensitivity between two clusters of CM cases. (A) Levels of TMB in two clusters of CM cases. (B) PD-1 and/or CTLA4 in two clusters of CM cases. (C) Prediction of potential therapeutic drugs IC50 in two clusters of cases. A p value of <0.05 was considered to indicate a statistically significant difference.
3.5 Risk model and external verification
With the LASSO regression analyses, a risk model of seven genes was established after control of the first-rank value of Log(λ) at the minimum likelihood of deviance (Figures 5A,B). The risk score formula was Risk score = KMO × (−0.0032) + CYP4F3 × (−0.0054) + ACOXL × (−0.0220) + CIDEA × 0.0135 + IL4I1 × (−0.0039) + PLA2G2D × (−0.0033) + BBOX1 × 0.0048. In addition, analyses of the survival status, survival time, expression of seven genes, and OS of patients clearly separated between low- and high-risk groups of CM patients in the training, testing, and entire sets of cases (Figures 5C–N). Hence, CM patients in the low-risk group displayed a better prognosis. The AUC for 1-, 2- and 3-year OS in the training set of cases was 0.671, 0.703, and 0.701, that of the testing set of cases was 0.664, 0.665, and 0.654, and that of the entire sets of cases was 0.663, 0.682, 0.676, respectively (Figures 5O–Q). After analyzing the clinical characteristic of the patients, we found our risk model was also available in age, gender, tumor stage, T stage. and N stage (Supplementary Figure S2A). Furthermore, stratification of CM patients was carried out into low- and high-risk groups, and the t-SNE, 2D PCA, and 3D PCA clearly separated them (Supplementary Figures S3A). Further validation revealed that CM patients in the low-risk group exhibited significantly better OS than those in the high-risk group (p = 0.002, Figure 5R). The AUC for 1-, 2-, and 3-year OS in the external validation cohort were 0.668, 0.684, and 0.690, respectively (Figure 5S).
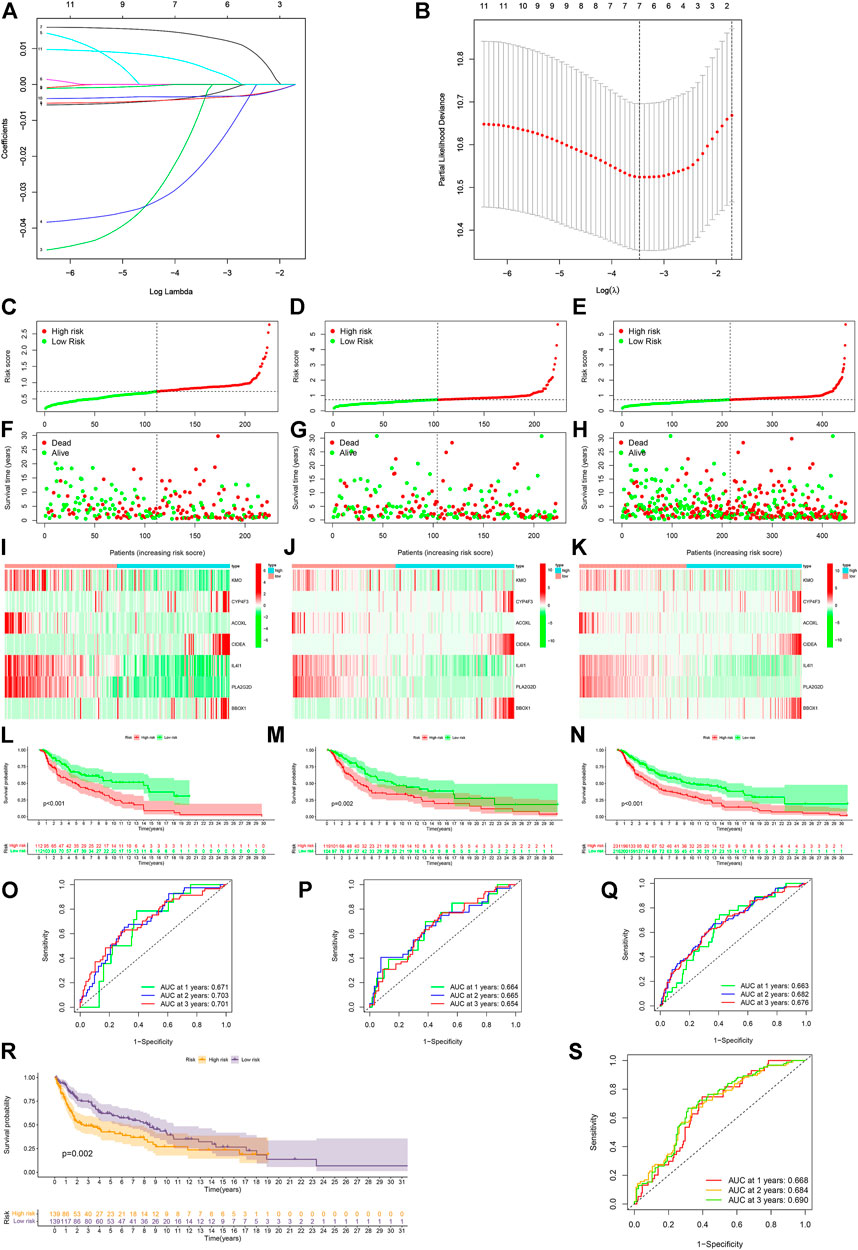
FIGURE 5. Construction and validation of the risk model. (A,B) Constructing a risk model of seven genes by LASSO regression. (C–E) Risk scores of the training, testing, and entire sets, respectively. (F–H) Survival status of individual cases between the low- and high-risk groups in the training, testing, and entire sets. (I–K) Heatmap of seven gene expression in the training, testing, and entire sets of CM cases. (L–N) Kaplan–Meier analysis of OS between the low- and high-risk groups of CM cases in the training, testing, and entire sets. (O–Q) ROC curves for 1-, 2- and 3-year OS of CM cases in the training, testing, and entire sets. (R) External validation of the risk model. (S) ROC curves for 1-, 2- and 3-year OS of CM case in the external validation cohort. A p value of <0.05 was considered to indicate a statistically significant difference.
3.6 Construction and assessment of a nomogram
The univariate Cox (uni-Cox) and multivariate Cox (multi-Cox) regression analyses indicated that patient’s age, tumor T stage, tumor N stage, and risk score were independent risk factors for prognosis of CM patients. Their independent risk factors were associated with a worse prognosis for CM patients with hazard ratios and a 95% confidence interval (CI) (Figures 6A,B). With these four independent prognostic indexes, a nomogram was generated (Figure 6C). The AUC of a nomogram for 1-, 2-, and 3-year OS of CM patients was 0.766, 0.816, and 0.816, respectively (Figure 6D). The calibration plots of the nomogram for 1-, 2-, and 3-year OS of CM patients had a good concordance with the prediction (Figure 6E).
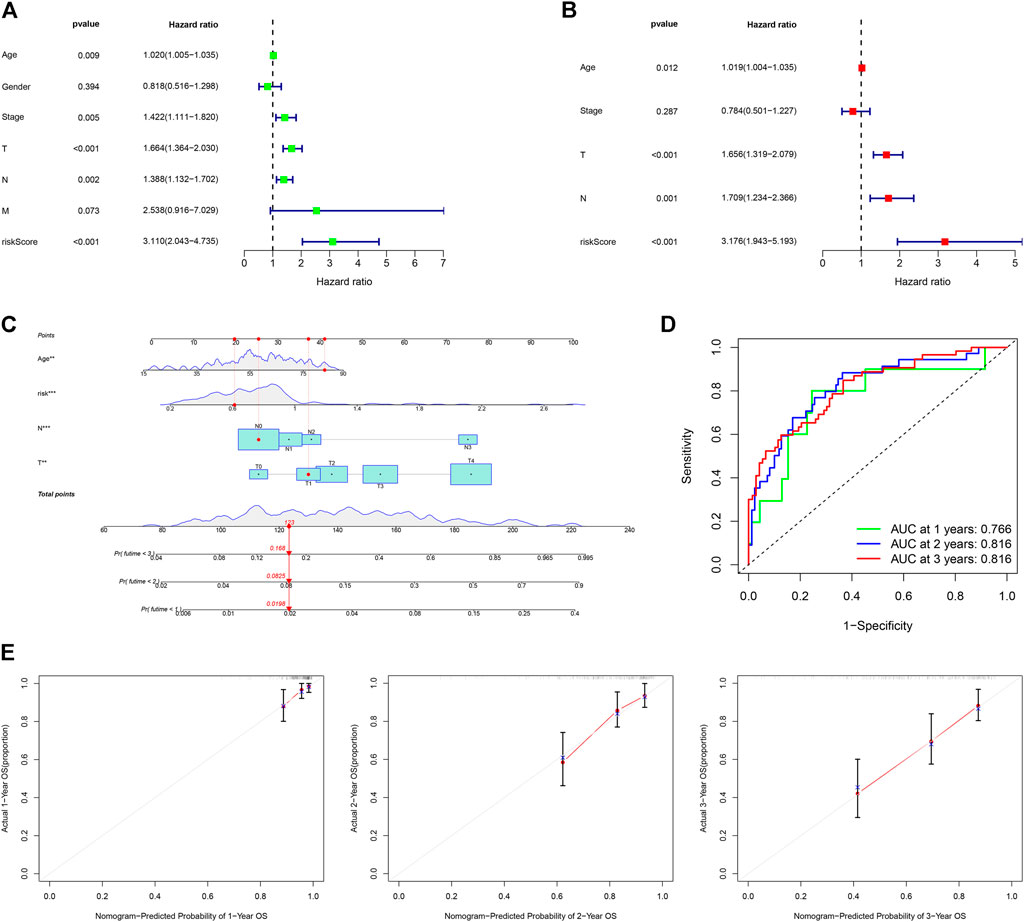
FIGURE 6. Construction and assessment of a nomogram. (A,B) Univariate and multivariate Cox analyses of clinical characteristics to identify independent risk factors for worse OS. (C) A nomogram based on age, T, N stage, and risk scores. (D) ROC curves for 1-, 2- and 3-year OS of CM cases using the nomogram. (E) Calibration ROS curves for 1-, 2- and 3-year OS.
3.7 The potential value of the risk model in clinical application
Among the top 15 signaling pathways, 11 signaling pathways were associated with immunity, such as the T cell receptor signaling (all p < 0.05, FDR <0.05, |NES|>2.3) (Supplementary Figure S3B) (Courtney et al., 2018). The immune heatmap exhibited that CM in the low-risk group had more types of immune cells (Supplementary Figure S3C, Supplementary Data Sheet S2). The levels of CD8+ T, B cell infiltrates, and other types of immune cells were also correlated with lower risk scores (Supplementary Figures S3D). Furthermore, CM in the low-risk group had higher immune scores (Supplementary Figures S3E). Thus, we tried to explore potential immunotherapy-related drugs for these risk groups of CM. As a result, we found that four drugs, such as metformin, had significantly different IC50 between both risk groups of CM (Figure 7A) (O'Sullivan et al., 2019; Cha et al., 2018). A total of five most related small-molecule drugs, ambroxol, tiletamine, mimosine, esculetin, and pizotifen, were identified (all p < 0.05), based on upregulated and downregulated gene expression between the low- and high-risk groups of CM (Supplementary Data Sheet S3) (Gui et al., 2021). Their 2D and 3D structure tomography are is in Figures 7B,C.
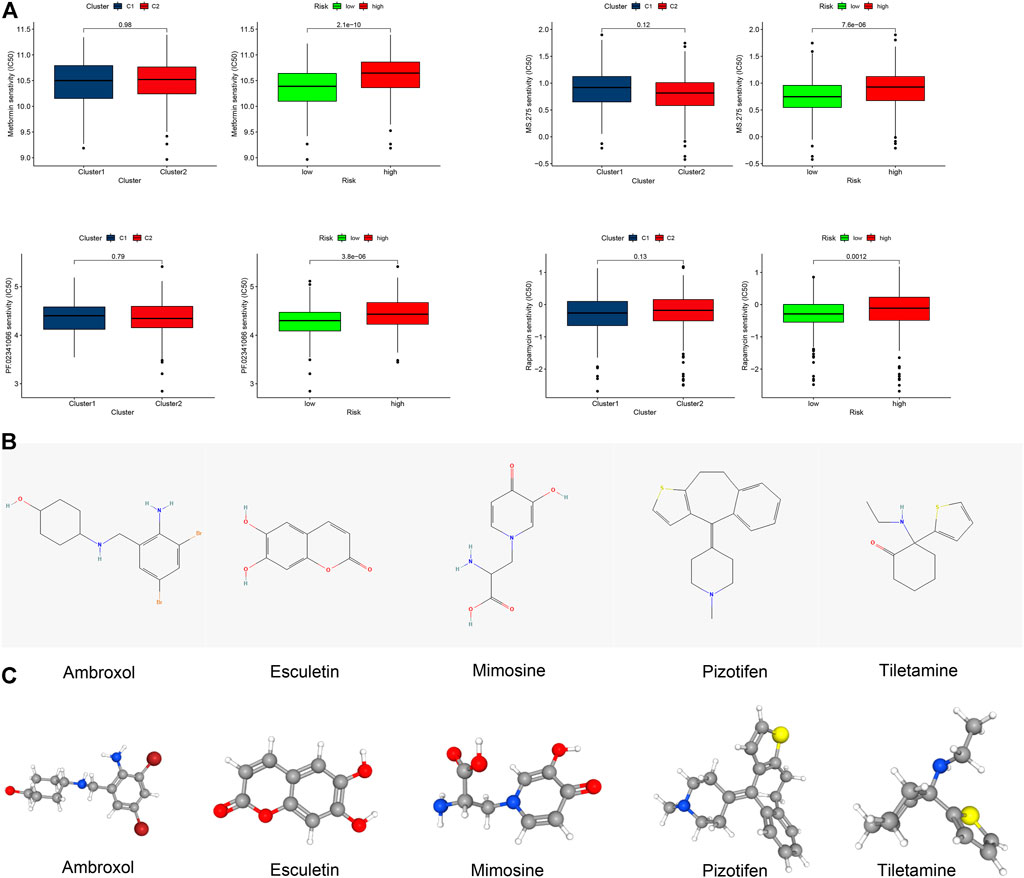
FIGURE 7. Clinical prediction of drug sensitivity in CM cases between two clusters or two risk groups. (A) Four potential drugs solely had significant IC50 differences between these two risk groups. (B,C) 2D structure illustrations and the 3D structure tomography of five candidate small-molecule drugs for CM. A p value of <0.05 was considered to indicate a statistically significant difference.
3.8 Verification of the protein expression of FA metabolism-related genes in normal skin and CM tissue
Finally, we further validated the expression of these key genes in normal skin and CM tissues. Melanoma arises from melanocytes in the epidermal layer of the skin, so we focused on the expression of these proteins in the epidermis. First, we searched the immunohistochemical slide information through the public database on the HPA website and found that the expression of IL4I1 in normal skin epidermis was higher than that in CM tissue, while BBOX1 protein was not detected in normal skin (Figures 8A,B). Next, our own immunohistochemical results showed that the expression of PLA2G2D, ACOXL, and KMO was higher in normal epidermal tissue than in CM tissue; however, the expression of CIDEA was reversed (Figures 8C–F).
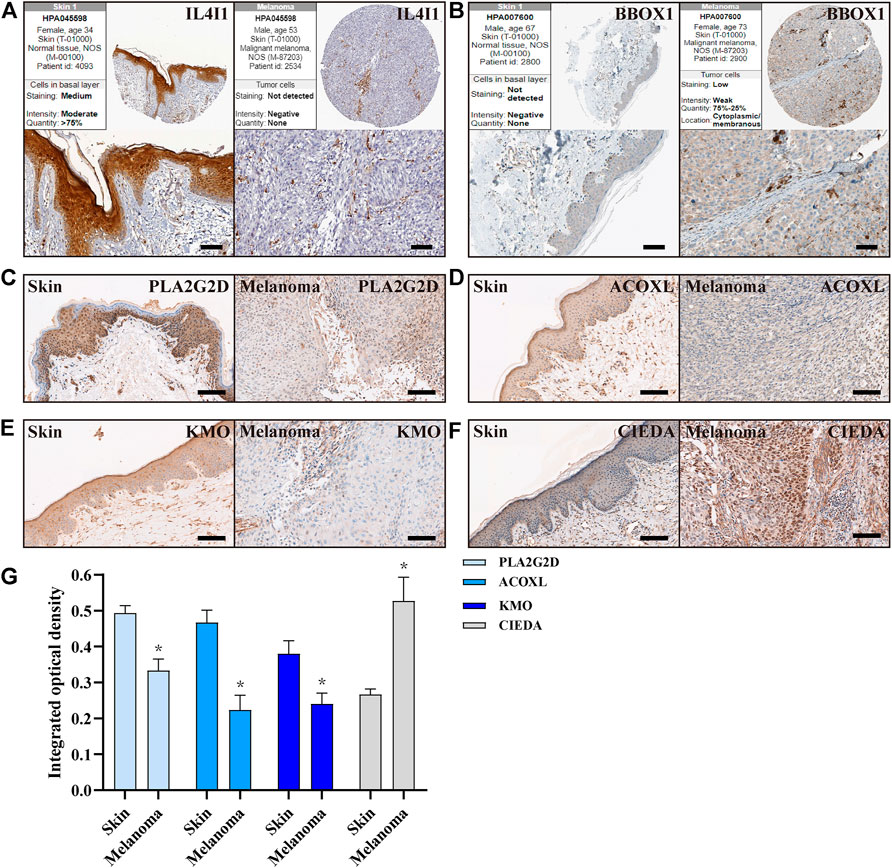
FIGURE 8. Expression of FA metabolism-related genes in normal skin and CM tissues. (A,B) IHC of the IL4I1 and BBOX1 in CM and normal skin tissues from HPA. (C–F) IHC of the PLA2G2D, ACOXL, KMO, and CIDEA in normal skin and CM tissues (n = 3), Scale bar = 100 µm. (G) Quantitative studies of PLA2G2D, ACOXL, KMO, and CIDEA were analyzed by counting the integrated optical density, respectively.
4 Discussion
Currently, immunotherapy has been widely used in CM and achieved a good therapeutic effect in some CM patients. However, the therapeutic response rate of immunotherapies, particularly checkpoint inhibitors for CM patients remains low. It has been demonstrated that hot tumors usually respond to immunotherapies because they contain a lot of CD8+ T cell infiltrates with a higher immune score, high expression of immune checkpoints (e.g., PD-1 and CTLA4), and active inflammatory response. On the other hand, cold tumors generally do not respond well to immunotherapy although switching cold tumors into hot tumors by promoting immune cell infiltration into the tumor environment is feasible (Herrera et al., 2021). Therefore, the discovery of biomarkers to distinguish between cold and hot tumors is particularly important for immunotherapy.
A recent study has reported that tumor cell metabolism is crucial for shaping the tumor microenvironment and its dysregulation is not only associated with the growth of tumors, but also with the therapeutic responses to immunotherapies (O'Sullivan et al., 2019). In addition, cancer cells can undergo metabolic reprogramming to support their survival when carcinogenic signals are blocked (DeBerardinis, 2020). FA, as a kind of important lipid molecule and energy source, is important for the growth of tumors and their therapeutic responses. The accumulation of FAs in the tumor microenvironment can affect the function and phenotype of immune cell infiltrates and FAO is crucial for CM metastasis and immune evasion (Li et al., 2018; Pascual et al., 2021). The accumulated FAs can limit anti-CTLA-4 activity and inhibit tumor-specific and memory T cell infiltration into the tumors (Coutzac et al., 2020). In this study, we screened the FA metabolism-related DEGs in CM and found several DEGs had prognostic values in CM patients. Based on unique DEGs, we stratified CM patients into two clusters. In addition, we found that the frequency of CNV was critical for immune infiltrates in tumors and associated with the immunotherapeutic responses in CM patients, consistent with a previous report (Yang et al., 2021). Further analyses revealed that CM patients in Cluster 2 not only had more immune cell infiltrates (e.g., CD8+ T and B), higher immune infiltration score, and more active immune function (e.g., Inflammatory promotion) but also displayed a higher immune checkpoint activity, such as CTLA4, CD274 (PD-L1), HAVCR2 (TIME3), and LAG3. Hence, the CM patients in cluster 2 had most of the characteristics of a hot tumor and might respond better to immunotherapy.
It is well known that a high TMB is associated with better immunotherapeutic responses in tumor patients. Tumor with a high TMB usually has a higher level of neoantigens, which can promote immune cell infiltration, enhancing the effect of immunotherapy (Maleki Vareki, 2018). We found that the TMB in the cluster 2 CM was significantly higher than that of the cluster 1 and was expected to have better survival. Similarly, CM in cluster 2 displayed higher levels of PD-1 and CTLA4 expression and a lower IC50 for many potential immunotherapeutic agents. Therefore, cluster analysis of the FA metabolism-related genes in CM effectively stratified patients for rational immunotherapy.
To predict patients’ prognoses and explore the clinical application of FA metabolism-related genes in CM, we constructed a risk model using several FA metabolism-related DEGs, and validation revealed that this risk model had excellent sensitivity and specificity in separating CM patients for prognosis of OS in CM patients and their potential systemic therapy. Subsequently, we generated a nomogram using several independent risk factors, such as risk scores, age, tumor N stage, and T stage, and found that this nomogram had good validity and credibility for prognosis of CM patients.
Furthermore, five small-molecule drugs with potential therapeutic value were screened out through Cmap analysis, and they included ambroxol, tiletamine, mimosine, esculetin, and pizotifen. Previous studies have shown that tiletamine has potent cytotoxicity against melanoma cells by promoting ROS production and inducing cell cycle arrest, leading to melanoma cell apoptosis (Kyriakou et al., 2020). A combination of paclitaxel and ambroxol can synergistically kill lung cancer cells (He et al., 2020). Esculetin can inhibit the proliferation of pancreatic cancer cells to modulate their apoptosis by enhancing KEAP1 activity (Arora et al., 2016). Pizotifen has antitumor activity and is commonly used in gastrointestinal cancers. These small-molecule drugs may also have a potential therapeutic effect on CM (Jiang et al., 2020). Therefore, the FA metabolism can not only be used as a liquid biopsy method to quickly and effectively separate the cold from hot tumors to assist in rational immunotherapy but also predict patients’ prognosis and potential treatment drugs.
The DEGs for separating clusters in our study are associated with development and progression of several types of malignancies. ALDH3A1 over-expression can enhance the secretion of PD-L1 in melanoma cells in vitro, and the levels of ALDH3A1 expression are consistently correlated with those of PD-L1 and COX-2 in clinical melanoma and lung cancer samples (Terzuoli et al., 2019). ALOX12B, an immunosuppressive factor, can inhibit immunity and promote tumor progression (Uderhardt et al., 2012; Rooney et al., 2015). BBOX1 inhibitors can restrain the progression of triple-negative breast cancer (Liao et al., 2020). CYP4F3 has been identified as a cancer promoter of lung cancer (Yin et al., 2017). PLA2G2D has been found to have potential as a potential biomarker of adaptive resistance to immune checkpoint inhibitors (Cindy Yang et al., 2021). However, PLA2G2D expression is associated with delayed tumor growth by enhancing anti-tumor immunity in a mouse model of skin cancer (Miki et al., 2013). The IL-1β expression is significantly upregulated in glioblastoma and negatively correlated with the expression levels of KCNJ10, suggesting that KCNJ10 may promote inflammation in the TME (Brandalise et al., 2020). Except for ALDH3A1, the precise roles of other factors we studied in CM remain to be determined. Our findings may provide new insights into the mechanisms underlying the immune regulation of CM.
We recognized that our studies had limitations. First, we only obtained data from TCGA and other public databases, but we did not explore real clinical samples to validate our findings. Second, although several independent data sets were used for validation of our findings, the retrospective study in nature might have potential bias. Therefore, the reliability and values of this model need to be further validated by well-designed prospective, multi-center, large-scale studies. However, our findings may provide a reliable reference for the specific interpretation of metabolic reprogramming in CM. It is worth mentioning that the risk model and nomogram have good clinical prognostic value, and the cluster analysis may help improve the current predicament in predicting immunotherapeutic responses of CM patients. Furthermore, our cluster analyses and model may be valuable for development of new therapeutic strategies for precision medicine and personalized immunotherapy and may contribute to improving the prognoses of CM patients.
5 Conclusion
Our data indicated that the FA metabolism-related DEGs were effective for identification of hot tumors and improving immunotherapeutic responses and prognosis of CM. Exploring the mechanism underlying disordered FA metabolism may help not only for precision medicine but also for developing immunotherapy strategies for CM.
Data availability statement
The original contributions presented in the study are included in the article/Supplementary Material; further inquiries can be directed to the corresponding author.
Ethics statement
The studies involving human participants were reviewed and approved by the Ethics Committee for Clinical Research and Animal Trials of the First Affiliated Hospital of Sun Yat-sen University. The patients/participants provided their written informed consent to participate in this study.
Author contributions
Conceptualization: YD, ZZ, and BT; methodology, analysis, visualization, and writing (original draft preparation): YD, ZZ; writing (review and editing): YD, ZZ, MS, CC, DL, ZX, ZZ, and BT; project administration and funding acquisition: BT. All authors have read and agreed to the published version of the manuscript.
Funding
This work was supported by the grants from the National Natural Science Foundation of China (NO. 81871565 and NO. 82072181) and the Sun Yat-sen University Clinical Research 5010 Program (NO. 2018003).
Conflict of interest
The authors declare that the research was conducted in the absence of any commercial or financial relationships that could be construed as a potential conflict of interest.
Publisher’s note
All claims expressed in this article are solely those of the authors and do not necessarily represent those of their affiliated organizations, or those of the publisher, the editors, and the reviewers. Any product that may be evaluated in this article, or claim that may be made by its manufacturer, is not guaranteed or endorsed by the publisher.
Supplementary material
The Supplementary Material for this article can be found online at: https://www.frontiersin.org/articles/10.3389/fgene.2022.860067/full#supplementary-material
Supplementary Figure S1 | NMF of the external validation cohort and GSEA of clusters in the TCGA cohort. (A,B) All the heatmaps and NMF rank surveys of the external validation cohort. (C) GSEA of cluster 2 CM in the TCGA cohort. (D) GSEA of cluster 1 CM in the TCGA cohort.
Supplementary Figure S2 | Prognosis value of the risk model.
Supplementary Figure S3 | Clinical analyses of risk group CM patients. (A) t-SNE, PCA, and 3D PCA of risk groups. (B) GSEA of the low-risk group. (C) Immune heatmap of risk groups. (D) Correlation between risk scores and immune infiltrates. (E) Comparisons of immune-related scores in risk groups. *p<0.05, **p<0.01, and ***p<0.001. A p value of < 0.05 was considered to indicate a statistically significant difference.
References
Alicea, G. M., Rebecca, V. W., Goldman, A. R., Fane, M. E., Douglass, S. M., Behera, R., et al. (2020). Changes in aged fibroblast lipid metabolism induce age-dependent melanoma cell resistance to targeted therapy via the fatty acid transporter FATP2. Cancer Discov. 10, 1282–1295. doi:10.1158/2159-8290.CD-20-0329
Allais, B. S., Beatson, M., Wang, H., Shahbazi, S., Bijelic, L., Jang, S., et al. (2021). Five-year survival in patients with nodular and superficial spreading melanomas in the US population. J. Am. Acad. Dermatol. 84, 1015–1022. doi:10.1016/j.jaad.2020.11.047
Aloia, A., Mullhaupt, D., Chabbert, C. D., Eberhart, T., Fluckiger-Mangual, S., Vukolic, A., et al. (2019). A fatty acid oxidation-dependent metabolic shift regulates the adaptation of BRAF-mutated melanoma to MAPK inhibitors. Clin. Cancer Res. 25, 6852–6867. doi:10.1158/1078-0432.CCR-19-0253
Amaria, R. N., Menzies, A. M., Burton, E. M., Scolyer, R. A., Tetzlaff, M. T., Antdbacka, R., et al. (2019). Neoadjuvant systemic therapy in melanoma: Recommendations of the international neoadjuvant melanoma consortium. Lancet. Oncol. 20, e378–e389. doi:10.1016/S1470-2045(19)30332-8
Arora, R., Sawney, S., Saini, V., Steffi, C., Tiwari, M., and Saluja, D. (2016). Esculetin induces antiproliferative and apoptotic response in pancreatic cancer cells by directly binding to KEAP1. Mol. Cancer 15, 64. doi:10.1186/s12943-016-0550-2
Brandalise, F., Ratto, D., Leone, R., Olivero, F., Roda, E., Locatelli, C. A., et al. (2020). Deeper and deeper on the role of BK and Kir4.1 channels in glioblastoma invasiveness: A novel summative mechanism? Front. Neurosci. 14, 595664. doi:10.3389/fnins.2020.595664
Bray, F., Ferlay, J., Soerjomataram, I., Siegel, R. L., Torre, L. A., and Jemal, A. (2018). Global cancer statistics 2018: GLOBOCAN estimates of incidence and mortality worldwide for 36 cancers in 185 countries. Ca. Cancer J. Clin. 68, 394–424. doi:10.3322/caac.21492
Cha, J. H., Yang, W. H., Xia, W., Wei, Y., Chan, L. C., Lim, S. O., et al. (2018). Metformin promotes antitumor immunity via endoplasmic-reticulum-associated degradation of PD-L1. Mol. Cell 71, 606–620. e607. doi:10.1016/j.molcel.2018.07.030
Chan, T. A., Yarchoan, M., Jaffee, E., Swanton, C., Quezada, S. A., Stenzinger, A., et al. (2019). Development of tumor mutation burden as an immunotherapy biomarker: Utility for the oncology clinic. Ann. Oncol. 30, 44–56. doi:10.1093/annonc/mdy495
Charoentong, P., Finotello, F., Angelova, M., Mayer, C., Efremova, M., Rieder, D., et al. (2017). Pan-cancer immunogenomic analyses reveal genotype-immunophenotype relationships and predictors of response to checkpoint blockade. Cell Rep. 18, 248–262. doi:10.1016/j.celrep.2016.12.019
Chow, M. T., and Luster, A. D. (2014). Chemokines in cancer. Cancer Immunol. Res. 2, 1125–1131. doi:10.1158/2326-6066.CIR-14-0160
Cindy Yang, S. Y., Lien, S. C., Wang, B. X., Clouthier, D. L., Hanna, Y., Cirlan, I., et al. (2021). Pan-cancer analysis of longitudinal metastatic tumors reveals genomic alterations and immune landscape dynamics associated with pembrolizumab sensitivity. Nat. Commun. 12, 5137. doi:10.1038/s41467-021-25432-7
Courtney, A. H., Lo, W. L., and Weiss, A. (2018). TCR signaling: Mechanisms of initiation and propagation. Trends biochem. Sci. 43, 108–123. doi:10.1016/j.tibs.2017.11.008
Coutzac, C., Jouniaux, J. M., Paci, A., Schmidt, J., Mallardo, D., Seck, A., et al. (2020). Systemic short chain fatty acids limit antitumor effect of CTLA-4 blockade in hosts with cancer. Nat. Commun. 11, 2168. doi:10.1038/s41467-020-16079-x
DeBerardinis, R. J. (2020). Tumor microenvironment, metabolism, and immunotherapy. N. Engl. J. Med. 382, 869–871. doi:10.1056/NEJMcibr1914890
Deng, Z. M., Hu, W., Dai, F. F., Yuan, M. Q., Hu, M., and Cheng, Y. X. (2021). Immune-related genes to construct a novel prognostic model of breast cancer: A chemosensitivity-based study. Front. Immunol. 12, 734745. doi:10.3389/fimmu.2021.734745
Eggermont, A. M. M., Blank, C. U., Mandala, M., Long, G. V., Atkinson, V. G., Dalle, S., et al. (2021). Adjuvant pembrolizumab versus placebo in resected stage III melanoma (EORTC 1325-MG/KEYNOTE-054): Distant metastasis-free survival results from a double-blind, randomised, controlled, phase 3 trial. Lancet. Oncol. 22, 643–654. doi:10.1016/S1470-2045(21)00065-6
Galon, J., and Bruni, D. (2019). Approaches to treat immune hot, altered and cold tumours with combination immunotherapies. Nat. Rev. Drug Discov. 18, 197–218. doi:10.1038/s41573-018-0007-y
Gershenwald, J. E., Scolyer, R. A., Hess, K. R., Sondak, V. K., Long, G. V., Ross, M. I., et al. (2017). Melanoma staging: Evidence-based changes in the American Joint Committee on Cancer eighth edition cancer staging manual. Ca. Cancer J. Clin. 67, 472–492. doi:10.3322/caac.21409
Gui, C. P., Wei, J. H., Chen, Y. H., Fu, L. M., Tang, Y. M., Cao, J. Z., et al. (2021). A new thinking: Extended application of genomic selection to screen multiomics data for development of novel hypoxia-immune biomarkers and target therapy of clear cell renal cell carcinoma. Brief. Bioinform. 22, bbab173. doi:10.1093/bib/bbab173
Haikala, H. M., Anttila, J. M., Marques, E., Raatikainen, T., Ilander, M., Hakanen, H., et al. (2019). Pharmacological reactivation of MYC-dependent apoptosis induces susceptibility to anti-PD-1 immunotherapy. Nat. Commun. 10, 620. doi:10.1038/s41467-019-08541-2
Hamid, O., Robert, C., Daud, A., Hodi, F. S., Hwu, W. J., Kefford, R., et al. (2019). Five-year survival outcomes for patients with advanced melanoma treated with pembrolizumab in KEYNOTE-001. Ann. Oncol. 30, 582–588. doi:10.1093/annonc/mdz011
He, W., Xiao, W., Zhang, X., Sun, Y., Chen, Y., Chen, Q., et al. (2020). Pulmonary-affinity paclitaxel polymer micelles in response to biological functions of ambroxol enhance therapeutic effect on lung cancer. Int. J. Nanomedicine 15, 779–793. doi:10.2147/IJN.S229576
Herrera, F. G., Ronet, C., Ochoa de Olza, M., Barras, D., Crespo, I., Andreatta, M., et al. (2021). Low dose radiotherapy reverses tumor immune desertification and resistance to immunotherapy. Cancer Discov. 12, 108–133. doi:10.1158/2159-8290.CD-21-0003
Ji, S., Li, J., Duan, X., Zhang, J., Zhang, Y., Song, M., et al. (2021). Targeted enrichment of enzyme-instructed assemblies in cancer cell lysosomes turns immunologically cold tumors hot. Angew. Chem. Int. Ed. Engl. 60, 26994–27004. doi:10.1002/anie.202110512
Jiang, Y., Wang, W., Wu, X., and Shi, J. (2020). Pizotifen inhibits the proliferation and invasion of gastric cancer cells. Exp. Ther. Med. 19, 817–824. doi:10.3892/etm.2019.8308
Kang, K., Xie, F., Mao, J., Bai, Y., and Wang, X. (2020). Significance of tumor mutation burden in immune infiltration and prognosis in cutaneous melanoma. Front. Oncol. 10, 573141. doi:10.3389/fonc.2020.573141
Kleemann, J., Hrgovic, I., Ter-Nedden, J., Kleimann, P., Steinhorst, K., Harle, K., et al. (2018). Fatty acid receptor GPR120: A novel marker for human melanoma. Melanoma Res. 28, 271–276. doi:10.1097/CMR.0000000000000445
Koboldt, D. C., Zhang, Q., Larson, D. E., Shen, D., McLellan, M. D., Lin, L., et al. (2012). VarScan 2: Somatic mutation and copy number alteration discovery in cancer by exome sequencing. Genome Res. 22, 568–576. doi:10.1101/gr.129684.111
Kyriakou, S., Mitsiogianni, M., Mantso, T., Cheung, W., Todryk, S., Veuger, S., et al. (2020). Anticancer activity of a novel methylated analogue of L-mimosine against an in vitro model of human malignant melanoma. Invest. New Drugs 38, 621–633. doi:10.1007/s10637-019-00809-0
Li, J., Fang, Y., Zhang, Y., Wang, H., Yang, Z., and Ding, D. (2021). Supramolecular self-assembly-facilitated aggregation of tumor-specific transmembrane receptors for signaling activation and converting immunologically cold to hot tumors. Adv. Mat. 33, e2008518. doi:10.1002/adma.202008518
Li, X. X., Wang, Z. J., Zheng, Y., Guan, Y. F., Yang, P. B., Chen, X., et al. (2018). Nuclear receptor Nur77 facilitates melanoma cell survival under metabolic stress by protecting fatty acid oxidation. Mol. Cell 69, 480–492. doi:10.1016/j.molcel.2018.01.001
Liao, C., Zhang, Y., Fan, C., Herring, L. E., Liu, J., Locasale, J. W., et al. (2020). Identification of BBOX1 as a therapeutic target in triple-negative breast cancer. Cancer Discov. 10, 1706–1721. doi:10.1158/2159-8290.CD-20-0288
Long, J., Wang, D., Wang, A., Chen, P., Lin, Y., Bian, J., et al. (2022). A mutation-based gene set predicts survival benefit after immunotherapy across multiple cancers and reveals the immune response landscape. Genome Med. 14, 20. doi:10.1186/s13073-022-01024-y
Lopez de Rodas, M., and Schalper, K. A. (2021). Tumour antigen-induced T cell exhaustion - the archenemy of immune-hot malignancies. Nat. Rev. Clin. Oncol. 18, 749–750. doi:10.1038/s41571-021-00562-5
Mahoney, K. M., Rennert, P. D., and Freeman, G. J. (2015). Combination cancer immunotherapy and new immunomodulatory targets. Nat. Rev. Drug Discov. 14, 561–584. doi:10.1038/nrd4591
Maleki Vareki, S. (2018). High and low mutational burden tumors versus immunologically hot and cold tumors and response to immune checkpoint inhibitors. J. Immunother. Cancer 6, 157. doi:10.1186/s40425-018-0479-7
Miki, Y., Yamamoto, K., Taketomi, Y., Sato, H., Shimo, K., Kobayashi, T., et al. (2013). Lymphoid tissue phospholipase A2 group IID resolves contact hypersensitivity by driving antiinflammatory lipid mediators. J. Exp. Med. 210, 1217–1234. doi:10.1084/jem.20121887
O'Sullivan, D., Sanin, D. E., Pearce, E. J., and Pearce, E. L. (2019). Metabolic interventions in the immune response to cancer. Nat. Rev. Immunol. 19, 324–335. doi:10.1038/s41577-019-0140-9
Ochoa de Olza, M., Navarro Rodrigo, B., Zimmermann, S., and Coukos, G. (2020). Turning up the heat on non-immunoreactive tumours: Opportunities for clinical development. Lancet. Oncol. 21, e419–e430. doi:10.1016/S1470-2045(20)30234-5
Oh, D. Y., Talukdar, S., Bae, E. J., Imamura, T., Morinaga, H., Fan, W., et al. (2010). GPR120 is an omega-3 fatty acid receptor mediating potent anti-inflammatory and insulin-sensitizing effects. Cell 142, 687–698. doi:10.1016/j.cell.2010.07.041
Pascual, G., Dominguez, D., Elosua-Bayes, M., Beckedorff, F., Laudanna, C., Bigas, C., et al. (2021). Dietary palmitic acid promotes a prometastatic memory via Schwann cells. Nature 599, 485–490. doi:10.1038/s41586-021-04075-0
Rooney, M. S., Shukla, S. A., Wu, C. J., Getz, G., and Hacohen, N. (2015). Molecular and genetic properties of tumors associated with local immune cytolytic activity. Cell 160, 48–61. doi:10.1016/j.cell.2014.12.033
Salmon, H., Remark, R., Gnjatic, S., and Merad, M. (2019). Host tissue determinants of tumour immunity. Nat. Rev. Cancer 19, 215–227. doi:10.1038/s41568-019-0125-9
Schadendorf, D., van Akkooi, A. C. J., Berking, C., Griewank, K. G., Gutzmer, R., Hauschild, A., et al. (2018). Melanoma. Lancet 392, 971–984. doi:10.1016/S0140-6736(18)31559-9
Snyder, A., Makarov, V., Merghoub, T., Yuan, J., Zaretsky, J. M., Desrichard, A., et al. (2014). Genetic basis for clinical response to CTLA-4 blockade in melanoma. N. Engl. J. Med. 371, 2189–2199. doi:10.1056/NEJMoa1406498
Song, Y., Yin, W., Dan, Y., Sheng, J., Zeng, Y., and He, R. (2019). Chemerin partly mediates tumor-inhibitory effect of all-trans retinoic acid via CMKLR1-dependent natural killer cell recruitment. Immunology 157, 248–256. doi:10.1111/imm.13065
Stupnikov, A., McInerney, C. E., Savage, K. I., McIntosh, S. A., Emmert-Streib, F., Kennedy, R., et al. (2021). Robustness of differential gene expression analysis of RNA-seq. Comput. Struct. Biotechnol. J. 19, 3470–3481. doi:10.1016/j.csbj.2021.05.040
Tang, R., Xu, J., Zhang, B., Liu, J., Liang, C., Hua, J., et al. (2020). Ferroptosis, necroptosis, and pyroptosis in anticancer immunity. J. Hematol. Oncol. 13, 110. doi:10.1186/s13045-020-00946-7
Taniguchi, K., and Karin, M. (2018). NF-κB, inflammation, immunity and cancer: Coming of age. Nat. Rev. Immunol. 18, 309–324. doi:10.1038/nri.2017.142
Terzuoli, E., Bellan, C., Aversa, S., Ciccone, V., Morbidelli, L., Giachetti, A., et al. (2019). ALDH3A1 overexpression in melanoma and lung tumors drives cancer stem cell expansion, impairing immune surveillance through enhanced PD-L1 output. Cancers (Basel) 11, E1963. doi:10.3390/cancers11121963
Thul, P. J., and Lindskog, C. (2018). The human protein atlas: A spatial map of the human proteome. Protein Sci. 27, 233–244. doi:10.1002/pro.3307
Too, N. S. H., Ho, N. C. W., Adine, C., Iyer, N. G., and Fong, E. L. S. (2021). Hot or cold: Bioengineering immune contextures into in vitro patient-derived tumor models. Adv. Drug Deliv. Rev. 175, 113791. doi:10.1016/j.addr.2021.05.001
Uderhardt, S., Herrmann, M., Oskolkova, O. V., Aschermann, S., Bicker, W., Ipseiz, N., et al. (2012). 12/15-lipoxygenase orchestrates the clearance of apoptotic cells and maintains immunologic tolerance. Immunity 36, 834–846. doi:10.1016/j.immuni.2012.03.010
Yang, X., Hu, Y., Yang, K., Wang, D., Lin, J., Long, J., et al. (2021). Cell-free DNA copy number variations predict efficacy of immune checkpoint inhibitor-based therapy in hepatobiliary cancers. J. Immunother. Cancer 9, e001942. doi:10.1136/jitc-2020-001942
Yin, J., Liu, H., Liu, Z., Owzar, K., Han, Y., Su, L., et al. (2017). Pathway-analysis of published genome-wide association studies of lung cancer: A potential role for the CYP4F3 locus. Mol. Carcinog. 56, 1663–1672. doi:10.1002/mc.22622
Zhao, F., Xiao, C., Evans, K. S., Theivanthiran, T., DeVito, N., Holtzhausen, A., et al. (2018). Paracrine wnt5a-beta-catenin signaling triggers a metabolic Program that drives dendritic cell tolerization. Immunity 48, 147–160. e147. doi:10.1016/j.immuni.2017.12.004
Zheng, Y., Tian, H., Zhou, Z., Xiao, C., Liu, H., Liu, Y., et al. (2021). A novel immune-related prognostic model for response to immunotherapy and survival in patients with lung adenocarcinoma. Front. Cell Dev. Biol. 9, 651406. doi:10.3389/fcell.2021.651406
Keywords: cutaneous melanoma, hot tumors, immunotherapy, precision medicine, fatty acid metabolism
Citation: Dong Y, Zhao Z, Simayi M, Chen C, Xu Z, Lv D and Tang B (2022) Transcriptome profiles of fatty acid metabolism-related genes and immune infiltrates identify hot tumors for immunotherapy in cutaneous melanoma. Front. Genet. 13:860067. doi: 10.3389/fgene.2022.860067
Received: 22 January 2022; Accepted: 30 August 2022;
Published: 19 September 2022.
Edited by:
Apeng Chen, Lanzhou Veterinary Research Institute (CAAS), ChinaReviewed by:
Harpreet Kaur, National Institutes of Health (NIH), United StatesLu Zhang, Henan University, China
Copyright © 2022 Dong, Zhao, Simayi, Chen, Xu, Lv and Tang. This is an open-access article distributed under the terms of the Creative Commons Attribution License (CC BY). The use, distribution or reproduction in other forums is permitted, provided the original author(s) and the copyright owner(s) are credited and that the original publication in this journal is cited, in accordance with accepted academic practice. No use, distribution or reproduction is permitted which does not comply with these terms.
*Correspondence: Bing Tang, tangbing@mail.sysu.edu.cn
†These authors have contributed equally to this work