 Pavel Dvorak
 Vojtech Hanicinec2†
 Pavel Soucek
- 1Department of Biology, Faculty of Medicine in Pilsen, Charles University, Pilsen, Czechia
- 2Biomedical Center, Faculty of Medicine in Pilsen, Charles University, Pilsen, Czechia
- 3Institute of Medical Genetics, University Hospital Pilsen, Pilsen, Czechia
- 4Toxicogenomics Unit, National Institute of Public Health, Prague, Czechia
The evidence that introns can influence different levels of transfer of genetic information between DNA and the final product is increasing. Longer first introns were found to be a general property of eukaryotic gene structure and shown to contain a higher fraction of conserved sequence and different functional elements. Our work brings more precise information about the position of the longest introns in human protein-coding genes and possible connection with biological function and gene expression. According to our results, the position of the longest intron can be localized to the first third of introns in 64%, the second third in 19%, and the third in 17%, with notable peaks at the middle and last introns of approximately 5% and 6%, respectively. The median lengths of the longest introns decrease with increasing distance from the start of the gene from approximately 15,000 to 5,000 bp. We have shown that the position of the longest intron is in some cases linked to the biological function of the given gene. For example, DNA repair genes have the longest intron more often in the second or third. In the distribution of gene expression according to the position of the longest intron, tissue-specific profiles can be traced with the highest expression usually at the absolute positions of intron 1 and 2. In this work, we present arguments supporting the hypothesis that the position of the longest intron in a gene is another biological factor modulating the transmission of genetic information. The position of the longest intron is related to biological functions in some human genes.
Introduction
The exon-intron architecture of genes constitutes one of the basic characteristics of the eukaryotic domain of life. While the function of exons as regions coding for the consequence of amino acids in polypeptide strings is defined clearly, the importance of introns has been a matter of research for many years and the repertoire of their functions has been unraveled gradually. We now have evidence that introns can influence different levels of transfer of genetic information between DNA and the final product (Chorev and Carmel, 2012). In the case of proteins, this may be mediated, for example, by the presence of transcription enhancers and silencers or by the still not fully elucidated mechanism of intron-mediated enhancement (IME) (Nott et al., 2003; Hube and Francastel, 2015; Zalabak and Ikeda, 2020).
Longer first introns were found to be a general property of eukaryotic gene structure (Bradnam and Korf, 2008; Zhu et al., 2009). Significantly longer introns were detected in 5′ untranslated regions of genes in comparison with coding regions and 3′ untranslated regions, and a sharp drop in intron size at the boundary between 5′ untranslated regions and coding regions was reported (Chung et al., 2006; Hong et al., 2006). The long first introns were shown to contain a higher fraction of conserved sequence and different functional elements such as CpG islands, chromatin marks (e.g., H3K4me1) (Jo and Choi, 2019) and transcription key motifs (e.g., TATA box) (Li et al., 2012) in vertebrates and several other species including Drosophila and Arabidopsis (Marais et al., 2005; Gaffney and Keightley, 2006; Vinogradov, 2006; Rose et al., 2008; Park et al., 2014; Rose, 2019).
Our work develops this area of research in a further direction. The main questions we asked at the outset that were not answered in the literature included the following. In what percentage of human genes is the first intron the longest of all introns and in what percentage are the longest introns at additional positions? What is the distribution of absolute versus relative positions of the longest introns in human genes? What are the median lengths of the longest introns depending on the different position in the gene? Is the absolute or relative position of the longest intron related to the biological function or expression of the given gene? We addressed the answers to these questions in the current article.
Materials and methods
A set of studied human genes
The list of all human gene families and their members was downloaded from the HGNC database (HUGO Gene Nomenclature Committee; https://www.genenames.org/; accessed 1/10/2020). One gene was selected from each protein-coding gene family. This was usually the gene placed first in the list. In case the same gene was listed first in multiple gene families, one of the following representatives was selected. The resulting gene selection (Study dataset) contained 1,427 unique genes representing all human protein-coding families. The lengths of all exons and introns of the major isoforms, with transcript Flags MANE Select v0.95 and Ensembl Canonical, of these selected genes were obtained from the Ensembl database (https://www.ensembl.org/index.html; Ensembl release 104). Transcript flags help to identify the most conserved, high-quality and biologically relevant transcripts as representatives of the studied genes (https://www.ensembl.org/info/genome/genebuild/transcript_quality_tags.html) (Morales et al., 2022). The Study dataset is disclosed in Supplementary Table S1.
Functional enrichment analysis
g:Profiler web server (https://biit.cs.ut.ee/gprofiler; version e105_eg52_p16_e84549f) (Raudvere et al., 2019) was employed to perform functional enrichment analysis, also known as gene set enrichment analysis (GSEA). The g:GOSt tool performed statistical enrichment analysis to find over-representation of information from Gene Ontology (GO) terms, biological pathways, regulatory DNA elements, human disease gene annotations, and protein-protein interaction networks. g:SCS method was the default method for computing multiple testing correction for p-values gained from GO and pathway enrichment analysis. Input data for GSEA analysis can be seen in Supplementary Table S2. This web application was chosen primarily for the reason that it enables a very clear comparison of significantly overrepresented terms between several different lists of genes.
Apoptosis and DNA repair gene sets
Additional sets of genes defined by the terms cell death/apoptosis (146 genes) and DNA repair (113) were obtained from the Reactome database (https://reactome.org/; version 79) using the Harmonizome tool (Integrated Knowledge About Genes & Proteins; https://maayanlab.cloud/Harmonizome/), in order to independently verify the results of functional enrichment analysis. These two sets of genes are listed in Supplementary Tables S3, S4, including the characteristics and lengths of all exons and introns.
Human gene expression data
RNA consensus tissue gene data were taken from The Human Protein Atlas database (https://www.proteinatlas.org/; version 21.0). The file downloaded contained consensus transcript expression levels summarized per gene in 55 tissues based on transcriptomics data from HPA (HPA RNA-seq data; https://www.proteinatlas.org/about/assays+annotation#hpa_rna) and GTEx (GTEx RNA-seq data; https://www.proteinatlas.org/about/assays+annotation#gtex_rna). The consensus normalized expression ("nTPM”) value was calculated as the maximum nTPM value for each gene in the two data sources. A set of 422 human genes with nTPM values together with all exon and intron lengths is provided in Supplementary Table S5.
Statistics
PAST software (PAleontological Statistics, version 4.09, https://www.nhm.uio.no/english/research/resources/past/) was used to evaluate the data using basic statistical methods for comparison of several univariate groups (e.g. the Kruskal-Wallis and Mann-Whitney pairwise tests). The usual threshold for statistical significance (p < .05) was accepted. For testing 2 × 2 contingency tables with Fisher’s exact test, which was performed when comparing the Study dataset and the two above-mentioned additional datasets, a freely available calculator from GraphPad (https://www.graphpad.com/quickcalcs/contingency1/) was used.
Results
The median number of introns in our human protein-coding gene set is 9
1,427 human genes representing all protein-coding gene groups defined in the HGNC database were included in our study dataset. Approximately 2.3% of genes had no introns. The most frequent numbers of introns in a gene were 4 (6.2%), 1 (6%), 2 (5.8%) and 3 (5.6%) introns. The mean and median number of introns in a gene were 12.6 and 9, respectively (Supplementary Figure S1A). The SYNE1 (spectrin repeat containing nuclear envelope protein 1) gene had the largest number of introns (145). These values of intron numbers do not follow a normal distribution and an excess of genes with fewer introns can be observed (p = 2.1E-42, Shapiro-Wilk test, Supplementary Figure S1B).
64% of human genes have the longest intron located in the first third of introns, 19% in the second third, and 17% in the third third
So that the result of the following statistical analysis is not distorted by genes with a small number of introns, we included only genes with three or more introns (N = 1,226). The most frequent absolute positions at which the longest intron is found were Intron 1—I1 (42.3%), I2 (16.8), I3 (9.7), I4 (5.6) and I5 (5.4). The longest intron was in absolute position greater than I5 in the remaining 20.1% of genes, with decreasing percentage representation in individual increasing absolute positions (Figure 1A). We defined the relative position as the ratio of the position of the longest intron to the number of all introns in a given gene. Based on the relative positions, the longest intron was located in the first third of introns, i.e. in the interval (0;0.33], in 64% of genes, in the second third in 19.2% and in the third third in 16.8%. The longest intron was in the middle of the gene, i.e. relative position .5, in 5.3% and the longest last intron had 5.9% of genes (Figure 1B).
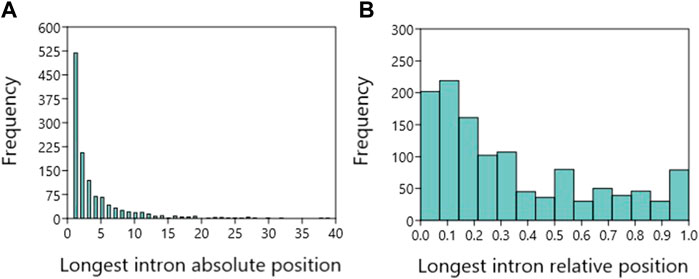
FIGURE 1. Longest intron positions in human protein coding genes with at least three introns. (A). The frequency of the longest intron absolute positions. (B). The frequency of the longest intron relative positions.
The median length of the longest introns decreases with increasing distance from the start of the gene
The median intron length for genes that have only 1 intron (N = 85) was 3,085 bp. For genes that have two introns, the median length of the longer intron at position I1 was 4,937 bp (N = 48) and at position I2 was 4,691 bp (N = 35), the difference not significant.
Again, the following part of this analysis only applies to genes with three or more introns. The median lengths of the longest introns located in the first five absolute positions were 15,324, 11,958, 9,192, 7,241 and 6,442 bp (Figure 2A). Only the median in position I1 is significantly higher against the other medians, p values are from .02 (vs. I2) to .00007 (vs. I4, Mann-Whitney pairwise test). The median lengths of the longest introns located according to their relative position were 14,404 (in the first third), 6,204 (in the second third), 5,645 (in the third), 5,910 (in the middle) and 4,866 bp (last intron, Figure 2B). Similarly, only the median of the longest introns in the first third of the gene is significantly higher than in the other cases (p < .00001).
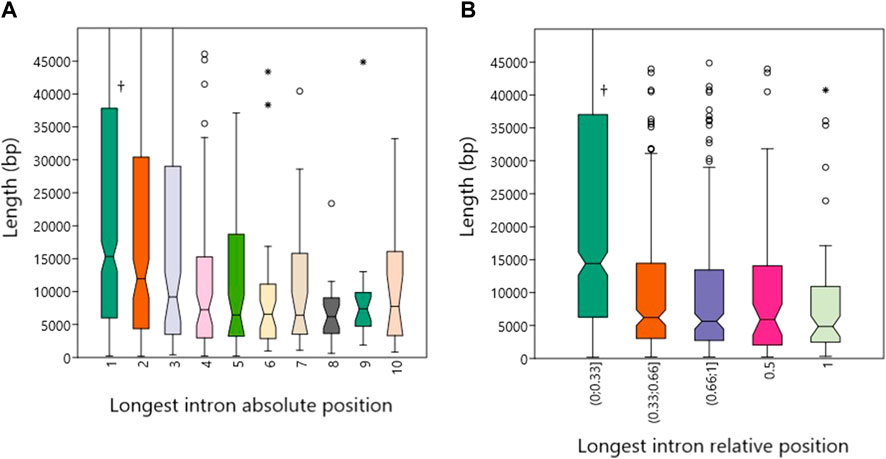
FIGURE 2. Lengths of the longest introns in human protein-coding genes in relation to their positions. (A). Length dependence on the absolute position of the longest introns. (B). Dependence of length on relative position. Daggers indicate statistically significant differences.
The position of the longest intron is related to certain gene biological functions
The results of the GSEA analysis showed that among genes without introns and with one intron there is a significantly higher representation of the biological processes G protein-coupled receptor signaling pathway (p < .00001) and sensory perception of chemical stimulus (p < .001). Genes with one intron are additionally enriched with representatives of the biological processes positive regulation of cytosolic calcium ion concentration, nervous system process and locomotion (p < .00001 for all). For genes with two introns, we did not detect a specifically higher representation of any biological process.
Genes with three or more introns, which have the longest intron located at the absolute position I1 or I2, interfere significantly in a large number of basic biological processes at the level of the cell as well as the development of a multicellular organism. For genes with the longest intron at I2, statistical significance was specifically increased in the process of programmed cell death (p < .00001, Table 1). These were, for example, the BAD (BCL2 Associated Agonist Of Cell Death), BAG6 (BAG Cochaperone 6) or DEDD (Death Effector Domain Containing) genes. The other tested absolute positions (I3-I9) did not show a specific association with any biological process. Genes with the relative position of the longest intron in the first third showed enrichment for a wide range of biological processes, similar to the absolute positions I1 and I2. The relative position in the second third was significantly associated with the term reproductive process (p < .001) and in the third with the terms DNA repair (p < .0001), mitotic recombination and telomere maintenance (both p < .001). Examples of genes associated with the reproductive process in our case are CFTR (CF Transmembrane Conductance Regulator), NDC80 (NDC80 Kinetochore Complex Component) and PANX1 (Pannexin 1). Among the genes included under DNA repair were a number of key genes such as APEX1 (Apurinic/Apyrimidinic Endodeoxyribonuclease 1), BRCC3 (BRCA1/BRCA2-Containing Complex Subunit 3), ERCC1 (ERCC Excision Repair 1, Endonuclease Non-Catalytic Subunit), MLH1 (MutL Homolog 1), MRE11 (MRE11 Homolog, Double Strand Break Repair Nuclease), SMC6 (Structural Maintenance Of Chromosomes 6) or XPA (XPA, DNA Damage Recognition And Repair Factor).
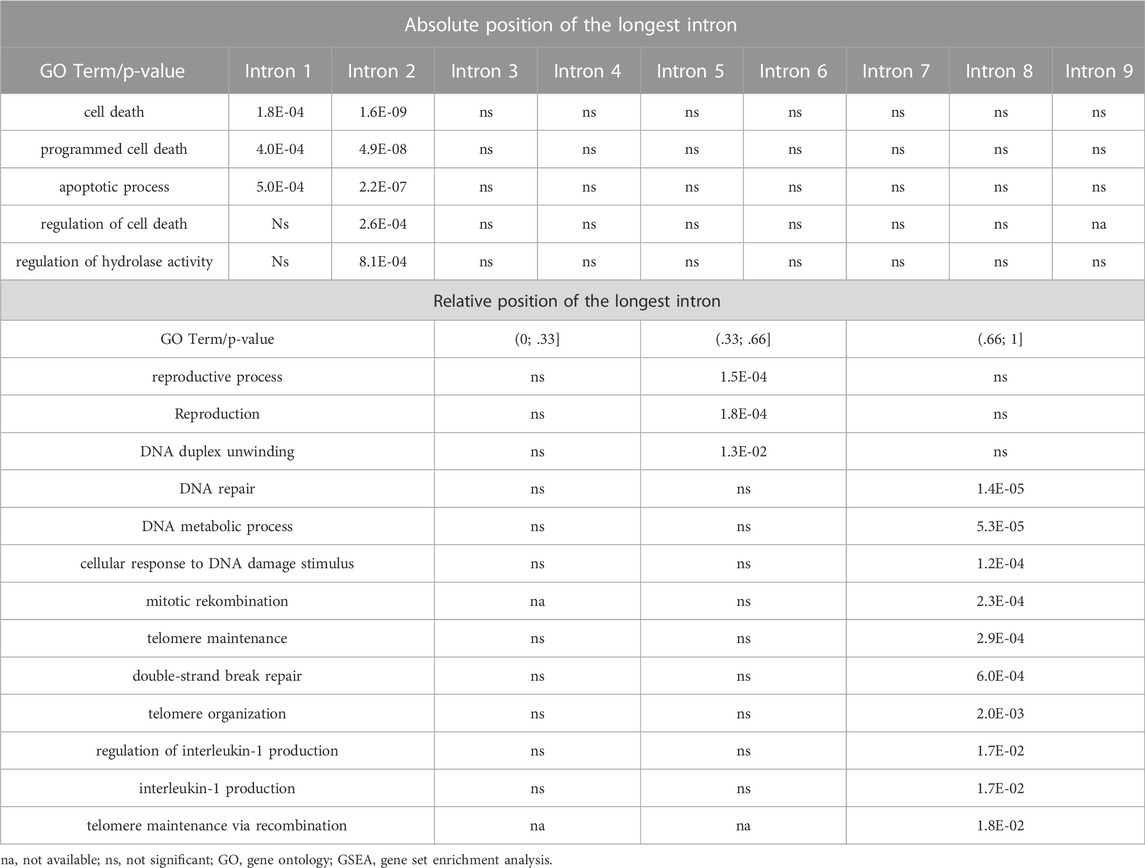
TABLE 1. Significant relationships between the position of the longest intron and gene biological functions based on GSEA.
A higher percentage of DNA repair genes have the longest intron located in the second or third third
The location of the longest introns was monitored for two other gene sets obtained independently of the Study dataset from the Reactome Pathways database. These were Apoptosis (N = 146) and DNA repair (N = 113) gene sets. While the percentage representation of individual categories of absolute and relative positions in Apoptosis did not differ significantly from the Study dataset, we noted statistically significant deviations in DNA repair. Compared to the Study dataset, among DNA repair genes there is a significantly smaller percentage of genes that have the longest intron at position I1 (absolute position) or in the first third (relative position), p < .0001 for both categories. On the contrary, they contain a higher percentage of genes with the longest intron at a position higher than or equal to I5 (p < .0001) or in the second and third thirds (p < .01 for both; Table 2).
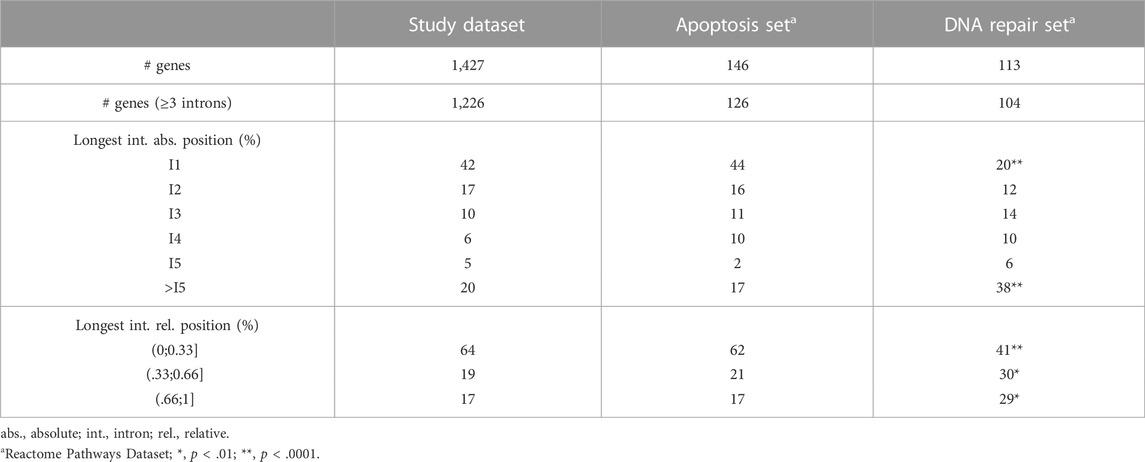
TABLE 2. Representation of the absolute and relative positions of the longest introns in the Study dataset and two additional gene sets.
The highest expression was associated with absolute positions I1 and I2
Analysis mapping the relationship of the absolute and relative position of the longest intron and gene expression was made on a subgroup of 422 genes randomly selected from the Study Dataset. This random selection contained 10 genes without introns (2.4%), 46 genes with one or two introns (10.9%) and 366 genes with an intron number equal or greater than three, which were further tested, as in previous analyzes. The intron data in these genes were linked to expression values determined in 55 human tissues.
The most frequent difference in expression meeting statistical significance was between these groups of absolute positions of the longest intron: I1 higher than I3 (in 12 tissues), I2 higher than I4 (12 tissues), and I2 higher than >I5 (11 tissues; all p < .05, Mann-Whitney pairwise test). In general, it can be stated that in most tissues the highest expression was associated with absolute positions I1 and I2. Furthermore, we noted that organ systems could be distinguished based on their own characteristic expression profile (Supplementary Figure S2). A trend towards identical expression in related tissues was also observable when comparing the relative positions of the longest introns (e.g. the highest average expression in the interval (.33;0.66] for CNS tissues; Supplementary Figure S3), however, there was a minimum of relationships meeting statistical significance.
Discussion
The main interest of our work was to bring more precise and so far unpublished information about the position of the longest introns in human genes and possible connection of the position of the longest intron with biological function or gene expression. Our results confirm the previous information that the longest intron is most often the first intron (Duret, 2001; Bradnam and Korf, 2008; Li et al., 2012), more specifically in 42.3% of human genes having at least three introns. However, as our analyzes show, most human genes do not have the longest first intron. Taking a closer look at not only the absolute but also the relative positions of the longest introns, we see a significant number of genes that have the longest intron in the middle or at the end of the gene, which indicates the possible functional significance of this phenomenon.
Hube and Francastel (2015) reported that in general the median length of introns in human protein-coding genes is 1,520 bp, Piovesan et al. (2019) calculated this value to be 1747 bp. The mention that the first introns tend to be the longest in eukaryotic organisms, or that they are twice as long as other introns, can be found in many works (Duret, 2001; Bradnam and Korf, 2008; Marais et al., 2005; Hong et al., 2006). Li et al. (2012) report that when divided into first introns and non-first introns, the median length in the first group is 3,208 bp and in the second only 1,446 bp in human genes. Not even in recent literature can one find a clearer description of the lengths of the longest introns depending on their localization (Jo and Choi, 2019). The median lengths of the longest introns in our set generally decreased with increasing distance from the start of the gene, from values approximately ten times higher to values four times higher than the above-mentioned general intron median. We also calculated that the median length of the longest introns located at the first absolute position or first third according to relative positons was significantly higher when compared to the other absolute or relative positions. This may illustrate the exceptionality of the longest introns located near the 5′end of genes and possible action by other mechanisms than in introns further away.
It is known that intronless genes, constituting approximately 3% of the human genome, encode mostly for the receptors, signaling and regulatory molecules important in cell growth and proliferation as well as organismal development, with a relatively small proportion of metabolic enzymes (Grzybowska, 2012; Avina-Padilla et al., 2021). G-protein-coupled receptors (GPCRs) and histone-encoding genes form the two largest groups of genes within these genes with a representation of about 50% and 20%, respectively. Furthermore, the expression of intronless genes has been proposed to be highly specialized for neural functions.
No more generally valid information has yet been published on the connection between the length of introns and the biological function of genes. Lopes et al. (2021) concluded recently that smaller genes tend to play a role in functions that are important throughout the whole life. Due to the above-mentioned significantly higher length of introns in the first third, all those with the longest introns in the second and third third can be considered as smaller genes. We have shown in this work that there is a significant relationship between the position of the longest intron and the function of some genes. We demonstrated this on the example of a clinically important group of DNA repair genes, which have the longest intron more often in the second or third third.
The influence of introns on the expression of host genes has been described as IME and is a different mechanism than the action of long-known elements such as promoters, silencers or enhancers. Rose et al., 2011, showed in experiments with plant introns that IME acts at the level of DNA rather than nascent RNA and probably depends on the physical properties of introns than factors that bind to it. Information about average transcription elongation rates and role of histone post-translational modifications indicates that gene architecture contributes to the establishment of gene-specific transcription elongation rates that vary within an order of magnitude (Heyn et al., 2014). In this sense, the presence and abundance of intron sequences is essential. Experimentally, the positive influence of introns near the beginning of transcription and especially in the 5′untranslated regions of genes was shown (Shaul, 2017; Crane et al., 2019).
Our sample of 1,427 human genes representing all groups of protein-coding genes defined in the HGNC database showed higher mean and median values (12.6 and 9) of the number of introns in genes than already published works that worked with whole-genome data. Gorlova et al. (2014) described the average number of introns per human gene as 8–9. Piovesan et al. (2019) calculated the median number of introns in human protein-coding genes to be eight and characterized this figure as long-term stable in contrast to, for example, the number of all these genes in the human genome. From this view, the main limiting factor of this study is the relatively small size of the tested set of genes and we anticipate that the results of this pilot study will be refined by subsequent studies that will consider all genes in the human or other genome.
The influence of gene expression by the location of the longest intron has not yet been discussed in the literature. Our results show that such a relationship is very likely to exist and is most evident for absolute positions I1 and I2. Most likely, the total number of exons and introns and their lengths play a more fundamental role in the rate of transcription and, consequently, in overall expression. Our results are consistent with the assertion of Shaul (2017), where he writes that there is no unequivocal answer to the question of the way introns influence gene expression, and that it is a specific mix of processes in each individual case. However, the data presented in this article indicate that the position of the longest intron is another of the subtle mechanisms tuning gene expression in human cells and tissues.
Data availability statement
The original contributions presented in the study are included in the article/Supplementary Material, further inquiries can be directed to the corresponding author.
Author contributions
PD: Conceptualization, Methodology, Validation, Formal analysis, Writing—Original Draft, Visualization, Funding acquisition; VH: Methodology, Software, Formal analysis, Data Curation, Writing—Original Draft; PS: Writing—Review and Editing, Supervision, Funding acquisition.
Funding
This work was supported by the Czech Medical Council, project no. NV19-08-00113 (to PS); Ministry of Education, Youth and Sports of the Czech Republic, project no. CZ.02.1.01/0.0/0.0/16_019/0000787 “Fighting INfectious Diseases,” awarded by the MEYS CR, financed from EFRR (to PD); and Grant Agency of Charles University in Prague, program Cooperatio “Surgical Disciplines” no. 207043 (to PS and PD).
Conflict of interest
The authors declare that the research was conducted in the absence of any commercial or financial relationships that could be construed as a potential conflict of interest.
Publisher’s note
All claims expressed in this article are solely those of the authors and do not necessarily represent those of their affiliated organizations, or those of the publisher, the editors and the reviewers. Any product that may be evaluated in this article, or claim that may be made by its manufacturer, is not guaranteed or endorsed by the publisher.
Supplementary material
The Supplementary Material for this article can be found online at: https://www.frontiersin.org/articles/10.3389/fgene.2022.1085139/full#supplementary-material
SUPPLEMENTARY FIGURE S1 | Number of introns in human protein-coding genes—whole dataset of 1427 genes. A. The frequency of the number of introns. B. The normal probability plot for the number of all introns (correlation coefficient is 0.86).
SUPPLEMENTARY FIGURE S2 | Gene expression divided by the absolute position of the longest intron in human tissues produces characteristic profiles. (A) Mean and whisker plots showing the CNS Profile on 3 selected tissues. (B) Plots representing the Lymphatic System Profile.
SUPPLEMENTARY FIGURE S3 | Gene expression sorted according to the relative position of the longest intron in human protein-coding genes—characteristic tissue profiles. (A) Mean and whisker plots showing the CNS Profile on 3 selected tissues. (B) Plots representing the Lymphatic System Profile.
References
Aviña-Padilla, K., Ramírez-Rafael, J., Herrera-Oropeza, G., Muley, V., Valdivia, D., Díaz-Valenzuela, E., et al. (2021). Evolutionary perspective and expression analysis of intronless genes highlight the conservation of their regulatory role. Front. Genet. 12, 654256. doi:10.3389/fgene.2021.654256
Bradnam, K., and Korf, I. (2008). Longer first introns are a general property of eukaryotic gene structure. PLoS ONE 3 (8), e3093. doi:10.1371/journal.pone.0003093
Chorev, M., and Carmel, L. (2012). The function of introns. Front. Genet. 3, 55. doi:10.3389/fgene.2012.00055
Chung, B., Simons, C., Firth, A., Brown, C., and Hellens, R. (2006). Effect of 5'UTR introns on gene expression in Arabidopsis thaliana. BMC Genomics 7 (1), 120. doi:10.1186/1471-2164-7-120
Crane, M., Sands, B., Battaglia, C., Johnson, B., Yun, S., Kaeberlein, M., et al. (2019). In vivo measurements reveal a single 5′-intron is sufficient to increase protein expression level in Caenorhabditis elegans. Sci. Rep. 9 (1), 9192. doi:10.1038/s41598-019-45517-0
Duret, L. (2001). Why do genes have introns? Recombination might add a new piece to the puzzle. Trends Genet. 17 (4), 172–175. doi:10.1016/s0168-9525(01)02236-3
Gaffney, D., and Keightley, P. (2006). Genomic selective constraints in murid noncoding DNA. PLoS Genet. 2 (11), e204. doi:10.1371/journal.pgen.0020204
Gorlova, O., Fedorov, A., Logothetis, C., Amos, C., and Gorlov, I. (2014). Genes with a large intronic burden show greater evolutionary conservation on the protein level. BMC Evol. Biol. 14 (1), 50. doi:10.1186/1471-2148-14-50
Grzybowska, E. (2012). Human intronless genes: Functional groups, associated diseases, evolution, and mRNA processing in absence of splicing. Biochem. Biophysical Res. Commun. 424 (1), 1–6. doi:10.1016/j.bbrc.2012.06.092
Heyn, P., Kalinka, A., Tomancak, P., and Neugebauer, K. (2014). Introns and gene expression: Cellular constraints, transcriptional regulation, and evolutionary consequences. BioEssays 37 (2), 148–154. doi:10.1002/bies.201400138
Hong, X., Scofield, D., and Lynch, M. (2006). Intron size, abundance, and distribution within untranslated regions of genes. Mol. Biol. Evol. 23 (12), 2392–2404. doi:10.1093/molbev/msl111
Hubé, F., and Francastel, C. (2015). Mammalian introns: When the junk generates molecular diversity. Int. J. Mol. Sci. 16 (3), 4429–4452. doi:10.3390/ijms16034429
Jo, S., and Choi, S. (2019). Analysis of the functional relevance of epigenetic chromatin marks in the first intron associated with specific gene expression patterns. Genome Biol. Evol. 11 (3), 786–797. doi:10.1093/gbe/evz033
Li, H., Chen, D., and Zhang, J. (2012). Analysis of intron sequence features associated with transcriptional regulation in human genes. PLoS ONE 7 (10), e46784. doi:10.1371/journal.pone.0046784
Lopes, I., Altab, G., Raina, P., and de Magalhães, J. (2021). Gene size matters: An analysis of gene length in the human genome. Front. Genet. 12, 559998. doi:10.3389/fgene.2021.559998
Marais, G., Nouvellet, P., Keightley, P., and Charlesworth, B. (2005). Intron size and exon evolution in Drosophila. Genetics 170 (1), 481–485. doi:10.1534/genetics.104.037333
Morales, J., Pujar, S., Loveland, J. E., Astashyn, A., Bennett, R., Berry, A., et al. (2022). A joint NCBI and EMBL-EBI transcript set for clinical genomics and research. Nature 604 (7905), 310–315. doi:10.1038/s41586-022-04558-8
Nott, A., Meislin, S., and Moore, M. (2003). A quantitative analysis of intron effects on mammalian gene expression. RNA 9 (5), 607–617. doi:10.1261/rna.5250403
Park, S., Hannenhalli, S., and Choi, S. (2014). Conservation in first introns is positively associated with the number of exons within genes and the presence of regulatory epigenetic signals. BMC Genomics 15 (1), 526. doi:10.1186/1471-2164-15-526
Piovesan, A., Antonaros, F., Vitale, L., Strippoli, P., Pelleri, M., and Caracausi, M. (2019). Human protein-coding genes and gene feature statistics in 2019. BMC Res. Notes 12 (1), 315. doi:10.1186/s13104-019-4343-8
Raudvere, U., Kolberg, L., Kuzmin, I., Arak, T., Adler, P., Peterson, H., et al. (2019). g:Profiler: a web server for functional enrichment analysis and conversions of gene lists (2019 update). Nucleic Acids Res. 47 (W1), W191–W198. doi:10.1093/nar/gkz369
Rose, A., Elfersi, T., Parra, G., and Korf, I. (2008). Promoter-proximal introns in Arabidopsis thaliana are enriched in dispersed signals that elevate gene expression. Plant Cell. 20 (3), 543–551. doi:10.1105/tpc.107.057190
Rose, A., Emami, S., Bradnam, K., and Korf, I. (2011). Evidence for a DNA-based mechanism of intron-mediated enhancement. Front. Plant Sci. 2, 98. doi:10.3389/fpls.2011.00098
Rose, A. (2019). Introns as gene regulators: A brick on the accelerator. Front. Genet. 9, 672. doi:10.3389/fgene.2018.00672
Shaul, O. (2017). How introns enhance gene expression. Int. J. Biochem. Cell. Biol. 91, 145–155. doi:10.1016/j.biocel.2017.06.016
Vinogradov, A. (2006). Genome design” model: Evidence from conserved intronic sequence in human–mouse comparison. Genome Res. 16 (3), 347–354. doi:10.1101/gr.4318206
Zalabák, D., and Ikeda, Y. (2020). First come, first served: Sui generis features of the first intron. Plants 9 (7), 911. doi:10.3390/plants9070911
Keywords: human genome, gene structure, introns, longest intron, gene function, gene expression
Citation: Dvorak P, Hanicinec V and Soucek P (2023) The position of the longest intron is related to biological functions in some human genes. Front. Genet. 13:1085139. doi: 10.3389/fgene.2022.1085139
Received: 31 October 2022; Accepted: 27 December 2022;
Published: 10 January 2023.
Edited by:
Ming Chen, Zhejiang University, ChinaReviewed by:
Florent Hubé, UMR7216 Epigénétique et destin cellulaire, FranceYuriy L. Orlov, I. M. Sechenov First Moscow State Medical University, Russia
Copyright © 2023 Dvorak, Hanicinec and Soucek. This is an open-access article distributed under the terms of the Creative Commons Attribution License (CC BY). The use, distribution or reproduction in other forums is permitted, provided the original author(s) and the copyright owner(s) are credited and that the original publication in this journal is cited, in accordance with accepted academic practice. No use, distribution or reproduction is permitted which does not comply with these terms.
*Correspondence: Pavel Dvorak, Pavel.Dvorak@lfp.cuni.cz
†ORCID: Pavel Dvorak, orcid.org/0000-0002-2124-7219; Vojtech Hanicinec, orcid.org/0000-0002-0515-4848; Pavel Soucek, orcid.org/0000-0002-4294-6799