 Changheng Zhao1Jun Teng1Xinhao Zhang1,2
 Dan Wang1Xinyi Zhang1Shiyin Li1Xin Jiang1Haijing Li2
 Chao Ning1*
 Qin Zhang1*
- 1Shandong Provincial Key Laboratory of Animal Biotechnology and Disease Control and Prevention, College of Animal Science and Veterinary Medicine, Shandong Agricultural University, Tai’an, China
- 2National Engineering Research Center for Gelatin-based TCM, Dong-E E-Jiao Co., Ltd., Dong’e County, China
Low-coverage whole genome sequencing is a low-cost genotyping technology. Combined with genotype imputation approaches, it is likely to become a critical component of cost-effective genomic selection programs in agricultural livestock. Here, we used the low-coverage sequence data of 617 Dezhou donkeys to investigate the performance of genotype imputation for low-coverage whole genome sequence data and genomic prediction based on the imputed genotype data. The specific aims were as follows: 1) to measure the accuracy of genotype imputation under different sequencing depths, sample sizes, minor allele frequency (MAF), and imputation pipelines and 2) to assess the accuracy of genomic prediction under different marker densities derived from the imputed sequence data, different strategies for constructing the genomic relationship matrixes, and single-vs. multi-trait models. We found that a high imputation accuracy (>0.95) can be achieved for sequence data with a sequencing depth as low as 1x and the number of sequenced individuals ≥400. For genomic prediction, the best performance was obtained by using a marker density of 410K and a G matrix constructed using expected marker dosages. Multi-trait genomic best linear unbiased prediction (GBLUP) performed better than single-trait GBLUP. Our study demonstrates that low-coverage whole genome sequencing would be a cost-effective approach for genomic prediction in Dezhou donkey.
Introduction
Dezhou donkey, originating from Dezhou area, Shandong Province, China, is one of the major donkey breeds in China. It is famous for its large body size (and thus good meat production ability) and excellent skin quality (for producing donkey-hide gelatin). It has been introduced as a breeding stock into many areas of China and has also brought considerable economic benefits to farmers (Wang et al., 2020a). Therefore, Dezhou donkey plays an important role in the donkey industry in China. However, selective breeding based on animal breeding theory had never been practiced in Dezhou donkey in the past. In recent years, along with the increased importance of the donkey industry in livestock agriculture in China, selective breeding is gradually becoming an important issue in donkey production, and some breeding work is being carried out in the Dezhou donkey population.
Starting with the pioneered work of Meuwissen et al. (2001), genomic selection (GS) has been widely used in selective breeding in almost all major farm animal species and has brought great increases of genetic progress and economic benefit for many animal breeding industries (Schaeffer, 2006; Stock and Reents, 2013; Wiggans et al., 2017). Typically, GS is carried out using a high-density (or medium-density) single-nucleotide polymorphism (SNP) array. Many commercial SNP arrays have been developed for major farm animal species (Stock and Reents, 2013). However, there are still some species, such as donkey, for which no such array is available, which inhibits the application of GS in these species.
Recently, along with the rapid development of next-generation sequencing technology and reduction of sequencing cost, GS using genotypes revealed by whole genome sequencing (WGS), instead of SNP array, has drawn interests of animal GS community (Hickey 2013; Daetwyler et al., 2014; Georges 2014). The motivations of using whole genome sequence data are to increase the selection accuracy, to facilitate GS across breeds/populations, and to improve persistence of accuracy across generations (Meuwissen and Goddard, 2010; Hayes et al., 2013). To capture the whole genome variants, a sequencing depth of 10x to 20x is generally required (Rashkin et al., 2017; Jiang et al., 2019). However, at present, sequencing with such depth is still too expensive for a large-scale GS application. An alternative is to perform low-coverage whole genome sequencing (lcWGS) at about 1x or less, and then recovering the missing genotypes by imputation to ensure that all individuals have genotypes for a shared set of variants. This approach has been used in human and some animal species for genome-wide association studies and genomic selection/prediction and proved to be a feasible alternative to normal sequencing (Pasaniuc et al., 2012; Nicod et al., 2016; Liu et al., 2018; Zhang et al., 2021). Since the cost of lcWGS can even be lower than that of a SNP array (e.g., in China, the current price for sequencing a cattle genome at 1x is about ¥ 250 RMB per sample, while the price for genotyping with the Neogen GGP Bovine 100k SNP array is ¥ 280 RMB per sample), it is considered as a cost-effective genotyping approach for GS [referred to as GS 2.0 by Hickey (2013)].
A critical issue of lcWGS-based GS is the accuracy of imputation of missing genotypes, which is affected by several factors, such as sequencing depth, sample size, minor allele frequency (MAF), and imputation method. A number of imputation methods for lcWGS data have been proposed (Davies et al., 2016; Ros-Freixedes et al., 2017; Hui et al., 2020). However, most of these methods require a high-density reference haplotype panel, which is not available for most animal species, including donkey. Davies et al. (2016) proposed a method called STITCH for imputation without requiring a reference haplotype panel. It makes use of the fact that SNPs in sequences are not independent of each other, and it constructs founder haplotypes directly from the sequencing read data and then perform imputation based on a hidden Markov model. This method provides an opportunity of using lcWGS technology for species for which a reference haplotype panel is not available.
In this study, we evaluated the imputation accuracy of lcWGS data with respect to different sequencing depths, sample sizes, MAFs, and imputation pipelines using 617 Dezhou donkey animals that were sequenced with an average depth of 3.5x. We then used the imputed genotypes to investigate the performance of genomic selection for birth weight (BW) and weaning weight (WW) in the Dezhou donkey population under different marker densities, strategies for constructing genomic relationship matrices, and single-vs. two-trait models.
Materials and Methods
Animals
The animals used in this study were from the Dong-E E-Jiao Donkey Farm in Shandong Province, China. Animals that had records on both BW and WW were selected. These animals along with their known parents formed the study population for this research, which consisted of 617 animals, of which 594 had records on both traits. These 594 animals (303 males and 291 females) were born between 2015 and 2019. The animals were weaned at 6 months after birth, and their weaning weight was measured at the age of 6 ± 1 month. Weaning weight recorded outside this age range was regarded as invalid record. The means and standard deviations of the two traits were 30.507 ± 4.235 kg (ranging from 15.0 to 42.2 kg) and 116.752 ± 18.227 kg (ranging from 63.5 to 165.5 kg), respectively.
Blood samples were collected from all these animals. Total DNA was isolated using the QIAamp DNA Investigator Kit (QIAGEN, Hilden, Germany) and following the manufacturer’s instruction. DNA quality was evaluated by spectrophotometry and agarose gel electrophoresis.
All of the above experiments were carried out according to the guideline of the experimental animal management of Shandong Agricultural University (SDAUA-2018-018).
Low-Coverage Whole Genome Sequencing
DNA templates were ultrasonically sheared using a Covaris E220 (Covaris, Woburn, MA, United States) to yield to 150-bp fragments and then prepared for sequencing libraries following the workflow of the NEBNext Ultra DNA Library Preparation Protocol. Multiple Ampure Bead XP cleanups (Beckman Coulter, Brea, CA, United States) were conducted to remove any adapter dimer that might have developed. The quality and concentration of libraries were determined on an Agilent Bioanalyzer 2,100 (Agilent Technologies, Santa Clara, CA). The genomic library for each sample was PE150 sequenced using the Illumina NovaSeq 6,000 sequencing system.
Read quality was assessed using the FastQC software (https://www.bioinformatics.babraham.ac.uk/projects/fastqc/) with focus on base quality scores (q > 30), GC content (skewness <5%), N content (<5%), and sequence duplication levels (<100). The resulting data reached a nucleotide length of 150 bp and a base quality score of higher than 30 and were aligned to the donkey reference genome (Wang et al., 2020b) by BWA (Li and Durbin, 2009). SAMtools (Li et al., 2009) was used to transfer the formats and sort and index files. The 617 animals had an average sequencing depth of 3.5x (ranging from 1.9x to 6.4x) (Supplementary Figure S1).
Pipelines for Genotype Imputation
We compared two imputation pipelines, i.e., Bcftools + Beagle and BaseVar + STITCH. In the first pipeline, we called SNPs using Bcftools (Li, 2011) and then conducted genotype imputation using Beagle v4.1 (Browning and Browning, 2016). In the second pipeline, we called SNPs using BaseVar (Liu et al., 2018) and imputed the missing genotypes (with probabilities) using STITCH v1.6.3. The resulted SNP data from both pipelines were filtered with MAF ≥0.01 and a Hardy–Weinberg equilibrium (HWE) p-value > 1e-6 using PLINK (Chang et al., 2015).
Evaluation of Imputation Accuracy
We evaluated the imputation accuracy under different sequencing depths, sample sizes, and MAFs using the sequence data of additional 18 Dezhou donkey animals provided by the Donkey Research Institute, Liaocheng University, Shandong Province, China. The average sequencing depth of the 18 animals was 13.5x (ranging from 11.2x to 16.3x). Chromosomes 1, 19, and 30, which represented the long, short, and medium chromosomes among the donkey chromosomes, respectively, were chosen to evaluate the imputation accuracy. The imputation accuracy was measured with two criteria, i.e., genotypic concordance and genotypic accuracy. Genotypic concordance is defined as the proportion of correctly imputed genotypes (Fridley et al., 2010), and genotypic accuracy is defined as squared Pearson correlation coefficient (r2) between expected dosages (posterior expectation of the imputed allele dosages) and typed genotypes (Browning and Browning, 2009). To evaluate the imputation accuracy for different sequencing depths, in addition to the original sequence data with an average depth of 3.5x, we randomly sampled reads from the sequencing read data to generate sequence data with different lower sequencing depths (0.5x, 1x, 1.5x, and 2x) using Picard (https://broadinstitute.github.io/picard/). For the depths of 0.5x, 1x, and 1.5x, three repeated samplings were performed. To test the effect of sample size (number of low coverage sequenced individuals) on imputation accuracy, three different sample sizes (200, 400, and 617) were considered. The samples with sizes of 200 and 400 were randomly sampled from the 617 animals, and three repeated samplings were performed. To test the effect of MAF on imputation accuracy, we restored the SNPs that were previously filtered out with MAF >0.01 and divided the SNPs into 15 MAF bins: (0–0.001), (0.001–0.002), (0.002–0.005), (0.005–0.01), (0.01–0.02), (0.02–0.05), (0.05–0.1), (0.1–0.15), (0.15–0.2), (0.2–0.25), (0.25–0.3), (0.3–0.35), (0.35–0.4), (0.4–0.45), and (0.45–0.5). The average imputation accuracy in each bin was calculated.
Genomic Prediction
The imputation-based sequence data was used to investigate the performance of genomic prediction using the 594 animals having records on both BW and WW. The genomic estimated breeding values (GEBVs) were obtained by using the genomic best linear unbiased prediction (GBLUP) method (VanRaden, 2008) under single-trait model as well as two-trait model.
The single-trait GBLUP model is as follows:
where y is the vector of observed phenotypes of BW or WW; b is the vector of fixed effects, which include the effects of sex, year-seasons when the trait was measured (years for BW: 2015–2019, years for WW: 2016–2019, and four seasons each year), and age (in days, as covariate, for WW) when the trait was measured; u is the vector of genomic breeding values with distribution of N (0, G
The two-trait GBLUP model is as follows:
where the meanings of the vectors and matrices are the same as those in the single-trait model with the subscripts 1 and 2 referring BW and WW, respectively. It was assumed that
Since STITCH provides for each SNP and each individual the imputed genotype (the most likely genotype) as well as the expected genotype dosages (posterior expectation of the genotype dosages), the G matrix can be constructed using either the imputed genotypes or the expected genotype dosages. The genotype-based G matrix [denoted as G(g)] was constructed using the method of VanRaden (2008) as follows:
where,
where
For constructing G using expected dosages [denoted as G(d)], following the idea of the formula for G(g), we proposed the following formula:
where,
To evaluate the effect of marker density on the performance of genomic prediction, we used four levels of marker densities to construct the G matrices. From the original sequence data with an average depth of 3.5x, we obtained 2.3M SNPs after imputation and quality control. We then reduced the marker density by down-sampling SNPs from the 2.3M SNPs. We applied linkage disequilibrium (LD) pruning with three LD levels: r2 = 0.2, 0.4, and 0.8, by PLINK (Chang et al., 2015), which produced 130, 220, and 410K SNPs, respectively.
In addition, we also evaluated the performance of genomic prediction using the 1x sequencing data, which was sampled from the original sequence data and contained 1.4M SNPs after imputation and quality control.
We used GMAT (Wang et al., 2020a) to construct the G matrix. The variance and covariance components involved in the models and GEBVs were estimated by AI-REML using the DMU package (Madsen et al., 2014; http://dmu.agrsci.dk).
Cross-Validation
In this study, a 12-fold cross-validation (CV) was applied to assess the accuracy of the genomic prediction. The 594 animals were divided into 12 subsets. One of them was taken in turn to be used as a validation population, and the remaining 11 subsets used as a training population. For the two-trait model analysis, we left out the observations on both BW and WW for the animals in the validation set and calculated their GEBVs for both traits simultaneously. The accuracy of genomic prediction for the validation animals was assessed by
Results
Accuracies of Genotype Imputation
Comparison of Different Pipelines
The two genotype imputation pipelines, BaseVar + STITCH and Bcftools + Beagle, were compared using the original sequencing data of the 617 animals with an average sequencing depth of 3.5x. Figure 1 shows that the BaseVar + STITCH pipeline was remarkably better than the Bcftools + Beagle pipeline. The average genotypic accuracy from BaseVar + STITCH was about 0.06 higher than that from Bcftools + Beagle, and the average genotypic concordance was about 0.02 higher. Therefore, the BaseVar + STITCH pipeline was used for the subsequent analyses.
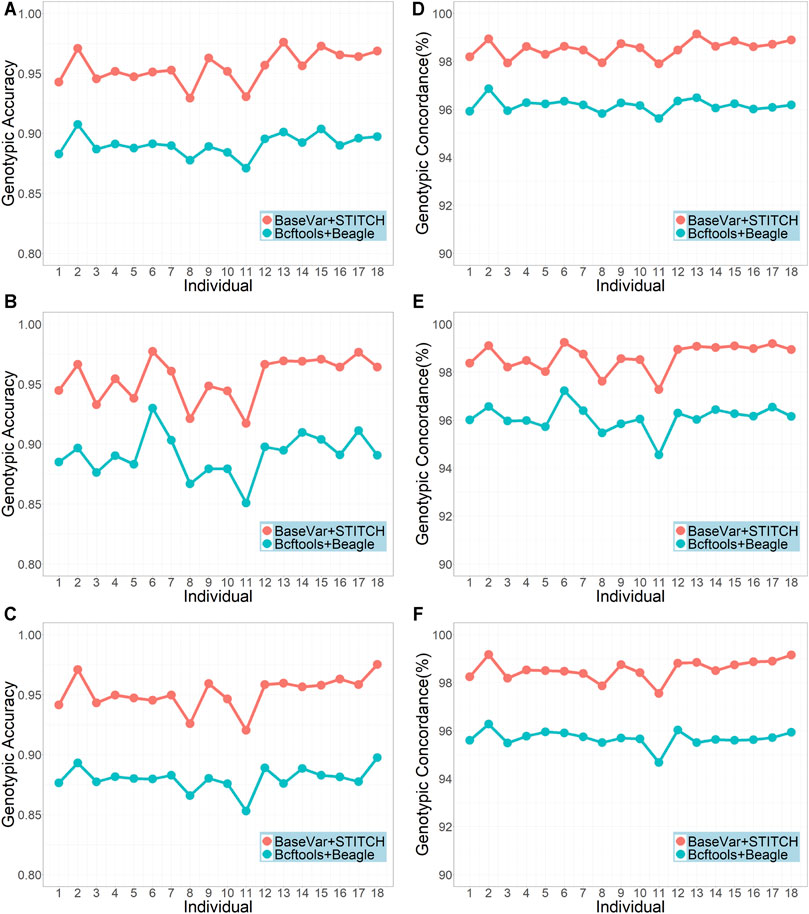
FIGURE 1. Genotypic accuracy and genotypic concordance using the two imputation pipelines (sample size = 617 and average sequencing depth = 3.5x). (A–C) represent genotype accuracy for chromosomes 1, 19, and 30, respectively; (D–F) represent genotype concordance for chromosomes 1, 19 and 30, respectively.
The Effects of Sample Size and Sequencing Depth
We compared the genotypic accuracy and genotypic concordance for imputation with different sample sizes (200, 400, and 600) and sequencing depths (0.5x, 1x, 1.5x, 2x, and 3.5x) (Figure 2). In all scenarios, the genotype accuracies were over 0.90 (with only one exception on chromosome 30 in the scenario of sequencing depth = 0.5x and sample size = 200) and the genotypic concordances were over 0.97. In general, as expected, the genotypic accuracy and genotypic concordance increased with the increase of sample size and sequencing depth. The improvement of imputation accuracy was most obvious when the sample size was increased from 200 to 400 and the sequencing depth increased from 0.5x to 1x. For sequencing depths of 0.5x, 1x, and 1.5x, the results from the three repeatedly sampled data were almost the same (see Supplementary Table S1 for chromosome 19 and sample size of 200), so did the results from the repeated samples of sizes 200 and 400 (see Supplementary Table S2). It should be noted that, with a sample size of ≥400, a genotypic accuracy greater than 0.94 and a genotypic concordance greater than 0.98 could be achieved even when the sequencing depth was as low as 1x. However, with a sequencing depth of 0.5x, even for a sample size of 600, the genotype accuracy was less than 0.94.
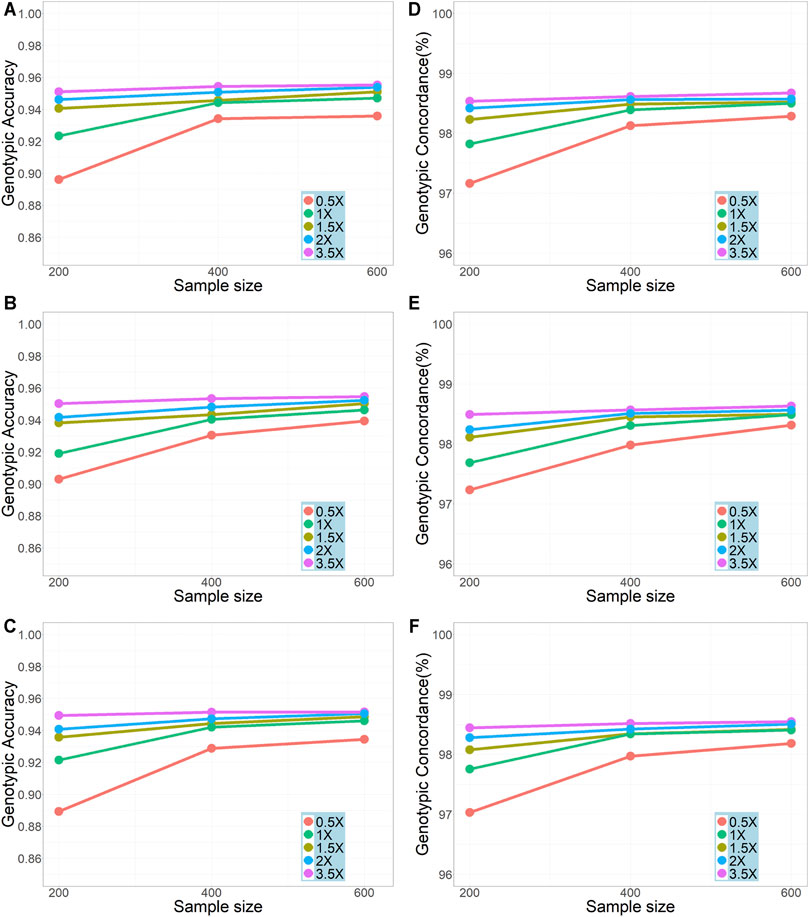
FIGURE 2. Effects of sample size and sequencing depth on imputation genotypic accuracy and genotypic concordance using the pipeline of BaseVar + STITCH. (A–C) represent genotype accuracy for chromosomes 1, 19, and 30, respectively; (D–F) represent genotype concordance for chromosomes 1, 19, and 30, respectively.
The Effect of MAF
Figure 3 shows the effect of MAF on imputation accuracy for a sample size of 600. For SNPs with MAF <0.01, both the genotypic accuracy and the genotypic concordance were greatly affected by MAF, and the accuracy increased rapidly with the increase of MAF. However, for SNPs with MAF >0.01, the imputation accuracy was not affected by MAF, while the genotypic concordance decreased slightly with the increase of MAF.
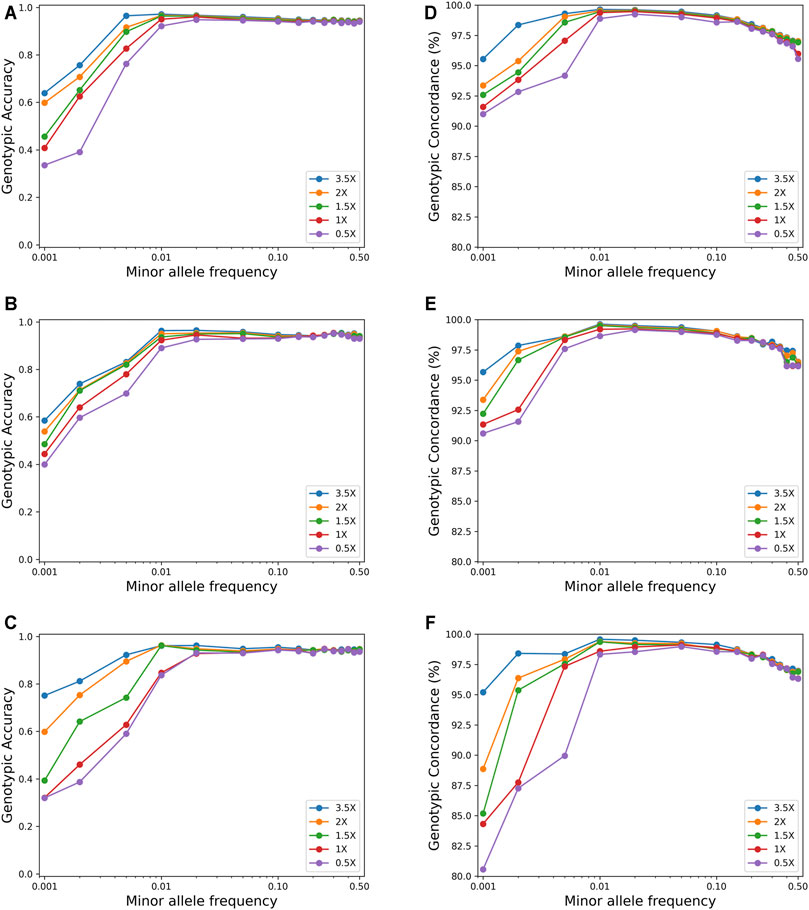
FIGURE 3. Effects of minor allele frequency on imputation genotype accuracy and genotype concordance using the pipeline of BaseVar + STITCH (sample size = 617). (A–C) represent genotype accuracy for chromosomes 1, 19, and 30, respectively; (D–F) represent genotype concordance for chromosomes 1, 19, and 30, respectively.
Variance Component Estimation
Table 1 presents the estimates of variance components and heritabilities based on the single-trait model with the two types of G matrix [G(g) and G(d)] constructed using five different marker sets (130, 220, 410K, and 2.3M from the 3.5x sequence data and 1.4M from the 1x sequence data). For the 3.5x sequence data, the estimates under the four marker sets were very similar, with the additive variance and heritability estimates from the 2.3M marker set being consistently slightly smaller than those from the other three marker sets. However, the additive variance and heritability estimates from the 1.4M marker set were all smaller than those from the other marker sets. For all marker sets, the estimates of additive genetic variances and heritabilities based on G(d) were consistently smaller than those based on G(g), although the differences were very small and not significant.
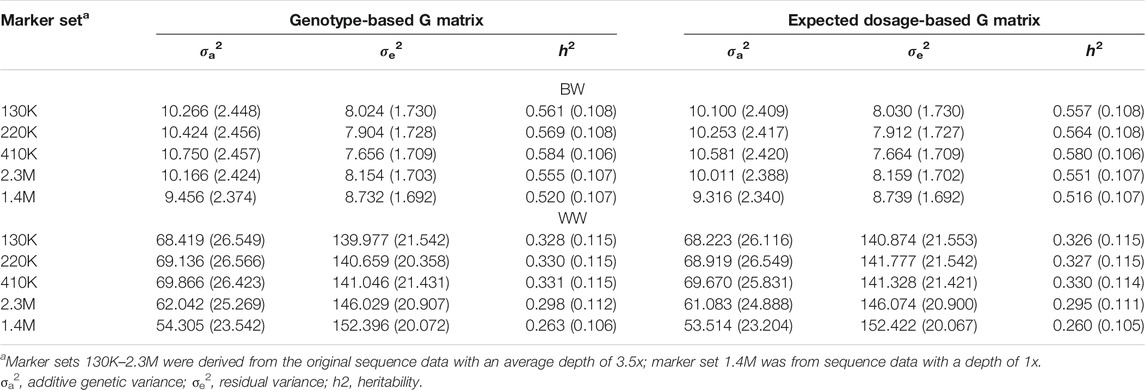
TABLE 1. Estimates of variance components and heritabilities and their standard errors (in brackets) under single-trait model using different marker sets and different G matrices for birth weight (BW) and weaning weight (WW).
For the two-trait model, the variance and co-variance components of the two traits were estimated based on the dosage-based G matrix and the 410K marker set (Table 2). The estimates of heritability from the two-trait model (0.627 for BW and 0.425 for WW) were higher than those from the single-trait model (0.580 for BW and 0.330 for WW). The estimate of genetic correlation between BW and WW was 0.839.
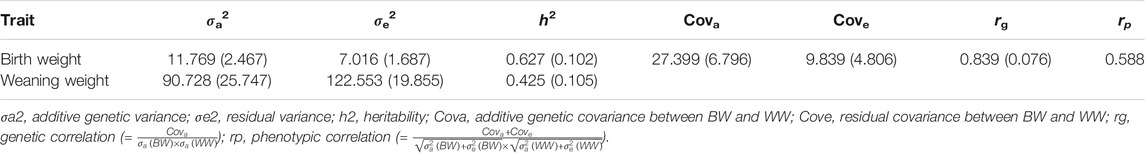
TABLE 2. Estimates of variance (covariance) components, heritabilities, and genetic correlation and their standard errors (in brackets) under two-trait models using the 410K marker set and expected dosage-based G matrix.
Accuracy and Bias of Genomic Prediction
The GEBVs for BW and WW were calculated under the single-trait model and two-trait model, respectively. For the single-trait model, we again considered both types of G matrix [G(g) and G(d)] constructed using the five different marker sets. The average accuracies and biases derived from 12-fold cross-validation are given in Table 3. In general, the differences in accuracy and bias between different marker sets were small and not significant, while the 410K marker set resulted in the highest accuracies, and the 1.4M marker set resulted in the lowest accuracies. No differences in prediction accuracy and bias were observed between the two types of G matrices. For the two-trait model, only the G(d) matrix constructed using the 410K marker set was used (Table 4). Compared with the results under the single-trait model with the same G matrix, the two-trait model remarkably improved the accuracies (0.337 vs. 0.297 for BW and 0.301 vs. 0.229 for WW) and reduced the biases (0.020 vs. 0.062 for BW and 0.117 vs. 0.169 for WW). The difference tendencies mentioned above were quite consistent across the 12 folds (see Supplementary Table S3).
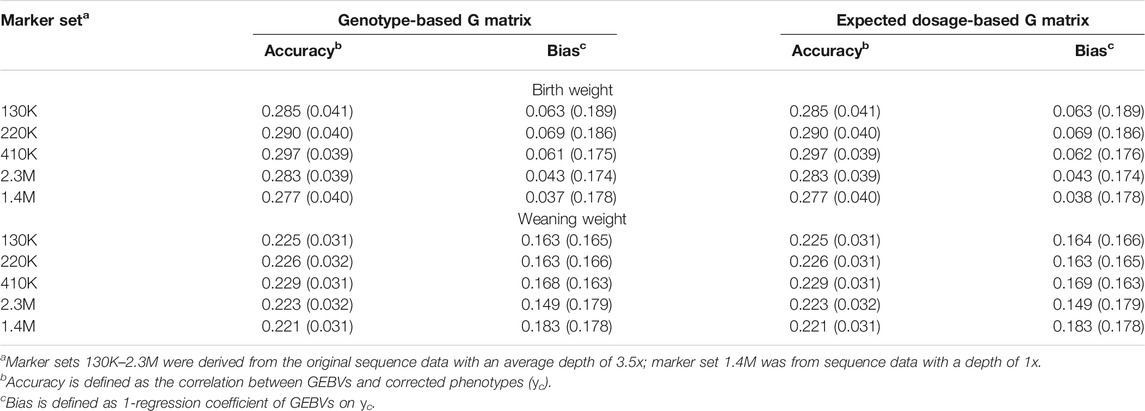
TABLE 3. Accuracies and biases of genomic prediction and their standard errors (in brackets) under single-trait model with different marker sets.
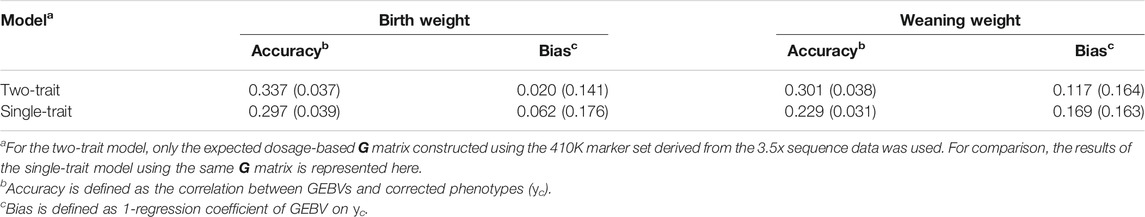
TABLE 4. Accuracies and biases of genomic prediction and their standard errors (in brackets) under single-trait and two-trait models.
Discussion
Low-coverage whole genome sequencing followed by imputation provides a cost-effective way for genome-wide high-density genotyping, especially for species (such as donkey) for which a SNP array is not available. In this study, we investigated the strategies for genotype imputation and evaluated the performance of genomic prediction using imputation-based sequence data in a donkey population.
Strategies of Imputation for Low-Coverage Sequence Data
Imputation is necessary for lcWGS data due to the high missing rates, which involves two steps, i.e., SNP calling and imputation. A proper pipeline is essential to ensure high imputation performance. In this study, we compared two pipelines, Bcftools + Beagle and BaseVar + STITCH. In the first pipeline, both Bcftools and Beagle have been widely used for SNP calling and imputation for sequence data, respectively. However, it is not clear whether they are suitable for lcWGS data. On the other hand, BaseVar and STITCH were designed specifically for lcWGS data. We demonstrated that BaseVar + STITCH outperformed Bcftools + Beagle (Figure 1). Furthermore, we showed that in our Dezhou donkey population, using this pipeline, high imputation accuracy (genotypic accuracy >0.94 and genotypic concordance >98%) can be achieved with a sample size of 400 and a sequencing depth of 1x (Figure 2). Similar results were also reported by Zhang et al. (2021). In other words, with a sample size of over 400, a sequencing depth of 1x could be sufficient to ensure high imputation accuracy using BaseVar + STITCH.
Genomic Prediction Using Imputation-Based Sequence Data
Using the imputation-based sequence data, we evaluated the performance of genomic prediction using GBLUP with respect to two types of G matrices [G(g) and G(d)], five different marker sets (130, 220, 410K, and 2.3M derived from the 3.5x sequence data and 1.4M derived from the 1x sequence data), and single-vs. two-trait GBLUP model.
Comparison of the Two Types of G Matrices
We found that the accuracies and biases of genomic prediction derived from the two types of G matrices were almost the same in all scenarios. Note that the variance component estimates from the two types of G matrices were also very similar. This implicates that for our given data, the two types of G matrices did not lead to different results. It remains to be seen whether this results also holds for other data sets.
Comparison of the Five Marker Sets
For the four marker sets from the 3.5x sequence data, the prediction accuracy increased slightly (although not significant) when the marker density increased from 130 to 410K, but did not further increase when the density increased to 2.3M. The densities of 130, 220, and 410K correspond to medium to high density of SNP array, while the 2.3M corresponds to the density of sequence data. Some studies showed that, in the frame of GBLUP, the genomic prediction accuracy could be improved using high-density SNP array compared to using medium-density array (VanRaden et al., 2011; Su et al., 2012; Perez-Enciso et al., 2015), but there were also studies that showed no or very small such improvement (VanRaden et al., 2013; Boison et al., 2017). It has been shown that, in the frame of GBLUP, using sequence data could hardly improve the accuracy compared with using SNP array (Ober et al., 2012; Perez-Enciso, 2014; van Binsbergen et al., 2015; Frischknecht et al., 2018). However, this does not mean that sequence data is of no value for genomic prediction. Several studies have shown that sequence data would be beneficial when variants are preselected based on, e.g., GWAS or a Bayesian selection model (MacLeod et al., 2016; Hayes and Daetwyler, 2019). In addition, sequence data can be meaningful for cross-breed/population genomic selection (Druet et al., 2014; MacLeod et al., 2016). On the other hand, the prediction accuracies using the 1.4M marker set from the 1x sequence data were slightly lower than those from the 3.5x sequence data. This should be due to the lower imputation accuracy for the 1x sequence data than 3.5x (see Figure 2). However, since the reduction in accuracy was rather small, in consideration of the sequencing cost, sequencing at depth of 1x would be a preferred choice for a lcWGS-based genomic selection.
Single-vs. Two-Trait GBLUP Model
Noticeable increases in genomic prediction accuracy were observed when using a two-trait model compared with using a single-trait model. The comparison was made only for the scenario of using an expected dosage-based G matrix and the 410k marker set derived from the 3.5x sequence data. However, such advantage should hold for other scenarios. It has been shown in several incidences that a multi-trait model can increase the accuracy of breeding value estimation, either by conventional BLUP or by GBLUP (Calus and Veerkamp, 2011; Jia and Jannink, 2012; Guo et al., 2014), in particular for traits with high genetic correlation, such as the two traits investigated in this study. This increase in accuracy with multi-trait model will be particularly beneficial for the situation where the reference population size is limited.
It should be pointed out that, although the differences in the performance of genomic prediction between different scenarios seemed reasonable, some of the differences were actually not significant, possibly due to the small dataset available for this study. It is the practical situation for some species/breeds/populations for which only a small dataset is available for investigating genomic prediction. Therefore, despite the limitations of having a small dataset, our findings would provide meaningful inspirations for such situations.
Conclusion
In this study, we demonstrated that the pipeline BaseVar + STITCH is a good choice for SNP calling and imputation for low-coverage sequence data. A sufficient high imputation accuracy could be achieved for sequence data with a sequencing depth as low as 1x, when the size of the sequencing population is over 400. Thus, lcWGS combined with imputation provides a cost-effective way for whole genome high-density genotyping and can be applied for large-scale genomic selection in farm animals. This is particularly beneficial for those animal species for which a SNP array is not available. In the frame of GBLUP, increasing marker density from a density comparable with a high-density SNP array (e.g., 400K) to sequence density with millions of SNPs did not increase the accuracy of genomic prediction. The multi-trait model GBLUP improves the accuracy of genomic prediction over the single-trait model, which would be particularly meaningful for the situation where the reference population size is limited.
Data Availability Statement
The datasets presented in this study can be found in online repositories. The names of the repository/repositories and accession number(s) can be found in the article/Supplementary Material.
Ethics Statement
The animal study was reviewed and approved by the experimental animal management of Shandong Agricultural University.
Author Contributions
QZ and CN designed the study. CZ, XYZ, XJ, HL and SL collected the sample and performed the experiments. CZ and JT analyzed and interpreted the data. CZ, JT, XHZ, CN, DW and QZ drafted the manuscript.
Funding
The study was funded by the Project for Improved Agricultural Breeding of Shandong Province (2019LZGC011), China Postdoctoral Science Foundation (2020M682217), Shandong Provincial Postdoctoral Program for Innovative Talent, Shandong Provincial Natural Science Foundation (ZR2020QC176 and ZR2020QC175), and National Natural Science Foundation of China (32002172).
Conflict of Interest
XHZ and HL were employed by National Engineering Research Center for Gelatin-based TCM, Dong-E E-Jiao Co., Ltd.
The remaining author declares that the research was conducted in the absence of any commercial or financial relationships that could be construed as a potential conflict of interest.
Publisher’s Note
All claims expressed in this article are solely those of the authors and do not necessarily represent those of their affiliated organizations, or those of the publisher, the editors and the reviewers. Any product that may be evaluated in this article, or claim that may be made by its manufacturer, is not guaranteed or endorsed by the publisher.
Acknowledgments
The authors thank the Supercomputing Center at Shandong Agricultural University for technical support.
Supplementary Material
The Supplementary Material for this article can be found online at: https://www.frontiersin.org/articles/10.3389/fgene.2021.728764/full#supplementary-material
Supplementary Figure S1 | The number of individuals of different sequencing depths. The sequencing was performed in two batches. The first batch consisted of 317 animals and the average sequencing depth was 4.5x; the second batch consisted of 300 animals and the average depth was 2.4x. Taken together, the overall average depth was 3.5x.
References
Boison, S. A., Utsunomiya, A. T. H., Santos, D. J. A., Neves, H. H. R., Carvalheiro, R., Mészáros, G., et al. (2017). Accuracy of Genomic Predictions in Gyr (Bos indicus) Dairy Cattle. J. Dairy Sci. 100, 5479–5490. doi:10.3168/jds.2016-11811
Browning, B. L., and Browning, S. R. (2009). A Unified Approach to Genotype Imputation and Haplotype-phase Inference for Large Data Sets of Trios and Unrelated Individuals. Am. J. Hum. Genet. 84, 210–223. doi:10.1016/j.ajhg.2009.01.005
Browning, B. L., and Browning, S. R. (2016). Genotype Imputation with Millions of Reference Samples. Am. J. Hum. Genet. 98, 116–126. doi:10.1016/j.ajhg.2015.11.020
Calus, M. P., and Veerkamp, R. F. (2011). Accuracy of Multi-Trait Genomic Selection Using Different Methods. Genet. Sel. Evol. 43, 26. doi:10.1186/1297-9686-43-26
Chang, C. C., Chow, C. C., Tellier, L. C., Vattikuti, S., Purcell, S. M., and Lee, J. J. (2015). Second-generation PLINK: Rising to the challenge of Larger and Richer Datasets. GigaSci 4, 7. doi:10.1186/s13742-015-0047-8
Daetwyler, H. D., Capitan, A., Pausch, H., Stothard, P., van Binsbergen, R., Brøndum, R. F., et al. (2014). Whole-genome Sequencing of 234 Bulls Facilitates Mapping of Monogenic and Complex Traits in Cattle. Nat. Genet. 46, 858–865. doi:10.1038/ng.3034
Davies, R. W., Flint, J., Myers, S., and Mott, R. (2016). Rapid Genotype Imputation from Sequence without Reference Panels. Nat. Genet. 48, 965–969. doi:10.1038/ng.3594
Druet, T., Macleod, I. M., and Hayes, B. J. (2014). Toward Genomic Prediction from Whole-Genome Sequence Data: Impact of Sequencing Design on Genotype Imputation and Accuracy of Predictions. Heredity 112, 39–47. doi:10.1038/hdy.2013.13
Fridley, B. L., Jenkins, G., Deyo-Svendsen, M. E., Hebbring, S., and Freimuth, R. (2010). Utilizing Genotype Imputation for the Augmentation of Sequence Data. PLoS One 5, e11018. doi:10.1371/journal.pone.0011018
Frischknecht, M., Meuwissen, T. H. E., Bapst, B., Seefried, F. R., Flury, C., Garrick, D., et al. (2018). Short Communication: Genomic Prediction Using Imputed Whole-Genome Sequence Variants in Brown Swiss Cattle. J. Dairy Sci. 101 (2), 1292–1296. doi:10.3168/jds.2017-12890
Georges, M. (2014). Towards Sequence-Based Genomic Selection of Cattle. Nat. Genet. 46, 807–809. doi:10.1038/ng.3048
Guo, G., Zhao, F., Wang, Y., Zhang, Y., Du, L., and Su, G. (2014). Comparison of Single-Trait and Multiple-Trait Genomic Prediction Models. BMC Genet. 15, 30. doi:10.1186/1471-2156-15-30
Hayes, B., Daetwyler, H., Fries, R., Guldbrandtsen, B., Sando Lund, M., Boichard, D., et al. (2013). The 1000 Bull Genomes Project toward Genomic Selection from Whole Genome Sequence Data in Dairy and Beef Cattle. San Diego, CA, USA: Plant and Animal Genome XXI Conference.
Hayes, B. J., and Daetwyler, H. D. (2019). 1000 Bull Genomes Project to Map Simple and Complex Genetic Traits in Cattle: Applications and Outcomes. Annu. Rev. Anim. Biosci. 7, 89–102. doi:10.1146/annurev-animal-020518-115024
Hickey, J. M. (2013). Sequencing Millions of Animals for Genomic Selection 2.0. J. Anim. Breed. Genet. 130, 331–332. doi:10.1111/jbg.12054
Hui, R., D’Atanasio, E., Cassidy, L. M., Scheib, C. L., and Kivisild, T. (2020). Evaluating Genotype Imputation Pipeline for Ultra-low Coverage Ancient Genomes. Sci. Rep. 10, 18542. doi:10.1038/s41598-020-75387-w
Jia, Y., and Jannink, J.-L. (2012). Multiple-trait Genomic Selection Methods Increase Genetic Value Prediction Accuracy. Genetics 192, 1513–1522. doi:10.1534/genetics.112.144246
Jiang, Y., Jiang, Y., Wang, S., Zhang, Q., and Ding, X. (2019). Optimal Sequencing Depth Design for Whole Genome Re-sequencing in Pigs. BMC Bioinformatics 20, 556. doi:10.1186/s12859-019-3164-z
Li, H. (2011). A Statistical Framework for SNP Calling, Mutation Discovery, Association Mapping and Population Genetical Parameter Estimation from Sequencing Data. Bioinformatics 27, 2987–2993. doi:10.1093/bioinformatics/btr509
Li, H., and Durbin, R. (2009). Fast and Accurate Short Read Alignment with Burrows-Wheeler Transform. Bioinformatics 25, 1754–1760. doi:10.1093/bioinformatics/btp324
Li, H., Handsaker, B., Wysoker, A., Fennell, T., Ruan, J., Homer, N., et al. (2009). The Sequence Alignment/Map Format and SAMtools. Bioinformatics 25, 2078–2079. doi:10.1093/bioinformatics/btp352
Liu, S., Huang, S., Chen, F., Zhao, L., Yuan, Y., Francis, S. S., et al. (2018). Genomic Analyses from Non-invasive Prenatal Testing Reveal Genetic Associations, Patterns of Viral Infections, and Chinese Population History. Cell 175, 347–359.e14. doi:10.1016/j.cell.2018.08.016
MacLeod, I. M., Bowman, P. J., Vander Jagt, C. J., Haile-Mariam, M., Kemper, K. E., Chamberlain, A. J., et al. (2016). Exploiting Biological Priors and Sequence Variants Enhances QTL Discovery and Genomic Prediction of Complex Traits. BMC Genomics 17, 144. doi:10.1186/s12864-016-2443-6
Madsen, P., Jensen, J., Labouriau, R., Christensen, O. F., and Sahana, G. (2014). “DMU - A Package for Analyzing Multivariate Mixed Models in Quantitative Genetics and Genomics,” in Proceedings, 10th World Congress of Genetics Applied to Livestock Production, 2014 (Vancouver, Canada.
Meuwissen, T., and Goddard, M. (2010). Accurate Prediction of Genetic Values for Complex Traits by Whole-Genome Resequencing. Genetics 185, 623–631. doi:10.1534/genetics.110.116590
Meuwissen, T. H. E., Hayes, B. J., and Goddard, M. E. (2001). Prediction of Total Genetic Value Using Genome-wide Dense Marker Maps. Genetics 157, 1819–1829. doi:10.1093/genetics/157.4.1819
Nicod, J., Davies, R. W., Cai, N., Hassett, C., Goodstadt, L., Cosgrove, C., et al. (2016). Genome-wide Association of Multiple Complex Traits in Outbred Mice by Ultra-low-coverage Sequencing. Nat. Genet. 48, 912–918. doi:10.1038/ng.3595
Ober, U., Ayroles, J. F., Stone, E. A., Richards, S., Zhu, D., Gibbs, R. A., et al. (2012). Using Whole-Genome Sequence Data to Predict Quantitative Trait Phenotypes in Drosophila melanogaster. Plos Genet. 8 (5), e1002685. doi:10.1371/journal.pgen.1002685
Pasaniuc, B., Rohland, N., McLaren, P. J., Garimella, K., Zaitlen, N., Li, H., et al. (2012). Extremely Low-Coverage Sequencing and Imputation Increases Power for Genome-wide Association Studies. Nat. Genet. 44, 631–635. doi:10.1038/ng.2283
Pérez-Enciso, M. (2014). Genomic Relationships Computed from Either Next-Generation Sequence or Array SNP Data. J. Anim. Breed. Genet. 131, 85–96. doi:10.1111/jbg.12074
Pérez-Enciso, M., Rincón, J. C., and Legarra, A. (2015). Sequence- vs. Chip-Assisted Genomic Selection: Accurate Biological Information Is Advised. Genet. Sel. Evol. 47, 43. doi:10.1186/s12711-015-0117-5
Rashkin, S., Jun, G., Chen, S., and Abecasis, G. R. (2017). Optimal Sequencing Strategies for Identifying Disease-Associated Singletons. Plos Genet. 13, e1006811. doi:10.1371/journal.pgen.1006811
Ros-Freixedes, R., Gonen, S., Gorjanc, G., and Hickey, J. M. (2017). A Method for Allocating Low-Coverage Sequencing Resources by Targeting Haplotypes rather Than Individuals. Genet. Sel. Evol. 49, 78. doi:10.1186/s12711-017-0353-y
Schaeffer, L. R. (2006). Strategy for Applying Genome-wide Selection in Dairy Cattle. J. Anim. Breed. Genet. 123, 218–223. doi:10.1111/j.1439-0388.2006.00595.x
Stock, K., and Reents, R. (2013). Genomic Selection: Status in Different Species and Challenges for Breeding. Reprod. Dom Anim. 48 (Suppl. 1), 2–10. doi:10.1111/rda.12201
Su, G., Brøndum, R. F., Ma, P., Guldbrandtsen, B., Aamand, G. P., and Lund, M. S. (2012). Comparison of Genomic Predictions Using Medium-Density (∼54,000) and High-Density (∼777,000) Single Nucleotide Polymorphism Marker Panels in Nordic Holstein and Red Dairy Cattle Populations. J. Dairy Sci. 95, 4657–4665. doi:10.3168/jds.2012-5379
van Binsbergen, R., Calus, M. P. L., Bink, M. C. A. M., van Eeuwijk, F. A., Schrooten, C., and Veerkamp, R. F. (2015). Genomic Prediction Using Imputed Whole-Genome Sequence Data in Holstein Friesian Cattle. Genet. Sel. Evol. 47, 71. doi:10.1186/s12711-015-0149-x
VanRaden, P. M. (2008). Efficient Methods to Compute Genomic Predictions. J. Dairy Sci. 91, 4414–4423. doi:10.3168/jds.2007-0980
VanRaden, P. M., Null, D. J., Sargolzaei, M., Wiggans, G. R., Tooker, M. E., Cole, J. B., et al. (2013). Genomic Imputation and Evaluation Using High-Density Holstein Genotypes. J. Dairy Sci. 96, 668–678. doi:10.3168/jds.2012-5702
VanRaden, P. M., O'Connell, J. R., Wiggans, G. R., and Weigel, K. A. (2011). Genomic Evaluations with many More Genotypes. Genet. Sel. Evol. 43, 10. doi:10.1186/1297-9686-43-10
Wang, C., Li, H., Guo, Y., Huang, J., Sun, Y., Min, J., et al. (2020a). Donkey Genomes Provide New Insights into Domestication and Selection for Coat Color. Nat. Commun. 11, 6014. doi:10.1038/s41467-020-19813-7
Wang, D., Tang, H., Liu, J.-F., Xu, S., Zhang, Q., and Ning, C. (2020b). Rapid Epistatic Mixed-Model Association Studies by Controlling Multiple Polygenic Effects. Bioinformatics 36, 4833–4837. doi:10.1093/bioinformatics/btaa610
Wiggans, G. R., Cole, J. B., Hubbard, S. M., and Sonstegard, T. S. (2017). Genomic Selection in Dairy Cattle: The USDA Experience. Annu. Rev. Anim. Biosci. 5, 309–327. doi:10.1146/annurev-animal-021815-111422
Keywords: dezhou donkey, low coverage whole genome sequencing, genotype imputation, genomic prediction, GBLUP
Citation: Zhao C, Teng J, Zhang X, Wang D, Zhang X, Li S, Jiang X, Li H, Ning C and Zhang Q (2021) Towards a Cost-Effective Implementation of Genomic Prediction Based on Low Coverage Whole Genome Sequencing in Dezhou Donkey. Front. Genet. 12:728764. doi: 10.3389/fgene.2021.728764
Received: 22 June 2021; Accepted: 20 September 2021;
Published: 03 November 2021.
Edited by:
Ruidong Xiang, The University of Melbourne, AustraliaReviewed by:
Irene Van Den Berg, Agriculture Victoria, AustraliaJohannes W. R. Martini, International Maize and Wheat Improvement Center, Mexico
Copyright © 2021 Zhao, Teng, Zhang, Wang, Zhang, Li, Jiang, Li, Ning and Zhang. This is an open-access article distributed under the terms of the Creative Commons Attribution License (CC BY). The use, distribution or reproduction in other forums is permitted, provided the original author(s) and the copyright owner(s) are credited and that the original publication in this journal is cited, in accordance with accepted academic practice. No use, distribution or reproduction is permitted which does not comply with these terms.
*Correspondence: Chao Ning, ningchao@sdau.edu.cn; Qin Zhang, qzhang@sdau.edu.cn