 Songling Han1,2†
 Wei Zhu1,3†Weili Yang4†
 Qijie Guan2Chao Chen4Qiang He5Zhuoheng Zhong2
 Ruoke Zhao2Hangming Xiong2
 Haote Han1
 Yaohan Li2Zijian Sun2
 Xingjiang Hu6*
 Jingkui Tian1,2*
- 1The Cancer Hospital of the University of Chinese Academy of Sciences (Zhejiang Cancer Hospital), Institute of Basic Medicine and Cancer (IBMC), Chinese Academy of Sciences, Hangzhou, China
- 2College of Biomedical Engineering and Instrument Science, Zhejiang University, Hangzhou, China
- 3Changshu Qiushi Technology Co., Ltd., Suzhou, China
- 4Department of Gastrointestinal Surgery, The First Affiliated Hospital, Zhejiang University School of Medicine, Hangzhou, China
- 5Department of Nephrology, Zhejiang Provincial People’s Hospital, Hangzhou, China
- 6Zhejiang Provincial Key Laboratory for Drug Evaluation and Clinical Research, The First Affiliated Hospital, Zhejiang University School of Medicine, Hangzhou, China
Background: Stomach adenocarcinoma (STAD) is the most common histological type of stomach cancer, which causes a considerable number of deaths worldwide. This study aimed to identify its potential biomarkers with the notion of revealing the underlying molecular mechanisms.
Methods: Gene expression profile microarray data were downloaded from the Gene Expression Omnibus (GEO) database. The “limma” R package was used to screen the differentially expressed genes (DEGs) between STAD and matched normal tissues. The Database for Annotation, Visualization, and Integrated Discovery (DAVID) was used for function enrichment analyses of DEGs. The STAD dataset from The Cancer Genome Atlas (TCGA) database was used to identify a prognostic gene signature, which was verified in another STAD dataset from the GEO database. CIBERSORT algorithm was used to characterize the 22 human immune cell compositions. The expression of LRFN4 and CTHRC1 in tissues was determined by quantitative real-time PCR from the patients recruited to the present study.
Results: Three public datasets including 90 STAD patients and 43 healthy controls were analyzed, from which 44 genes were differentially expressed in all three datasets. These genes were implicated in biological processes including cell adhesion, wound healing, and extracellular matrix organization. Five out of 44 genes showed significant survival differences. Among them, CTHRC1 and LRFN4 were selected for construction of prognostic signature by univariate Cox regression and stepwise multivariate Cox regression in the TCGA-STAD dataset. The fidelity of the signature was evaluated in another independent dataset and showed a good classification effect. The infiltration levels of multiple immune cells between high-risk and low-risk groups had significant differences, as well as two immune checkpoints. TIM-3 and PD-L2 were highly correlated with the risk score. Multiple signaling pathways differed between the two groups of patients. At the same time, the expression level of LRFN4 and CTHRC1 in tissues analyzed by quantitative real-time PCR were consistent with the in silico findings.
Conclusion: The present study constructed the prognostic signature by expression of CTHRC1 and LRFN4 for the first time via comprehensive bioinformatics analysis, which provided the potential therapeutic targets of STAD for clinical treatment.
Introduction
Stomach adenocarcinoma (STAD), the most common histological type (∼95%) of malignancy originating in the stomach, imposed a considerable global health burden (Ajani et al., 2017). So far, there is no sensitive and specific diagnostic marker for early diagnosis of STAD (Duffy et al., 2014). Although several drugs, such as trastuzumab, ramucirumab, and immune checkpoint inhibitors, had been used for the treatment of STAD in clinics, the survival rates of patients in advanced stages remained low (Bang et al., 2010; Fuchs et al., 2014, 2018). Therefore, it is urgent to identify novel prognostic biomarkers for STAD.
Over the past decades, the high-throughput sequencing generated large-scale biological data, and it has been an effective tool for discovering promising biomarkers for cancer (Jiang and Liu, 2015). Many biomarkers such as AFP, EGFR, and HER2 were discovered through bioinformatic analysis (Tateishi et al., 2008; Vizoso et al., 2015; Alix-Panabières and Pantel, 2016). Several predictive signatures of gene expression had great significance in clinical prognosis applications as well as biomarker identification. For example, Long et al. (2018) constructed a prognostic signature for patients with hepatocellular carcinoma based on RNA sequencing data. Furthermore, a five-gene signature-derived risk score module based on data from The Cancer Genome Atlas (TCGA) databases accurately predicted gastric cancer (GC) prognosis (Zhao et al., 2019). Identification of genes that significantly correlated with progression in STAD patients might be applicable for establishing robust module as well, which could provide prognosis for STAD treatment; however, it has not been investigated.
In the present study, we analyzed the mRNA expression profiles of STAD from the Gene Expression Omnibus (GEO) database for screening of the differentially expressed genes (DEGs). Then, gene ontology (GO) analysis was conducted to reveal the main biological functions modulated by these DEGs. Through the correlation analysis of patients’ survival information with STAD from TCGA, the candidate genes closely related to the survival rate of patients were identified. Cox analysis was performed for evaluating mRNAs correlation with survival rates and construction of a two-gene signature that indicates the relationship to immune system responses. In addition, another independent dataset was analyzed to verify the prognostic effect of the signature. The results indicated that the high-risk group was associated with tumor-associated pathways based on the two-gene signature derived risk score signature. The expression of these two genes was further verified in the recruited patients using quantitative real-time polymerase chain reaction (qRT-PCR).
Materials and Methods
Data Collection and Screening of DEGs
Gene expression profile microarray data (GSE118916 of 15 STAD and 15 healthy tissues, GSE13861 of 65 STAD and 19 healthy tissues, and GSE103236 of 10 STAD and 9 healthy tissues) were downloaded from the GEO database.1 The “limma” R package was used to screen the DEGs between STAD and matched normal tissues (Ritchie et al., 2015). Adjusted p-value < 0.05 and | log2 fold change (FC)| > 1 were set as the thresholds for DEGs identification. p-value adjustment used the built-in correction method of limma package.
GO Enrichment Analyses
The Database for Annotation, Visualization, and Integrated Discovery (DAVID)2 was used for biological process (BP), cellular component (CC), and molecular function (MF) enrichment analyses of DEGs (Huang et al., 2007). p-value < 0.05 was used to screen statistically significant terms. The background gene set used the intersection of the gene expression lists of GSE118916, GSE13861, and GSE103236 to replace the default gene set.
TCGA Data Analysis and Survival Analysis of DEGs
The data of STAD cases with both RNA sequencing and clinical information of TCGA were obtained from the Genomic Data Commons (GDC) data portal.3 The information on molecular subtype was obtained from previous studies (Adam et al., 2014; Rooney et al., 2015; Hause et al., 2016; Davoli et al., 2017). Cases with missing clinical information were deleted and 370 cases were retained. The mRNA high-level and low-level grouping was based on the median expression value of the mRNA. Survival curves were analyzed by the Kaplan–Meier method (Guyot et al., 2012). p-value < 0.05 was considered as statistically significant data.
Construction and Validation of Prognostic Signature
We used R 3.6.2 with “survival” package to univariate Cox regression analysis and multivariate Cox regression. To reduce the number of mRNAs with similar expressions, mRNAs with p-value < 0.05 of univariate Cox regression were subjected to a stepwise multivariate Cox regression for construction of the prognostic signature. This signature was used to evaluate the survival prognosis of patients in TCGA-STAD datasets using a Kaplan–Meier curve, and log-rank test according to median value grouping of risk score. Reliability of the prognostic signature was assessed using the area under the curve (AUC) of the receiver operating characteristic (ROC) curve. Gene expression profile microarray data (GSE15459 of 200 gastric cancer cases; only 192 patients have clinical information) were downloaded from the GEO database to validate the reliability and prognostic value of two-gene signature using the ROC and Kaplan–Meier curves.
Assessment of Immune Infiltration
We used the CIBERSORTx algorithm and the LM22 gene signature, which is a widely used approach to characterize the 22 human immune cell composition, including B cells, T cells, natural killer cells, and macrophages (Newman et al., 2019). After uploading the gene expression data with standard annotation on the CIBERSORTx web portal,4 the algorithm ran under LM22 signature and 1,000 permutations.
Gene Set Enrichment Analysis
Gene set enrichment analysis (GSEA)5 was used to identify the promising signaling pathways for the high-risk group based on the risk score module (Subramanian et al., 2005). The file (c2.cp.kegg.v7.2.symbols.gmt) was selected for use as the reference gene file. False discovery rate (FDR) q-value < 0.05 and | normalized enrichment score (NES)| > 0.7 was chosen as the cutoff criterion. The gene set used the intersection of the default gene set and detected expressed genes.
Patient Samples
A total of six STAD tissue samples and paired adjacent noncancerous tissue samples were obtained from the First Affiliated Hospital of Zhejiang University. The research has been carried out in accordance with the World Medical Association Declaration of Helsinki. It was approved by the Ethics Committee of The First Affiliated Hospital of Zhejiang University and the informed consent was obtained from all the recruited patients. All specimens had not been subjected to any preoperative radiotherapy or chemotherapy and were immediately soaked in RNA stabilization solution and stored at –80°C.
qRT-PCR Analysis
Total RNA was extracted from six pairs of STAD tissues and adjacent normal tissues frozen in liquid nitrogen with TRIzol reagent (TIANGEN, Beijing, China). The extracted mRNA was diluted according to the concentration and then reverse-transcribed into complementary DNA using a reverse transcription kit (abm, Vancouver, Canada). qRT-PCR was performed on the LightCycler96 Sequence Detection System (BIO-RAD, California, United States) with BlastTaqTM (abm). The thermocycling conditions were as follows: Initial denaturation at 95°C for 3 min, followed by 45 cycles of denaturation at 95°C for 15 s and annealing at 60°C for 1 min. The primer sequences for PCR amplification were as follows: LRFN4, forward: 5′-ACAACTTCATCCAGGCCCTG-3′, reverse: 5′-AGGATGAGGTGCTGCAGATT-3′; CTHRC1, forward: 5′-CTTGGGAAAATTGCGGAGTG-3′, reverse: 5′-TTC ATTTCAGGGCTTCCTTG-3′; GAPDH, forward: 5′-TGATGAG GAGAATTACTTGGAT-3′, reverse: 5′-CTTGGGATACTGCT TGACA-3′. The relative mRNA expression level was calculated by the 2–ΔΔCt method taking GAPDH as the reference gene.
Statistical Analysis
The Mann–Whitney test and the Student’s t-test were used for comparison between the groups, when two groups were compared. A threshold of p < 0.05 was considered statistically significant. The correlation between risk score and gene expression was evaluated by Pearson’s R and statistical significance. Gene expression data were processed by plus one and log2-transformed.
Results
Identification and Functional Enrichment of DEGs
A total of 3,860 DEGs were screened from the GSE118916 dataset by using the “limma” R package. In addition, 550 and 463 DEGs were screened from the GSE13861 and GSE103236 datasets, respectively. Volcano plots were plotted to present the distribution of DEGs between STAD and normal samples in each dataset (Figures 1A–C). Histograms were plotted to present the distribution of adjusted p-value in three datasets (Supplementary Figure 1). After the intersection, a total of 44 DEGs were identified as the intersection of the three datasets (Supplementary Table 1).
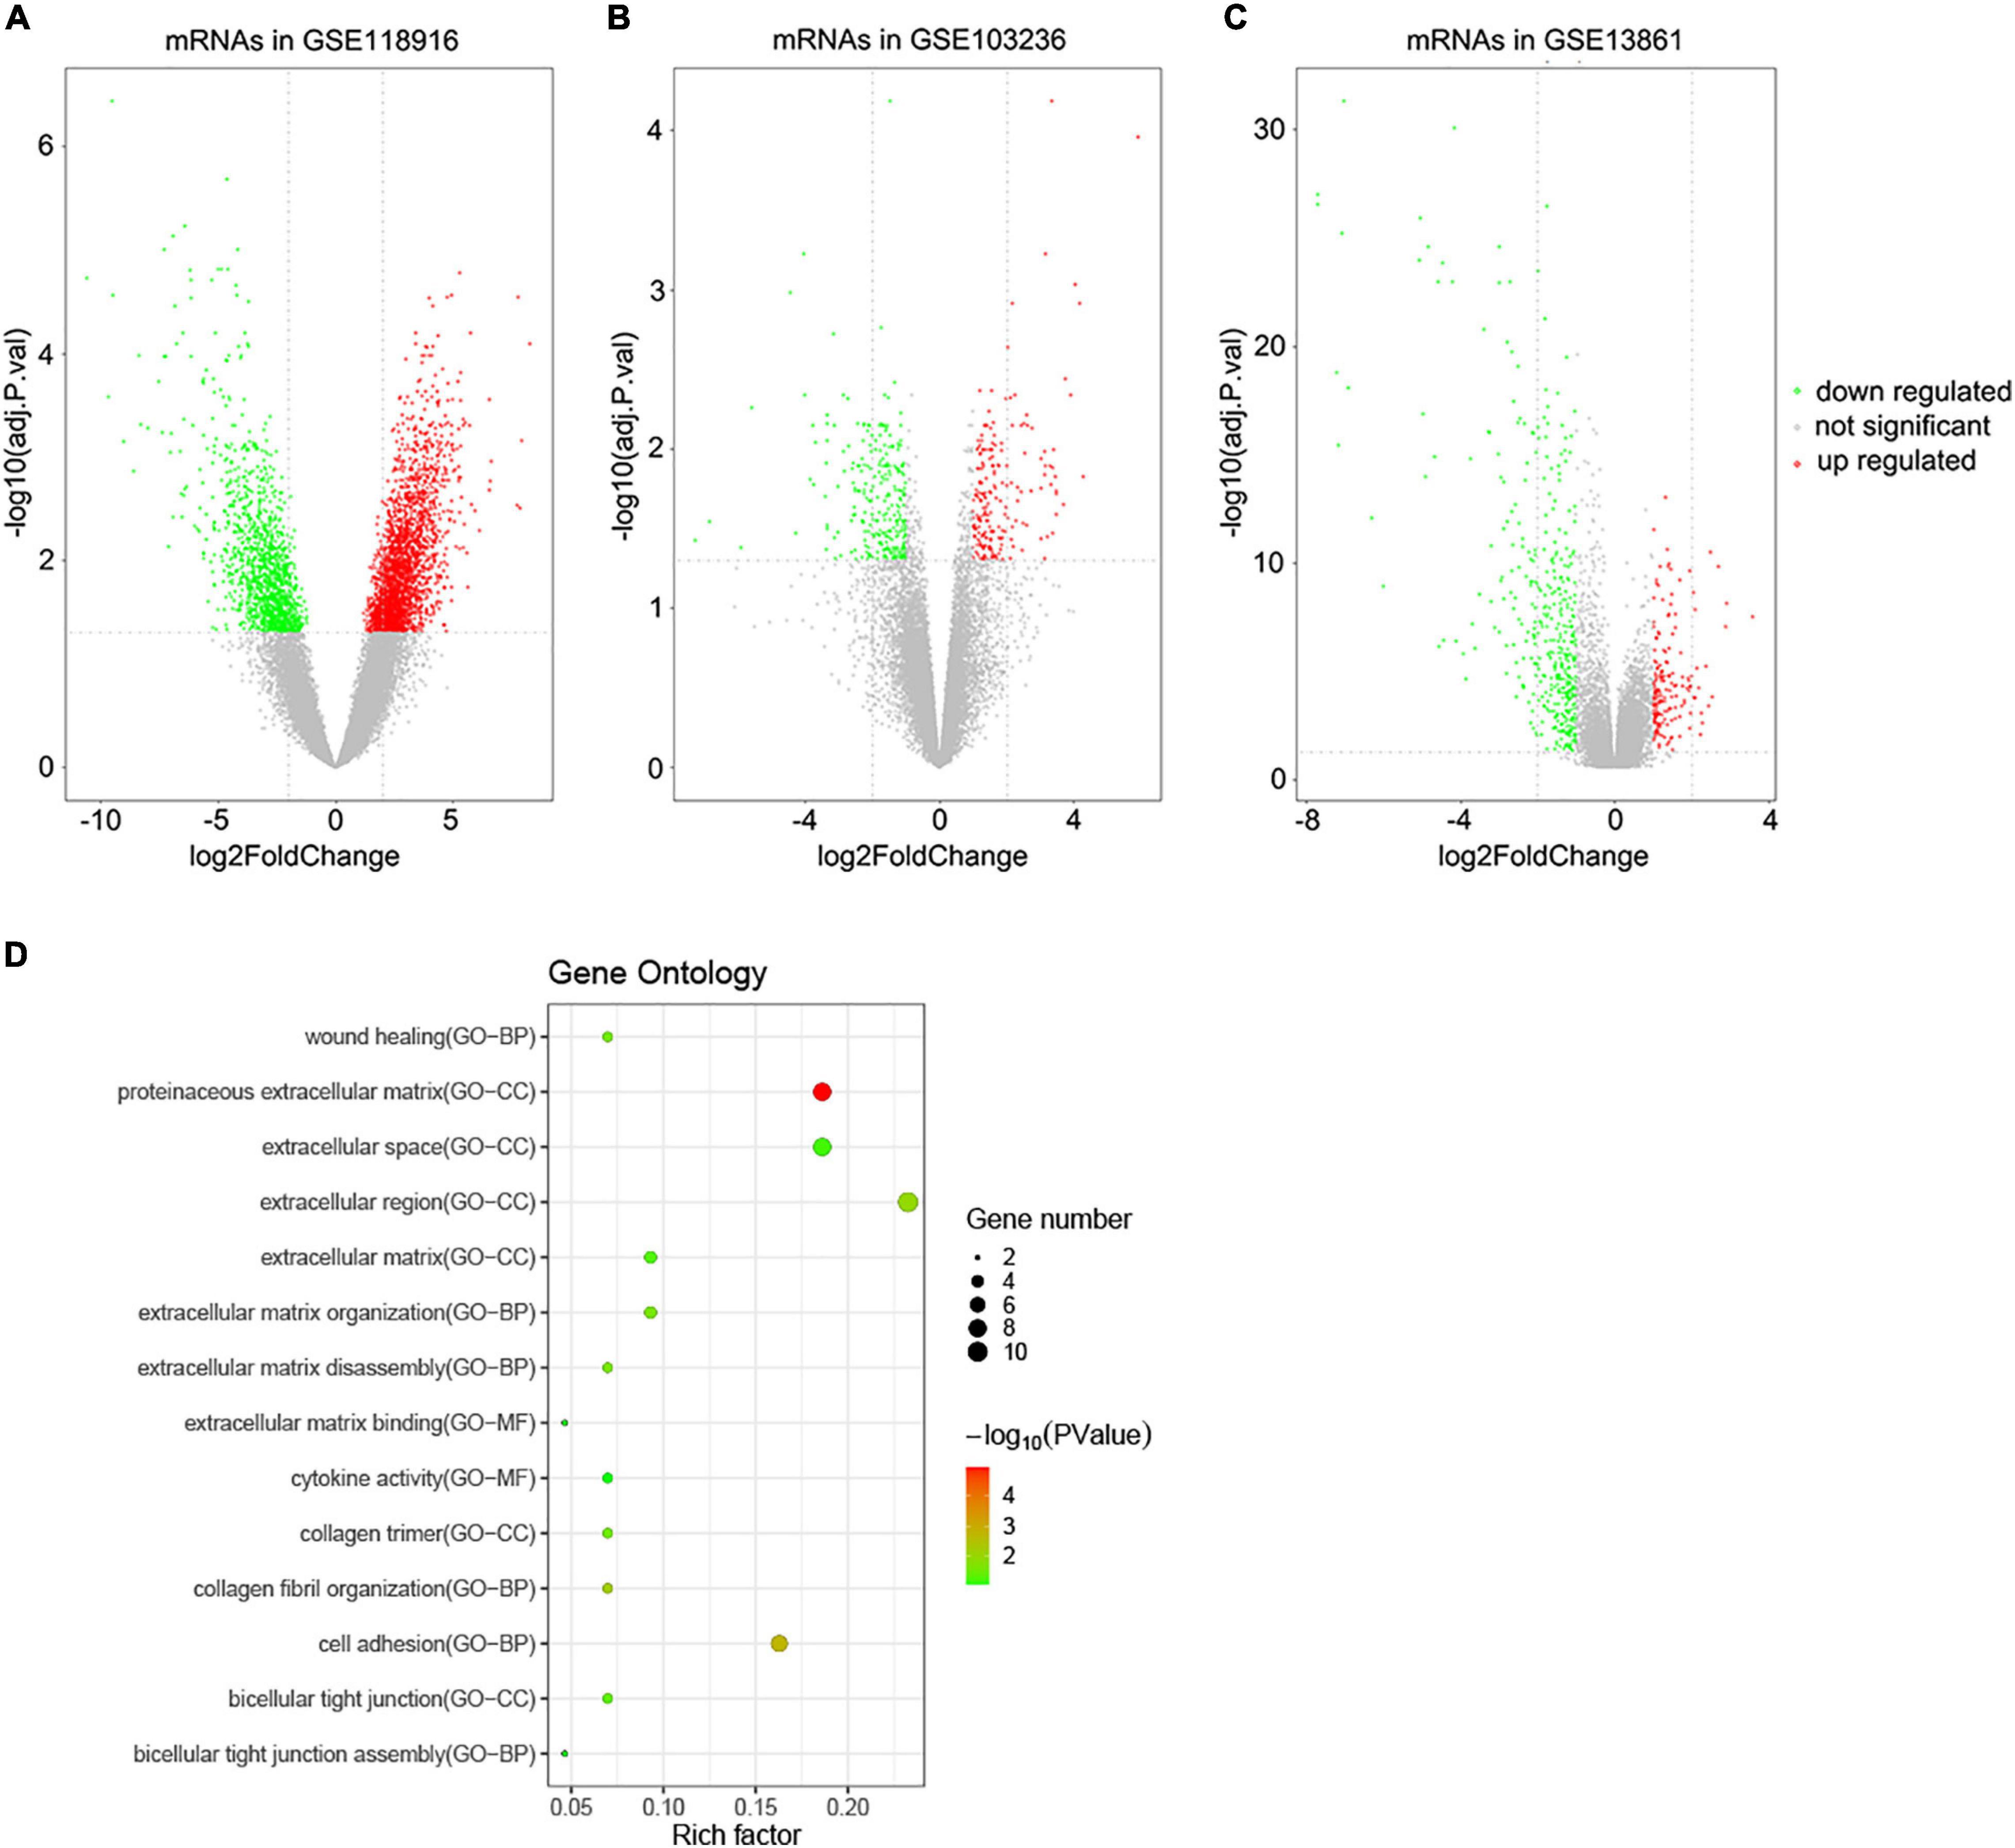
Figure 1. Volcano plots of DEGs in the three GEO datasets and functional enrichment of DEGs. (A) DEGs of the GSE118916 dataset. (B) DEGs of the GSE103036 dataset. (C) DEGs of the GSE13861 dataset. (D) Statistics of functional enrichment. CC represents cellular component, MF represents molecular function, and BP represents biological process.
To reveal the biological functions of the 44 DEGs, GO enrichment analysis was conducted with DAVID. Regarding molecular function, the GO analysis results showed that the DEGs were mainly enriched in terms related to extracellular matrix binding and cytokine activity. These DEGs were involved in cell adhesion, wound healing, and extracellular matrix organization biological processes. For cellular components, the DEGs were enriched in extracellular regions, including the proteinaceous extracellular matrix, extracellular region, and extracellular space (Figure 1D).
Survival Analysis of DEGs
To further evaluate the prognostic value of the 44 DEGs, the clinical data of patients with STAD were downloaded from the TCGA database. The overall survival of patients with STAD based on the high and low expression of DEGs was then obtained using Kaplan–Meier plotters. The results indicated that the group of low-level expression of DPT, COL5A2, and CTHRC1 and high-level expression of ECT2 and LRFN4 had a better survival in patients with STAD (Figure 2 and Supplementary Figure 2). In brief, five genes were significantly related to the prognosis of patients with STAD.
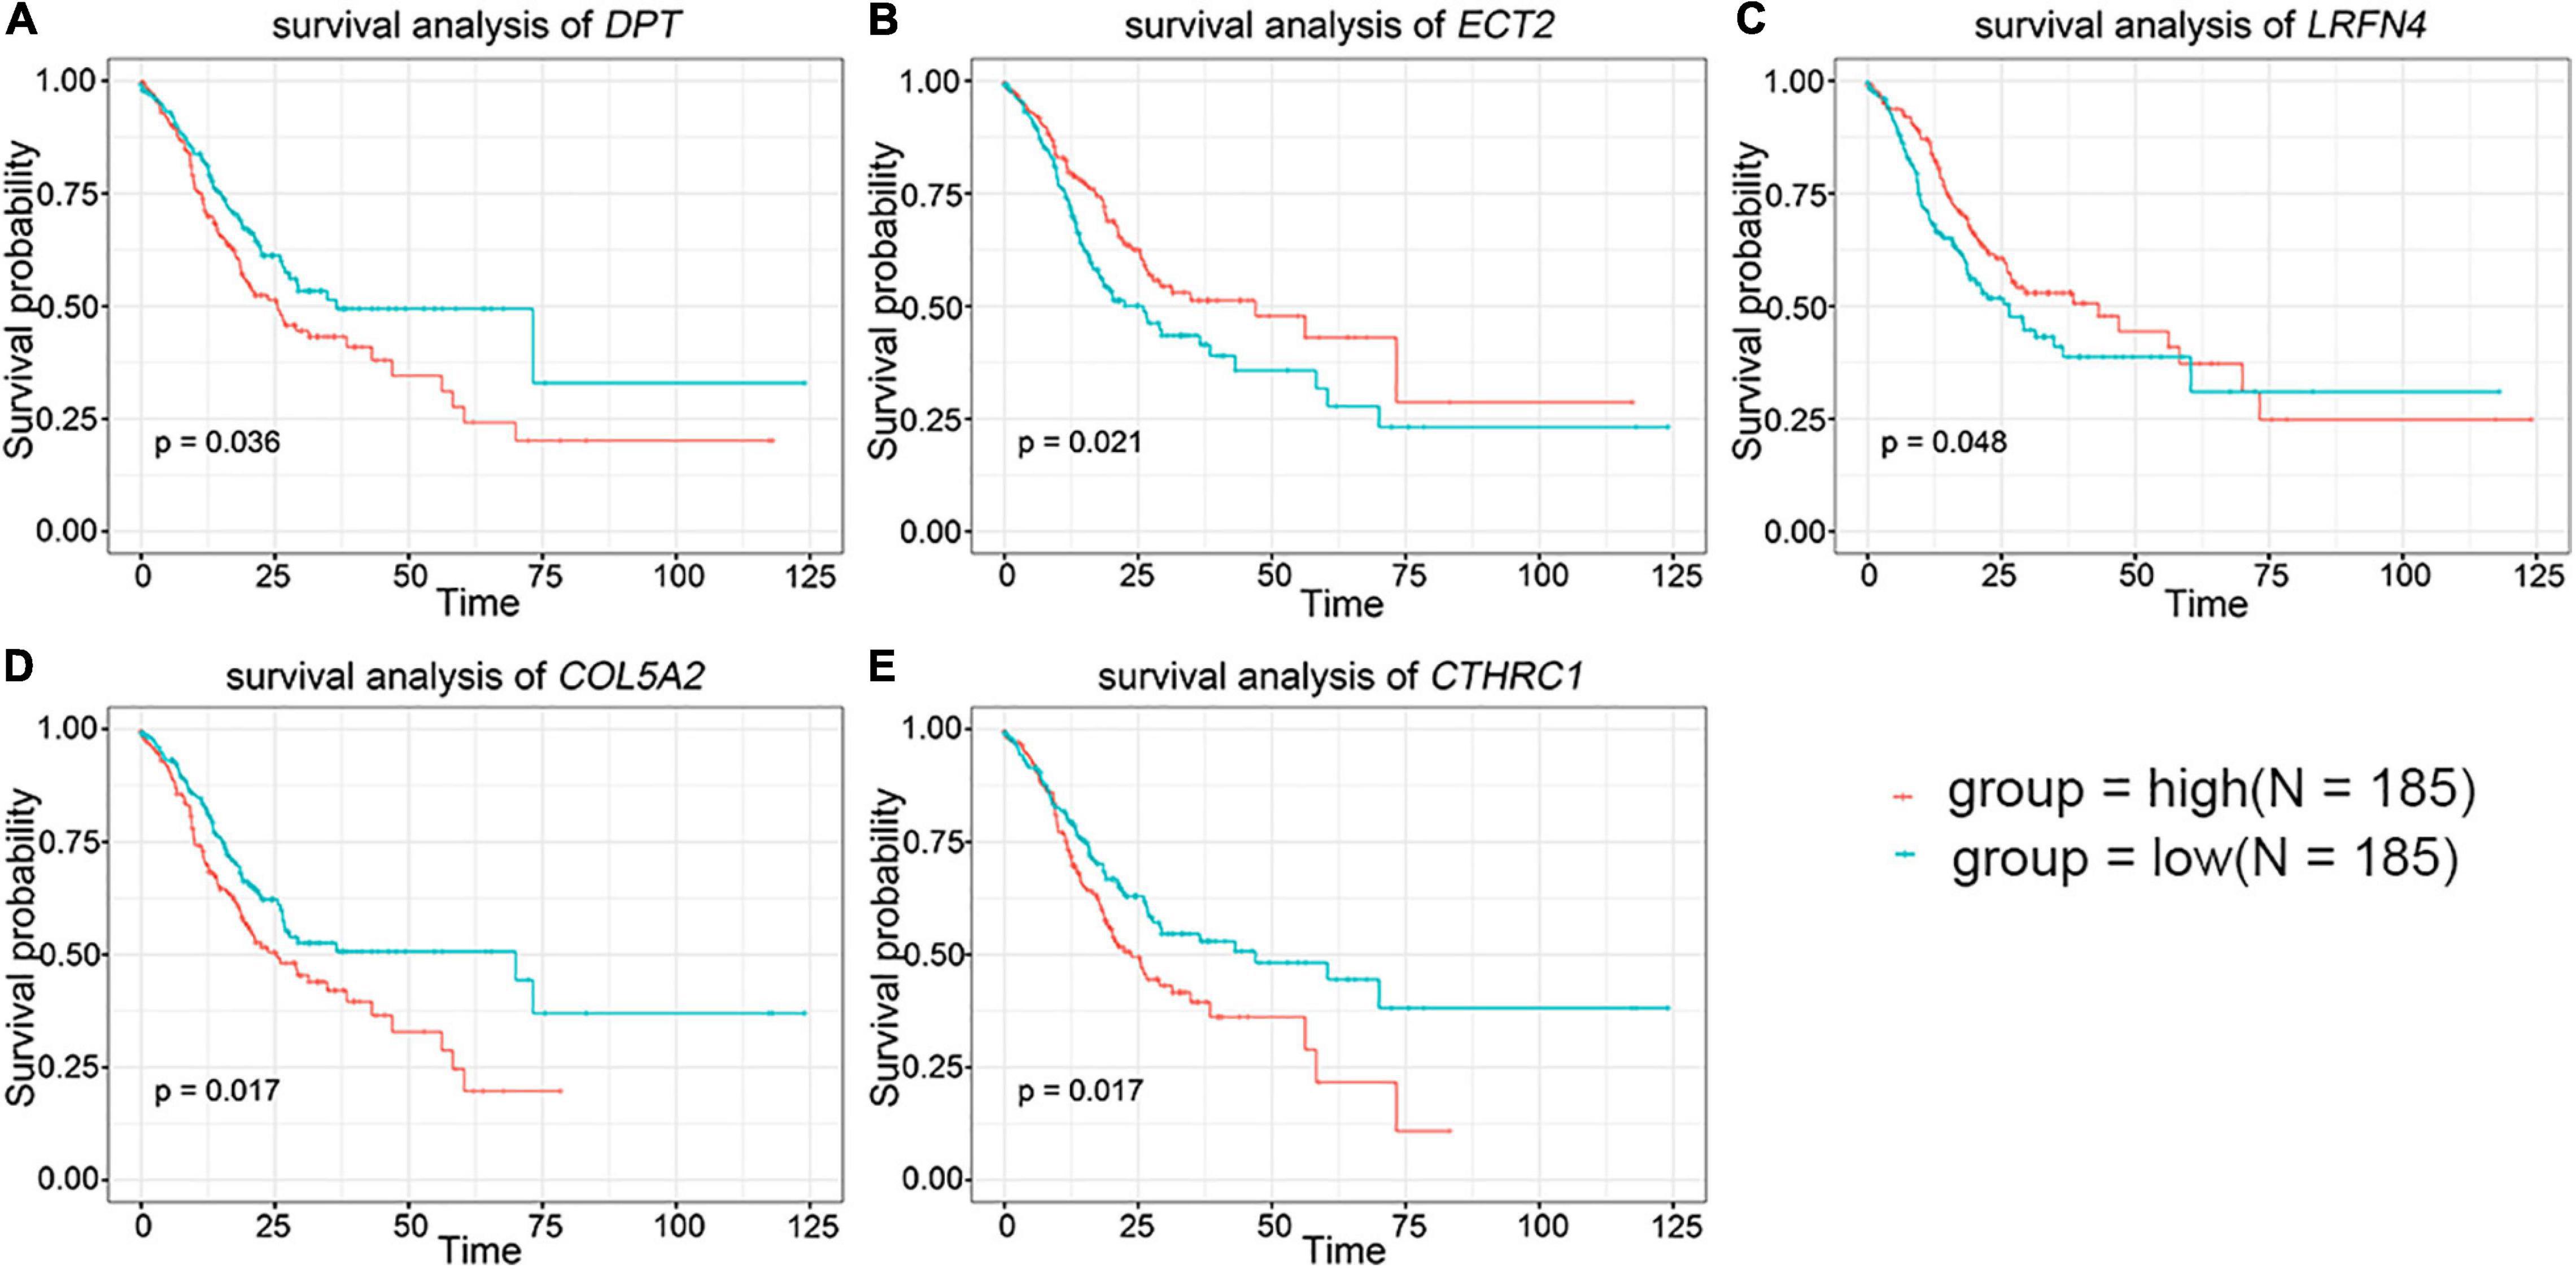
Figure 2. The prognostic value of key genes in the overall survival of stomach adenocarcinoma (STAD) patients. (A) DPT. (B) ECT2. (C) LRFN4. (D) COL5A2. (E) CTHRC1. The red lines signified individuals with high expression of gene and blue lines denoted those with low expression.
Construction and Evaluation of a Two-Gene Signature
The univariate Cox regression analysis showed that five mRNAs were associated with overall survival in the TCGA-STAD dataset (N = 370). Three mRNAs with a p-value < 0.05 were selected for further analysis (Table 1). Two (LRFN4 and CTHRC1) out of three mRNAs were screened out by stepwise multivariate Cox regression analysis (Figure 3A). Then, a two-gene signature was constructed by expression of LRFN4 and CTHRC1 and its coefficient in multivariate Cox regression as follows: Risk score = (–0.20788 × expression of LRFN4) + (0.18741 × expression of CTHRC1). According to the median value of risk scores, patients were divided into the high-risk group and the low-risk group; the high-risk group had a worse prognosis [(–0.77,0.91), median = –0.02; Figure 3B]. Remove the patients with missing age, sex, and tumor stage information and keep 344 samples for the next analysis. Risk score showed non-significant difference between early (I and II) and advanced (III and IV) stages in STAD patients, but it showed significant changes between early stage and normal (Figure 3C). The AUC-ROC of the signature for survival time was 0.641, 0.63, and 0.674 at 1, 3, and 5 years, respectively (Figures 3D–F). Multivariate Cox regression analyses also revealed that the risk score was an independent predictor of survival in TCGA datasets, after adjusting for age (<60 vs. ≥60), sex (male vs. female), tumor stage (I and II vs. III and IV), race, and molecular subtype (Figure 4).

Table 1. Prognostic value detection of the five genes in TCGA-STAD dataset.
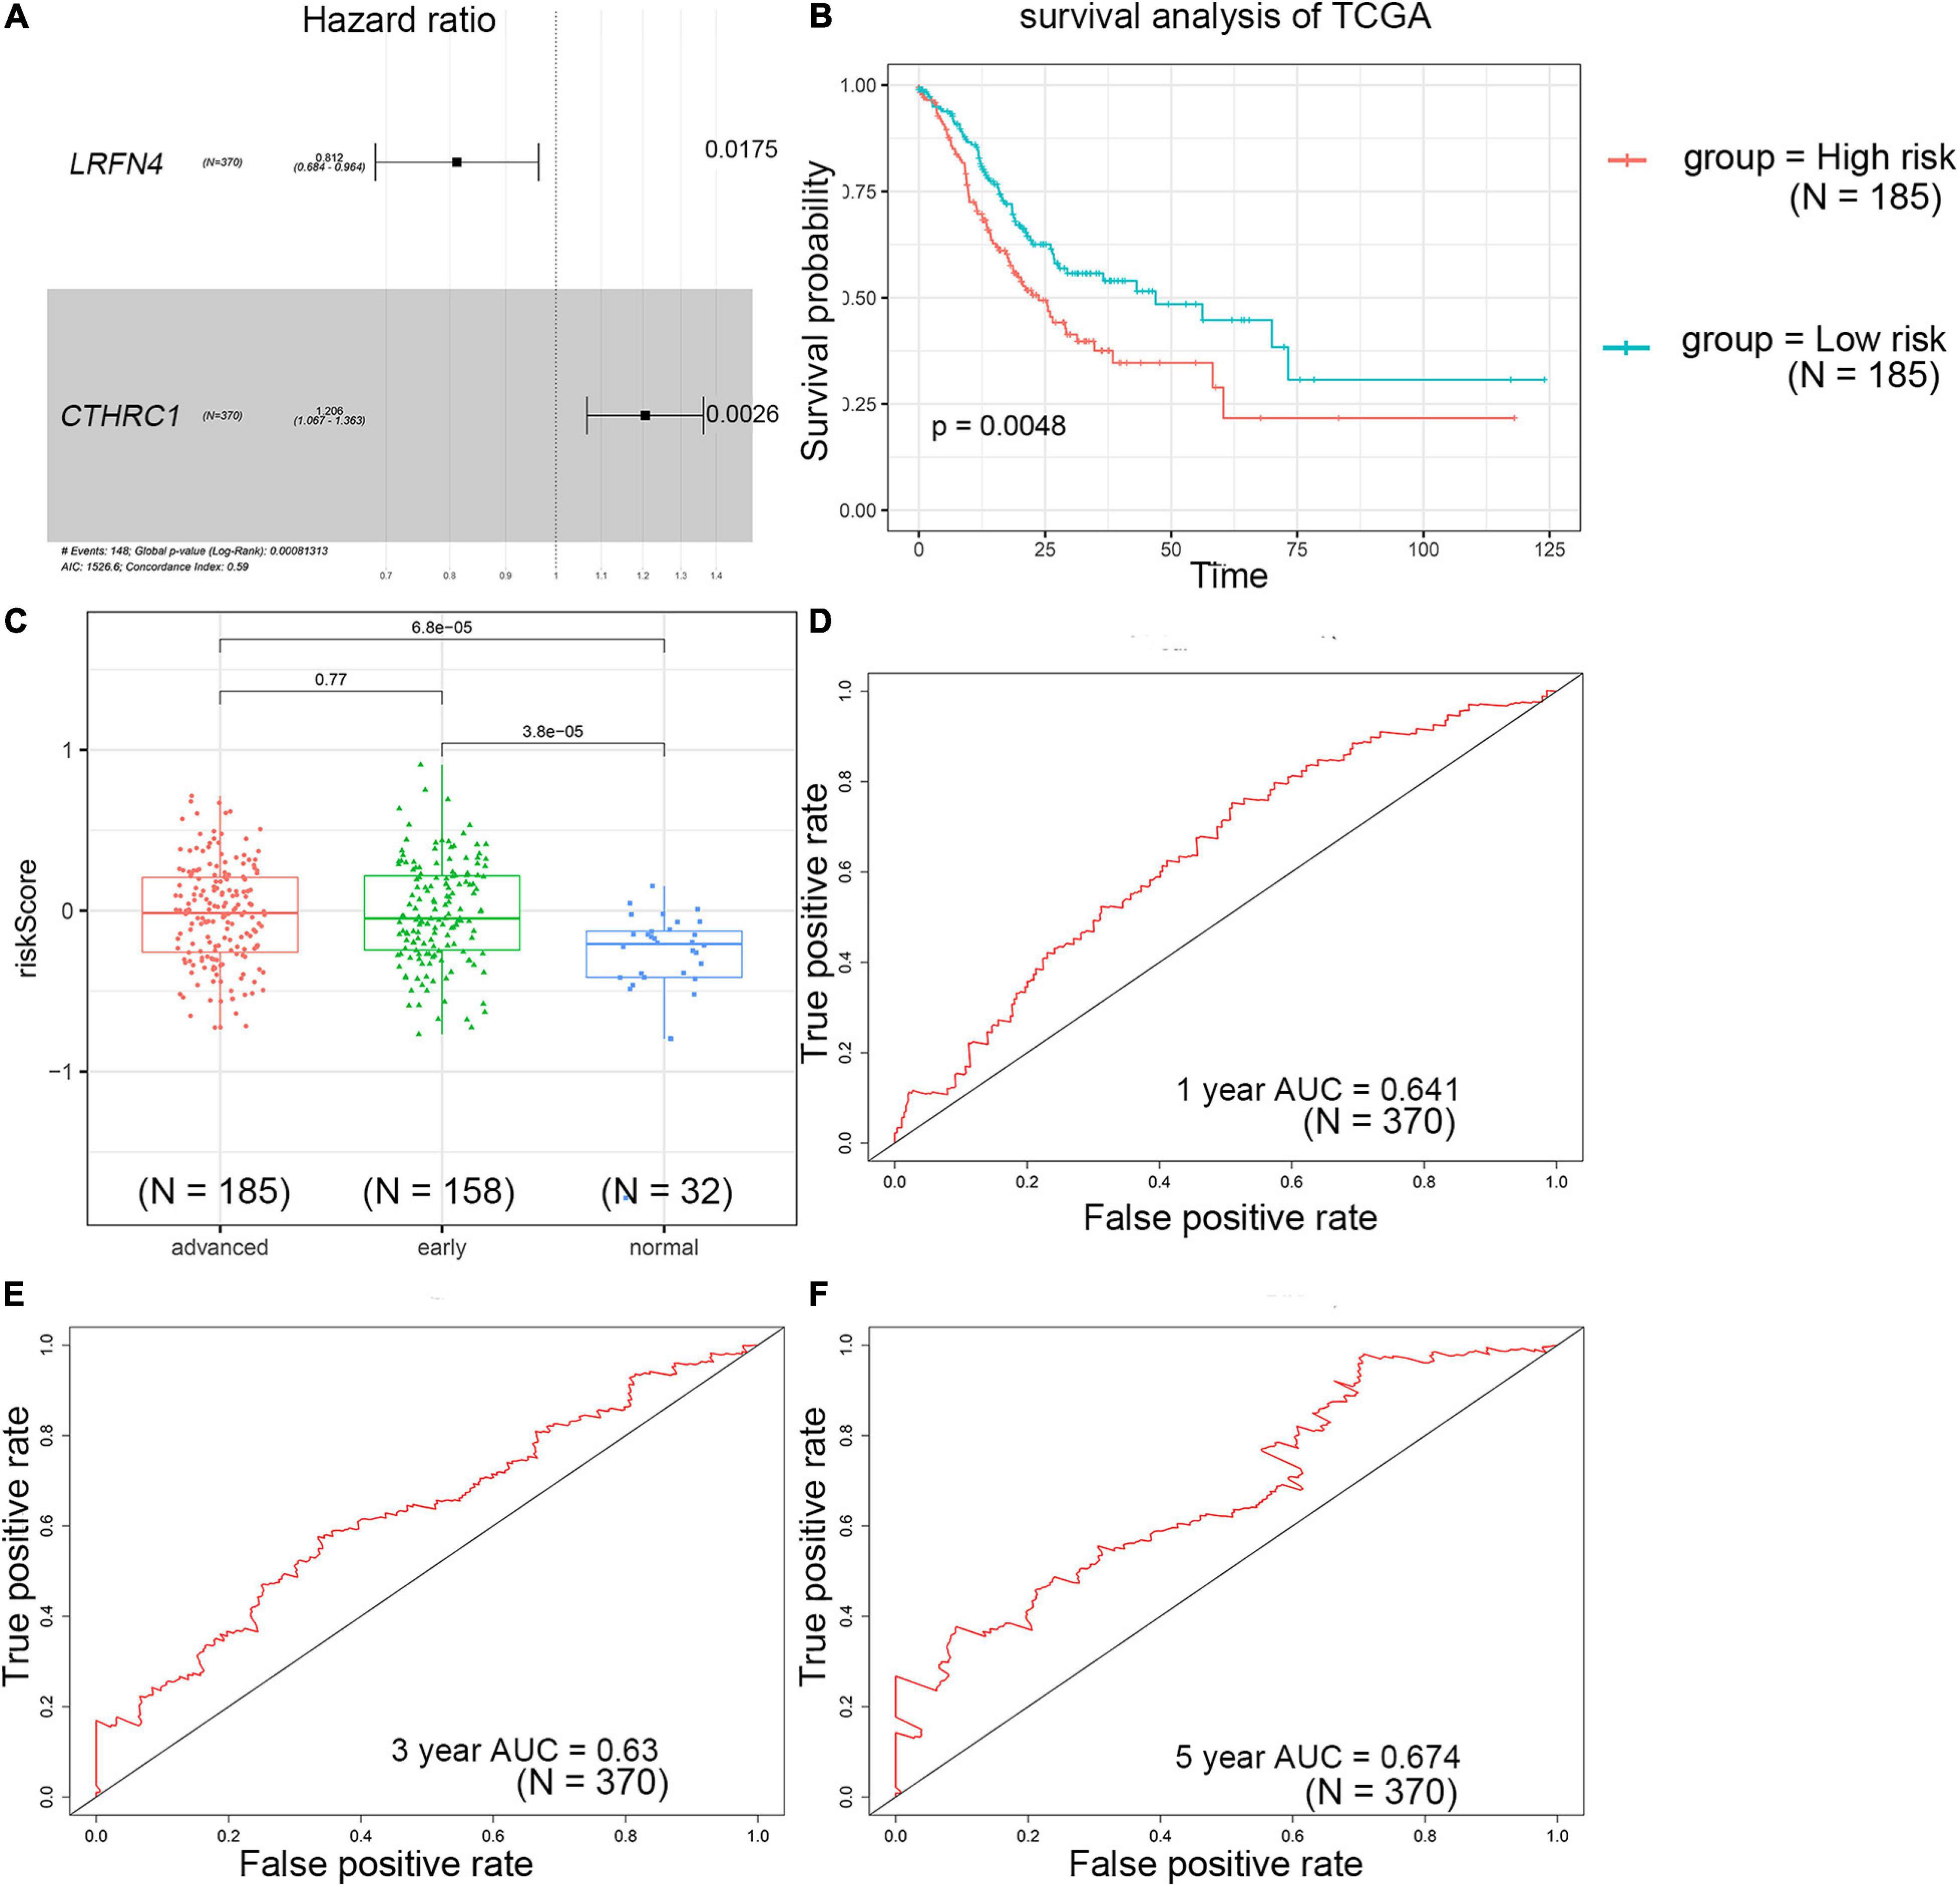
Figure 3. Prognostic value detection of LRFN4 and CTHRC1 via multivariate Cox regression analysis in patients with STAD of TCGA dataset. (A) Multivariate Cox regression analysis of LRFN4 and CTHRC1. (B) Survival analysis of the high-risk group and the low-risk group in the TCGA dataset. (C) Risk score in early stage and advanced stage of STAD in TCGA sets. (D–F) ROC curve of the prognostic signature in the TCGA dataset.
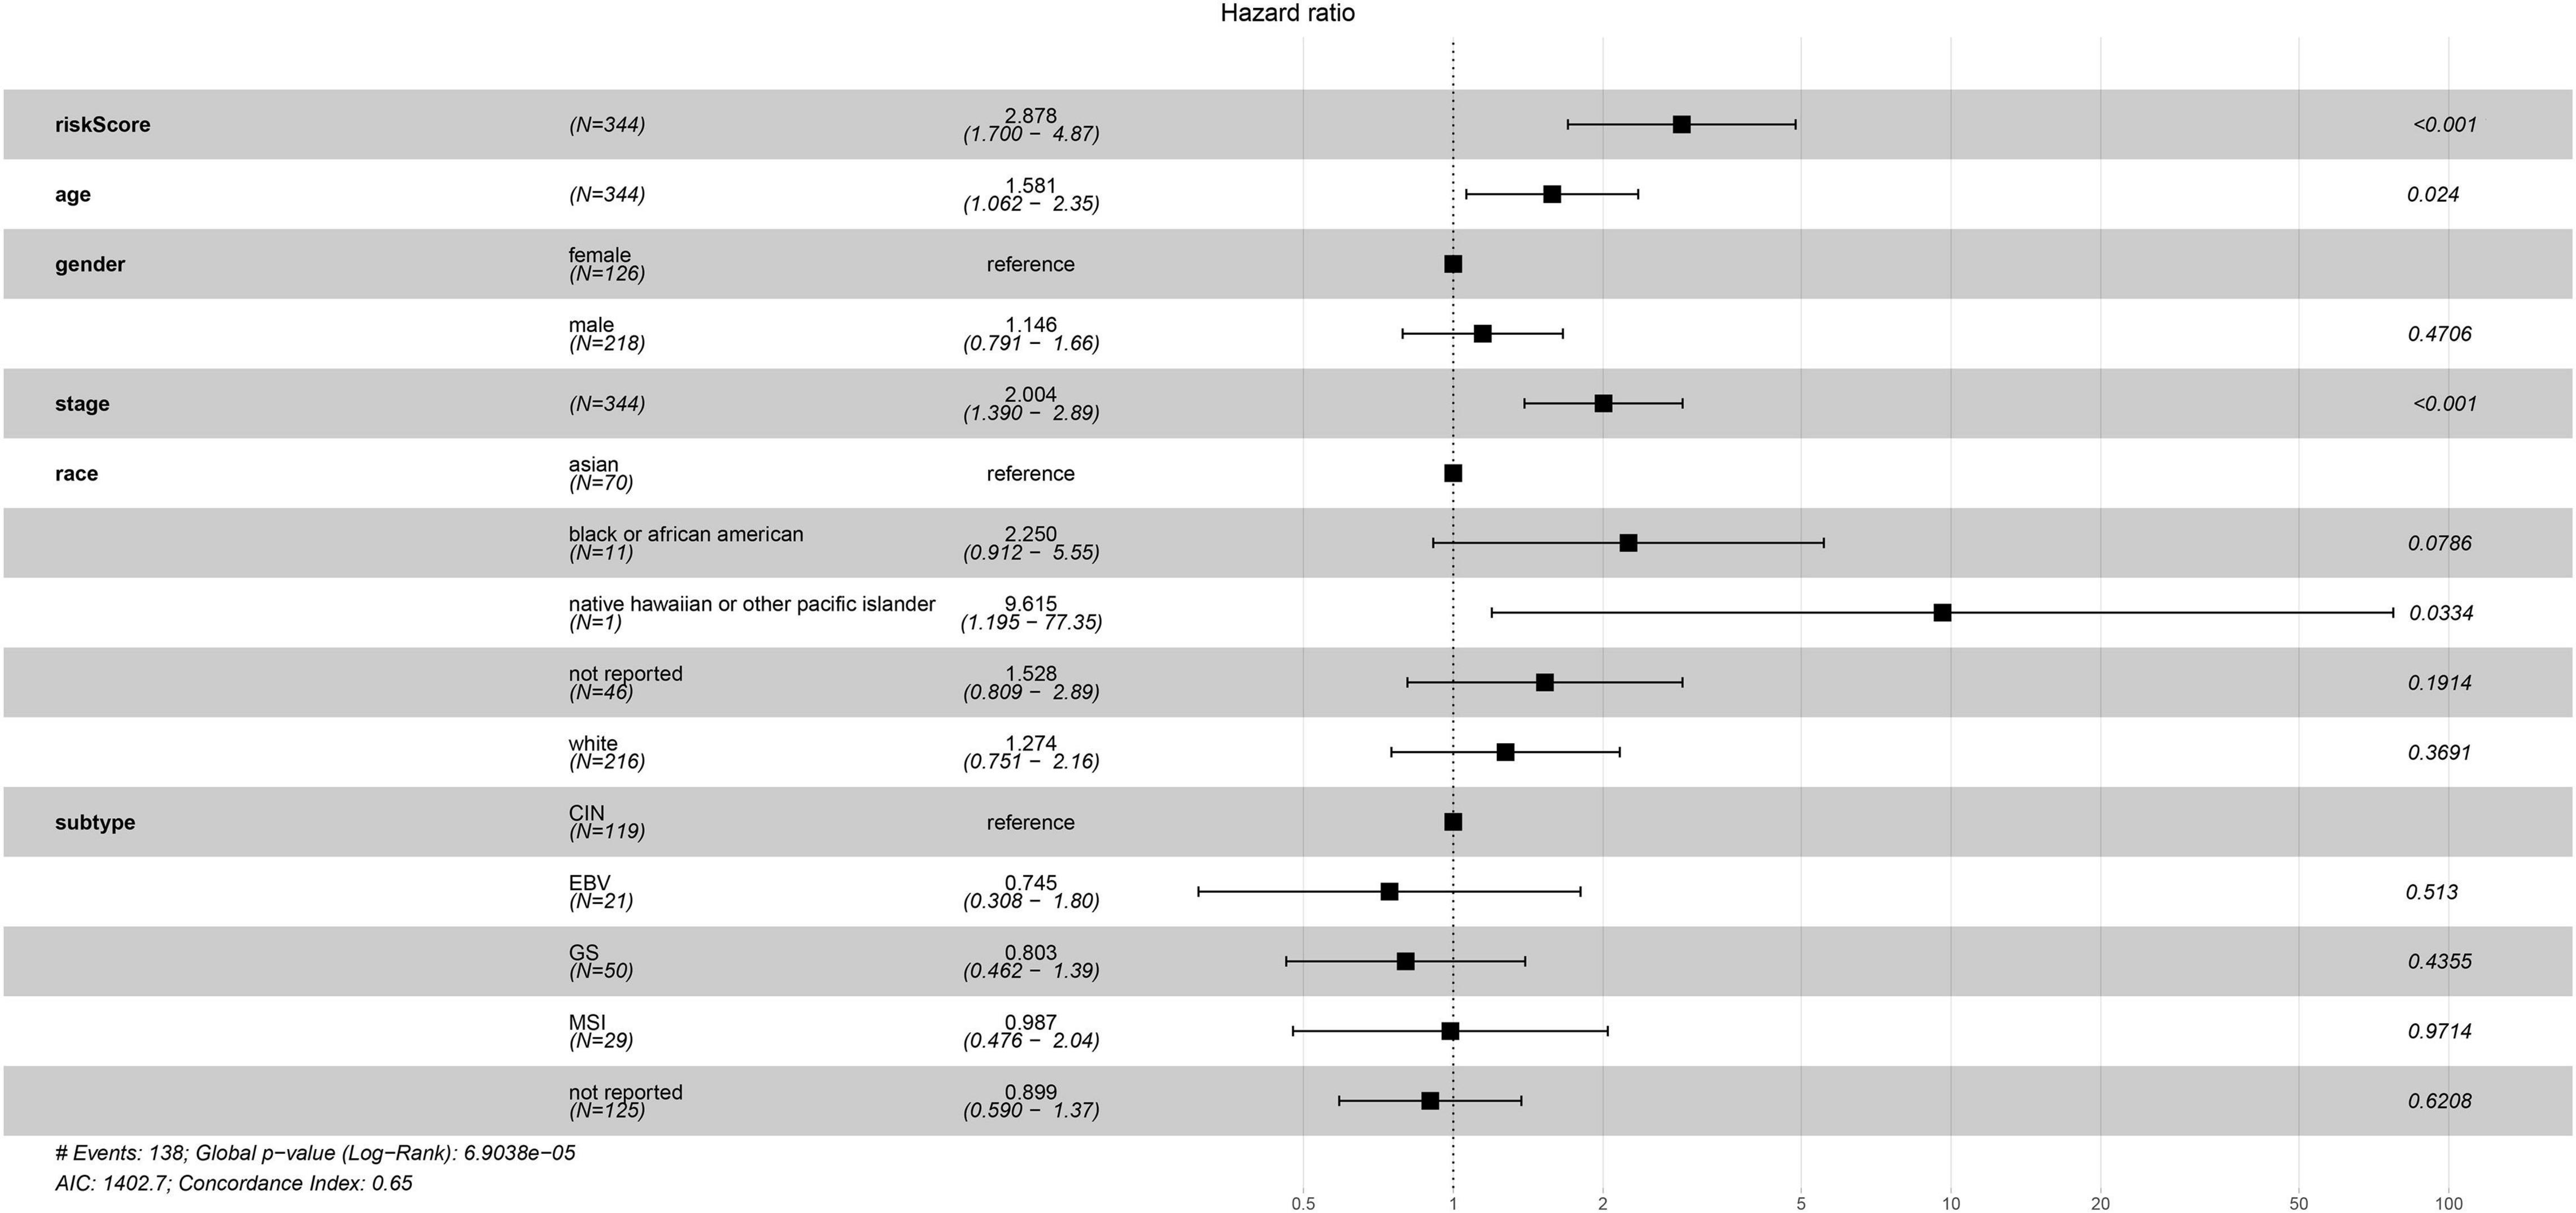
Figure 4. Multivariate Cox regression analysis of clinicopathologic factors and risk score for STAD in TCGA sets.
Validation of the Two-Gene Signature
GSE15459 dataset download from the GEO database (N = 200) was used to evaluate the repeatability and robustness of signature. The risk score of each patient was according to the same formula from the training dataset, and the median was used as the cutoff for patients categorized as low and high risk [(–0.29,1.38), median = 0.77]. Patients in the high-risk group had a significantly shorter survival time than those in the low-risk group (Figure 5A). The AUC-ROC of the signature for survival time was 0.607, 0.616, and 0.66 at 1, 3, and 5 years, respectively (Figures 5B–D).
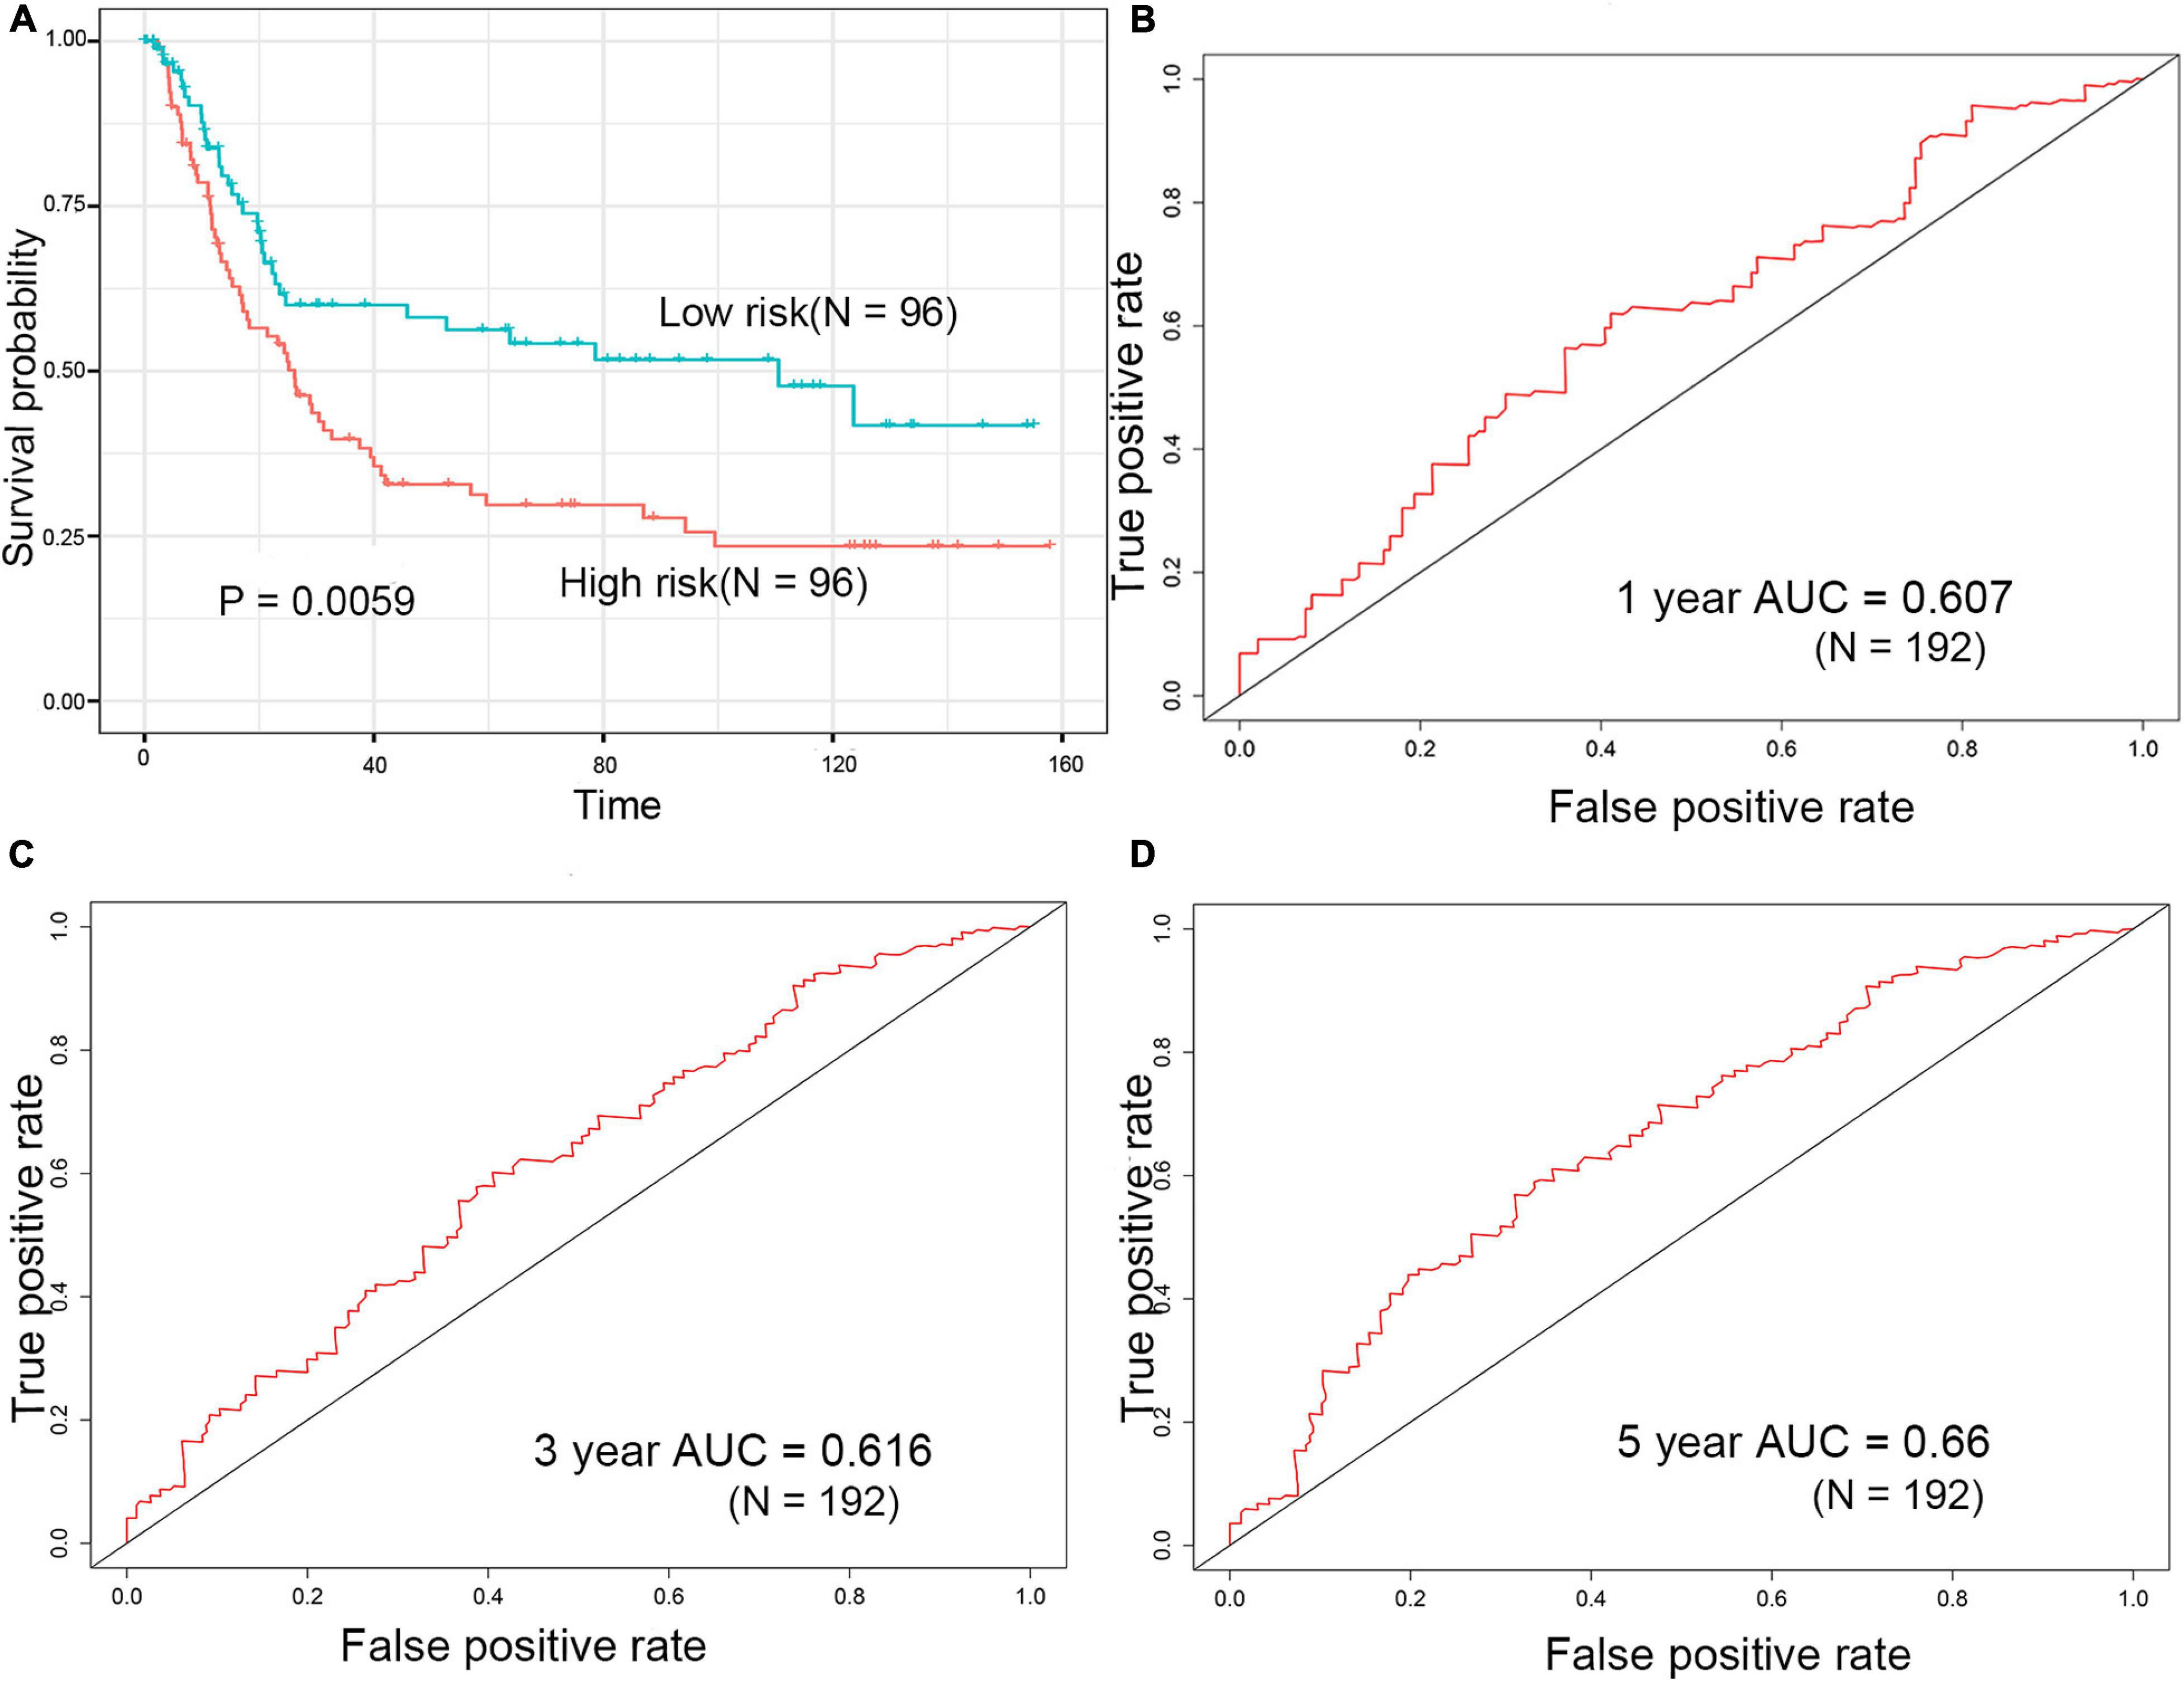
Figure 5. Evaluation of prognostic signature for over survival in the GEO dataset. (A) Survival analysis of the high-risk group and the low-risk group in the GEO dataset. (B–D) ROC curve of the prognostic signature in the GEO dataset.
Comparison of the Two-Gene Signature With Other Signatures
Wu et al. (2020) constructed a nine-gene signature (include CTHRC1) that had a good prognostic capability for the survival of patients in the training dataset (TCGA-STAD dataset, p-value of KM curves = 2.80e–7) and validation dataset (GSE15459 dataset, p-value of KM curves = 0.011). Wang et al. (2016) constructed a 53-gene signature, the signature obtained achievement in the training dataset (TCGA-STAD dataset, p-value of KM curves = 1.41e–20) and validation dataset (GSE15459 dataset, p-value of KM curves = 0.02). In the present study, the two-gene signature showed a worse performance in the training dataset (p = 0.0048), but better performance in the validation dataset (p = 0.0059) compared to previous signatures. In addition, we performed an estimation using the same model and their model setting and the gene lists from those two articles. The performance of the 9-gene and 53-gene signature was also worse than the 2-gene signature (Supplementary Figure 3).
Immune Landscape in Patients With STAD
The difference of tumor-infiltrating immune cell composition between the high-risk and low-risk groups was analyzed by CIBERSORTx. The infiltration levels of four immune cells (M2 macrophages, memory B cells, eosinophils, and gamma delta T cells) were significantly different between the two groups in the TCGA dataset (Figure 6A). However, only the infiltration level of M2 macrophages out of these four immune cells showed a significant difference between high-risk and low-risk groups in the GSE15459 dataset (Supplementary Figure 4). M2 macrophages were highly infiltrated in the high-risk group in both TCGA-STAD and GSE15459 datasets. Besides the infiltrating level of immune cells, we analyzed the correlation between the signature and the expression of different immune checkpoints (PD-L1, PD-1, CTLA-4, TIGIT, LAG-3, TIM-3, PD-L2, IDO-1, IDO-2, ADORA2A, and B7-H4) in the TCGA-STAD dataset (Supplementary Figure 5; Fang et al., 2020; Melaiu et al., 2020). The results showed that the expression of TIM-3 (also known as HAVCR2) and PD-L2 (also known as PDCD1LG2) were positively correlated with risk score, which is more highly expressed in high-risk patients (Figures 6B–E).
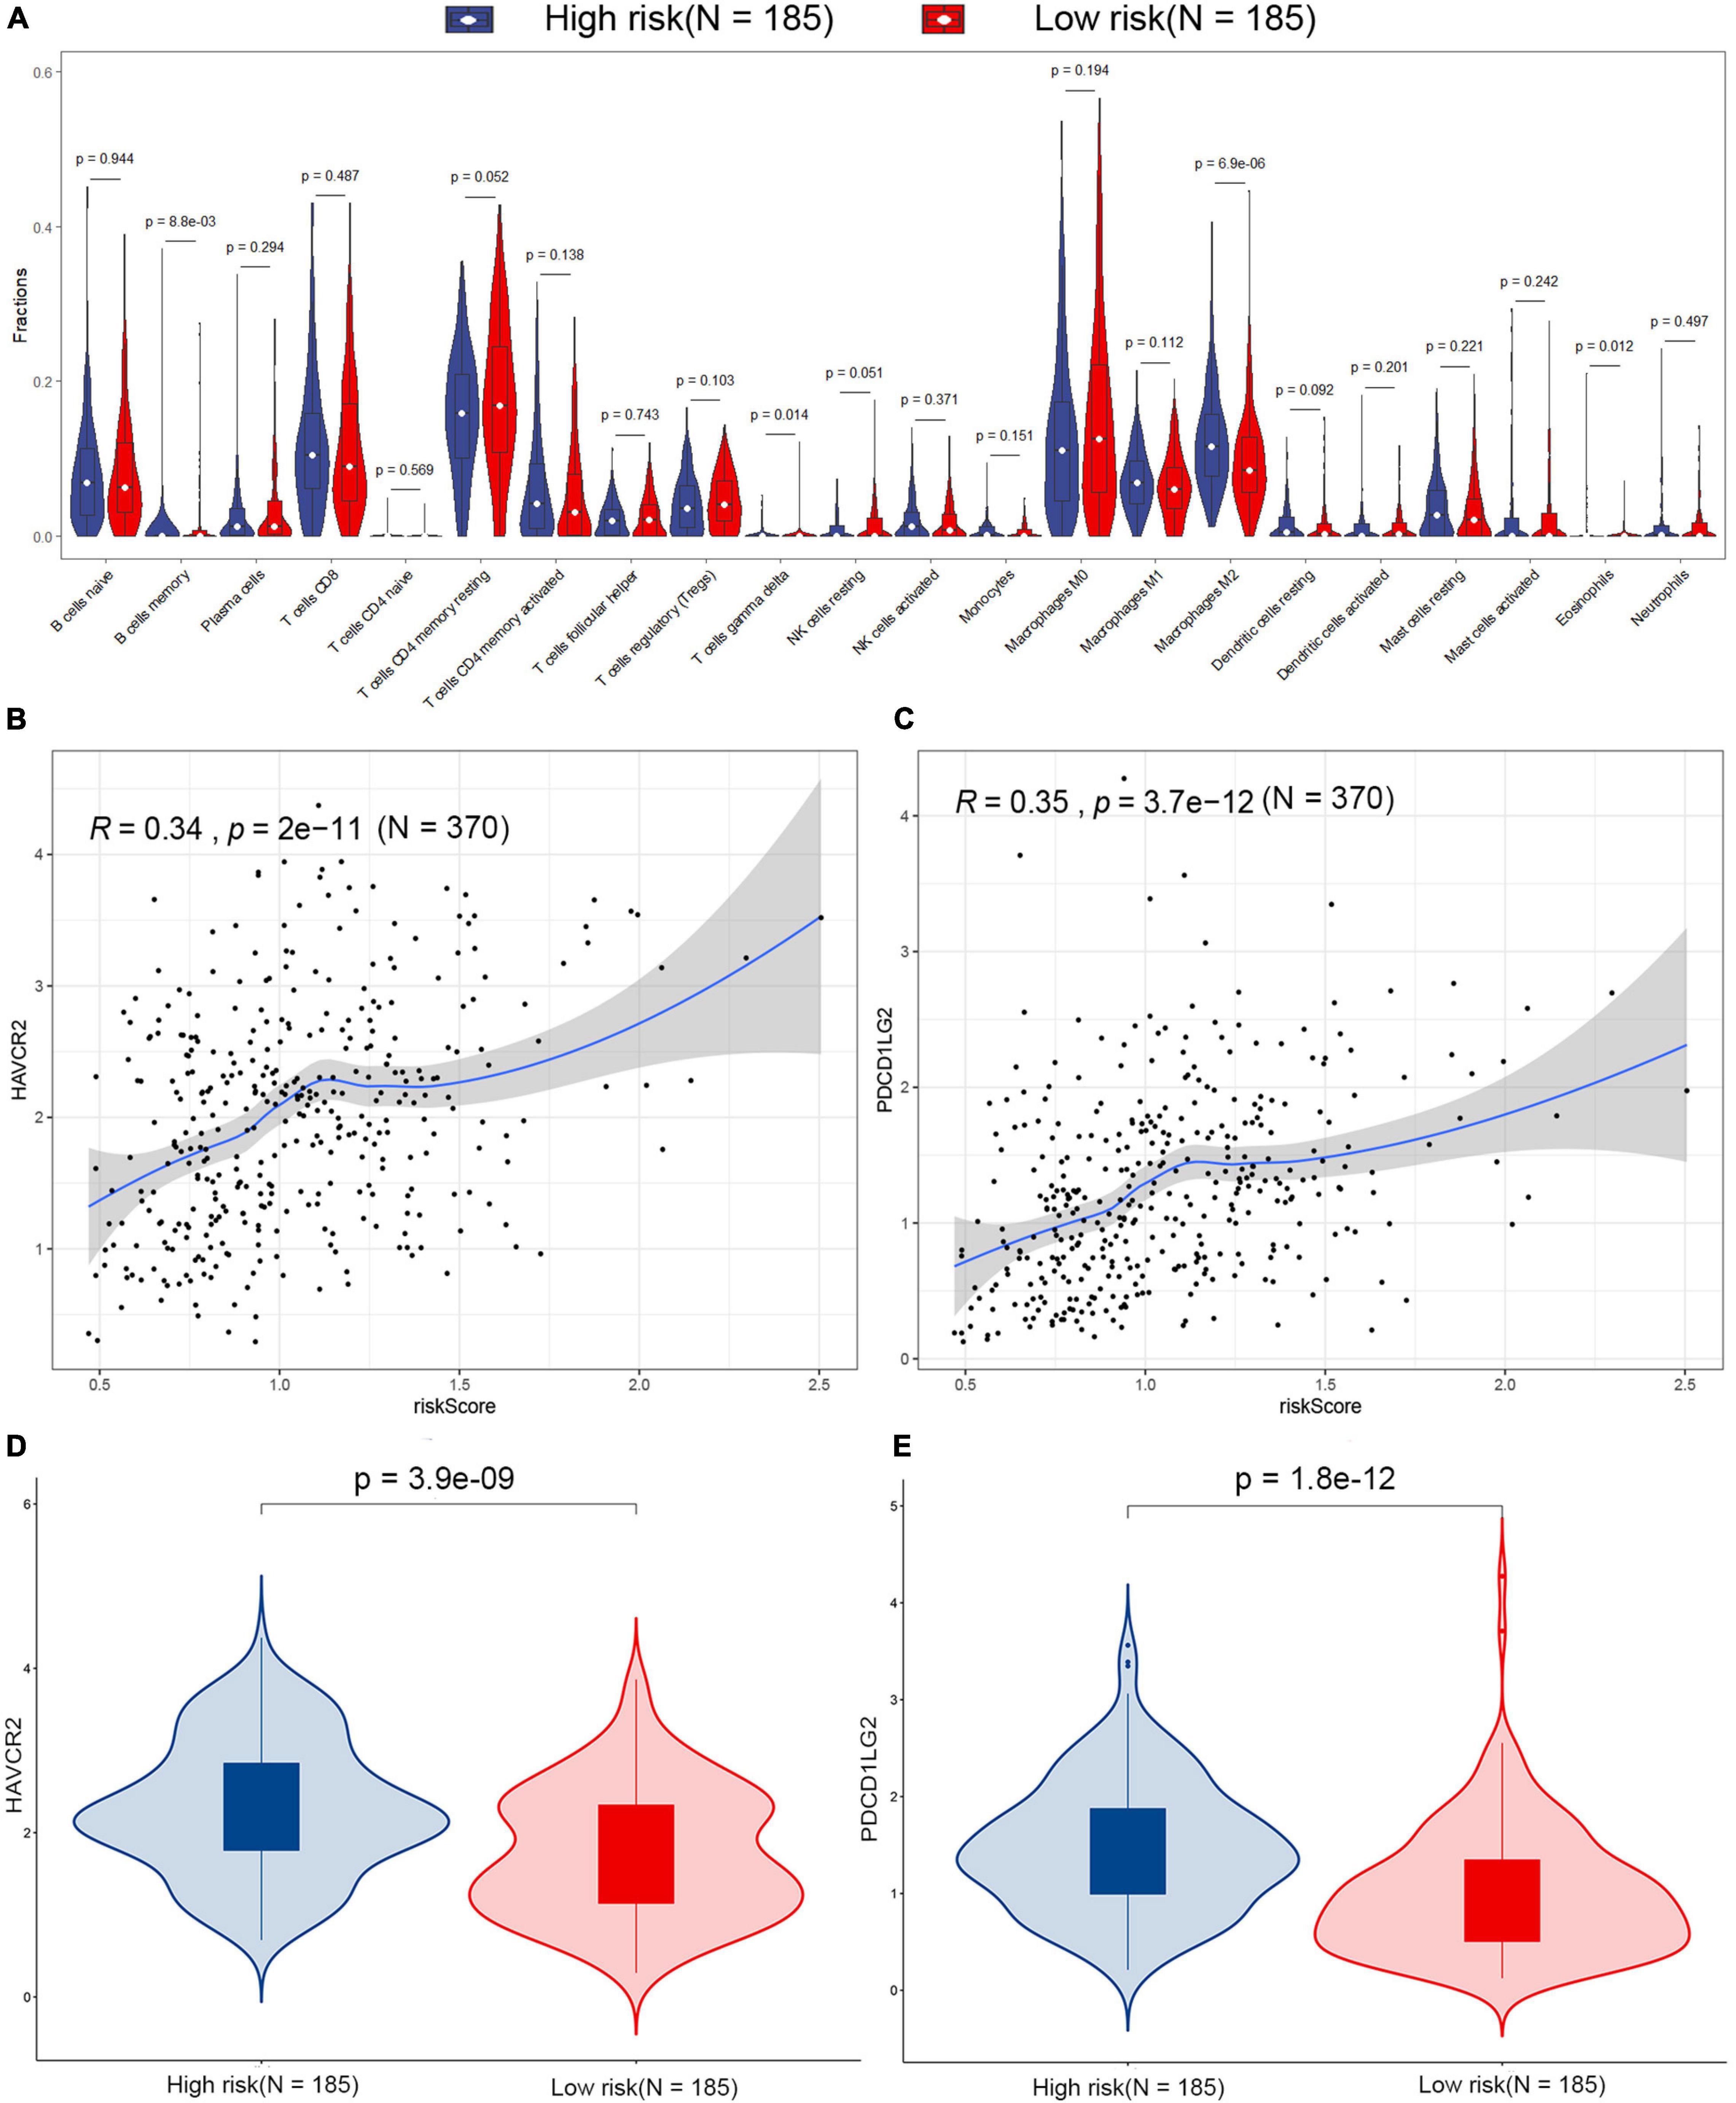
Figure 6. Estimation of the tumor microenvironment in the TCGA dataset. (A) Differences in 22 human immune cell phenotypes infiltration between the high- and low-risk groups. Correlations between HAVCR2 (B), PDCD1LG2 (C), and risk score in the TCGA dataset. Comparison of the HAVCR2 (D) and PDCD1LG2 (E) in low- and high-risk patients in the TCGA dataset.
Gene Set Enrichment Analysis of the High-Risk Group
GSEA analysis was performed to explore potential signaling pathways associated with the high-risk group based on the two-gene signature-derived risk score. The cutoff value was set at FDR q-value < 0.05 and |NES| > 0.7. Results showed that four gene sets, namely, asthma, extracellular matrix (ECM)–receptor interaction, systemic lupus erythematosus, and glycosphingolipid biosynthesis-ganglio series, were enriched in the high-risk patients in the TCGA dataset (Figure 7). ECM–receptor interaction was one of the most enriched gene sets in the GSE15459 dataset (Supplementary Table 2).
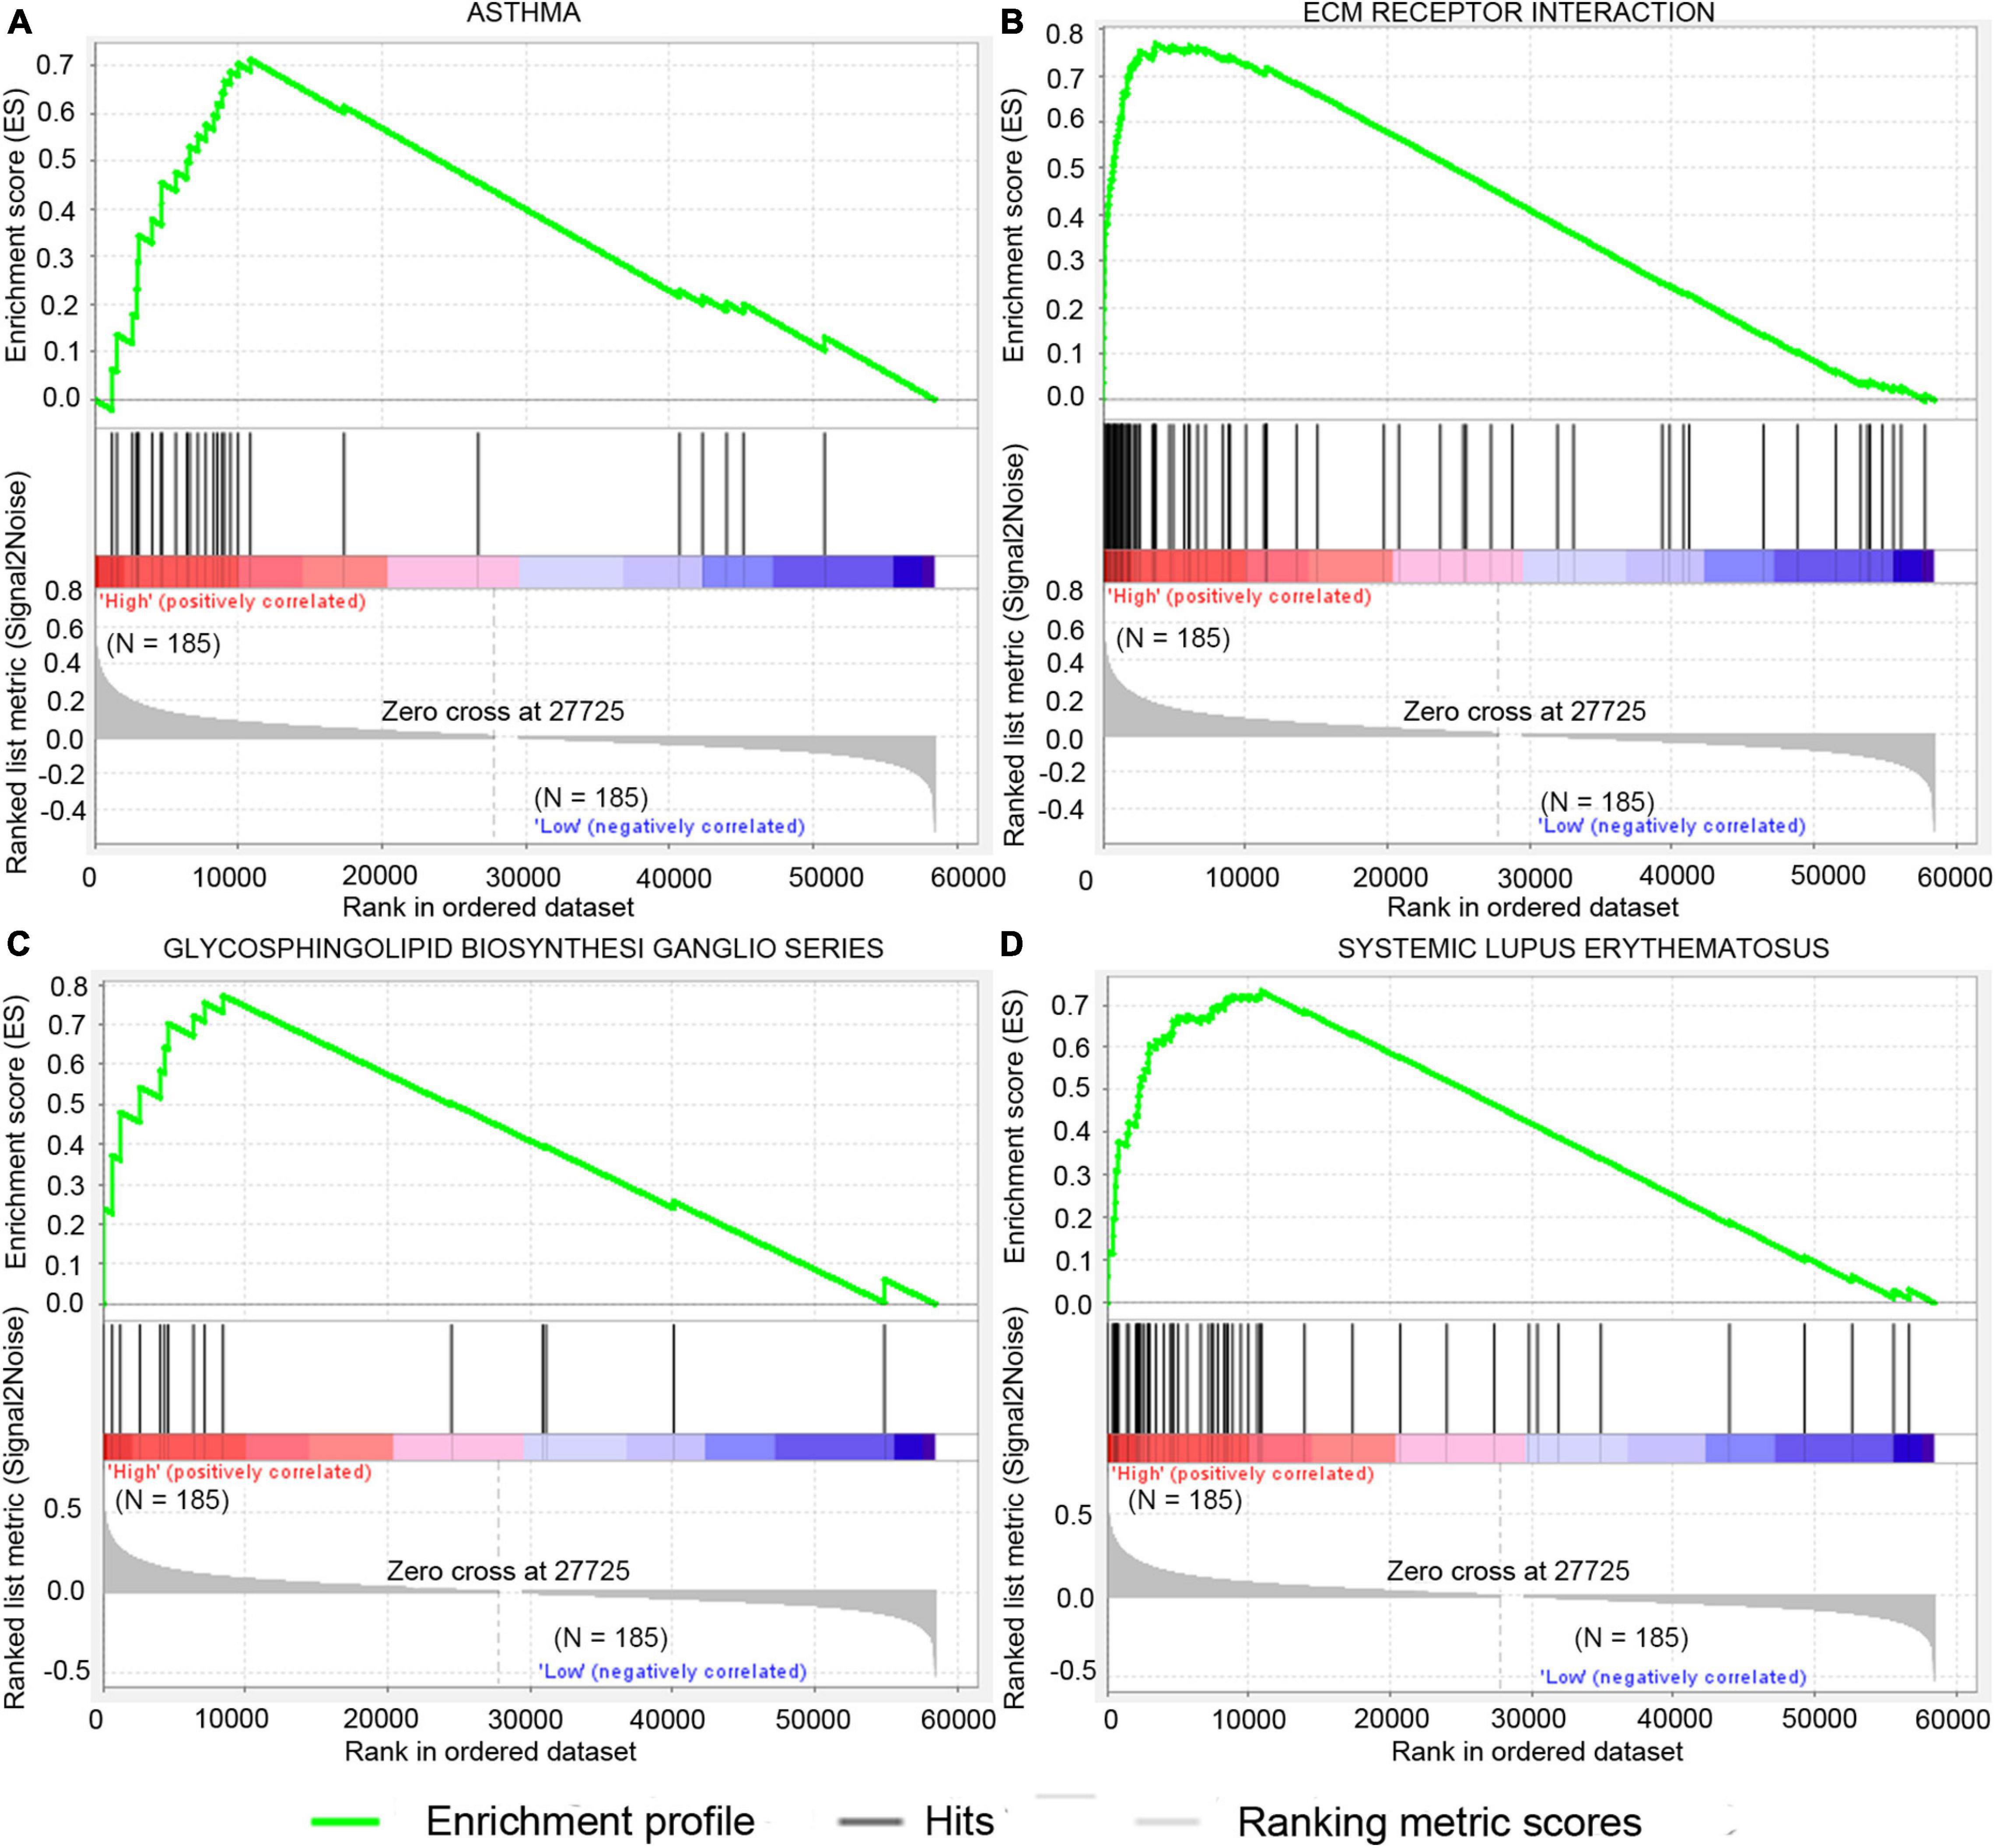
Figure 7. Significantly enriched signal pathway in patients with high risk compared with patients with low risk in the TCGA dataset. The significantly enriched KEGG pathways include asthma (A), ecm receptor interaction (B), glycosphingolipid biosynthesis ganglio series (C), and systemic lupus erythematosus (D).
Verification of LRFN4 and CTHRC1 Expression in STAD by qRT-PCR
The LRFN4 and CTHRC1 expression data at the mRNA level were obtained from 407 tissues (including 375 STAD tissues and 32 adjacent normal tissues) in the TCGA database. The plot shows the mRNA expression profiles of LRFN4 and CTHRC1 in STAD tissues and adjacent normal tissues. As shown in Figures 8A,B, the expression of LRFN4 and CTHRC1 was significantly upregulated in GC tissues compared to that in adjacent normal tissues (p < 0.0001). To verify the difference in LRFN4 and CTHRC1 expression in the TCGA database, qRT-PCR was used to evaluate the mRNA expression level of LRFN4 and CTHRC1, which showed that their expressions in STAD were both significantly higher than that in adjacent normal tissues (p < 0.05, Figures 8C,D).
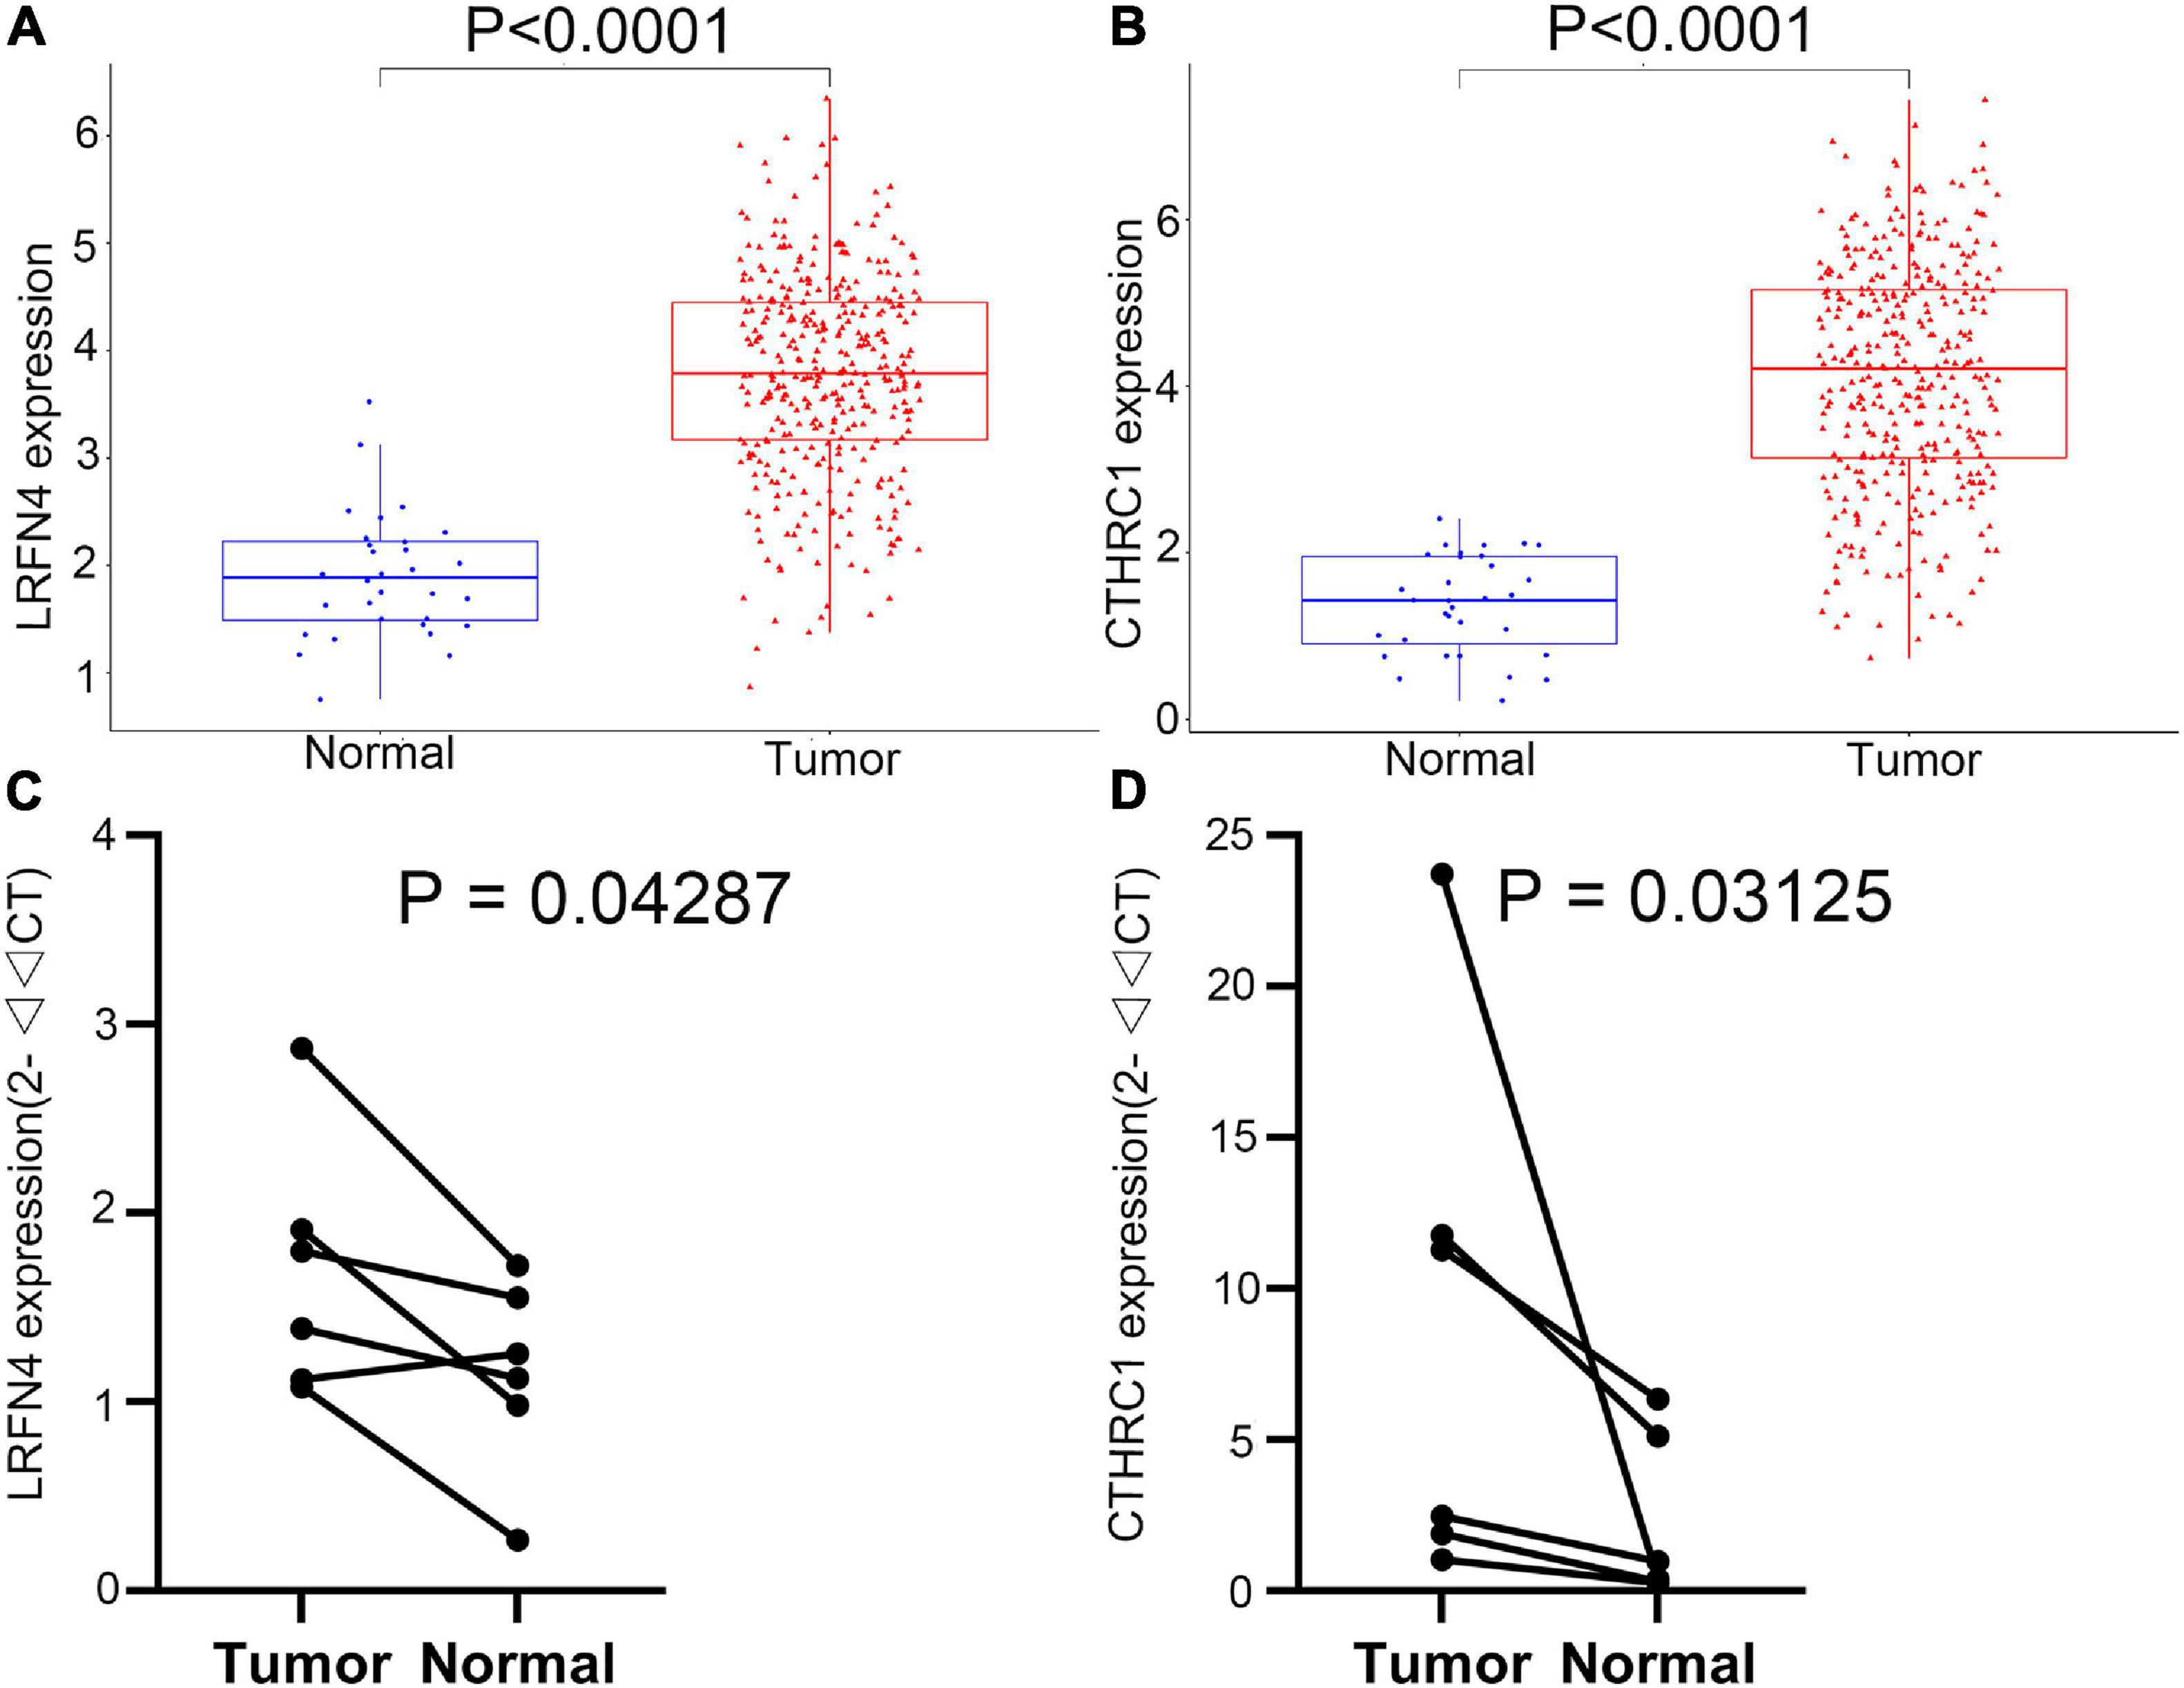
Figure 8. Verification of the expression of LRFN4 and CTHRC1. Expression of LRFN4 (A) and CTHRC1 (B) in the TCGA dataset. qRT-PCR validation of the expression of LRFN4 (C) and CTHRC1 (D).
Discussion
In the present study, 44 DEGs were commonly identified between STAD and healthy samples from three datasets. To clarify the functions of DEGs, we further performed functional enrichment analysis. The proteins translated by DEGs were mainly located in extracellular regions and these genes were primarily implicated in tumor-related biological processes such as cell adhesion, wound healing, and extracellular matrix organization (Yu et al., 2019; Alfarsi et al., 2020; Liao et al., 2020).
Then, five candidate genes (DPT, ECT2, COL5A2, CTHRC1, and LRFN4) that were closely related to the survival rate of STAD patients were identified by analyzing the total survival information from STAD patients in the TCGA program. Based on the results of univariate Cox regression and stepwise multivariate Cox regression in the TCGA-STAD dataset, expression of CTHRC1 and LRFN4 was applied for construction of risk score and prognostic signature. Kaplan–Meier curves showed that the high-risk group had an obviously poorer overall survival compared to the low-risk group in the three groups. In addition, multivariate Cox regression analyses indicated that the risk score was an independent predictor of survival in TCGA datasets, after adjustment of age, sex, and tumor stage. Risk scores were similar between early (I and II) and advanced (III and IV) stages, but showed significant changes between early stage and normal, which suggested the great potential of the two-gene signature in early diagnosis in patients of STAD. Expression verification analysis of LRFN4 and CTHRC1 was performed based on the TCGA database. At the same time, the expression levels of these two genes were verified by qRT-PCR using specimens from our recruited patients.
CTHRC1 played a role in the cellular response to arterial injury through involvement in vascular remodeling (Pyagay et al., 2005). Previous studies showed that CTHRC1 promoted tumor cell progression and might play a key role in the invasion metastasis of cervical carcinoma, cervical squamous cell carcinoma, and colorectal cancer (Ni et al., 2018; Li N. et al., 2019; Zheng et al., 2019). In addition, CTHRC1 promoted M2-like macrophage recruitment and myometrial invasion in endometrial carcinoma by the integrin-Akt signaling pathway, which indicated that CTHRC1 might be a biomarker for tumor immunotherapy (Li L. Y. et al., 2019).
LRFN4 encodes leucine-rich repeat and fibronectin type III domain-containing 4, belonging to the superfamily of leucine-rich repeat-containing adhesion molecules (Nam et al., 2011). In a previous study, the expression level of LRFN4 was high in tumor cells (Liu et al., 2019), which was consistent with present results. However, the high-level expression of LRFN4 was associated with poor prognosis, which was contradicted with our findings. Because of the unknown relationship between LRFN4 and cancer, the correlations between LRFN4 and cancer need to be verified.
Next, immune cell infiltration and GSEA analysis showed that four immune cells and four gene sets have differences between the high-risk and the low-risk groups, but only M2 macrophages and ECM–receptor interaction were confirmed in the GSE15459 dataset. Previous studies revealed that M2 macrophages predominated in human cancers and actively stimulated tumor growth (Mills et al., 2016). ECM is a complex macromolecular network composed of a variety of proteoglycan, fibrin, and stromal cell-associated proteins (Hynes, 2009; Mouw et al., 2014). In addition, the ECM component has a regulatory effect on macrophage polarization (Yunna et al., 2020). Therefore, the poor prognosis of patients in the high-risk group may be due to the effect of M2 macrophages and ECM–receptor interaction.
Immune checkpoint agents had antitumor properties through reverse tumor immunosuppressive effects (Long et al., 2017). The correlation between the signature and the level of different immune checkpoint proteins was also investigated. The high-risk patients with STAD generally had higher expressions of TIM-3 and PD-L2. The positivity of PD-L2 significantly indicated clinical response to pembrolizumab on combined tumor, while stromal immune cells’ T cell immunoglobulin mucin-3 (Tim-3) antibodies have curative effects in laboratory-scale studies in several tumors (Yearley et al., 2017; Liu et al., 2018). Therefore, patients with STAD at high risk may benefit more from immunotherapy. These results suggest that the poor prognosis of patients with STAD at high risk is due to lower immunoreactivity and higher immunosuppression in the tumor microenvironment, which promote the growth, progression, invasion, and metastasis of the tumor.
Bioinformatic analysis played an important role in the potential biomarkers’ discovery for the diagnosis and treatment of stomach-related cancer. A 53-gene signature-derived risk score module was demonstrated to predict prognosis in gastric cancer and a nine-gene signature was identified to predict gastric cancer prognosis (Wang et al., 2016; Wu et al., 2020). However, the complexity of the model decreased its robustness and limited the application of these STAD prognosis signatures on broad datasets. In the present study, a novel two-gene signature was identified, which had simpler structure and stronger early prognostic capacity.
However, there are still some limitations for the signature: (a) The prognostic signature is based on the expression of genes in the tissue, while the expression of genes and proteins in the blood might be more convenient for the clinical application. (b) The prognostic signature has only been verified on two datasets, and needs to be verified on more datasets. (c) The prognostic effect of CTHRC1 and LRFN4 had been confirmed, but their specific role in STAD is still unknown. It will be addressed in a future study.
Conclusion
In conclusion, we constructed a new predictive signature of mRNA prognosis through mRNA expression profiling. The signature contained expression of two genes, which were verified by qRT-PCR analysis using specimens from recruited patients in our hospital. In addition, the fidelity of this signature was evaluated by another independent dataset. Furthermore, we analyzed the possible causes of the difference in prognosis from the perspective of the immune microenvironment. The present study investigated potential biomarkers of STAD based on in silico analysis, which laid the foundation for further studies toward understanding of STAD pathogenesis and clinical treatment focusing on prognosis of STAD.
Data Availability Statement
The original contributions presented in the study are included in the article/Supplementary Material, further inquiries can be directed to the corresponding author/s.
Ethics Statement
The studies involving human participants were reviewed and approved by the Ethics Committee of The First Affiliated Hospital of Zhejiang University. The patients/participants provided their written informed consent to participate in this study.
Author Contributions
SH, WZ, and WY conceived and designed the study. SH, QG, RZ, HX, YL, and ZS analyzed the data. SH, WZ, QG, and ZZ wrote the manuscript. WY and CC collected the patient samples. SH, HH, and YL performed the experiments. QH, XH, and JT were involved in project management. XH and JT supervised the study. All authors read and approved the final manuscript.
Funding
This work was supported by the National Science and Technology Major Project of China (Grant No. 2019ZX09301108), the Jiangsu Provincial Natural Science Foundation of China (Grant No. BK20190233), and the Provincial Research Foundation of Zhejiang Integrative Association (Grant No. 2012LY018).
Conflict of Interest
WZ was employed by company Changshu Qiushi Technology Co., Ltd.
The remaining authors declare that the research was conducted in the absence of any commercial or financial relationships that could be construed as a potential conflict of interest.
Publisher’s Note
All claims expressed in this article are solely those of the authors and do not necessarily represent those of their affiliated organizations, or those of the publisher, the editors and the reviewers. Any product that may be evaluated in this article, or claim that may be made by its manufacturer, is not guaranteed or endorsed by the publisher.
Supplementary Material
The Supplementary Material for this article can be found online at: https://www.frontiersin.org/articles/10.3389/fgene.2021.646818/full#supplementary-material
Supplementary Figure 1 | The distribution of adjusted p-value in GSE118916 (A), GSE1103236 (B), and GSE13861 (C).
Supplementary Figure 2 | The prognostic value of 39 genes in the overall survival of Stomach adenocarcinoma (STAD) patients.
Supplementary Figure 3 | Estimation of the performance of 9-gene (A) and 53-gene (B) signature.
Supplementary Figure 4 | Differences in 22 human immune cell phenotypes infiltration between the high- and low-risk groups in GSE15459.
Supplementary Figure 5 | Correlations between immune checkpoints and risk score in the TCGA dataset.
Supplementary Table 1 | 44 DEGs along with p-value and log2 fold change in the four datasets.
Supplementary Table 2 | Significantly enriched signal pathway in patients with high-risk compared with patients with low-risk in GSE15459.
Supplementary Table 3 | Survival analysis of 9 genes (Wu et al., 2020) in TCGA-STAD and GSE15459.
Supplementary Table 4 | Survival analysis of signatures containing different genes. Due to too many combinations, each signature chooses the three combinations with the smallest average p-value.
Footnotes
- ^ https://www.ncbi.nlm.nih.gov/geo/
- ^ https://david.ncifcrf.gov/
- ^ https://portal.gdc.cancer.gov/
- ^ http://cibersortx.stanford.edu/
- ^ http://software.broadinstitute.org/gsea
References
Adam, J. B., Vesteinn, T., Ilya, S., Sheila, M. R., Michael, M., Brady, B., et al. (2014). Comprehensive molecular characterization of gastric adenocarcinoma. Nature 507, 315–322. doi: 10.1038/nature12965
Ajani, J. A., Lee, J., Sano, T., Janjigian, Y. Y., Fan, D., and Song, S. (2017). Gastric adenocarcinoma. Nat. Rev. Dis. Prim. 3:17036. doi: 10.1038/nrdp.2017.36
Alfarsi, L. H., El Ansari, R., Craze, M. L., Masisi, B. K., Ellis, I. O., Rakha, E. A., et al. (2020). PPFIA1 expression associates with poor response to endocrine treatment in luminal breast cancer. BMC Cancer 20:425. doi: 10.1186/s12885-020-06939-6
Alix-Panabières, C., and Pantel, K. (2016). Clinical applications of circulating tumor cells and circulating tumor DNA as liquid biopsy. Cancer Discov. 6, 479–491. doi: 10.1158/2159-8290.CD-15-1483
Bang, Y. J., Van Cutsem, E., Feyereislova, A., Chung, H. C., Shen, L., Sawaki, A., et al. (2010). Trastuzumab in combination with chemotherapy versus chemotherapy alone for treatment of HER2-positive advanced gastric or gastro-oesophageal junction cancer (ToGA): a phase 3, open-label, randomised controlled trial. Lancet 376, 687–697. doi: 10.1016/S0140-6736(10)61121-X
Davoli, T., Uno, H., Wooten, E. C., and Elledge, S. J. (2017). Tumor aneuploidy correlates with markers of immune evasion and with reduced response to immunotherapy. Science 355:eaaf8399. doi: 10.1126/science.aaf8399
Duffy, M. J., Lamerz, R., Haglund, C., Nicolini, A., Kalousová, M., Holubec, L., et al. (2014). Tumor markers in colorectal cancer, gastric cancer and gastrointestinal stromal cancers: European group on tumor markers 2014 guidelines update. Int. J. Cancer 134, 2513–2522. doi: 10.1002/ijc.28384
Fang, J., Chen, F., Liu, D., Gu, F., Chen, Z., and Wang, Y. (2020). Prognostic value of immune checkpoint molecules in breast cancer. Biosci. Rep. 40:BSR20201054. doi: 10.1042/BSR20201054
Fuchs, C. S., Doi, T., Jang, R. W., Muro, K., Satoh, T., Machado, M., et al. (2018). Safety and efficacy of pembrolizumab monotherapy in patients with previously treated advanced gastric and gastroesophageal junction cancer: phase 2 clinical KEYNOTE-059 trial. JAMA Oncol. 4:e180013. doi: 10.1001/jamaoncol.2018.0013
Fuchs, C. S., Tomasek, J., Yong, C. J., Dumitru, F., Passalacqua, R., Goswami, C., et al. (2014). Ramucirumab monotherapy for previously treated advanced gastric or gastro-oesophageal junction adenocarcinoma (REGARD): an international, randomised, multicentre, placebo-controlled, phase 3 trial. Lancet 383, 31–39. doi: 10.1016/S0140-6736(13)61719-5
Guyot, P., Ades, A. E., Ouwens, M. J. N. M., and Welton, N. J. (2012). Enhanced secondary analysis of survival data: reconstructing the data from published Kaplan-Meier survival curves. BMC Med. Res. Methodol. 12:9. doi: 10.1186/1471-2288-12-9
Hause, R. J., Pritchard, C. C., Shendure, J., and Salipante, S. J. (2016). Classification and characterization of microsatellite instability across 18 cancer types. Nat. Med. 22, 1342–1350. doi: 10.1038/nm.4191
Huang, D. W., Sherman, B. T., Tan, Q., Collins, J. R., Alvord, W. G., Roayaei, J., et al. (2007). The DAVID gene functional classification tool: a novel biological module-centric algorithm to functionally analyze large gene lists. Genome Biol. 8:R183. doi: 10.1186/gb-2007-8-9-r183
Hynes, R. O. (2009). The extracellular matrix: not just pretty fibrils. Science 326, 1216–1219. doi: 10.1126/science.1176009
Jiang, P., and Liu, X. S. (2015). Big data mining yields novel insights on cancer. Nat. Genet. 47, 103–104. doi: 10.1038/ng.3205
Li, L. Y., Yin, K. M., Bai, Y. H., Zhang, Z. G., Di, W., and Zhang, S. (2019). CTHRC1 promotes M2-like macrophage recruitment and myometrial invasion in endometrial carcinoma by integrin-Akt signaling pathway. Clin. Exp. Metastasis 36, 351–363. doi: 10.1007/s10585-019-09971-4
Li, N., Chen, L., Liu, C., Jiang, Y., and Rong, J. (2019). Elevated CTHRC1 expression is an indicator for poor prognosis and lymph node metastasis in cervical squamous cell carcinoma. Hum. Pathol. 85, 235–241. doi: 10.1016/j.humpath.2018.10.015
Liao, X., Bu, Y., Xu, Z., Jia, F., Chang, F., Liang, J., et al. (2020). WISP1 predicts clinical prognosis and is associated with tumor purity, immunocyte infiltration, and macrophage M2 polarization in pan-cancer. Front. Genet. 11:502. doi: 10.3389/fgene.2020.00502
Liu, F., Liu, Y., and Chen, Z. (2018). Tim-3 expression and its role in hepatocellular carcinoma. J. Hematol. Oncol. 11:126.
Liu, Y., Chen, X., Chen, X., Yang, X., Song, Q., and Wu, H. (2019). High SALM3 expression in tumor cells and fibroblasts is correlated with poor prognosis in gastric cancer patients. Dis. Markers 2019:8282414. doi: 10.1155/2019/8282414
Long, J., Zhang, L., Wan, X., Lin, J., Bai, Y., Xu, W., et al. (2018). A four-gene-based prognostic model predicts overall survival in patients with hepatocellular carcinoma. J. Cell. Mol. Med. 22, 5928–5938. doi: 10.1111/jcmm.13863
Long, J. A., Poinas, G., Fiard, G., Leprêtre, M., Delaitre-Bonnin, C., Rébillard, X., et al. (2017). Prostatectomieradicalelaparoscopique robot-assistée :quellessont les preuves à l’heured’unedemande de nomenclature spécifique ? Prog. en Urol. 27, 146–157. doi: 10.1016/j.purol.2016.12.010
Melaiu, O., Lucarini, V., Giovannoni, R., Fruci, D., and Gemignani, F. (2020). News on immune checkpoint inhibitors as immunotherapy strategies in adult and pediatric solid tumors. Semin. Cancer Biol. [Epub ahead of print]. doi: 10.1016/j.semcancer.2020.07.001
Mills, C. D., Lenz, L. L., and Harris, R. A. (2016). A breakthrough: macrophage-directed cancer immunotherapy. Cancer Res. 76, 513–516. doi: 10.1158/0008-5472.CAN-15-1737
Mouw, J. K., Ou, G., and Weaver, V. M. (2014). Extracellular matrix assembly: a multiscale deconstruction. Nat. Rev. Mol. Cell Biol. 15, 771–785. doi: 10.1038/nrm3902
Nam, J., Mah, W., and Kim, E. (2011). The SALM/Lrfn family of leucine-rich repeat-containing cell adhesion molecules. Semin. Cell Dev. Biol. 22, 492–498. doi: 10.1016/j.semcdb.2011.06.005
Newman, A. M., Steen, C. B., Liu, C. L., Gentles, A. J., Chaudhuri, A. A., Scherer, F., et al. (2019). Determining cell type abundance and expression from bulk tissues with digital cytometry. Nat. Biotechnol. 37, 773–782. doi: 10.1038/s41587-019-0114-2
Ni, S., Ren, F., Xu, M., Tan, C., Weng, W., Huang, Z., et al. (2018). CTHRC1 overexpression predicts poor survival and enhances epithelial-mesenchymal transition in colorectal cancer. Cancer Med. 7, 5643–5654. doi: 10.1002/cam4.1807
Pyagay, P., Heroult, M., Wang, Q., Lehnert, W., Belden, J., Liaw, L., et al. (2005). Collagen triple helix repeat containing 1, a novel secreted protein in injured and diseased arteries, inhibits collagen expression and promotes cell migration. Circ. Res. 96, 261–268. doi: 10.1161/01.RES.0000154262.07264.12
Ritchie, M. E., Phipson, B., Wu, D., Hu, Y., Law, C. W., Shi, W., et al. (2015). Limma powers differential expression analyses for RNA-sequencing and microarray studies. Nucleic Acids Res. 43:e47. doi: 10.1093/nar/gkv007
Rooney, M. S., Shukla, S. A., Wu, C. J., Getz, G., and Hacohen, N. (2015). Molecular and genetic properties of tumors associated with local immune cytolytic activity. Cell 160, 48–61. doi: 10.1016/j.cell.2014.12.033
Subramanian, A., Tamayo, P., Mootha, V. K., Mukherjee, S., Ebert, B. L., and Gillette, M. A. (2005). Gene set enrichment analysis: a knowledge-based approach for interpreting genome-wide expression profiles. Proc. Natl. Acad. Sci. U.S.A. 102, 15545–15550. doi: 10.1073/pnas.0506580102
Tateishi, R., Yoshida, H., Matsuyama, Y., Mine, N., Kondo, Y., and Omata, M. (2008). Diagnostic accuracy of tumor markers for hepatocellular carcinoma: a systematic review. Hepatol. Int. 2, 17–30. doi: 10.1007/s12072-007-9038-x
Vizoso, M., Ferreira, H. J., Lopez-Serra, P., Carmona, F. J., Martínez-Cardús, A., Girotti, M. R., et al. (2015). Epigenetic activation of a cryptic TBC1D16 transcript enhances melanoma progression by targeting EGFR. Nat. Med. 21, 741–750. doi: 10.1038/nm.3863
Wang, P., Wang, Y., Hang, B., Zou, X., and Mao, J. H. (2016). A novel gene expression-based prognostic scoring system to predict survival in gastric cancer. Oncotarget 7, 55343–55351. doi: 10.18632/oncotarget.10533
Wu, K. Z., Xu, X. H., Zhan, C. P., Li, J., and Jiang, J. L. (2020). Identification of a nine-gene prognostic signature for gastric carcinoma using integrated bioinformatics analyses. World J. Gastrointest. Oncol. 12, 975–991. doi: 10.4251/wjgo.v12.i9.975
Yearley, J. H., Gibson, C., Yu, N., Moon, C., Murphy, E., Juco, J., et al. (2017). PD-L2 expression in human tumors: relevance to anti-PD-1 therapy in cancer. Clin. Cancer Res. 23, 3158–3167. doi: 10.1158/1078-0432.CCR-16-1761
Yu, Z. H., Wang, Y. M., Jiang, Y. Z., Ma, S. J., Zhong, Q., Wan, Y. Y., et al. (2019). NID2 can serve as a potential prognosis prediction biomarker and promotes the invasion and migration of gastric cancer. Pathol. Res. Pract. 215:152553. doi: 10.1016/j.prp.2019.152553
Yunna, C., Mengru, H., Lei, W., and Weidong, C. (2020). Macrophage M1/M2 polarization. Eur. J. Pharmacol. 877:173090. doi: 10.1016/j.ejphar.2020.173090
Zhao, L., Wang, Y., Jiang, L., Zhao, L., and Wei, M. (2019). Identification of a novel cell cycle–related gene signature predicting survival in patients with gastric cancer. J. Cell. Physiol. 234, 6350–6360. doi: 10.1002/jcp.27365
Keywords: stomach adenocarcinoma, bioinformatics analysis, differentially expressed genes, biomarker, Gene Expression Omnibus
Citation: Han S, Zhu W, Yang W, Guan Q, Chen C, He Q, Zhong Z, Zhao R, Xiong H, Han H, Li Y, Sun Z, Hu X and Tian J (2021) A Prognostic Signature Constructed by CTHRC1 and LRFN4 in Stomach Adenocarcinoma. Front. Genet. 12:646818. doi: 10.3389/fgene.2021.646818
Received: 28 December 2020; Accepted: 02 July 2021;
Published: 26 August 2021.
Edited by:
Ioana Berindan Neagoe, Iuliu Haţieganu University of Medicine and Pharmacy, RomaniaReviewed by:
Bogdan Mirauta, European Bioinformatics Institute (EMBL-EBI), United KingdomRoxana M. Cojocneanu, Iuliu Hatieganu University of Medicine and Pharmacy, Romania
Copyright © 2021 Han, Zhu, Yang, Guan, Chen, He, Zhong, Zhao, Xiong, Han, Li, Sun, Hu and Tian. This is an open-access article distributed under the terms of the Creative Commons Attribution License (CC BY). The use, distribution or reproduction in other forums is permitted, provided the original author(s) and the copyright owner(s) are credited and that the original publication in this journal is cited, in accordance with accepted academic practice. No use, distribution or reproduction is permitted which does not comply with these terms.
*Correspondence: Xingjiang Hu, huxingjiang@zju.edu.cn; Jingkui Tian, tjk@zju.edu.cn
†These authors have contributed equally to this work