Organic Nutrients Induced Coupled C- and P-Cycling Enzyme Activities During Microbial Growth in Forest Soils
 Sebastian Loeppmann1,2*
  Andreas Breidenbach1
  Sandra Spielvogel2
  Michaela A. Dippold1
  Evgenia Blagodatskaya3,4
- 1Biogeochemistry of Agroecosystems, Georg-August-University, Göttingen, Germany
- 2Institute of Plant Nutrition and Soil Science, Christian-Albrechts-University, Kiel, Germany
- 3Department of Soil Ecology, Helmholtz Centre for Environmental Research - UFZ, Halle (Saale), Germany
- 4Agro-Technology Institute, RUDN University, Moscow, Russia
Besides environmental and soil physical drivers, the functional properties of microbial populations, i. e., growth rate, enzyme production, and maintenance requirements are dependent on the microbes' environment. The soil nutrition status and the quantity and quality of the substrate input, both infer different growth strategies of microorganisms. It is uncertain, how enzyme systems respond during the different phases of microbial growth and retardation in soil. The objective of this study was to uncover the changes of microbial functioning and their related enzyme systems in nutrient-poor and nutrient-rich beech forest soil during the phases of microbial growth. We determined microbial growth via kinetic approach by substrate-induced respiratory response of microorganisms, enabling the estimation of total, and growing biomass of the microbial community. To induce microbial growth we used glucose, while yeast extract simulated additional input of nutrients and factors indicating microbial residues (i.e., necromass compounds). Microbial growth on glucose showed a 12–18 h delay in associated enzyme activity increase or the absence of distinct activity responses (Vmax). β-glucosidase and chitinase (NAG) demonstrated clear differences of Vmax in time and between P-rich and P-poor soils. However, during microbial growth on glucose + yeast extract, the exponential increase in enzymatic activity was clearly stimulated accompanied by a delay of 8–12 h, smoothing the differences in nutrient-acquisition dynamics between the two soils. Furthermore, cross-correlation of β-glucosidase and acid phosphatase between the two sites demonstrated harmonized time constraints, which reflected the establishment of comparable and balanced enzymatic systems within the decomposition network. The network accelerated nutrient acquisition to maintain microbial growth, irrespective of the contrasting soil properties and initial nutrient stocks, indicating similar tradeoffs of C- and P- cycling enzymes in both soils. This reflects comparable temporal dynamics of activities in nutrient-poor and nutrient-rich soil when the glucose + yeast extract was added. During lag phase and phase of exponential microbial growth, substrate turnover time of all enzymes was shortened in nutrient-poor forest soil exclusively, reflecting that the quality of the added substrate strongly matters during all stages of microbial growth in soil.
Introduction
Temperate forest soils store significant quantities of the terrestrial organic carbon (SOC) (Jobbágy and Jackson, 2000) which are continuously microbially processed. Soil microorganisms decompose and transform organic substrates, varying in quality, and quantity under impact of biotic and abiotic factors (Kowalchuk and Stephen, 2001; Jansson and Prosser, 2013). Due to specific abiotic conditions of temperate forest ecosystems (e.g., pH), fungi often dominate over bacteria in soil microbial community, and such a dominance is usually distinctly associated with a particular soil horizon (Baldrian et al., 2012). Additionally, the diversity of yeast species is much broader in forest biomes than in other natural ecosystems (Maksimova and Chernov, 2004). The abundance of fungal taxa is mainly driven by the C/N ratio and by the content of phosphorus in the soil as compared to other edaphic factors (Lauber et al., 2008). Enormous microbial diversity ensures sustainability of the community due to high functional redundancy of various species, however, it does not necessarily mean high microbial activity and functioning. An ability to maintain ecologically relevant biogeochemical processes such as SOC and nutrient cycling (Roszak and Colwell, 1987) is ensured by the capacity of soil microorganisms to switch from dormancy to growth adjusting their functional traits accordingly to changing environmental and climatic conditions (Lennon and Jones, 2011; Wallenstein and Burns, 2011; Blagodatskaya and Kuzyakov, 2013). During growth and turnover, microorganisms process primarily plant-derived organic substrates transforming them to secondary C sources in form of microbial residues (i.e., necromass). If microbial residues are not stabilized, they are further decomposed and thus, are fueling the active microbial community. As a result of microbial turnover, up to 50% of soil organic matter (SOM) originates from microbial residues (Liang et al., 2011; Miltner et al., 2012). Up to now, our knowledge on its nutrition potential for plants and the active microbial community is still limited.
Along with strong functional redundancy, microbial functional diversity ensures sustainable mechanisms in the community, and the ecosystem (Petchey et al., 2006; Wagg et al., 2019), which still remains a missing link between biodiversity patterns and ecosystem functions (Bardgett and Putten, 2014). Microbial functional diversity is increasingly recognized in science, as these patterns provide a more powerful test of theory than taxonomic richness (Lamanna et al., 2014; Louca et al., 2018). However, we are still lacking knowledge on soil microbial functional diversity and related enzyme systems, especially in forest ecosystems (Lang et al., 2016).
Besides traditional methods such as viable counts or the measurements of optical density of microorganisms (Figure 1), microbial growth can be determined by kinetic approach, via the substrate-induced respiratory response of microorganisms. This enables the estimation of total and growing biomass of the glucose-consuming, i.e., the major part of the entire microbial community (Panikov, 1995; Panikov and Sizova, 1996). By combining substrate-induced respiration (SIR) (Anderson and Domsch, 1986) and substrate-induced growth respiration (SIGR) of microbial cells (Panikov, 1995) we are able to estimate soil microbial biomass as well as its growing proportion. Despite that the SIGR approach is based on the unlimited exponential microbial growth induced by an excess of substrate, the steepness of the growth curve (determined by CO2 evolution rate) is different in soils varying in abiotic or biotic properties (Panikov, 1991; Blagodatsky et al., 2000). All the mentioned techniques can determine the typical microbial growth curves of microorganisms during microbial non-steady state (increase in microbial respiration/abundance, Figure 1). These growth curves show different phases of microbial growth, namely (1) lag, (2) exponential, (3) stationary and 4) death phase (Figure 1). In general, the lag phase metabolism may include the activation of signaling pathways and specific transcriptional changes which might lead to the upregulation of protein assembly, nucleotide metabolism, lipopolysaccharide biosynthesis, respiration, and other processes which are needed for differentiation and multiplication (Hamill et al., 2020). These processes occur during lag phase, initiate exponential growth and cell divisions (Panikov, 1991). The stationary phase of microbial growth is characterized by stable (not increasing) microbial net biomass, which is more relevant for hemostat cultures, whereas it cannot be often detected in soils.
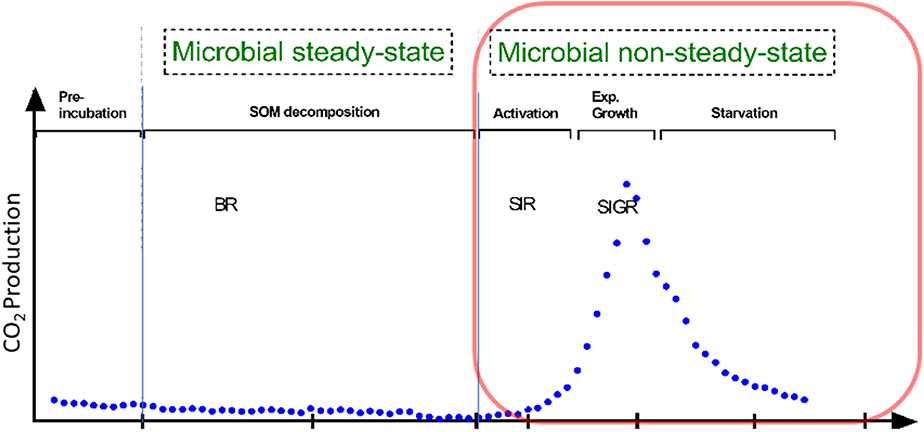
Figure 1. Conceptional soil microbial respiration: We focused on microbial non-steady state condition, reflecting the phases of microbial growth (lag, exponential growth). This is in contrast to the basal respiration (BR) without any additional substrate addition. Soil activation leads to increased protein synthesis in the early exponential phase; protein for motility occurs mainly at mid-exponential phase; in the late expontential phase typically accounts for stress resistance, since substratre gets scarce; stationary phase reflects stable to slight decreasing microbial biomass. Substrate-induced respiration (SIR) and substrate-induced growth respiration (SIGR) are commonly used to determine microbial growth parameter and microbial biomass.
Substrates of contrasting quality may favor microbial guilds with different intrinsic properties (e.g., maximum specific growth rates), while substrate amount and availability may affect duration of lag-time and exponential growth phases. Since nutrient acquisition is linked stoichiometrically to microbial growth dynamics, the production of extracellular enzymes is a basic strategy for microorganisms to prevent nutrient scarcity. There is still uncertainty, how soil enzyme systems support microbial growth during lag-, exponential-, and death phase. To survive under unfavorable environmental conditions and to be ready to metabolize the occasional substrate input, soil microorganisms can maintain a dynamic state, ready to adapt immediately to environmental changes by means of a wide range of genotypic and phenotypic accommodations. For example, cell mechanisms such as (i) modification of enzyme synthesis to take up growth-limiting nutrients, (ii) modulation of uptake rates for available nutrients, and (iii) coordination of anabolic processes to maintain balanced growth (van den Berg, 2001). The functional traits of the dominating population, i.e., specific growth rate, enzyme production and maintenance requirements are dependent on both the soil nutrition status, and the availability of the fresh substrate input. Especially, bacteria have developed sophisticated mechanisms to adapt to soil C availability. For example, the presence of glucose often prevents the use of other, secondary, carbon sources. This preference for glucose over other carbon sources has been termed glucose repression or, more generally, carbon catabolite repression (CCR) (Deutscher, 2008). Nowadays, CCR is defined as a regulatory phenomenon by which the expression of functions for the use of secondary carbon sources and the activities of the corresponding enzymes are reduced in the presence of a preferred carbon source (Görke and Stülke, 2008). Since CCR has been revealed in most free-living heterotrophic bacteria, including facultatively autotrophic bacteria, 5–10% of all bacterial genes are subjected to CCR (Liu et al., 2005). The selection of the preferred carbon source reflects an important factor in relation to the bacterial growth rate, and therefore competitive success with other microorganisms (Görke and Stülke, 2008).
Among numerous enzyme-mediated processes, several are usually specifically addressed due to their relevance for decomposition of SOM and therefore, for acquisition of elements (i.e., C, N, and P), which are critical for plant-microbial interactions and finally, for biochemical cycles. These processes are related to (1) decomposition of cellulose-like compounds—the most abundant components in plant tissues by cellulolytic enzymes (Blifernez-Klassen et al., 2012); (2) the proteolysis, which is of major importance in heterogeneous soil ecosystems, as it is considered as rate- limiting step during N mineralization (Weintraub and Schimel, 2005). For example, proteases such as exopeptidases (e.g., leucine-aminopeptidase) catalyze the hydrolysis of the terminal amino acids of polypeptide chains (Landi et al., 2011). (3) Decomposition of organic compounds is an important source of phosphorus acquisition due to relatively high abundance of organic P forms in soil. Therefore, specific enzymes, e.g., phytase and acid phosphor-mono- and di-esterase are released in large quantities by e.g., microbes and plants to access P forms in organic sources (Nannipieri et al., 2012; Jarosch et al., 2019).
The objective of this study was to unravel the changes of microbial functioning and their related enzyme systems in nutrient-poor (site Luess, LUE) and nutrient-rich (site Mitterfels, MIT) forest soil during phases of microbial growth. Therefore, we either used glucose, as simple substrate or a combination of glucose and yeast extract, reflecting a different substrate quality for microbial utilization. Glucose was used because the fraction of glucose-consuming microorganisms is generally large and relatively constant across different soil types and glucose is one of the most abundant sugars exuded by roots (Ottow, 2011). As an additional source of substrate, we used yeast extract because it consists of organic nutritional compounds similar to microbial (in large extent fungal) residues present in forest ecosystems. Yeast extract contains a broad range of sugars, phosphates, proteins and lipids, purines and pyrimidines (RNA type), Mg2+ and Ca2+, chitosan, and chitin (Bartnicki-Garcia and Nickerson, 1962; Pronk, 2002).
We hypothesized that during lag phase (i) an acceleration of enzyme activity in soil with lower nutrient status would occur, (ii) enzyme activity would be altered by the addition of yeast extract in nutrient-poor compared to nutrient-rich soil, as the enzymes' affinity is assumed to change. We further hypothesized that during exponential growth: (iii) microorganisms would increase enzyme activity, mining for additional nutrients in order to maintain growth. This effect may be more pronounced in the nutrient-poor soil, because of lower initial soil resources. We also hypothesized that (iv) the glucose + yeast extract amendment would reduce enzyme activity, which can either affect the synthesis of catabolic enzymes via global or specific regulators or inhibit the uptake of a carbon source (Park et al., 2006; Deutscher, 2008). For growth retardation, we hypothesized that (v) enzymatic activity would be maintained at a high level and it would not decrease with respiration.
Materials and Methods
Experimental Sites and Soil Sampling
The nutrient-poor field site is located at lower Saxon plain, a landscape that is predominantly shaped by Pleistocene glaciation. The nutrient-rich soil was sampled from the forest monitoring station Mitterfels (MIT), situated on the eastern front ridge of the Bavarian Forest. We sampled the Ah horizon of the nutrient-poor and the A(e)h of nutrient-rich soil in June 2017 and immediately started the incubation experiment. Both studied forest sites showed acidic pH values (Bergkemper et al., 2016; Lang et al., 2017).
Experimental Setup
We incubated 1.5 g of moist soil in a small flask inserted into the larger tube with the sodium hydroxide to trap the CO2 at 22°C and measured CO2 production via changes in electric conductivity by rapid automated bacterial Impedance technique (RABIT) (Don Whitley Scientific Limited, UK) (Fehlhaber and Krüger, 1998). The indirect technique of RABIT provides a flexible and calibrated impedance method which monitors the amount of carbon dioxide produced by growing organisms. Soil samples were kept in closed systems (microcosm) under quasi-stationary conditions and the evolved CO2 was measured every 20 min. After 24 h the CO2 efflux showed stable values and we started the experiment. A first sampling determined the background values of enzymes activity in the soils without the addition of any substrate. Thereafter, two treatments for substrate addition were established (1) glucose (2) glucose + yeast extract. Substrate concentrations, enough for unlimited exponential growth of microorganisms, were estimated based on preliminary experiments and were adjusted in a rate equivalent to ~100% of the microbial biomass C, measured in the field. Glucose with nutrients (1.9 mg g−1 (NH4)SO4, 2.25 mg g−1 K2HPO4 and 3.8 mg g−1 MgSO4-7H2O) was added to the soil as solutions via micro-pipetting onto the surface of the soil. Yeast extract amounted 0.3 mg per g soil (C ~258 and N ~30 μg g−1), so that it could not serve as essential C-source to induce exponential microbial growth. Substrates were dissolved and added to the soil as a solution, to reach a resulting moisture to the 60% of WHC. A destructive sampling design was chosen to determine enzyme kinetics during the phases of exponential microbial growth and retardation. Details on experimental duration and time spans of measurements are shown in Figure 4. Microbial biomass was determined by substrate-induced respiration (SIR) based on CO2 efflux measured the first 4 h after substrate addition (Anderson and Domsch, 1986; Anderson and Joergensen, 1997) and the conversion factor of 30 suggested by Kaiser et al. (1992) was used. Overall, SIR is a sensitive method and well-reproducible (Heinemeyer et al., 1989).
Soil Extracellular Enzyme Activities
We determined the enzyme activities of β-glucosidase, acid phosphatase, β-N-Acetylglucosaminidase (NAG), and leucine-aminopeptidase. An aliquot of 0.5 g soil of the sample was sonicated in 50 ml autoclaved millipore water in sterile jars for 2 min at low energy level. Aliquots of 50 μl of aliquot were pipetted in 96-well-microplates (Brand pureGrade, black) while stirring the soil suspension. Additionally, we buffered the solution either with 80 ml 0.1 M MES buffer, at pH 6.1 for β-glucosidase, NAG, and phosphatase, or with 0.05 M TRIZMA buffer, at pH 6.8 for leucine-aminopeptidase. Lastly, 100 μl substrate solutions with the following concentrations were filled into the wells: 20, 40, 60, 80, 100, 200, 400 μmol substrate g soil−1. Microplates were set to a temperature of 21°C and agitated before determination of fluorescence (excitation 360 nm; emission 450 nm) via an automated fluorometric plate-reader (Wallac 1420, Perkin Elmer, Turku, Finland) after 30, 60, 90, and 120 min.
We used Michaelis Menten kinetics a non-linear regression to estimate the maximal enzyme (potential) activity (Vmax), (Stemmer, 2004; Sinsabaugh et al., 2010; Nannipieri et al., 2012). Each soil sample was measured as an analytical triplicate.
The reaction rate (v) is mediated by enzymes. Vmax reflects maximal decomposition rates at saturating substrate concentrations; Km is the concentration of substrate at half-maximum activity and thus is a value which has a negative correlation with the enzyme affinity to the substrate. The substrate turnover time was determined by (Km+S)/Vmax (Panikov, 1991; Larionova et al., 2007).
Growth Rate Model
The use of substrate-induced growth respiration (SIGR) to disentangle the soil microbial biomass, its active part and maximum specific growth rate has become a common tool in soil science (Blagodatsky et al., 2000). SIGR differs from SIR method in terms of the phase of CO2 evolution and time interval (Loeppmann et al., 2016a). The change in CO2 production (p) with time (t) in soil amended with glucose and nutrients was calculated by Equation (2), where A (uncoupled respiration) = (1–r0) Q'x0, B (coupled respiration) = r0 Q x0, and μ = YCO2 (Q–Q'). Therefore, the steepness of the growth curve represents the intrinsic functional trait of the growing microbial population and it can be estimated by the maximum specific growth rate after the fitting of experimental data to Equation (2) (Wutzler et al., 2012).
According to Panikov (1995), the specific respiration activity measured under excess substrate is denoted as Q, and the cyanide-resistant fraction Q'; the productive fraction of the total respiration is then equal to Q–Q'. YCO2 is yield of biomass C per unit of respired C-CO2, assumed to be constant during the experiment and equal to 1. The parameters of Equation (5) were fitted by minimizing the least- square sum using MODEL MAKER-3 software (SB Technology Ltd). Fitting was restricted to the part of the curve that corresponded to unlimited exponential growth, as indicated by maximum values of r, F, and Q statistic criteria. r0 was calculated from the ratio of A:B (Panikov and Sizova, 1996).
where λ = (Q–Q')/Q and may be accepted as a basic stoichiometric constant = 0.9 (Panikov and Sizova, 1996). The total glucose-metabolizing microbial biomass (sustaining+growing; x0) was calculated as following:
The growing microbial biomass (GMB, x0') was calculated using the equation: x0
The lag period (tlag) was determined as the time interval from substrate amendment to the moment when the increasing rate of growth-related respiration [B exp(mt)] became as high as the rate of respiration uncoupled from the growth of microorganisms [A] [Equation (1)]. tlag was calculated using the parameters of the approximated respiration curve by the following equation:
Determination of dsDNA Content
For quantitative soil DNA extraction, we used the MP Bio kits (MP Biomedicals, Germany). DNA extraction was performed during lag phase according to the manufacturer's protocol with 0.5 g of fresh moist soil treated by the FastDNA® SPIN kit for Soil (MP Biomedicals, Germany). Detailed information on extraction and quantification of dsDNA can be found in Loeppmann et al. (2018). A conversion factor of 5.0 was used to convert mg DNA g−1 soil to mg microbial biomass C g−1 soil (Anderson and Martens, 2013; Loeppmann et al., 2018).
Statistics
Significant effects of process parameter (e.g., μmax) between treatments (substrate and soil) were assessed by ANOVA at p < 0.05. The parameters of the equation were fitted by minimizing the least-square sum using GraphPad Version 8 software (Prism, USA). The normality distribution of the data was checked using the Shapiro-Wilks test and if necessary, transformed to log distribution. Equality of variances were analyzed by Levene's test. The degree of linear association between pairs of values separated by a given distance was obtained from the self- or autocorrelation using PAST4.01 (Hammer and Harper, 2006) which allowed an observation of temporal processes at and between local maxima and minima within the sampled domain. In general, physical, chemical, and biological reactions occurring rapidly manifest smaller temporal correlation lengths than those occurring more slowly. The 95% confidence band is technically appropriate only at each individual lag, not for the complete autocorrelation function. Cross correlation was used to compare the two different time series, covering the same time span (Miller, 1979). Prior to cross correlation analysis the data was de-trended to prevent non-stationarity (Podobnik and Stanley, 2008) and pre-whitened to remove spurious correlations, based on temporal dependencies between adjacent values of the input time-series. This technique removes the influences from the output time-series (Shumway and Stoffer, 2017). Parameter optimization was restricted to the applied model Equation 2, as indicated by maximum values of statistic criteria: r2, the fraction of total variation explained by the model defined as ratio of model weighted sum of squares to total weighted sum of squares.
Results
Activation and Growth of Soil Microorganisms
The CO2 response of microbial respiration to glucose addition was 83% higher in nutrient-rich (Mitterfels) than in nutrient-poor soil (Luess) reflecting a stronger microbial activation and higher total biomass C (Figure 2, Table 2). A similar pattern was depicted for nutrient-rich soil after combined substrate addition, showing an increase of 48% compared to nutrient-poor soil.
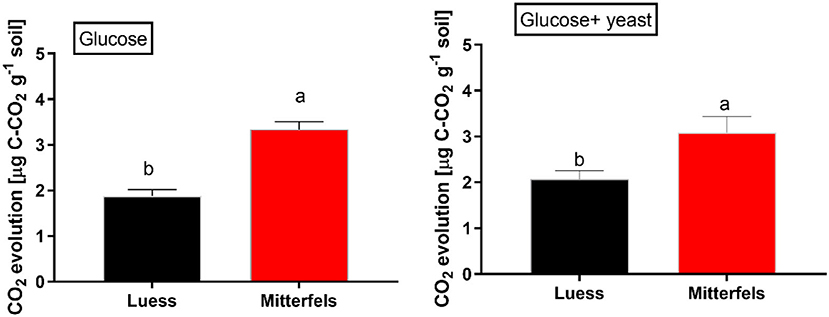
Figure 2. Soil substrate-induced respiration (SIR) including standard error of mean (SEM) measured by CO2 production in two forest soils planted with beech. Significant differences between the sites are denoted by lower case letters at a significance level of p < 0.05. Note, SIR-derived CO2 is measured before exponential growth phase sets in.
The maximum specific growth rate of microorganisms was significantly higher (34% for glucose; 17% glucose + yeast extract) in nutrient-poor soil than in nutrient-rich soil (Figure 3), indicating a faster microbial turnover and shorter generation times. Although, the growth rate was similar in nutrient-poor soil irrespective of the type of substrate addition, the proportion of growing microbial biomass increased by three times, and the lag time shortened by 6 h in yeast extract vs. sole glucose treatment (Table 1). This indicates a positive feedback of the additional growth factors derived from the yeast extract. The active microbial biomass proportion increased by 5% and the lag time shortened by 4 h in nutrient-rich soil (Table 1). The dsDNA-derived microbial biomass C content during the first 10 h after substrate addition (taken as an average) was slightly higher when the glucose + yeast extract was added irrespective of the soil. This was in line with the faster specific growth rate of microorganisms in nutrient-poor soil (Figure 4).
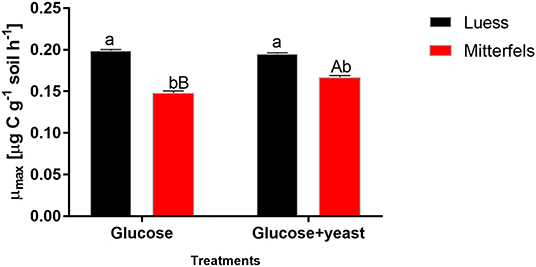
Figure 3. Maximum specific growth rates including SEM of soil microorganisms after the addition of either glucose or the combination of glucose and yeast extract. Significant differences (P < 0.05) between sites were denoted by lower-case letters. Capital letters denote significant differences between the substrate addition at identical level.
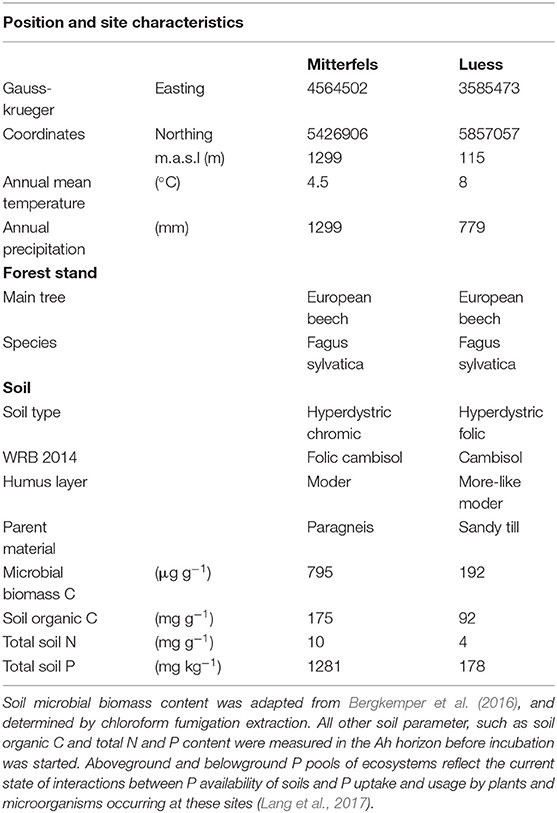
Table 1. Position and site characteristics were adapted from Lang et al. (2017).
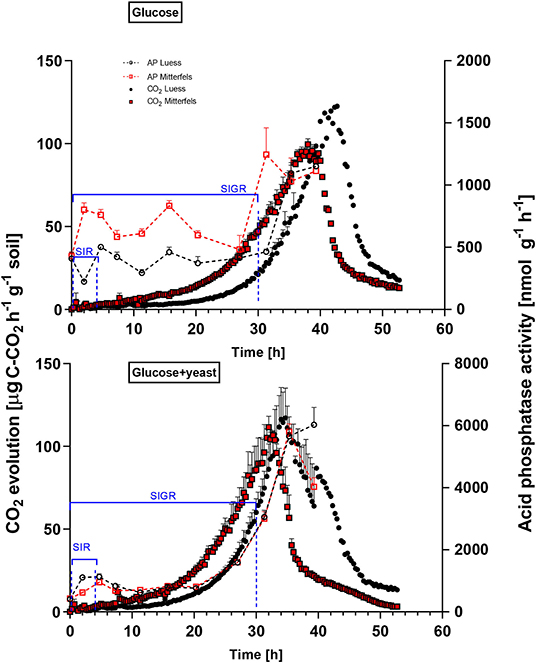
Figure 4. Microbial growth curves and potential enzyme activities (dotted lines) are shown including SEM for soils treated with glucose vs. glucose + yeast extract. The nutrient-poor soil is denoted by black circles, whereas nutrient-rich soil is highlighted in red squares. The values given at time point zero, reflected the control, namely without the addition of any substrate. The time interval chosen for calculation of SIR are denoted in blue brackets. For kinetic parameters of SIGR, the whole curve including lag phase is required for modeling, which is also shown in blue.
β-glucosidases and NAG demonstrated higher activity in nutrient-rich than in nutrient-poor soil prior substrate addition (t = 0) (Figure 5). After glucose addition, activity of β-glucosidases did not increase during exponential microbial growth in nutrient-rich soil (MIT) (Figure 5), indicating stable enzymatic functioning on C utilization throughout experimental duration. However, β-glucosidase demonstrated strong response to glucose addition in nutrient-poor soil (LUE), by increasing activity during exponential growth of microorganisms. Correspondingly, the CO2 efflux increased in nutrient-poor soil (Figure 4).
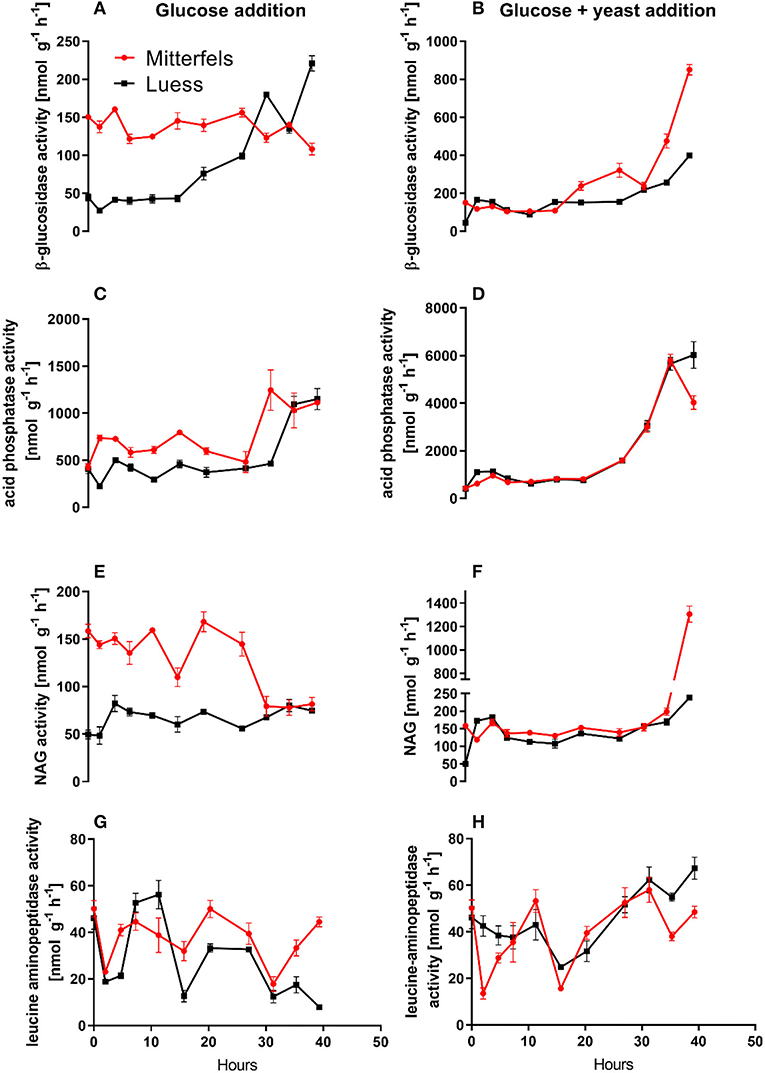
Figure 5. Potential activities (Vmax) including standard error of mean of C- N- and P-cycling enzymes during microbial growth and retardation. (A,B) beta-glucosidase, (C,D) acid phosphatase, (E,F) NAG, (G,H) leucine-aminopeptidase.
Activity of β-glucosidase and acid phosphatase increased with microbial growth curves when the glucose + yeast extract was added and reached the maximum in the phase of microbial retardation. Acid phosphatase activity showed more steady time constraint after the glucose + yeast extract addition compared to the amendment of sole glucose. Moreover, we found stronger responses of enzymes and their substrate turnover times in nutrient-poor than in nutrient-rich soil. The additional substrate input of yeast extract induced a greater shortage of substrate turnover time in nutrient-poor soil (Figure 8), which was in line with a faster microbial growth rate (Figure 3). Overall, the turnover time was enzyme-specific, being the shortest for acid phosphatase and the longest for leucine aminopeptidases during both, lag time and exponential growth (Table 2).
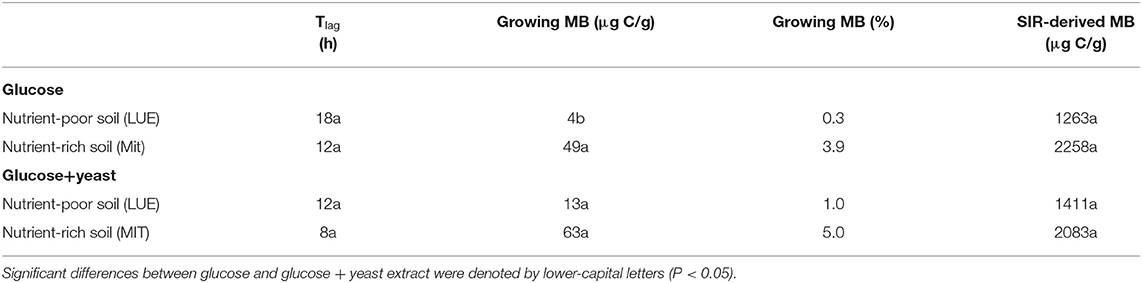
Table 2. Microbial growth respiration parameters, such as lag phase (Tlag), actively growing microbial biomass (MB) according to Panikov (1995) and substrate-induced respiration derived microbial biomass content after Anderson and Domsch (1986) including the conversion factor used by Kaiser et al. (1992).
Self- and Cross- Correlation
Single substrate addition increased the self-correlation of acid phosphatase (till a lag of 3 h) more in nutrient-poor than in nutrient-rich soil (Figure 6), reflecting increased predictability of enzyme activities during microbial growth because of the stability of kinetic reaction parameters such as the Michaelis-Menten constant. The glucose + yeast extract addition increased autocorrelation length of acid phosphatase in both soils (Figure 6). In comparison, β-glucosidase exhibited contrasting time constraints by glucose addition, where only nutrient-poor soil was stable (r ~ 0.6 at lag 3 h). Adding both substrates the autocorrelation of β-glucosidase revealed r > 0.4, accounting a lag of 2 h at each of the sites.
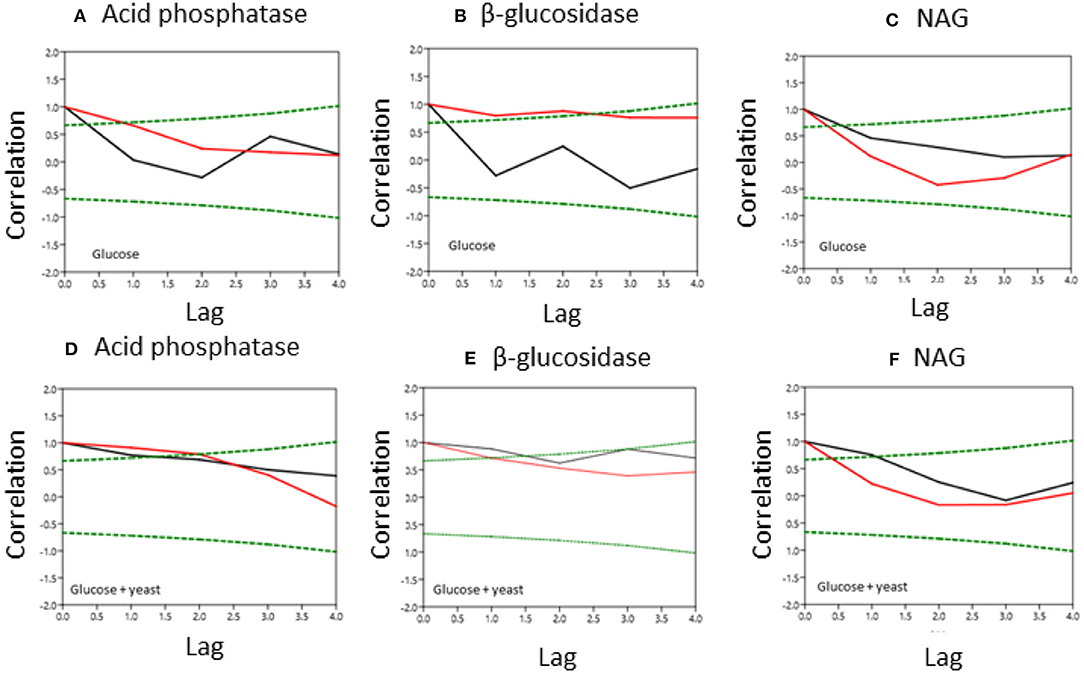
Figure 6. Normalized covariance function of enzyme activities during microbial growth in nutrient-poor (black line) and nutrient-rich (red line) soils. Upper graphs show glucose amendment and below graphs depict glucose + yeast extract. The x-axis shows the lag in hours and y-axis the correlation coefficient. The green dashed line denotes the confidence bands (P < 0.05), reflecting the significant confidence interval of autocorrelation. (A, D) acid phosphatase, (B,E) beta-glucosidase; (C,F) NAG.
To test for similarities between the sites cross-correlation of enzyme activities was performed. Cross-correlation of acid phosphatase activity between nutrient-rich and nutrient-poor soil revealed a significant (P < 0.05) relation till a lag of −1.5 h for both sites by adding glucose (Figure 7). However, for the glucose + yeast extract, the cross-correlation of acid phosphatase between nutrient-poor and nutrient-rich soil was highly significant till a lag of −1.5 h and also to a lag of 1.5 h between the two site, indicating harmonized time constraints of acid phosphatase during the phase of microbial growth. Strongest cross-correlation between nutrient-poor and nutrient-rich soil was exhibited for the C-cycling enzyme β-glucosidase reflecting a high degree of similarity of the two time series between the sites during exponential growth of microorganisms (r > 0.6 up to a lag of –3 h; P < 0.05) (Figure 7).
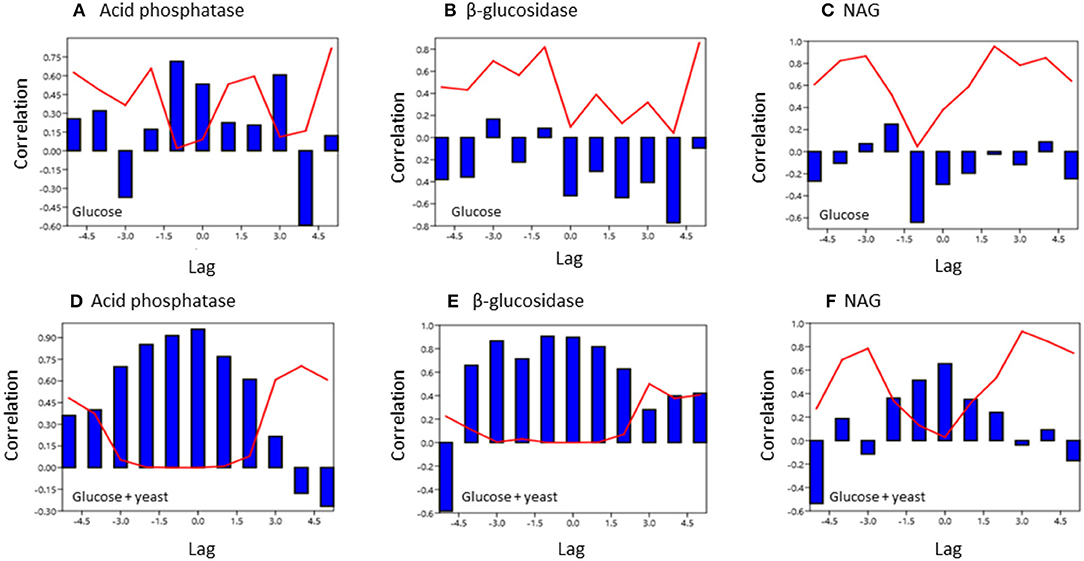
Figure 7. Cross covariance function of enzyme activities during microbial growth was computed between the two soils of contrasting nutrient content. The x-axis shows the lag in hours and y-axis the correlation coefficient. The red line denotes the level of significance (P < 0.05) at a specific lag. (A,D) acid phosphatase, (B,E) beta-glucosidase; (C,F) NAG.
Discussion
Microbial Growth After Substrate Addition in Contrasting Forest Soils
During non-steady state of microbial growth, we detected higher microbial biomass and higher proportion of growing microbial biomass along with a shorter lag time in nutrient-rich than in nutrient-poor soil, which reflected a well-adapted microbial response to the added substrate as well as the higher initial nutrient stock (Loeppmann et al., 2016a,b; Lang et al., 2017). However, the maximum specific growth rate of microorganisms was higher in nutrient-poor soil, indicating faster growing microorganisms than in nutrient-rich soil. The fact that most microbial groups existed at both sites (43% of identified microbial groups) (Bergkemper et al., 2016) does not necessarily imply that the communities were similar. Nevertheless, we assume a high sustainability potential due to broad microbial diversity independent from the soil nutrient status. However, significant differences of microbial specific growth rates between sites indicated wide disparity in microbial community structure (Fuhrman, 2009). This reflects the high abundance of unique bacterial groups in nutrient-poor soil, which points to a specific adaption of the community to P limitation at this site (Bergkemper et al., 2016). Despite the fact that specific growth rate reflects the respiratory response of microbial community as a whole (Panikov, 1995; Panikov and Sizova, 1996), it mainly characterizes a few or even single microbial assemblies dominating competition for a single input of glucose (Mau et al., 2015). As single glucose addition is insufficient to activate large number of glucose-metabolizing taxa (Mau et al., 2015), the SIGR approach does not alter functional structure of the community and it simulates an occasional input of available substrate under conditions of substrate excess (Ehlers et al., 2010).
The glucose + yeast extract addition increased the specific growth rate of microbes by 15% solely in the nutrient-rich soil (Figure 3). We did not reveal any repression of respiration by CCR (Deutscher, 2008) compared with sole glucose addition, presumably due to relatively low input of yeast extract insufficient to initiate microbial growth. In contrast, glucose was quickly metabolized during exponential growth causing microbial starvation and growth retardation instead of catabolite repression. Another explanation could be that CCR occurred in a very short-term immediately after substrate addition to soil. We revealed that glucose repressed an activity of enzymes related to cleavage of carbohydrates and proteins but only in short-term (10 h). This infers that those bacteria affected by CCR may be easily outcompeted by other microorganisms during phase of exponential growth. In addition, the enzyme activity was more stable (smooth) and more synchronous with CO2 evolution with the amendment of glucose + yeast extract indicating an absence of catabolic repression.
The addition of yeast extract along with glucose to nutrient-poor soil increased maximum specific growth rate, shortened the lag phase and enhanced the portion of growing microbial biomass compared to the amendment of glucose. This clearly indicated that the substrate diversity and quality are of great importance during lag and exponential microbial growth. We determined 2–3-times higher potential β-glucosidase, acid phosphatase and NAG activity in nutrient-rich than in nutrient-poor soil with the addition of glucose. As a result of NAG activity, amino sugars derived from peptidoglycan (bacterial cell walls, e.g., microbial necromass) and chitin (fungal cell walls) decomposition could have contributed substantially to the dissolved organic N pool (Hu et al., 2018) and subsequently fueling microbial demands (Geisseler et al., 2009).
Limitations in gene expression may play a role in generating phenotypic diversity, which is advantageous in fluctuating environments, at the expenses of decreasing growth rates (Kim et al., 2020). Since acid phosphatases have been shown to correlate with the soil microbial C content and with abundance of bacterial phoN genes in the field (Spohn et al., 2018), we assume optimized trade-offs between resource allocation and growth of microorganisms.
By the addition of glucose + yeast extract, the lag phase of growing microorganisms shortened irrespective of the initial nutrient content (Table 2), reflecting an advanced adaptation to the newly available resources, fueling a balanced, and less stressed metabolic network (Hamill et al., 2020). However, the substrate turnover time of C-, N-, and P-cycling extracellular enzymes during lag phase and exponential growth of microorganisms was stable in nutrient-rich soil, whereas the substrate turnover time of enzymes was strongly shortened in nutrient-poor soil (Figure 8). This indicates that organic nutrients derived from the yeast extract were the preferential source to overcome microbial resource scarcity only in nutrient-poor soil.
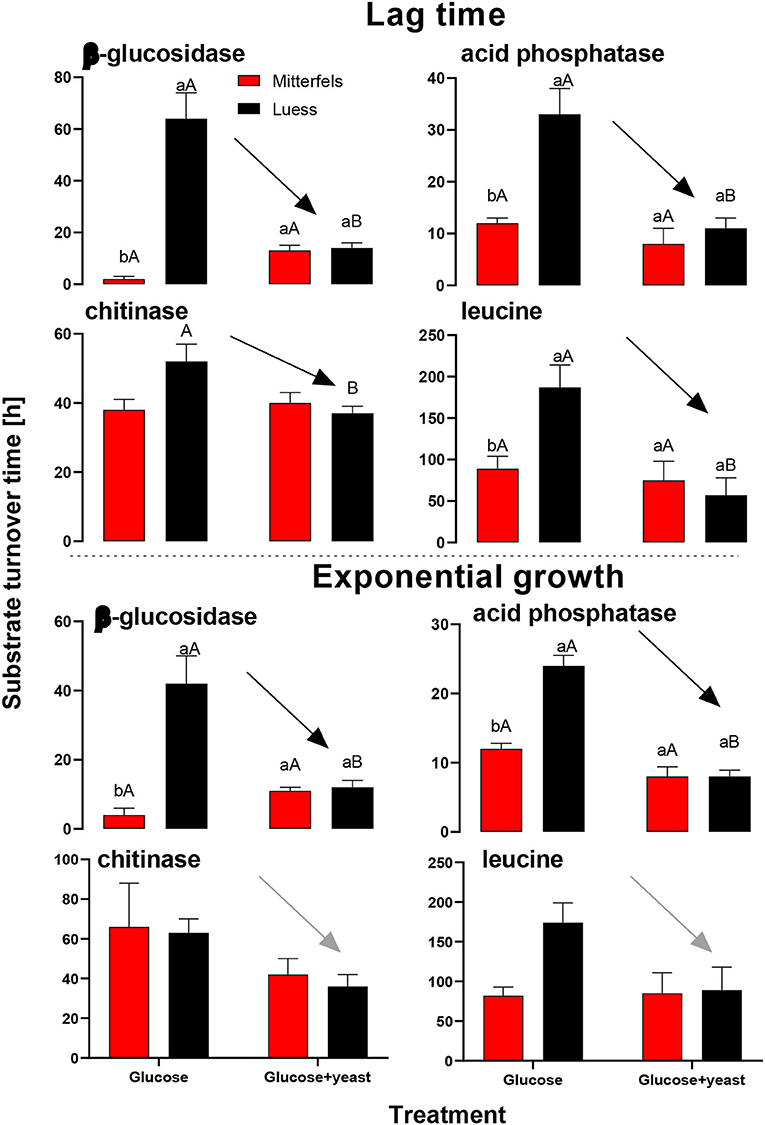
Figure 8. Substrate turnover time of C-, N-, and P-cycling extracellular enzymes during lag phase and exponential growth of microorganisms according to Tischer et al. (2015). The nutrient-poor site is shown by black and the nutrient-rich by red bars. As substrates either glucose or the combination of glucose and yeast extract was added to two soils of nutrient stocks (Table 1). Significant differences between substrate addition were denoted by capital letters at a level of significance of P < 0.05. Lower letters indicate the significant differences between the sites at identical level.
The dsDNA-derived microbial biomass in nutrient-poor soil was close to the one of nutrient-rich soil (Figure 9), reflecting stronger activation potential of microorganisms in soil of lower initial MBC content. This was in line with the faster specific growth rate of microorganisms in nutrient-poor soil.
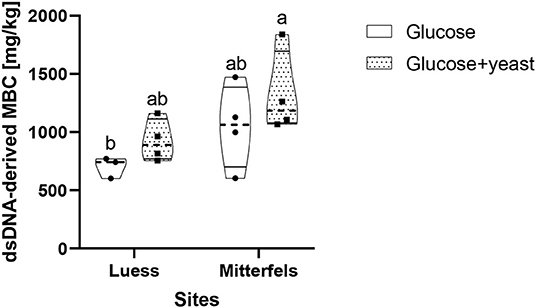
Figure 9. Violin plot of dsDNA-derived microbial biomass C (MBC) content during the first 10 h after substrate addition for nutrient-poor soil (Luess) and nutrient-rich soil (Mitterfels). The dashed line shows the median of MBC, the dots denote the replicates and the thin black line the quartiles. The lower-capital letter depicts the significant differences between sites at a level of 0.1.
Microbial growth is often preceded by adapting the physiological state of the microbial cells, during the lag phase (Madar et al., 2013). A recent study on single cells has revealed that individual bacteria vary in the time required to reach first cell division (Bertrand, 2019) and that with increasing number of stressed or nutrient limited cells, the lag phase becomes longer and the time-points at which individual cells begin dividing show increased scattering (Smelt et al., 2002; Guillier et al., 2006).
Enzyme Activities During the Phase of Microbial Growth
Acid phosphatase activity increased during microbial growth in both, nutrient-rich and nutrient-poor soil. The maximum of potential acid phosphatase activities was reached in the phase of microbial growth retardation. This may be explained by the active excretion of phosphatases or their release by cell lysis after death, which reflect a crucial portion in the build-up of indigenous soil phosphatase activity (Jarosch et al., 2019). When microbes start to mine for nutrients, they invest in enzyme production related to their specific needs. Many different pathways of organics' degradation, including amino acid, glycolytic, and fatty acid pathways, utilize enzyme cascades processing a broad range of substrates, which increases the chance of microbial recycling of dead cell residues. Therefore, in order to avoid the detection of CO2 derived from microbial recycling experimental our duration was kept short.
The substrate turnover time was enzyme-specific and ranged from hours to days. During microbial growth substrate turnover of enzymes was shorter than reported from the field (natural forest) under steady state, ranging from 0.6 days for acid phosphatase to 646 days for α-glucosidase (Tischer et al., 2015). The addition of glucose + yeast extract increased β-glucosidase and NAG activity during lag phase exclusively in nutrient-poor soil. Strongest effects on activities and estimated substrate turnover time of enzymes were detected in nutrient-poor soil when both substrates were added in combination, implying a strong affinity to these substrates and therefore, an adequate strategy on the recycling of organic compounds.
By adding the substrate combination cross-correlation of β-glucosidase and acid phosphatase between the two sites demonstrated harmonized time constraints, which reflected the establishment of comparable and balanced enzymatic systems for substrate utilization during lag time. Consequently, accelerating nutrient acquisition to maintain microbial growth, irrespective of contrasting soil properties, and initial nutrient stocks, was demonstrated by the temporal interpolation between their measured values. This clearly indicates similar tradeoffs of C- and P- cycling enzymes in both soils reflecting comparable temporal dynamics of enzyme activities in nutrient-poor and nutrient-rich soil during the phase of microbial growth when the glucose + yeast extract was added. Due to the individual composition of compound-classes of different decomposability, necromass of different microbial groups, such as yeast residues, reflect a wide range of decomposition rates (Six et al., 2006). Despite the different decomposability of microbial cell wall components during microbial steady state, no difference in the mean residence time of necromass C in soil among bacteria, actinobacteria, and fungi was found (Throckmorton et al., 2012). Here, during microbial non-steady state conditions a faster microbial turnover was present in nutrient-poor soil suggesting faster recycling of microbial necromass-derived nutrients and reduced necromass C stabilization in nutrient-poor than in nutrient-rich forest soils.
Summary
Up to 34% faster specific growth rates of microorganisms, albeit of a small proportion of actively growing microbial biomass, were revealed in nutrient-poor than in nutrient-rich soil. This clearly showed the fast adaptation and activation of microorganisms, able to quickly uptake and grow fast on the sudden (single) substrate input. Therefore, a faster microbial turnover occurred in nutrient-poor soil, which shifted microbial substrate utilization and resulted in a shortened lag phase of microbial growth, irrespective of the initial soil nutrient status, because faster microbial activation and nutrient acquisition dynamics in the presence of additional microbial residues i.e., yeast extract took place. This was in line with a strong reduction of substrate turnover time of all enzymes in nutrient-poor soil. Cross-correlation analysis of enzyme activities between the two sites demonstrated harmonized time constraints of enzyme systems which reflected the establishment of comparable and balanced enzymatic systems within the decomposition network. This became evident as similar tradeoffs of C- and P- cycling enzymes occurred in both soils. However, significant differences in microbial community structure, due to high abundance of unique bacterial groups in nutrient-poor soil, indicated a specific adaption of the community to P limitation at this site. Glucose repressed an activity of enzymes related to cleavage of carbohydrates and proteins only in short-term (10 h), inferring that those bacteria affected by catabolic repression may be easily outcompeted by other soil microorganisms during exponential growth. Especially, β-glucosidase and acid phosphatase underlined an activity synchronous with CO2 evolution when glucose + yeast extract was added, which indicates an absence of bacterial catabolic repression during microbial growth in soil.
Data Availability Statement
All datasets generated for this study are included in the article/supplementary material.
Author Contributions
EB and SL developed an idea. EB, SL, and MD developed the project and contributed to the interpretation of the results. SL, AB, and SS wrote the manuscript, which was read and revised by all co-authors. SL performed statistics and data evaluation with support by SS. All authors listed have made a substantial, direct and intellectual contributions to the work, and approved it for publication.
Funding
Financial support was provided by the Deutsche Forschungsgemeinschaft (DFG) and acknowledge the experimental design of the Priority (Ecosystem nutrition: forest strategies for limited phosphorus resources, SPP1685) by grants to SS 200021E- 171173 and M.D. (DFG, DI 2136/6). The publication was prepared with the support of the RUDN University program 5-100. We acknowledge financial support by DFG within the funding programme Open Access Publizieren.
Conflict of Interest
The authors declare that the research was conducted in the absence of any commercial or financial relationships that could be construed as a potential conflict of interest.
References
Anderson, T.-H., and Domsch, K. H. (1986). Carbon assimilation and microbial activity in soil. Zeitschrift Für Pflanzenernährung Und Bodenkunde, 149, 457–468. doi: 10.1002/jpln.19861490409
Anderson, T.-H., and Joergensen, R. G. (1997). Relationship between SIR and FE estimates of microbial biomass C in deciduous forest soils at different pH. Soil Biol. Biochem. 29, 1033–1042. doi: 10.1016/S0038-0717(97)00011-4
Anderson, T. H., and Martens, R. (2013). DNA determinations during growth of soil microbial biomasses. Soil Biol. Biochem. 57, 487–495. doi: 10.1016/j.soilbio.2012.09.031
Baldrian, P., Kolarík, M., Štursová, M., Kopecký, J., Valášková, V., Větrovský, T., et al. (2012). Active and total microbial communities in forest soil are largely different and highly stratified during decomposition. ISME J.6, 248–258. doi: 10.1038/ismej.2011.95
Bardgett, R. D., and Putten, W. H. (2014). Belowground biodiversity and ecosystem functioning. Nature 515, 505–511. doi: 10.1038/nature13855
Bartnicki-Garcia, S., and Nickerson, W. J. (1962). Isolation, composition, and structure of cell walls of filamentous and yeast-like forms of Mucor rouxii. Biochim. et Biophys. Acta 58, 102–119. doi: 10.1016/0006-3002(62)90822-3
Bergkemper, F., Welzl, G., Lang, F., Krüger, J., Schloter, M., and Schulz, S. (2016). The importance of C, N and P as driver for bacterial community structure in German beech dominated forest soils. J. Plant Nutrit. Soil Sci. 179, 472–480. doi: 10.1002/jpln.201600077
Bertrand, R. L. (2019). Lag phase - a dynamic, organized, adaptive, and evolvable period that prepares bacteria for cell division. J. Bacteriol. 201:e00697-18. doi: 10.1128/JB.00697-18
Blagodatskaya, E., and Kuzyakov, Y. (2013). Active microorganisms in soil: critical review of estimation criteria and approaches. Soil Biol. Biochem. 67, 192–211. doi: 10.1016/j.soilbio.2013.08.024
Blagodatsky, S. A., Heinemeyer, O., and Richter, J. (2000). Estimating the active and total soil microbial biomass by kinetic respiration analysis. Biol. Fertil. Soils 32, 73–81. doi: 10.1007/s003740000219
Blifernez-Klassen, O., Klassen, V., Doebbe, A., Kersting, K., Grimm, P., Wobbe, L., et al. (2012). Cellulose degradation and assimilation by the unicellular phototrophic eukaryote Chlamydomonas reinhardtii. Nat. Commun. 3:1214. doi: 10.1038/ncomms2210
Deutscher, J. (2008). The mechanisms of carbon catabolite repression in bacteria. Curr. Opin. Microbiol. 11, 87–93. doi: 10.1016/j.mib.2008.02.007
Ehlers, K., Bakken, L. R., Frostegård, Å., Frossard, E., and Bünemann, E. K. (2010). Phosphorus limitation in a Ferralsol: impact on microbial activity and cell internal P pools. Soil Biol. Biochem. 42, 558–566. doi: 10.1016/j.soilbio.2009.11.025
Fehlhaber, K., and Krüger, G. (1998). The study of Salmonella enteritidis growth kinetics using rapid automated bacterial impedance technique. J. Appl. Microbiol. 84, 945–949. doi: 10.1046/j.1365-2672.1998.00410.x
Fuhrman, J. A. (2009). Microbial community structure and its functional implications. Nature 459, 193–199. doi: 10.1038/nature08058
Geisseler, D., Horwath, W. R., and Doane, T. A. (2009). Significance of organic nitrogen uptake from plant residues by soil microorganisms as affected by carbon and nitrogen availability. Soil Biol. Biochem. 41, 1281–1288. doi: 10.1016/j.soilbio.2009.03.014
Görke, B., and Stülke, J. (2008). Carbon catabolite repression in bacteria: many ways to make the most out of nutrients. Nat. Rev. Microbiol. 6, 613–624. doi: 10.1038/nrmicro1932
Guillier, L., Pardon, P, and Augustin, J. C. (2006). Automated image analysis of bacterial colony growth as a tool to study individual lag time distributions of immobilized cells. J. Microbiol. Meth. 65, 324–334. doi: 10.1016/j.mimet.2005.08.007
Hamill, P. G., Stevenson, A., McMullan, P. E., Lewis, A. D. R., Sudharsan, S., Stevenson, K. E., et al. (2020). Microbial lag phase can be indicative of, or independent from, cellular stress. Sci Rep. 10:5948. doi: 10.1038/s41598-020-62552-4
Hammer, Ø., and Harper, D. A. T. (2006). PAST. Paleontological statistics. version 2.07. Reference manual. Blackwell Publ. 351. doi: 10.1016/j.bcp.2008.05.025
Heinemeyer, O., Insam, H., Kaiser, E. A., and Walenzik, G. (1989). Soil microbial biomass and respiration measurements: an automated technique based on infra-red gas analysis. Plant Soil 116, 191–195. doi: 10.1007/BF02214547
Hu, Y., Zheng, Q., Zhang, S., Noll, L., and Wanek, W. (2018). Significant release and microbial utilization of amino sugars and D-amino acid enantiomers from microbial cell wall decomposition in soils. Soil Biol. Biochem. 123, 115–125. doi: 10.1016/j.soilbio.2018.04.024
Jansson, J. K., and Prosser, J. I. (2013). Microbiology: the life beneath our feet. Nature 494, 40–41. doi: 10.1038/494040a
Jarosch, K. A., Kandeler, E., Frossard, E., and Bünemann, E. K. (2019). Is the enzymatic hydrolysis of soil organic phosphorus compounds limited by enzyme or substrate availability? Soil Biol. Biochem. 139:107628. doi: 10.1016/j.soilbio.2019.107628
Jobbágy, E. G., and Jackson, R. B. (2000). The vertical distribution of soil organic carbon and its relation to climate and vegetation. Ecol. Appl. 10, 423–436. doi: 10.1890/1051-0761(2000)0100423:TVDOSO2.0.CO
Kaiser, E. A., Mueller, T., Joergensen, R. G., Insam, H., and Heinemeye, O. (1992). Evaluation of methods to estimate the soil microbial biomass and the relationship with soil texture and organic matter. Soil Biol. Biochem. 24, 675–683. doi: 10.1016/0038-0717(92)90046-Z
Kim, J., Darlington, A., Salvador, M., Utrilla, J., and Jiménez, J. I. (2020). Trade-offs between gene expression, growth and phenotypic diversity in microbial populations. Curr. Opin. Biotechnol. 62, 29–37. doi: 10.1016/j.copbio.2019.08.004
Kowalchuk, G. A., and Stephen, J. R. (2001). Ammonia-oxidizing bacteria: a model for molecular microbial ecology. Ann. Rev. Microbiol. 55, 485–529. doi: 10.1146/annurev.micro.55.1.485
Lamanna, C., Blonder, B., Violle, C., Kraft, N. J., Sandel, B., Šímová, I., et al. (2014). Functional trait space and the latitudinal diversity gradient. Proc. Natl. Acad. Sci.U.S.A. 111, 13745–13750. doi: 10.1073/pnas.1317722111
Landi, L., Renella, G., Giagnoni, L., and Nannipieri, P. (2011). Activities of proteolytic enzymes. Methods soil enzymology, 9, 247–260.
Lang, F., Bauhus, J., Frossard, E., George, E., Kaiser, K., Kaupenjohann, M., et al. (2016). Phosphorus in forest ecosystems: new insights from an ecosystem nutrition perspective. J. Plant Nut. Soil Sci. 179, 129–135. doi: 10.1002/jpln.201500541
Lang, F., Krüger, J., Amelung, W., Willbold, S., Frossard, E., Bünemann, E. K., et al. (2017). Soil phosphorus supply controls, P., nutrition strategies of beech forest ecosystems in Central Europe. Biogeochemistry 136, 5–29. doi: 10.1007/s10533-017-0375-0
Larionova, A. A., Yevdokimov, I. V., and Bykhovets, S. S. (2007). Temperature response of soil respiration is dependent on concentration of readily decomposable C. Biogeosciences 4, 1073–1081. doi: 10.5194/bg-4-1073-2007
Lauber, C. L., Strickland, M. S., Bradford, M. A., and Fierer, N. (2008). The influence of soil properties on the structure of bacterial and fungal communities across land-use types. Soil Biol. Biochem. 40, 2407–2415. doi: 10.1016/j.soilbio.2008.05.021
Lennon, J. T., and Jones, S. E. (2011). Microbial seed banks: the ecological and evolutionary implications of dormancy. Nat. Rev. Microbiol. 9, 119–130. doi: 10.1038/nrmicro2504
Liang, C., Cheng, G., Wixon, D. L., and Balser, T. C. (2011). An Absorbing Markov Chain approach to understanding the microbial role in soil carbon stabilization. Biogeochemistry 106, 303–309. doi: 10.1007/s10533-010-9525-3
Liu, M., Durfee, T, Cabrera, J., Zhao, K., Jin, D. J., and Blattner, G. R. (2005). Global transcriptional programs reveal a carbon source foraging strategy by Escherichia coli. J. Biol. Chem. 280, 15921–15927. doi: 10.1074/jbc.M414050200
Loeppmann, S., Blagodatskaya, E., Pausch, J., and Kuzyakov, K. (2016b). Substrate quality affects kinetics and catalytic efficiency of exo-enzymes in rhizosphere and detritusphere. Soil Biol. Biochem. 92, 111–118. doi: 10.1016/j.soilbio.2015.09.020
Loeppmann, S., Semenov, M., Blagodatskaya, E., and Kuzyakov, Y. (2016a). Substrate quality affects microbial- and enzyme activities in rooted soil. J. Plant Nut. Soil Sci. 179, 39–47. doi: 10.1002/jpln.201400518
Loeppmann, S., Semenov, M., Kuzyakov, Y., and Blagodatskaya, E. (2018). Shift from dormancy to microbial growth revealed by RNA: DNA ratio. Ecol. Indicat. 85, 603–612. doi: 10.1016/j.ecolind.2017.11.020
Louca, S., Polz, M. F., Mazel, F., Albright, M. B., Huber, J. A., O'Connor, M. I., et al. (2018). Function and functional redundancy in microbial systems. Nat. Ecol. Evol. 2, 936–943. doi: 10.1038/s41559-018-0519-1
Madar, D., Dekel, E., Bren, A., Zimmer, A., Porat, Z., and Alon, U. (2013). Promoter activity dynamics in the lag phase of Escherichia coli. BMC Syst. Biol. 7:136. doi: 10.1186/1752-0509-7-136
Maksimova, I. A., and Chernov, I. Y. (2004). Community structure of yeast fungi in forest biogeocenoses. Microbiology 73, 474–481. doi: 10.1023/B:MICI.0000036994.21650.3a
Mau, R. L., Liu, C. M., Aziz, M., Schwartz, E., Dijkstra, P., Marks, J. C., et al. (2015). Linking soil bacterial biodiversity and soil carbon stability. ISME J. 9, 1477–1480. doi: 10.1038/ismej.2014.205
Miller, S. E. (1979). Univariate residual cross-correlation analysis: an application to beef prices. North Central J. Agri. Econ. 141–146. doi: 10.2307/1349421
Miltner, A., Bombach, P., Schmidt-Brücken, B., and Kästner, M. (2012). SOM genesis: microbial biomass as a significant source. Biogeochemistry 111, 41–55. doi: 10.1007/s10533-011-9658-z
Nannipieri, P., Giagnoni, L., Renella, G., Puglisi, E., Ceccanti, B., Masciandaro, G., et al. (2012). Soil enzymology: classical and molecular approaches. Biol. Fert. Soils 48, 743–762. doi: 10.1007/s00374-012-0723-0
Ottow, J. C. (2011). Ottow, J. C. (2011). Mikrobiologie von Böden: Biodiversität, Ökophysiologie und Metagenomik. Springer-Verlag.
Panikov, N. S., and Sizova, M. V. (1996). A kinetic method for estimating the biomass of microbial functional groups in soil. J. Microbiol. Methods 24, 219–230. doi: 10.1016/0167-7012(95)00074-7
Park, Y. H., Lee, B. R., Seok, Y. J., and Peterkofsky, A. (2006). In vitro reconstitution of catabolite repression in Escherichia coli. J. Biol. Chem. 281, 6448–6454. doi: 10.1074/jbc.M512672200
Petchey, O., Kevin, L., and Gaston, J. (2006). Functional diversity: back to basics and looking forward. Ecol. Lett. 9, 741–758. doi: 10.1111/j.1461-0248.2006.00924.x
Podobnik, B., and Stanley, H. E. (2008). Detrended cross-correlation analysis: a new method for analyzing two nonstationary time series. Phys. Rev. Lett. 100:084102. doi: 10.1103/PhysRevLett.100.084102
Pronk, J. T. (2002). MINIREVIEWS auxotrophic yeast strains in fundamental and applied research. Appl. Environ. Microbiol. 68, 2095–2100. doi: 10.1128/AEM.68.5.2095-2100.2002
Roszak, D. B., and Colwell, R. R. (1987). Survival strategies of bacteria in the natural environment. Microbiol. Rev. 51:365. doi: 10.1128/MMBR.51.3.365-379.1987
Shumway, R. H., and Stoffer, D. S. (2017). Time Series Analysis and its Applications: with R Examples. Springer. doi: 10.1007/978-3-319-52452-8
Sinsabaugh, R. L., Hill, B. H., Shah, J. J. F., and Follstad Shah, J. J. (2010). Ecoenzymatic stoichiometry of microbial organic nutrient acquisition in soil and sediment. Nature 468:122. doi: 10.1038/nature09548
Six, J., Frey, S. D., Thiet, R. K., and Batten, K. M. (2006). Bacterial and fungal contributions to carbon sequestration in agroecosystems. Soil Sci. Soc. Am. J. 70, 555–569. doi: 10.2136/sssaj2004.0347
Smelt, J. P., Otten, G. D., and Bos, A. P. (2002). Modelling the effect of sublethal injury on the distribution of the lag times of individual cells of Lactobacillus plantarum. Int. J. Food Microbiol. 73, 207–212. doi: 10.1016/S0168-1605(01)00651-1
Spohn, M., Zavišić, A., Nassal, P., Bergkemper, F., Schulz, S., Marhan, S., et al. (2018). Temporal variations of phosphorus uptake by soil microbial biomass and young beech trees in two forest soils with contrasting phosphorus stocks. Soil Biol. Biochem. 117, 191–202. doi: 10.1016/j.soilbio.2017.10.019
Stemmer, M. (2004). Multiple-substrate enzyme assays: a useful approach for profiling enzyme activity in soils? Soil Biol. Biochem. 36, 519–527. doi: 10.1016/j.soilbio.2003.11.004
Throckmorton, H. M., Bird, J. A., Dane, L., Firestone, M. K., and Horwath, W. R. (2012). The source of microbial C has little impact on soil organic matter stabilisation in forest ecosystems. Ecol. Lett. 15, 1257–1265. doi: 10.1111/j.1461-0248.2012.01848.x
Tischer, A., Blagodatskaya, E., and Hamer, U. (2015). Microbial community structure and resource availability drive the catalytic efficiency of soil enzymes under land-use change conditions. Soil Biol. Biochem. 89, 226–237. doi: 10.1016/j.soilbio.2015.07.011
van den Berg, H. A. (2001). How microbes can achieve balanced growth in a fluctuating environment. Acta Biotheor. 49, 1–21. doi: 10.1023/A:1010267821884
Wagg, C., Schlaeppi, K., Banerjee, S., Kuramae, E. E., and van der Heijden, M. G. (2019). Fungal-bacterial diversity and microbiome complexity predict ecosystem functioning. Nat. Commun. 10:4841. doi: 10.1038/s41467-019-12798-y
Wallenstein, M. D., and Burns, R. G. (2011). Ecology of extracellular enzyme activities and organic matter degradation in soil: a complex community-driven process. Methods Soil Enzymol. 9, 35–55. doi: 10.2136/sssabookser9.c2
Weintraub, M. N., and Schimel, J. P. (2005). Seasonal protein dynamics in Alaskan arctic tundra soils. Soil Biol. Biochem. 37, 1469–1475. doi: 10.1016/j.soilbio.2005.01.005
Keywords: substrate utilization, soil nutrition, microbial activity, enzyme kinetics, microbial necromass, time series analysis, european beech forests, microbial growth kinetics
Citation: Loeppmann S, Breidenbach A, Spielvogel S, Dippold MA and Blagodatskaya E (2020) Organic Nutrients Induced Coupled C- and P-Cycling Enzyme Activities During Microbial Growth in Forest Soils. Front. For. Glob. Change 3:100. doi: 10.3389/ffgc.2020.00100
Received: 13 February 2020; Accepted: 29 July 2020;
Published: 15 September 2020.
Edited by:
Edith Bai, Institute of Applied Ecology (CAS), ChinaReviewed by:
Jörg Schnecker, University of Vienna, AustriaFrank Hagedorn, Snow and Landscape Research (WSL), Switzerland
Copyright © 2020 Loeppmann, Breidenbach, Spielvogel, Dippold and Blagodatskaya. This is an open-access article distributed under the terms of the Creative Commons Attribution License (CC BY). The use, distribution or reproduction in other forums is permitted, provided the original author(s) and the copyright owner(s) are credited and that the original publication in this journal is cited, in accordance with accepted academic practice. No use, distribution or reproduction is permitted which does not comply with these terms.
*Correspondence: Sebastian Loeppmann, s.loeppmann@soils.uni-kiel.de