µ-Computed tomographic data of fossil planktonic foraminifera from the western Pacific Ocean: a dataset concerning two biostratigraphic events during the Early Pleistocene
 Wei-Lun Chen1,2,3
  Jia-Cih Kang1,2,3
  Katsunori Kimoto4
  Yen-Fang Song5 Gung-Chian Yin5 Robert E. Swisher1 Chen-Han Lu6 Li-Wei Kuo7
  Jyh-Jaan Steven Huang3,8
  Li Lo1,2,3*
- 1Department of Geosciences, National Taiwan University, Taipei, Taiwan
- 2Laboratory of Paleoceanography, National Taiwan University, Taipei, Taiwan
- 3Research Center for Future Earth, National Taiwan University, Taipei, Taiwan
- 4Research Institute for Global Change, Japan Agency for Marine-Earth Science and Technology (JAMSTEC), Yokosuka, Japan
- 5National Synchrotron Radiation Research Center, Hsinchu, Taiwan
- 6Taichung Municipal Taichung Girl’s Senior High School, Taichung, Taiwan
- 7Department of Earth Sciences, National Central University, Taoyuan, Taiwan
- 8Institute of Oceanography, National Taiwan University, Taipei, Taiwan
Introduction
Planktonic foraminifera first became prevalent during the Mesozoic marine revolution event (Tappan and Loeblich, 1988), quickly becoming one of the most diversified calcareous microplanktons (Bown et al., 2004). These eukaryotic organisms secret a biomineralized test that forms a dominant constituent of marine sediments across open marine ecosystems. Almost 70% of the modern seafloor is covered by the calcareous remains of planktonic foraminifera (Neil et al., 2005), providing abundant materials for systematic and quantitative analyses. Due to their widespread distribution regionally and globally across different geographical zones, planktonic foraminifera are exceptionally useful as a geochemical proxy and are commonly utilized in various paleoclimatological/paleoceanographic studies (Liu et al., 2015; Lo et al., 2022). Furthermore, evolution and modifications in the test morphology of planktonic foraminifera are highly susceptible and responsive to shifting environmental conditions, with observed morphological variations often triggered by the everchanging environment (Hecht and Savin, 1972; Renaud and Schmidt, 2003; Schmidt et al., 2004). This leads to high observed taxonomic turnover and rapid evolution rates in planktonic foraminifera, subsequently providing exceptional analytical utility, with researchers favoring their use as a dominant index fossil in Mesozoic and Cenozoic marine biostratigraphy (Berggren et al., 1995; Wade et al., 2011; Fraass et al., 2015). Based on these assets and advantages, the study of planktonic foraminifera has shown promise in biostratigraphy, in clarifying the environmental changes, and for understanding the evolutionary importance of the species.
Traditionally, the morphological analysis of planktonic foraminifera, regardless of qualitative or quantitative aspects, remains two-dimensional and limited under the restrictions and constraints of optical microscopes and imaging techniques that flatten a complex three-dimensional morphology, introducing biases into systematic and analytical studies. Traditional techniques and methodologies to explore the complicated three-dimensional test geometry and internal structures of planktonic foraminifera necessitates and requires invasive procedures such as serial dissection, which can be both time-consuming and labor-intensive, as well as reliant on the expertise of the researchers (Görög et al., 2012). An alternative and less destructive method utilizes a scanning electron microscope (SEM), first introduced in the 1960s for higher resolution photography of external structures (Hay and Sandberg, 1967). Nevertheless, despite the advantages, sample preparation procedures, such as Au/C coating and holder fixation, often led to the limitation of reusing the samples for further studies and have restricted the application of SEM analyses of planktonic foraminifera tests (Görög et al., 2012). These conventional two-dimensional methods have contributed significantly in measuring linear, simple geometric, and numeric parameters such as length, width, the radius of the chamber, degree of whorl (Olsson, 1972), test area (Poole and Wade, 2019), the roundness of the periphery, and aperture shape (Wei, 1987). However, regarding the analysis of semi-three-dimensional features (e.g., surface area, chamber size, and geometrical/spatial relationships), measurements can often be inaccurate and biased because of the complex configuration of planktonic foraminifera and the difficulty in properly quantifying these data with traditional methodologies and techniques.
The development of new three-dimensional analytical methods, including projection X-ray microscopy (PXM) and microfocus X-ray CT (MXCT) and their application toward the study of planktonic foraminifera, dramatically changes how researchers can assess morphological variation within the group. Importantly, new methodologies and techniques provide an avenue to avoid the shortcomings and inconveniences that have plagued studies reliant on conventional two-dimensional methods. The application of these modern techniques towards planktonic foraminifer has been attempted to examine a variety of morphological aspects including: ontogeny (Schmidt et al., 2013; Caromel et al., 2016; Caromel et al., 2017; Burke et al., 2020; Duan et al., 2021), speciation (Vanadzina and Schmidt, 2022), shell density (Ofstad et al., 2021), and buoyancy reconstruction (Zarkogiannis et al., 2019). These recent advances in technology and analysis can provide more accurate and thoroughgoing insight into the body plan and geometry of fossil specimens, allowing the computation of parameters such as chamber cavity volume and surface area that were previously impractical or impossible to quantify otherwise. Other applications formerly not possible, including the reconstruction of the early developed chambers (including proloculus and the subsequent ~10 chambers, which are usually covered by the late developed ones) (Duan et al., 2021) and the estimation of shell density with CT numbers (Iwasaki et al., 2019), can now be utilized for analysis. Lastly, but most crucially, these new techniques are non-invasive and non-destructive towards the analyzed foraminifera test, allowing for the scanned sample to still be available for further studies (e.g., stable isotope analysis). As the recovered three-dimensional data is digital, this provides for the long-term storage, archiving, and even reassessment of acquired specimen data in perpetuity.
Despite the wide range of research conducted to date that has contributed towards a better understanding of many different morphological aspects of planktonic foraminifera, these initial studies have mostly used datasets compromising a relatively small number of specimens. This limits the current scope of potential research that can be conducted, with present studies tending to focus on developmental changes and growth variation across stages within a species and/or within a short time period, assuming the specimens used are representative of their population (Schmidt et al., 2013; Caromel et al., 2016; Caromel et al., 2017; Burke et al., 2020; Duan et al., 2021; Vanadzina and Schmidt, 2022). Broader, more complex, and even more scientifically relevant evolutionary, paleoecological, and paleoclimatic topics, such as morphological and evolutionary change across biostratigraphic events and the interactions between the organism and the Earth’s evolving climate system, remain currently under explored, and the required datasets are non-existent. Therefore, further works examining three-dimensional morphology, with datasets of expanded size and scope, will help to shed new light on both evolutionary and environmental interactions and their combined effects on evolution and adaptive responses in organisms.
Here we present a dataset comprising twenty three-dimensional reconstruction models of planktonic foraminifera from two distinctive biostratigraphic events from the Early Pleistocene in the western Pacific Ocean. This record contains samples from different timings both before and within the two biostratigraphic events, the LAD event of Globigerinoidesella fistulosa with its presumed relative Trilobatus sacculifer (1.76–1.72 Ma), and the fifth left-coiling event (L5) of Pulleniatina spp. (2.15–1.93 Ma). Important questions regarding the development of environmental adaptations and the morphological criteria for the diagnosis and distinguishing of species are still left to be answered, e.g., what specimens can truly be called G. fistulosa? This is a critical question to determine the horizon of the LAD event. Globigerinoidesella fistulosa currently lacks a clear morphological rule to enable its differentiation from T. trilobatus, as there are transitional morphologies with inconspicuous protuberance. Despite Poole and Wade (2019) addressing the question, the solution still lacks quantitative standards. This fact leads to questions about whether G. fistulosa is just an ontogenetic stage or a taxonomic synonym of T. trilobatus (Chen, 2008). In addition, more studies are required to understand the paleoecological significance of the digitate structures present on G. fistulosa. These structures may be highly related to its extinction, coinciding with a dramatic environment shift recorded in a mixed layer-thermocline depth transition event that occurred at ~1.7 Ma (Wara et al., 2005; Chen, 2008). With expanded morphological analyses regarding novel parameters (e.g., skeleton volume, cavity volume, total volume, surface area, and chamber centroid position) (Schmidt et al., 2013; Caromel et al., 2016; Caromel et al., 2017; Burke et al., 2020; Duan et al., 2021; Vanadzina and Schmidt, 2022), in the future, clues or even postulates can be provided to further studies and improve our knowledge of the important evolutionary and paleoecological interactions. Moreover, these datasets will build a foundation and assist with efforts to correlate biostratigraphic and evolutionary data with paleoceanographic data; data that would provide great insight and further our understanding of paleoenvironment–organism interactions. Broadly, the development of larger CT datasets, like the one presented in here, helps further a variety of research goals dependent on a substantial dataset for analysis and implementation, including the advancement of potential machine learning models for species-level identification or to conduct auto-chamber segmentation (Ge et al., 2017; Mitra et al., 2019).
Datasets
This study develops a three-dimensional µ-CT reconstruction dataset of planktonic foraminifera collected from marine sediments of the Ocean Drilling Program (ODP) Hole 1115B (9°11'S; 151°34'E, water depth 1,149 m). Sediment samples were washed over a 63 µm screen and planktonic foraminifera tests were hand-picked at the Department of Geosciences, National Taiwan University, Taiwan. The foraminifera tests were picked from six size fractions (250–300, 300–355, 355–425, 425–500, 500–600 and >600 µm). ODP 1115B’s age model was reconstructed utilizing high-resolution planktonic foraminiferal oxygen isotope stratigraphy with support from paleomagnetic reversal and calcareous organisms biostratigraphic events (Chuang et al., 2018). The samples were then scanned at the Japan Agency for Marine-Earth Science and Technology (JAMSTEC; Yokotsuka, Japan) and the National Synchrotron Radiation Research Center (NSRRC; Hsinchu, Taiwan). The files presented in the dataset are divided into two sub-datasets: the Trilobatus sacculifer plexus (comprising 9 “normal” T. sacculifer, defined by the spherical last chamber, and 11 Globigerinoidesella fistulosa) during 1.76–1.72 Ma and 20 dextral/sinistral morphotypes of Pulleniatina spp. during 2.15–1.93 Ma. The list of samples provided in this dataset, along with associated information for depth of the core, age, and species of the Trilobatus sacculifer plexus and Pulleniatina spp. can be found in Figure 1 and Tables 1 and 2.
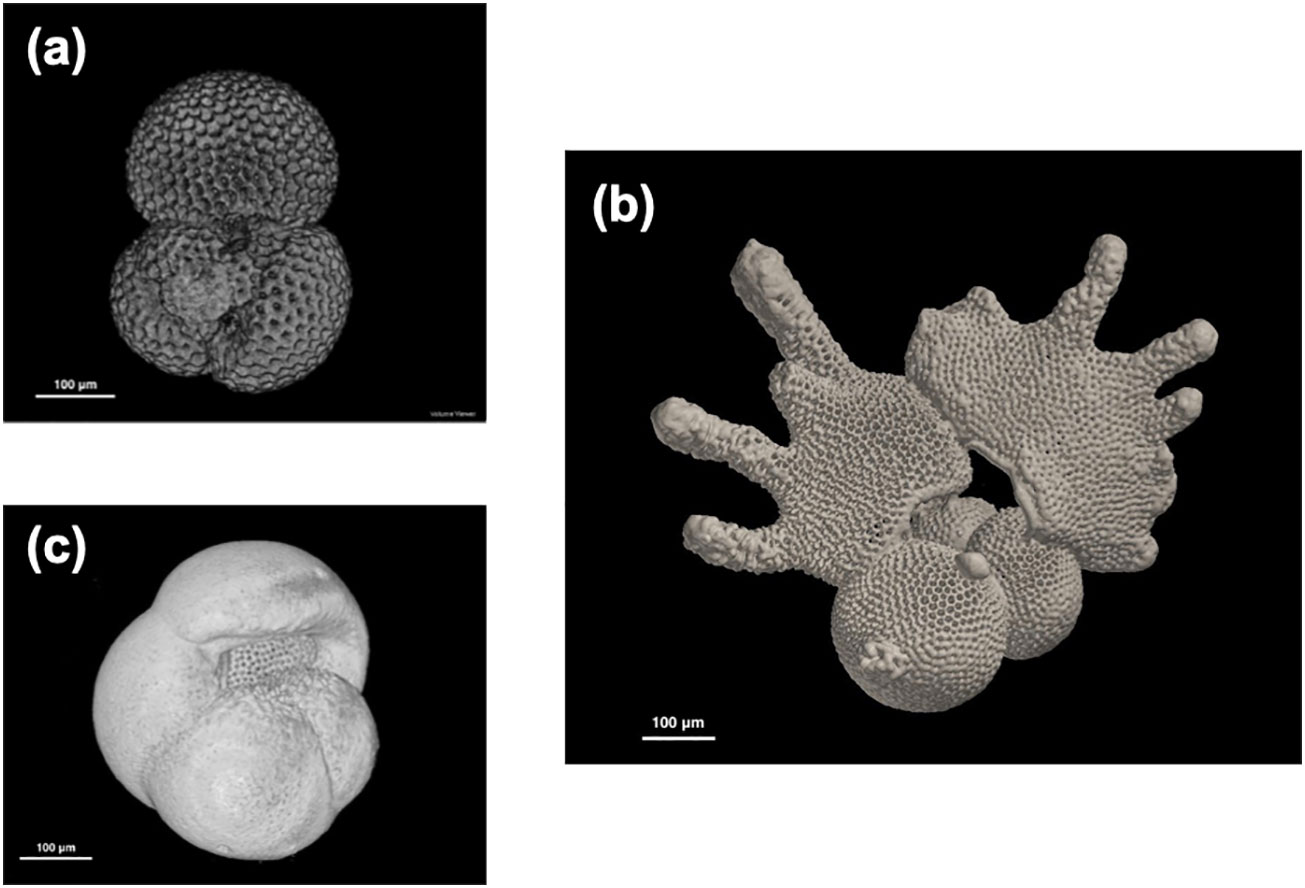
Figure 1 Examples of reconstructed planktonic foraminifera 3D images from ODP Hole 1115B, Solomon Sea, using the dataset. (A) Trilobatus sacculifer (10H2W 95–97 cm, 1.72 Ma), (B) Globigerinodesella fistulosa (10H4W 65–67 cm, 1.75 Ma), and (C) Pulleniatina obliquiloculata (left coiling, 12H6W 65–37 cm, 2.04 Ma). Note that all the scales are in 100 μm.
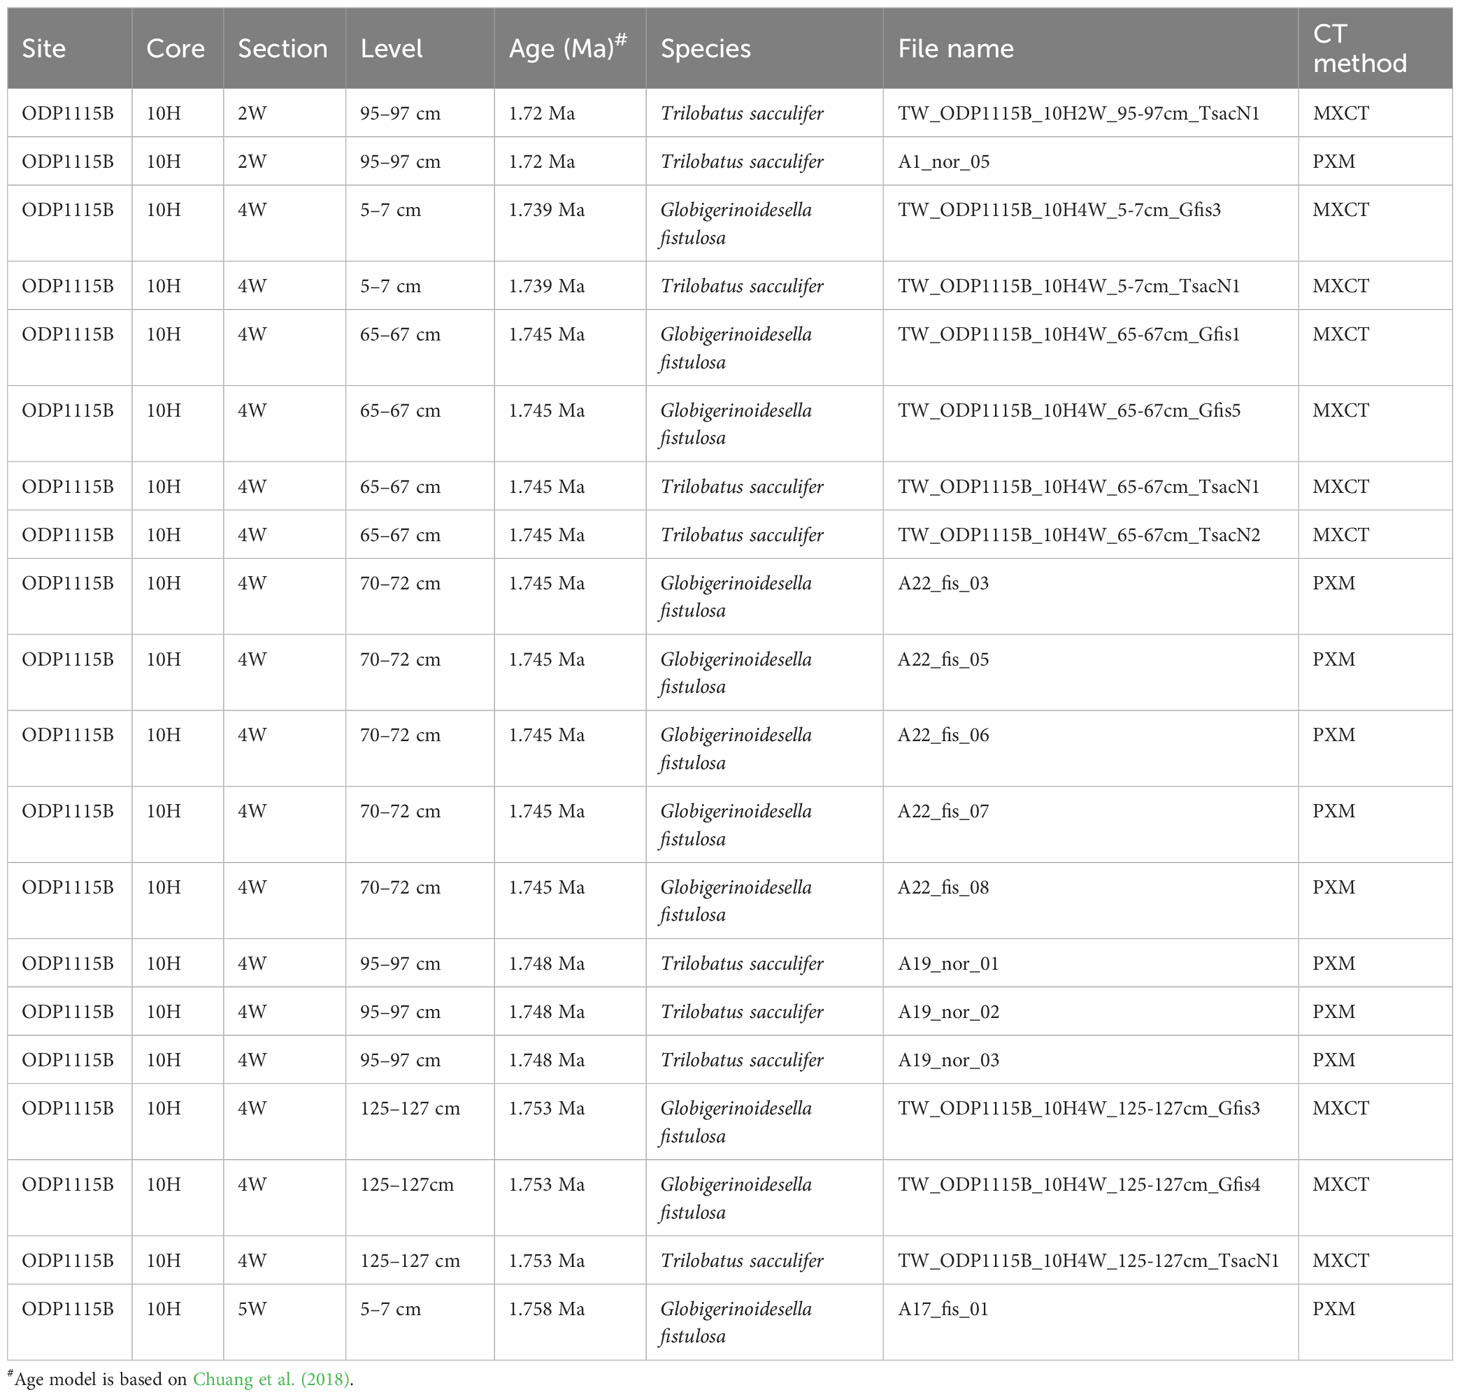
Table 1 Information of planktonic foraminifera Trilobatus sacculifer plexus and Globigerinoidesella fistulosa samples in this dataset.
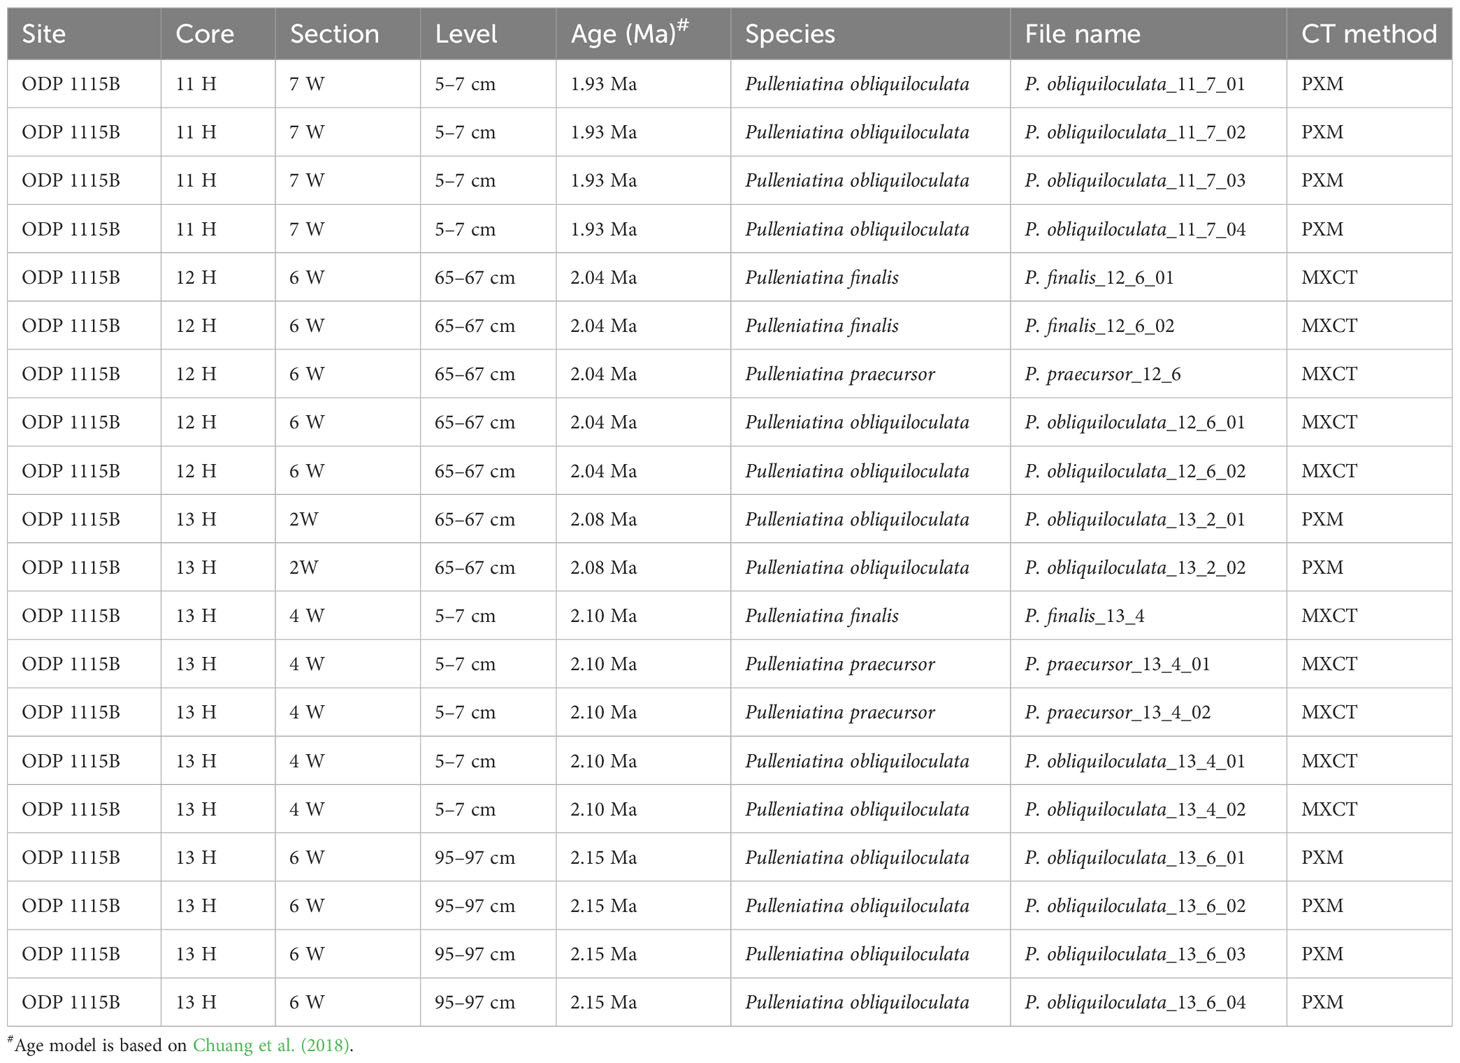
Table 2 Information of planktonic foraminifera Pulleniatina spp. samples in this dataset.
We have applied image processing procedures to the data to remove the impurities (e.g., sediments and materials used for holding the sample during the scanning procedures) by using the functions including Select Region and Remove through ImageJ software (available at https://imagej.nih.gov/ij/) (Schindelin et al., 2012). The files can be opened in various CT analysis software such as VG studio, ORS dragonfly, and Amira/Avizo, with the scale according to the voxel size/pixel size of the JAMSTEC and NSRRC reconstructions (1.0 μm/voxel and 1.3 μm/voxel, respectively).
Protocols of microfocus X-ray CT (MXCT) analysis
Morphometry of planktic foraminiferal tests was performed using microfocus X-ray CT (ScanXmateD160TSS105, Comscantechno Co. Ltd., Yokohama, Japan) at JAMSTEC. A high-resolution setting (X-ray focus spot size: 0.8 µm; X-ray source voltage: 80 kV; X-ray source current: 60 µA; target current: 10.5 µA; detector array size of 1024 × 1024 pixels; 1,800 projections in 360° rotations) was applied. Geometric resolution of isotropic voxel size was 1.0 µm/voxel. We used ConeCTexpress (White Rabbit Corp., Tokyo, Japan) for corrections and the reconstruction of tomography data; the general principle of Feldkamp cone beam reconstruction was followed to reconstruct image cross sections based on a filtered back projection algorithm. The reproducibility of CT number (density), volume, and average thickness is 0.9%, 1.5%, and 1.9% (in 31 analyses), respectively.
Protocols of projection X-ray microscopy
We utilized projection X-ray microscopy (PXM) at beamline TPS31A of the Taiwan Photon Source at the NSRRC, Taiwan, to reveal the 3-dimensional internal morphological structure of the specimens. The energy of the X-ray is tunable from 5−30 keV by using a double crystal monochromator (DCM). The X-ray size at the sample position is 25.0 × 1.4 mm2. The spatial resolution of an image is 0.5–6.5 μm according to various magnifications of the objective lens. The pixel number, pixel size, and total area of the image detector are 2,560 × 2,160, 1.3 μm, and 16.6 × 14.0 mm2, respectively. The temporal resolution can approach 20 ms/frame and 40 sec/tomography. We adopted X-ray energy of 22 keV in PXM-DCM mode. The spatial resolution of the image is 2.6 μm by using a 10× objective lens and bin2 reconstruction. The field of view of an image is 1.7 × 1.4 mm2. The standard deviation (%) of width, height, thickness, and absorption of one sample in 20 analysis is 0.09%, 0.18%, 0.01%, and 2.9%, respectively. Tomography was implemented by performing azimuthal rotations at intervals of 0.25 degrees over the full range of ±90 degrees, resulting in a total of 721 projection images, which were then reconstructed using a filtered-back-projection algorithm.
Research potential estimation and discussion
The LAD of G. fistulosa has been considered a useful index event in marine biostratigraphy, marking the ~1.7 Ma interval. However, due to the strong morphological resemblance of G. fistulosa to its close relative T. sacculifer, accurate identification of this important index event can be problematic. The existence of some transitional morphotypes can further complicate the recognition of G. fistulosa, potentially obscuring the biostratigraphic utility of the species. Previous studies have proposed several criteria to fix this problem; however, most of the solutions remain qualitative and subjective in nature, based on two-dimensional observations that lack more robust quantitative support for species-level distinction (the synthetic review is included in Pool and Wade, 2019). Secondly, we are keen to understand the ecological significance of the digitate structures present on G. fistulosa prior to its extinction event as well as the left coiling event of Pulleniatina spp., which are unique occurrences and events that could be related to the paleoceanographic shifting in the Pacific Ocean (Wara et al., 2005).
Data presentation
The dataset is organized into two sub-datasets for µ-CT data of foraminifer tests. One sub-dataset is presented as a zipped folder and contains a group of TIFF image stacks (Pulleniatina spp.), while the other is a group of TIFF image stacks (T. sacculifer and G. fistulosa). Each image stack contains 200–500 TIFF images for each individual foraminifer sample. A whole image stack needs to be imported into the CT analysis software to obtain integrated 3D foraminifer reconstruction (Figures 1A–C). Scales need to be set up manually with the pixel size (1 μm for MXCT and 1.3 μm for PXM).
Data availability statement
The datasets presented in this study can be found in online repositories. A link to the data can be found below: https://zenodo.org/record/7874195#.ZEs4AnZByUk.
Author contributions
LL designed and generated the planktonic foraminifera samples. KK performed the MXCT analysis. Y-FS and G-CY performed PXM analyses. W-LC, J-CK, and C-HL processed the data, reconstructed the 3D models, and prepared the first draft. L-WK and J-JSH generously provided support for image analyses software and data processing protocols. RS significantly revised the structure of the manuscript and direction of paleontological discussions. All authors contributed to the article and approved the submitted version.
Funding
The authors would like to thank the following grants and institutions that supported this research: the Science Vanguard Research Program of the Ministry of Science and Technology (MOST) (110-2636-M-002- 011 to LL) and National Taiwan University (109L892603 to LL).
Acknowledgments
This research used samples provided by the International Ocean Discovery Program (IODP). The authors thank Mr. Chien-Yu Lee, Dr. Pei-Tzu Lee, and Mr. Shih-Ting Lo of the NSRRC Experimental Technique Group for PXM data execution.
Conflict of interest
The authors declare that the research was conducted in the absence of any commercial or financial relationships that could be construed as a potential conflict of interest.
Publisher’s note
All claims expressed in this article are solely those of the authors and do not necessarily represent those of their affiliated organizations, or those of the publisher, the editors and the reviewers. Any product that may be evaluated in this article, or claim that may be made by its manufacturer, is not guaranteed or endorsed by the publisher.
References
Berggren W. A., Kent D. V., Swisher C. C., Aubry M.-P. (1995). “A revised Cenozoic geochronology and chronostratigraphy”, in Geochronology, time scales and global stratigraphic correlation. Eds. Berggren W. A., Kent D. V., Aubry M.-P., Hardenbol J.. SEPM Special Publication 54. Claremore, OK: Society for Sedimentary Geology.
Bown P. R., Lees J. A., Young J. R. (2004). “Calcareous nannoplankton evolution and diversity through time”, in Coccolithophores. Eds. Thierstein H. R., Young J. R.. Berlin: Springer.
Burke J. E., Renema W., Schiebel R., Hull P. M. (2020). Three-dimensional analysis of inter-and intraspecific variation in ontogenetic growth trajectories of planktonic foraminifera. Mar. Micropaleontology. 155, 101794. doi: 10.1016/j.marmicro.2019.101794
Caromel A. G., Schmidt D. N., Fletcher I., Rayfield E. J. (2016). Morphological change during the ontogeny of the planktic foraminifera. J. Micropalaeontology. 35 (1), 2–19. doi: 10.1144/jmpaleo2014-017
Caromel A. G., Schmidt D. N., Rayfield E. J. (2017). Ontogenetic constraints on foraminiferal test construction. Evol. Dev. 19 (3), 157–168. doi: 10.1111/ede.12224
Chen C.-Y. (2008). A study on the disappearance of Globigerinoides fistulosus and its relationship to the hydrological change of the tropical Pacific. Master's thesis: National Taiwan University.
Chuang C.-K., Lo L., Zeeden C., Chou Y.-M., Wei K.-Y., Shen C.-C., et al. (2018). Integrated stratigraphy of ODP Site 1115 (Solomon Sea, southwestern equatorial Pacific) over the past 3.2 Ma. Mar. Micropaleontology 144, 25–37. doi: 10.1016/j.marmicro.2018.09.003
Duan B., Li T., Pearson P. N. (2021). Three dimensional analysis of ontogenetic variation in fossil globorotaliiform planktic foraminiferal tests and its implications for ecology, life processes and functional morphology. Mar. Micropaleontology. 165, 101989. doi: 10.1016/j.marmicro.2021.101989
Fraass A. J., Kelly D. C., Peters S. E. (2015). Macroevolutionary history of the planktic foraminifera. Annu. Rev. Earth Planetary Sci. 43 (1), 139–166. doi: 10.1146/annurev-earth-060614-105059
Ge Q., Zhong B., Kanakiya B., Mitra R., Marchitto T., Lobaton E. (2017). “Coarse-to-fine foraminifera image segmentation through 3D and deep features,” in 2017 IEEE Symposium Series on Computational Intelligence (SSCI). Piscataway, NJ: IEEE.
Görög Á, Szinger B., Tóth E., Viszkok J. (2012). Methodology of the micro-computer tomography on foraminifera. Palaeontologia Electronica. 15 (1), 15. doi: 10.26879/261
Hay W. W., Sandberg P. A. (1967). The scanning electron microscope, a major break-through for micropaleontology. Micropaleontology, 13 (4), 407–418. doi: 10.2307/1484718
Hecht A. D., Savin S. M. (1972). Phenotypic variation and oxygen isotope ratios in Recent planktonic foraminifera. J. Foraminiferal Res. 2 (2), 55–67. doi: 10.2113/gsjfr.2.2.55
Iwasaki S., Kimoto K., Sasaki O., Kano H., Uchida H. (2019). Sensitivity of planktic foraminiferal test bulk density to ocean acidification. Sci. Rep. 9 (1), 9803. doi: 10.1038/s41598-019-46041-x
Liu Y., Lo L., Shi Z., Wei K.-Y., Chou C.-J., Chen Y.-C., et al. (2015). Obliquity pacing of the western Pacific Intertropical Convergence Zone over the past 282,000 years. Nat. Commun. 6 (1), 1–7. doi: 10.1038/ncomms10018
Lo L., Shen C.-C., Zeeden C., Tsai Y.-H., Yin Q., Yang C.-C., et al. (2022). Orbital control on the thermocline structure during the past 568 kyr in the Solomon Sea, southwest equatorial Pacific. Quaternary Sci. Rev. 295, 107756. doi: 10.1016/j.quascirev.2022.107756
Mitra R., Marchitto T., Ge Q., Zhong B., Kanakiya B., Cook M., et al. (2019). Automated species-level identification of planktic foraminifera using convolutional neural networks, with comparison to human performance. Mar. Micropaleontology. 147, 16–24. doi: 10.1016/j.marmicro.2019.01.005
Neil H., Cooke P., Northcote L. (2005). The life and death of planktonic foraminifera. Water Atmosphere. 13 (1), 18–19.
Ofstad S., Zamelczyk K., Kimoto K., Chierici M., Fransson A., Rasmussen T. L. (2021). Shell density of planktonic foraminifera and pteropod species Limacina helicina in the Barents Sea: relation to ontogeny and water chemistry. PloS One 16 (4), e0249178. doi: 10.1371/journal.pone.0249178
Olsson R. (1972). Growth changes in the Globorotalia fohsi lineage. Eclogae Geologicae Helvetiae. 65 (1), 165–184. doi: 10.5169/seals-164083
Poole C. R., Wade B. S. (2019). Systematic taxonomy of the Trilobatus sacculifer plexus and descendant Globigerinoidesella fistulosa (planktonic foraminifera). J. Systematic Palaeontology. 17 (23), 1989–2030. doi: 10.1080/14772019.2019.1578831
Renaud S., Schmidt D. N. (2003). Habitat tracking as a response of the planktic foraminifer Globorotalia truncatulinoides to environmental fluctuations during the last 140 kyr. Mar. Micropaleontology 49 (1-2), 97–122. doi: 10.1016/S0377-8398(03)00031-8
Schindelin J., Arganda-Carreras I., Frise E., Kaynig V., Longair M., Pietzsch T., et al. (2012). Fiji: an open-source platform for biological-image analysis. Nat. Methods 9 (7), 676–682. doi: 10.1038/nmeth.2019
Schmidt D. N., Rayfield E. J., Cocking A., Marone F. (2013). Linking evolution and development: Synchrotron Radiation X-ray tomographic microscopy of planktic foraminifers. Palaeontology. 56 (4), 741–749. doi: 10.1111/pala.12013
Schmidt D. N., Thierstein H. R., Bollmann J., Schiebel R. (2004). Abiotic forcing of plankton evolution in the Cenozoic. Science. 303 (5655), 207–210. doi: 10.1126/science.1090592
Tappan H., Loeblich A. R. Jr. (1988). Foraminiferal evolution, diversification, and extinction. J. Paleontology, 62 (5), 695–714.
Vanadzina K., Schmidt D. N. (2022). Developmental change during a speciation event: evidence from planktic foraminifera. Paleobiology. 48 (1), 120–136. doi: 10.1017/pab.2021.26
Wade B. S., Pearson P. N., Berggren W. A., Pälike H. (2011). Review and revision of Cenozoic tropical planktonic foraminiferal biostratigraphy and calibration to the geomagnetic polarity and astronomical time scale. Earth-Science Rev. 104 (1–3), 111–142. doi: 10.1016/j.earscirev.2010.09.003
Wara M. W., Ravelo A. C., Delaney M. L. (2005). Permanent El Niño-like conditions during the Pliocene warm period. Science 309 (5735), 758–761. doi: 10.1126/science.1112596
Wei K.-Y. (1987). Multivariate morphometric differentiation of chronospecies in the late Neogene planktonic foraminiferal lineage Globoconella. Mar. Micropaleontology. 12, 183–202. doi: 10.1016/0377-8398(87)90020-X
Keywords: planktonic foraminifera, morphometric analysis, Pacific Ocean (equatorial west), X-ray tomographic imaging, biostratigraphy
Citation: Chen W-L, Kang J-C, Kimoto K, Song Y-F, Yin G-C, Swisher RE, Lu C-H, Kuo L-W, Huang J-JS and Lo L (2023) µ-Computed tomographic data of fossil planktonic foraminifera from the western Pacific Ocean: a dataset concerning two biostratigraphic events during the Early Pleistocene. Front. Ecol. Evol. 11:1171891. doi: 10.3389/fevo.2023.1171891
Received: 22 February 2023; Accepted: 01 August 2023;
Published: 25 August 2023.
Edited by:
Pauline Guenser, Université de Bordeaux, FranceReviewed by:
Miriam Cobianchi, University of Pavia, ItalyAdriane Lam, Binghamton University, United States
Copyright © 2023 Chen, Kang, Kimoto, Song, Yin, Swisher, Lu, Kuo, Huang and Lo. This is an open-access article distributed under the terms of the Creative Commons Attribution License (CC BY). The use, distribution or reproduction in other forums is permitted, provided the original author(s) and the copyright owner(s) are credited and that the original publication in this journal is cited, in accordance with accepted academic practice. No use, distribution or reproduction is permitted which does not comply with these terms.
*Correspondence: Li Lo, lilo115@ntu.edu.tw