Effects of different land use patterns on soil properties and N2O emissions on a semi-arid Loess Plateau of Central Gansu
 Mengyin Du1†
  Jianyu Yuan1† Macao Zhuo2 Mahran Sadiq1
  Jiangqi Wu1 Guorong Xu1
  Shuainan Liu1 Jie Li1 Guang Li1,3* Lijuan Yan3,4*
- 1College of Forestry, Gansu Agricultural University, Lanzhou, China
- 2College of Geology and Jewelry, Lanzhou Resources and Environment Vocational and Technical University, Lanzhou, China
- 3Gansu Provincial Key Laboratory of Arid Land Crop Science, Lanzhou, China
- 4College of Agriculture, Gansu Agricultural University, Lanzhou, China
Nitrous oxide (N2O) is one of the significant greenhouse gases in the atmosphere. Different land use patterns are the sink or source of N2O, which plays a vigorous role in controlling N2O emissions. Yet, how different land use patterns affect soil N2O emissions in the Loess Plateau of Central Gansu is still not clear. Therefore; in order to fill this gap, six different land use patterns, including Picea asperata (PA), Hippophae rhamnoides (HR), Medicago sativa (MS), No-tillage wheat field (NT) and Conventional tillage wheat field (T) were studied. The objective of this study was to examine the impact of different land use patterns on soil properties and N2O emission flux. Our results showed that compared with other treatments, Picea asperata woodland increased the soil bulk density, organic matter and soil water content, total nitrogen accumulation and microbial biomass nitrogen whilst reduced the soil pH. The wheat field is more favorable to accumulating soil nitrate nitrogen and ammonium nitrogen. Moreover, soil N2O emission rates followed the trend of T>NT>HR>GL>MS>PA. In addition, soil physicochemical properties were closely related to N2O emission flux and soil temperature was the most significant factor affecting N2O emission. General, Picea asperata woodland could significantly increased soil nutrient and reduce N2O emissions. We suggest that more forest land should be selected as the optimal site for nitrogen fixation and emission reduction for sustainable development of the terrestrial ecosystem on the Loess Plateau in Central Gansu.
1. Introduction
With the progressively severe global greenhouse effect, the nitrous oxide (N2O) emission has become close attention of scientists globally (Ravishankara et al., 2009; IPCC, 2021). The N2O is one of the important greenhouse gas in the atmosphere which increases the global warming (IPCC, 2021). Its concentration in the atmosphere is less compared with carbon dioxide (CO2) and methane (CH4) but its warming potential is 296 times greater than CO2 and nine times greater than CH4 on a 100-year scale, and it can remain in the atmosphere for long periods and participate in a variety of photochemical reactions that damage the ozone layer (IPCC, 2013). Studies have shown that land use change has now been identified as the second-largest source of greenhouse gas emissions (Arneth et al., 2017). Different land use patterns can alter soil properties and affect soil nutrient distribution and biogeochemical cycling processes, thereby influencing global climate (Eduardo et al., 2011). In addition, different land use patterns have different ecosystem structures, community compositions, and biomass, which absorb and fix nutrients at different rates, which can cause dynamic changes in soil GHG emissions (Shigehiro et al., 2002). Therefore, studying soil N2O emissions under different land use patterns is important for promoting regional carbon and nitrogen balance, mitigating N2O emissions and global warming (Chiti et al., 2018).
As the most significant manifestation of human utilization of natural resources, land use impacts regional soil and water conservation, ecological development, and climate change (Shi et al., 2014). However, different scholars have different views on the impact of land use methods on soil physical, chemical, and biological properties and greenhouse gas emissions. A study by Merino et al. (2011) on soil greenhouse gas emissions from arable, pasture, and woodland in southern Europe concluded that N2O emissions from arable and pasture land were three and six times higher than woodland. Similarly, Li et al. (2012) pointed out that the net balance between soil carbon and nitrogen input (such as litter input) and output (such as greenhouse gas emissions) as soil carbon and nitrogen accumulation in subtropical regions is huge. At the same time, Zhang et al. (2019) also showed that the nitrogen mineralization of forest land is higher than that of garden land and agricultural land. In recent decades, due to socioeconomic reasons, the scale of land use in most arid and semi-arid areas has expanded rapidly, but the impact of different land use patterns on N2O emission in arid and semi-arid areas have not well studied yet. The lack of research in this area may limit our understanding of land use changes on the global climate, especially in the Loess Plateau region where vegetation is destroyed and soil erosion is serious.
Land use changes are often accompanied by changes in the soil matrix, soil microbial properties and chemistry (Hong et al., 2021), which individually or interactively affect N2O production, consumption, and diffusion processes (Lubbers et al., 2013; Lagomarsino et al., 2016). Several studies have shown that soil water content and temperature can strongly regulate soil N2O emissions under land use change. Within the soil saturation range, soil water content has a linear relationship with soil N2O emissions and water content is greater than soil saturation. Soil denitrification is enhanced, a large amount of N2O generates N2, and soil N2O emissions are reduced. At the same time, increased temperature stimulates microbial activity, which in turn promotes the release of N2O from the soil (Frey et al., 2013). In addition, the production of N2O in soils is influenced by the carbon and nitrogen content of the substrate (Chadwick et al., 2000). Liu et al. (2021) found that the available nitrogen content of farmland soil is high, while the available carbon content of grassland soil is high, and the difference in carbon and nitrogen in the two soils will lead to different conditions for N2O production and emission. Although soil N2O may be sensitive to changes in the soil matrix, soil microbial properties, and chemistry following land use change, it is not clear which major factors play a decisive role in influencing soil N2O emissions.
The Loess Plateau is located in the north-central part of China, due to its increasingly severe ecological environment and complex geographical conditions, it has become one of the key research areas in ecology and related sciences (Na et al., 2020). In recent years, the infertile soils of the Loess Plateau, the low carrying capacity of the land, and the increase in greenhouse gas emissions have become increasingly prominent due to continuous human interference and unsuitable land use practices and the ecological environment of the region is likely to continue to deteriorate with global climate change (Sun et al., 2021). Therefore, our understanding of soil properties and N2O flux under different land use patterns in the semi-arid region of the Loess Plateau is necessary. This study will provide a theoretical basis for the carbon and nitrogen sequestration during the restoration of the Loess Plateau ecosystem in Central Gansu and the optimal site type for reduction of nitrous oxide emission. The specific objectives of this study were: (1) evaluate the effects of different land use patterns on soil temperature, gravimetric water content, nitrate nitrogen, ammonium nitrogen, total nitrogen, microbial biomass nitrogen and soil organic carbon; (2) explore the influence of different land use patterns on soil N2O emission; (3) capture the response of soil N2O flux to variations in environmental variables due to different land use patterns.
2. Materials and methods
2.1. Site description
This study was carried out under the supervision of the department of Soil and Water Conservation at Dingxi Gansu Province (35°34′53′′ N, 104°38′30′′ E longitude with an altitude of 2000 m above sea level), Northwestern region of China (Figure 1). The research area is a typical hilly and gully area of the Loess Plateau. The climatic condition of study zone is semi-arid, with a large annual temperature difference. The average annual temperature is 6.9°C, the average annual precipitation is 400 mm, mainly concentrated in July–September, the average annual solar radiation is 5,930 MJ m−2 with 2,480 h of sunshine per year, a frost-free period of 140 days. The soil of study areas is typical loess with sandy loam in texture. The area is dry with water deficient and the vegetation is scant. The natural vegetation is dominated by grasses such as Gramineae, Leguminosae, Compositae, mostly Medicago sativa, Onobrychis viciifolia and a small number of shrubs are distributed such as Caragana Korshinski, Hippophae rhamnoides. The arbor species are mainly Platycladus orientalis, Picea asperata, Xanthoceras sorbifolium, etc. The main crops of this area are Zea mays, Solanum tuberosum, Linum usitatissimum, Triticum aestivum.
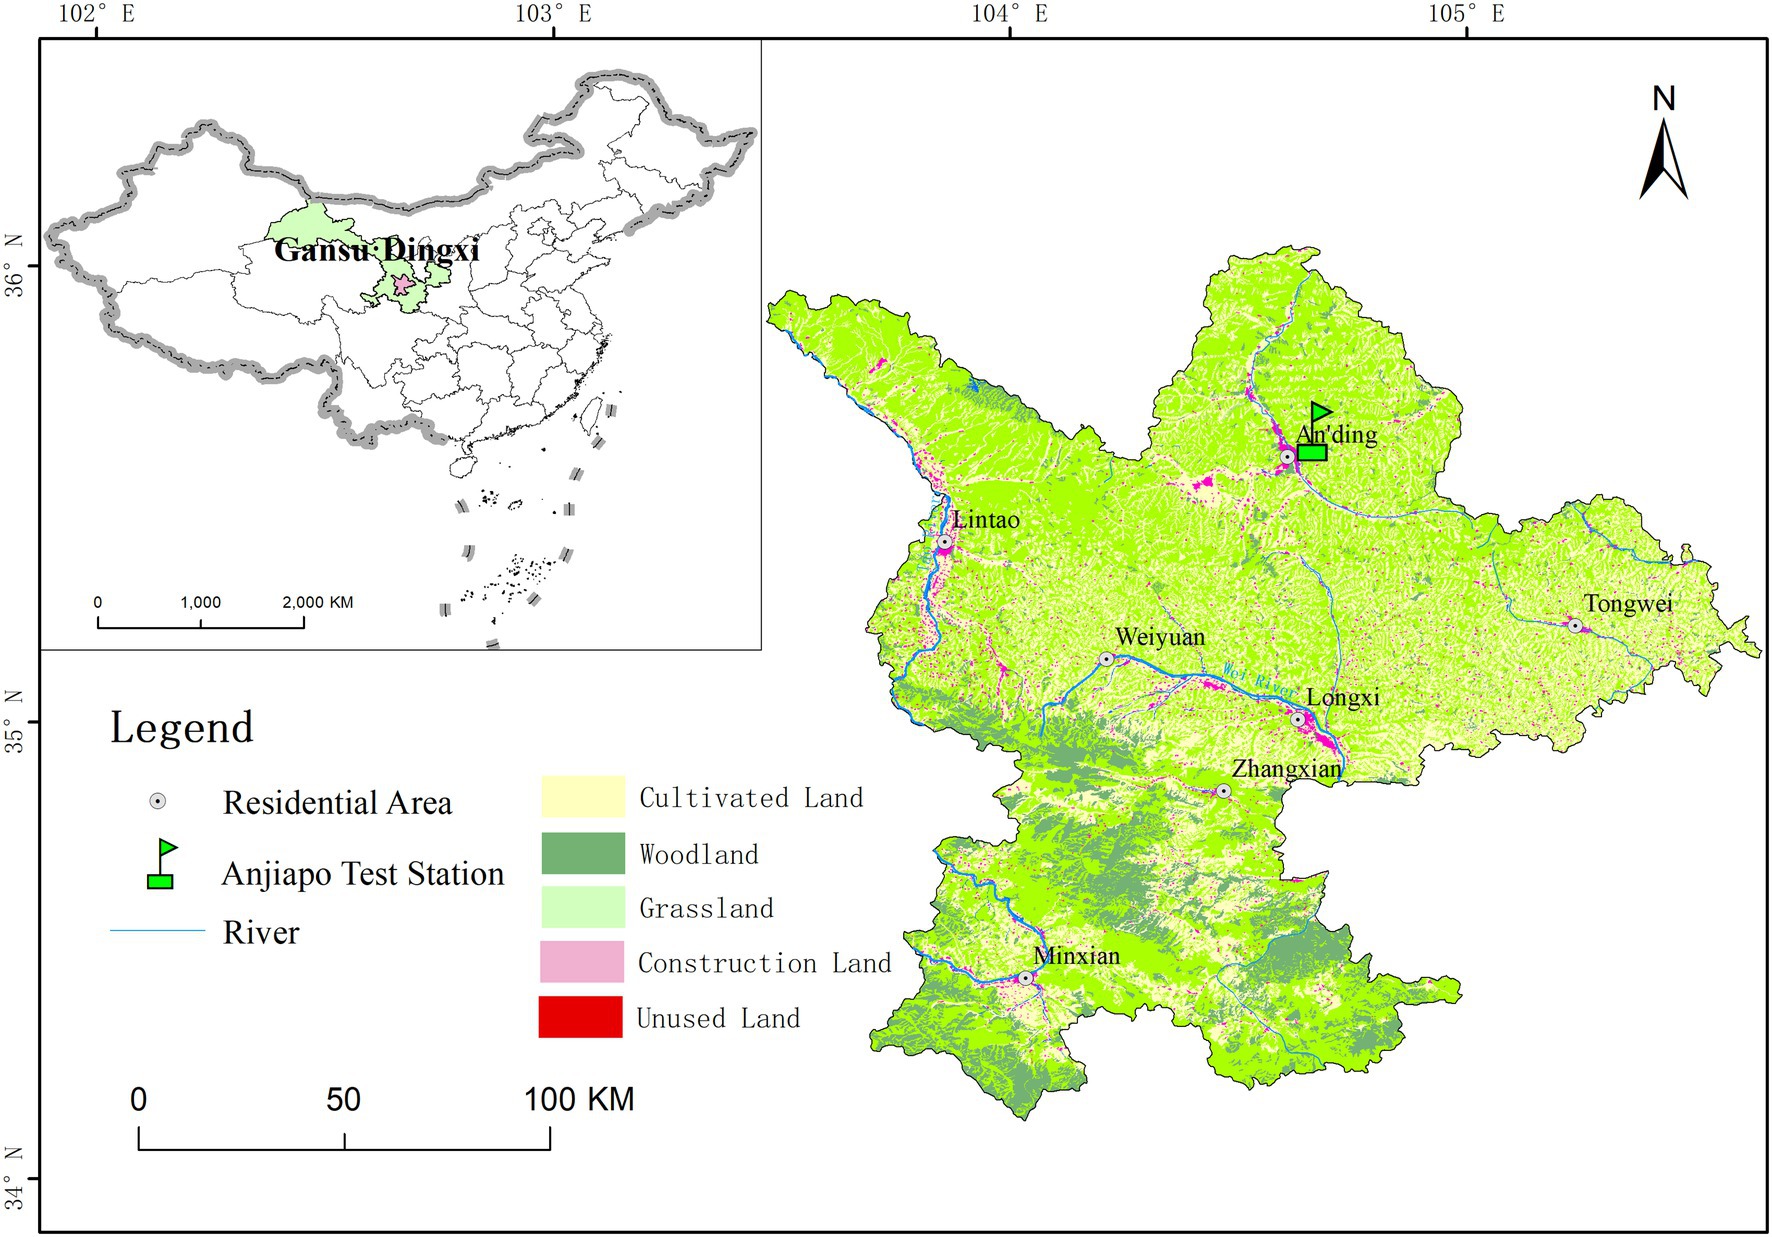
Figure 1. Geographical map of the study area in the Loess Plateau of China.
2.2. Experimental setup and design
Based on the field investigation of the ecological environment characteristics and vegetation characteristics of the study area we took six different land use patterns viz., PA (Picea asperata), HR (Hippophae rhamnoides), MS (Medicago sativa), NT (no-tillage in wheat field), T (Conventional tillage in wheat field), on Loess Plateau in Central Gansu (Table 1; Figure 2). Three small plots were randomly selected in each experimental area, and the size depended on the vegetation type: wheat field, grassland, Medicago sativa grassland 4 m × 6 m, Hippophae rhamnoides woodland 10 m × 10 m, Picea asperata woodland 20 m × 20 m. The selected wheat field was the local spring wheat “Ganchun 35” as the test variety, which was sown on March 25, 2021 and harvested on August 5. The seeding rate of each plot was 187.5 kg/hm2, and the row spacing was 25 cm. A combination of 150 kg/hm2 of diammonium superphosphate (N + P2O5) and 62.5 kg/hm2 of urea was used as the basal dose. At the same time, a fixed gas extraction area of 0.5 m × 0.5 m was randomly set up in each fixed sample plot to collect and determine N2O flux under different land use patterns.
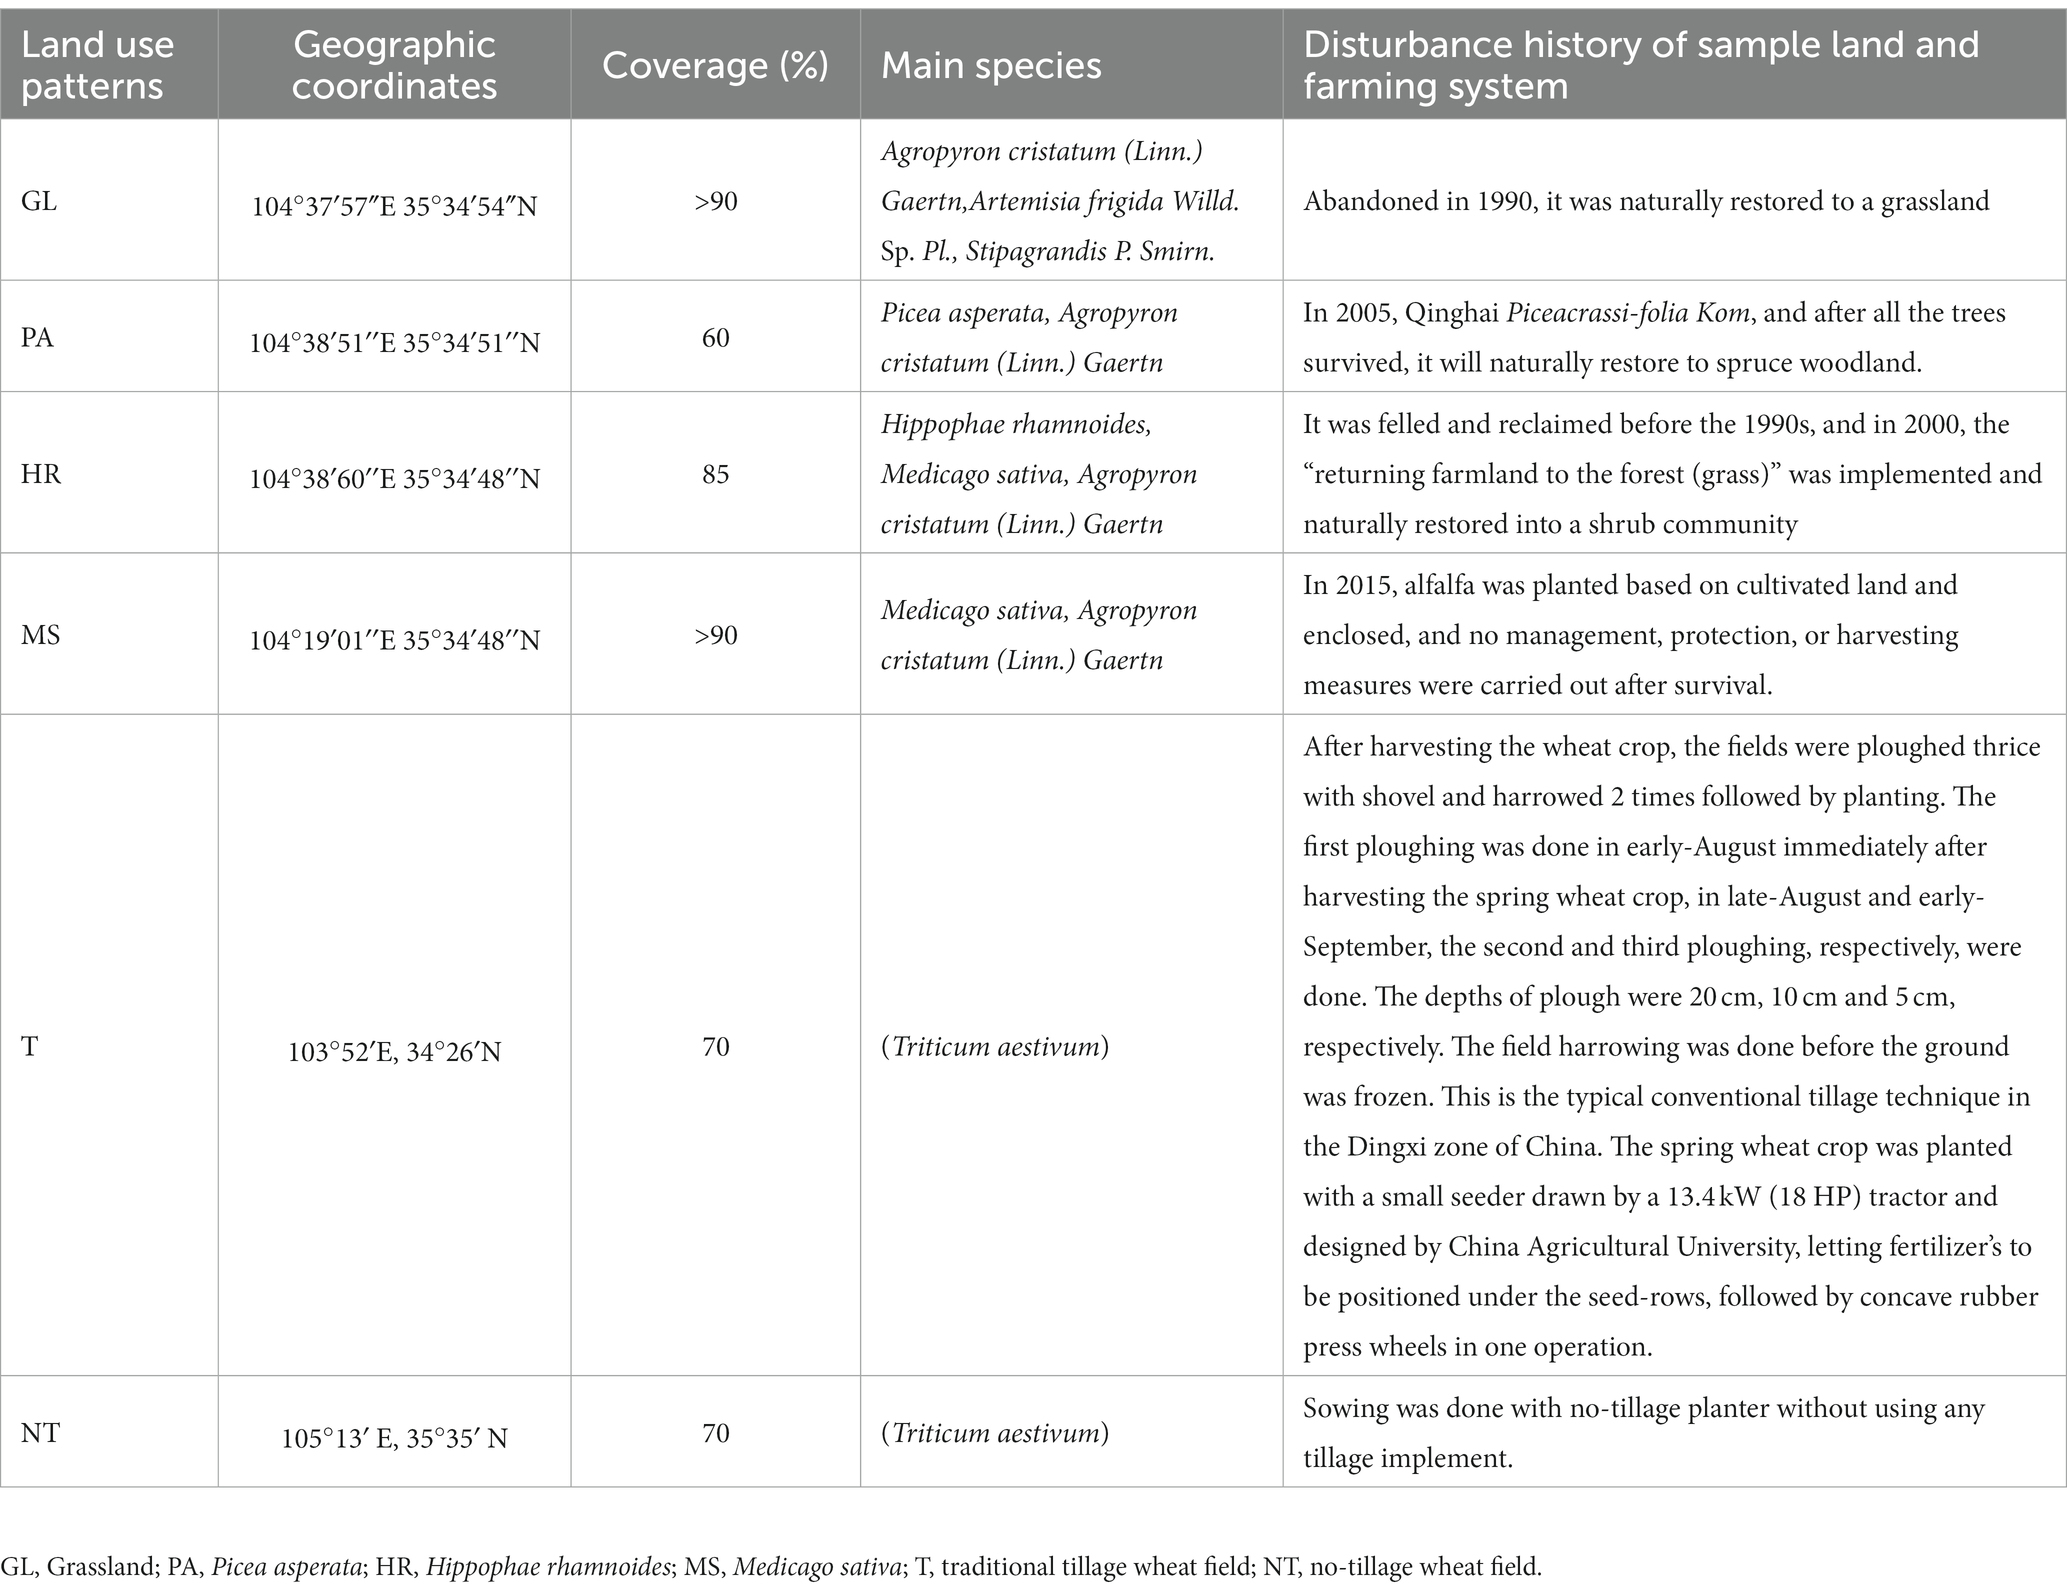
Table 1. Basic information on different land types.
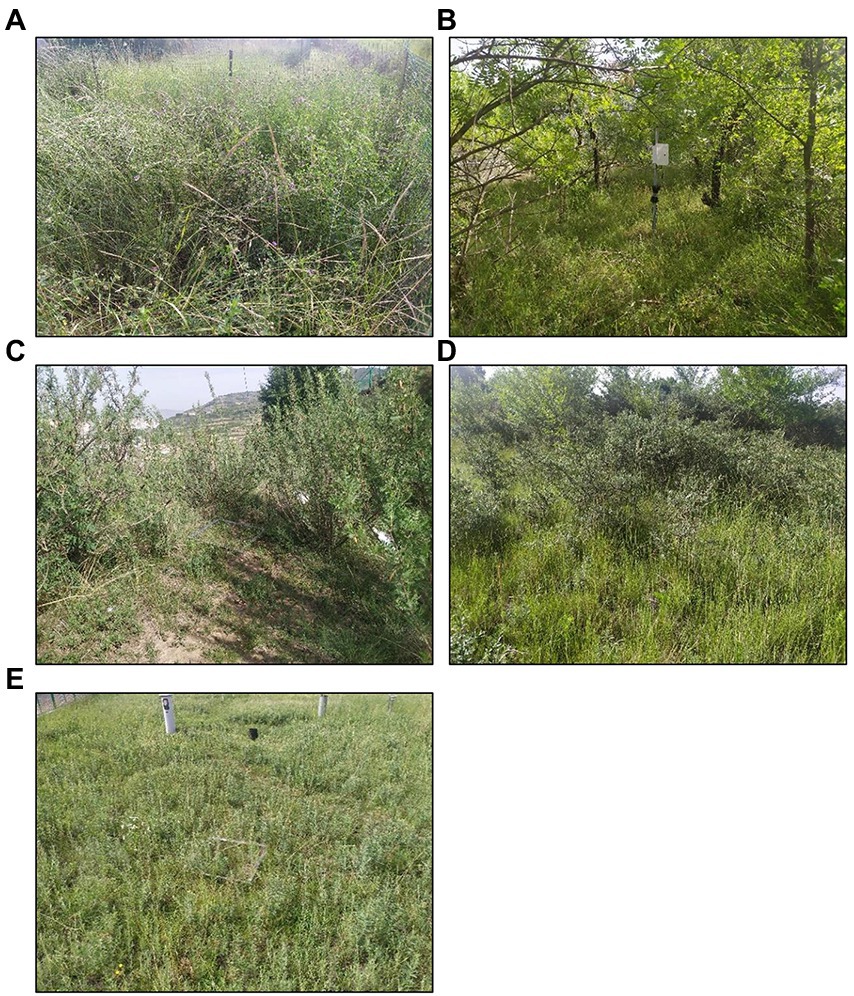
Figure 2. Photographs of sampling plots with different land use patterns: (A) Grassland; (B) Picea asperata; (C) Hippophae rhamnoides; (D) Medicago sativa; (E) The wheat field.
2.3. Soil sampling and analysis
The disturbed soil samples from different experimental treatments (GL, PA, HR, MS, T and NT) were collected with an auger of 5 cm diameter, from March 2021 to February 2022 for the determination of soil properties. Five soil samples were taken from each individual plot and placed in a plastic bag and transported to laboratory for physical chemical analysis. The soil temperature was monitored by using the EM50 data collector after every 30 min. Soil water content, soil organic carbon, total nitrogen, nitrate nitrogen, ammonium nitrogen, microbial biomass nitrogen and soil pH electrical conductivity were determined in laboratory after passing soil samples through a 2 mm sieve. The oven-drying method was used for gravimetric soil water content determination (Défossez et al., 2021). The soil pH was measured by Potentiometric method (soil water ratio = 1:2.5) (Mao et al., 2016). The core sampler method was used for determination of soil bulk density (Lu et al., 2019). Soil organic carbon (SOC) was determined by using the Walkley-Black dichromate oxidation method (Nelson, 1982). Soil TN was determined by the oxidation-external heating titration method (Huang et al., 2021), and soil microbial nitrogen (MBN) was determined using a chloroform fumigation-H2SO4 leaching method (Chen et al., 2021). The soil NO3−-N and NH4+-N were determined by the MgO-Devarda’s alloy distillation method (Yang et al., 2014).
2.4. Determination and calculation of soil N2O
N2O emissions from soil shall be measured every half month from March 2021 to February 2022. Two weeks prior to starting measurements, three stainless steel bases (50 cm × 50 cm × 20 cm) were permanently installed in the soil at each site with at least a 5 m buffer zone between each steel base. The upper part of each base had a collar (3 cm) to support the sampling chamber. Located at the top of each open-bottom opaque stainless steel chamber (50 cm × 50 cm × 50 cm) were two fans powered by 12 v batteries used to mix the air inside the chamber during the N2O flux measurements. A rubber seal strip was attached to the bottom perimeter of each chamber to provide an airtight seal when placed over the collar on the base in the soil. As done in previous studies (Ma et al., 2018), all samples were collected between 09:00 a.m. and 11:00 a.m. (local time) on the same day each week when the soil temperature was close to the daily mean soil temperature (Zou et al., 2005; Yao et al., 2013). After the chamber was closed, air samples (five in total) were taken from inside the chamber at 8 min intervals (at minutes 0, 8, 16, 24, and 32) using a 100 ml polypropylene syringe equipped with a three-way plug valve. The air samples were transferred to pre-evacuated E-Switch aluminum foil composite film gas sampling bags (Shanghai Shenyuan Scientific Instruments Co., Ltd., Shanghai, China) via the three-way plug valve. Within 48 h, the samples were returned to the laboratory for analysis of N2O concentrations using a gas chromatograph (Agilent 4890D, Agilent Technologies, Wilmington, Delaware, USA). The ratios of each set of 5 samples were linearly fitted to the corresponding sampling intervals. When the linear regression coefficient R2 > 0.75, it is regarded as valid data and used to calculate the emission flux of the target gas.
Calculation of the emission flux of N2O:
In the formula: F is the emission flux of N2O, μg·(m2· h) −1, ρ is the density of N2O in the quasi-state (kg·m−3), V is the adequate space volume in the airtight box (m3), A is the water surface area covered by the closed box (m2), ΔC is the concentration difference of N2O gas (expressed as the volume fraction of air), Δt is the sampling interval (h), T is the temperature of the closed box during sampling (°C).
Calculation of N2O cumulative emissions:
In the formula: M is the cumulative N2O emission (kg· hm−2), F is the emission flux of N2O, μg·(m2· h) −1, ti + 1−ti is the time interval of the ith and i + 1 sampling (d), n is the total number of measurements during the observation period.
2.5. Statistical analysis
The study data obtained from the research field were tested at 5% probability level with one-way factor interaction ANOVA by using an appropriate SPSS 25 (IBM Corp., Chicago, IL, USA) computer software program. The significant differences among different experimental treatments and their interaction were compared with an LSD test. The relationships amongst different soil properties were analyzed using Pearson’s correlation coefficient. The study data is presented as the mean values of three replications with standard deviation. Furthermore, principle component analysis (PCA) was done in order to assess the multivariate variability introduced by the different treatments for soil properties and N2O emission in the soil system.
3. Results
3.1. Soil properties under different land use patterns
Seasonal soil temperature variation under six different land use patterns was consistent. From the beginning of the growing season, the soil temperatures fluctuated upward as arial temperatures gradually warmed (Figure 3). The soil temperature peaked from mid-July to mid-August during summer whilst it declined in December during winter. Soil temperature under GL treatment was highest and it was lowest under PA treatment. The mean soil temperature under the GL, PA, HR, MS, T and NT treatments was 11.66, 8.78, 9.31, 10.16, 9.68 and 10.01°C, respectively.
Figure 3. Soil temperature under different land use patterns on a semi-arid Loess plateau China.
Land use patterns significantly affected soil properties (Table 2). Compared with GL treatment, Picea asperata woodland significantly increased soil bulk density, soil water content and soil SOC and decreased soil pH value. Soil pH values showed that the soils of experimental site were alkaline, and the average pH of wheat fields was similar and significantly higher than that of the control sites, with the highest in T treatment and the lowest in PA treatment. Soil water content was the highest in PA treatment and lowest in T treatment. The soil SOC contents under the six land use patterns were PA > GL > T > NT > HR > MS, being significantly higher under Picea asperata woodland than other land use patterns. There was no significant difference between CT and NT treatments in the wheat field.
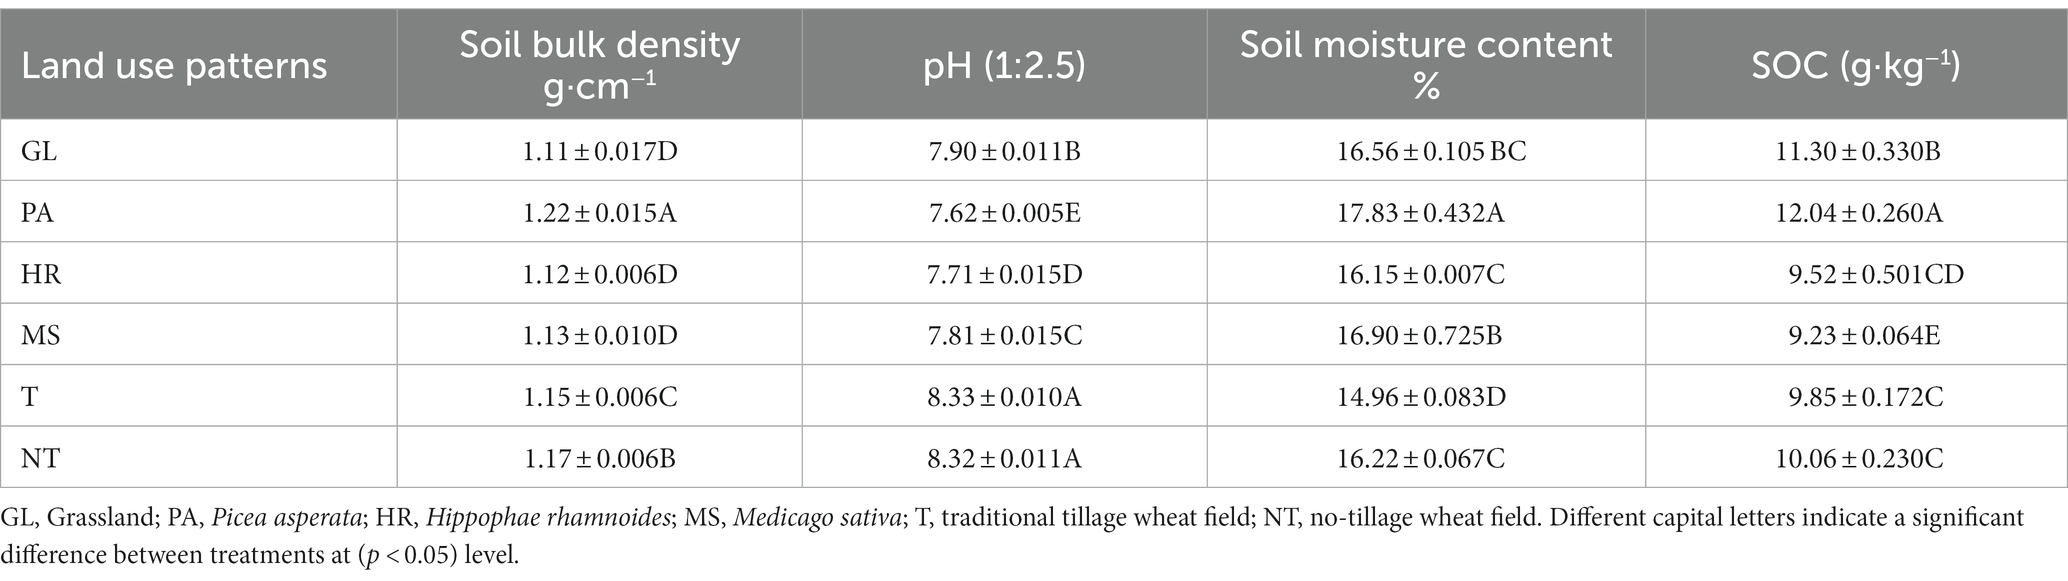
Table 2. Soil physicochemical properties at 0–20 cm under different land use patterns.
Soil nitrogen is an important indicator reflecting soil fertility and biological activity. It can be seen from Figure 4 that among the six different land use patterns, the soil TN content of the GL plot was significantly lower than that of the other five vegetation types (p < 0.05), and the specific trend was PA > HR > MS > NT > T > GL. Compared with GL, the contents of TN increased by 41.44, 30.63, 25.45, 15.99 and 11.04% under PA, HR, MS, NT, and T treatments, respectively. There was no significant difference was noted between HR, MS, T and NT treatments; however, significant difference (p < 0.05) was seemed between PA treatment and other treatments. Soil MBN content was significantly affected between different land use patterns (Figure 4B). The PA treatment had significant higher MBN (28.28 mg kg−1) whilst T treatment had lowest (18.03 mg kg−1) MBN value. The PA, HR and MS increased MBN by 38.36, 22.11 and 9.05%, respectively. Our results showed that Picea asperata woodland increased TN and MBN accumulation.
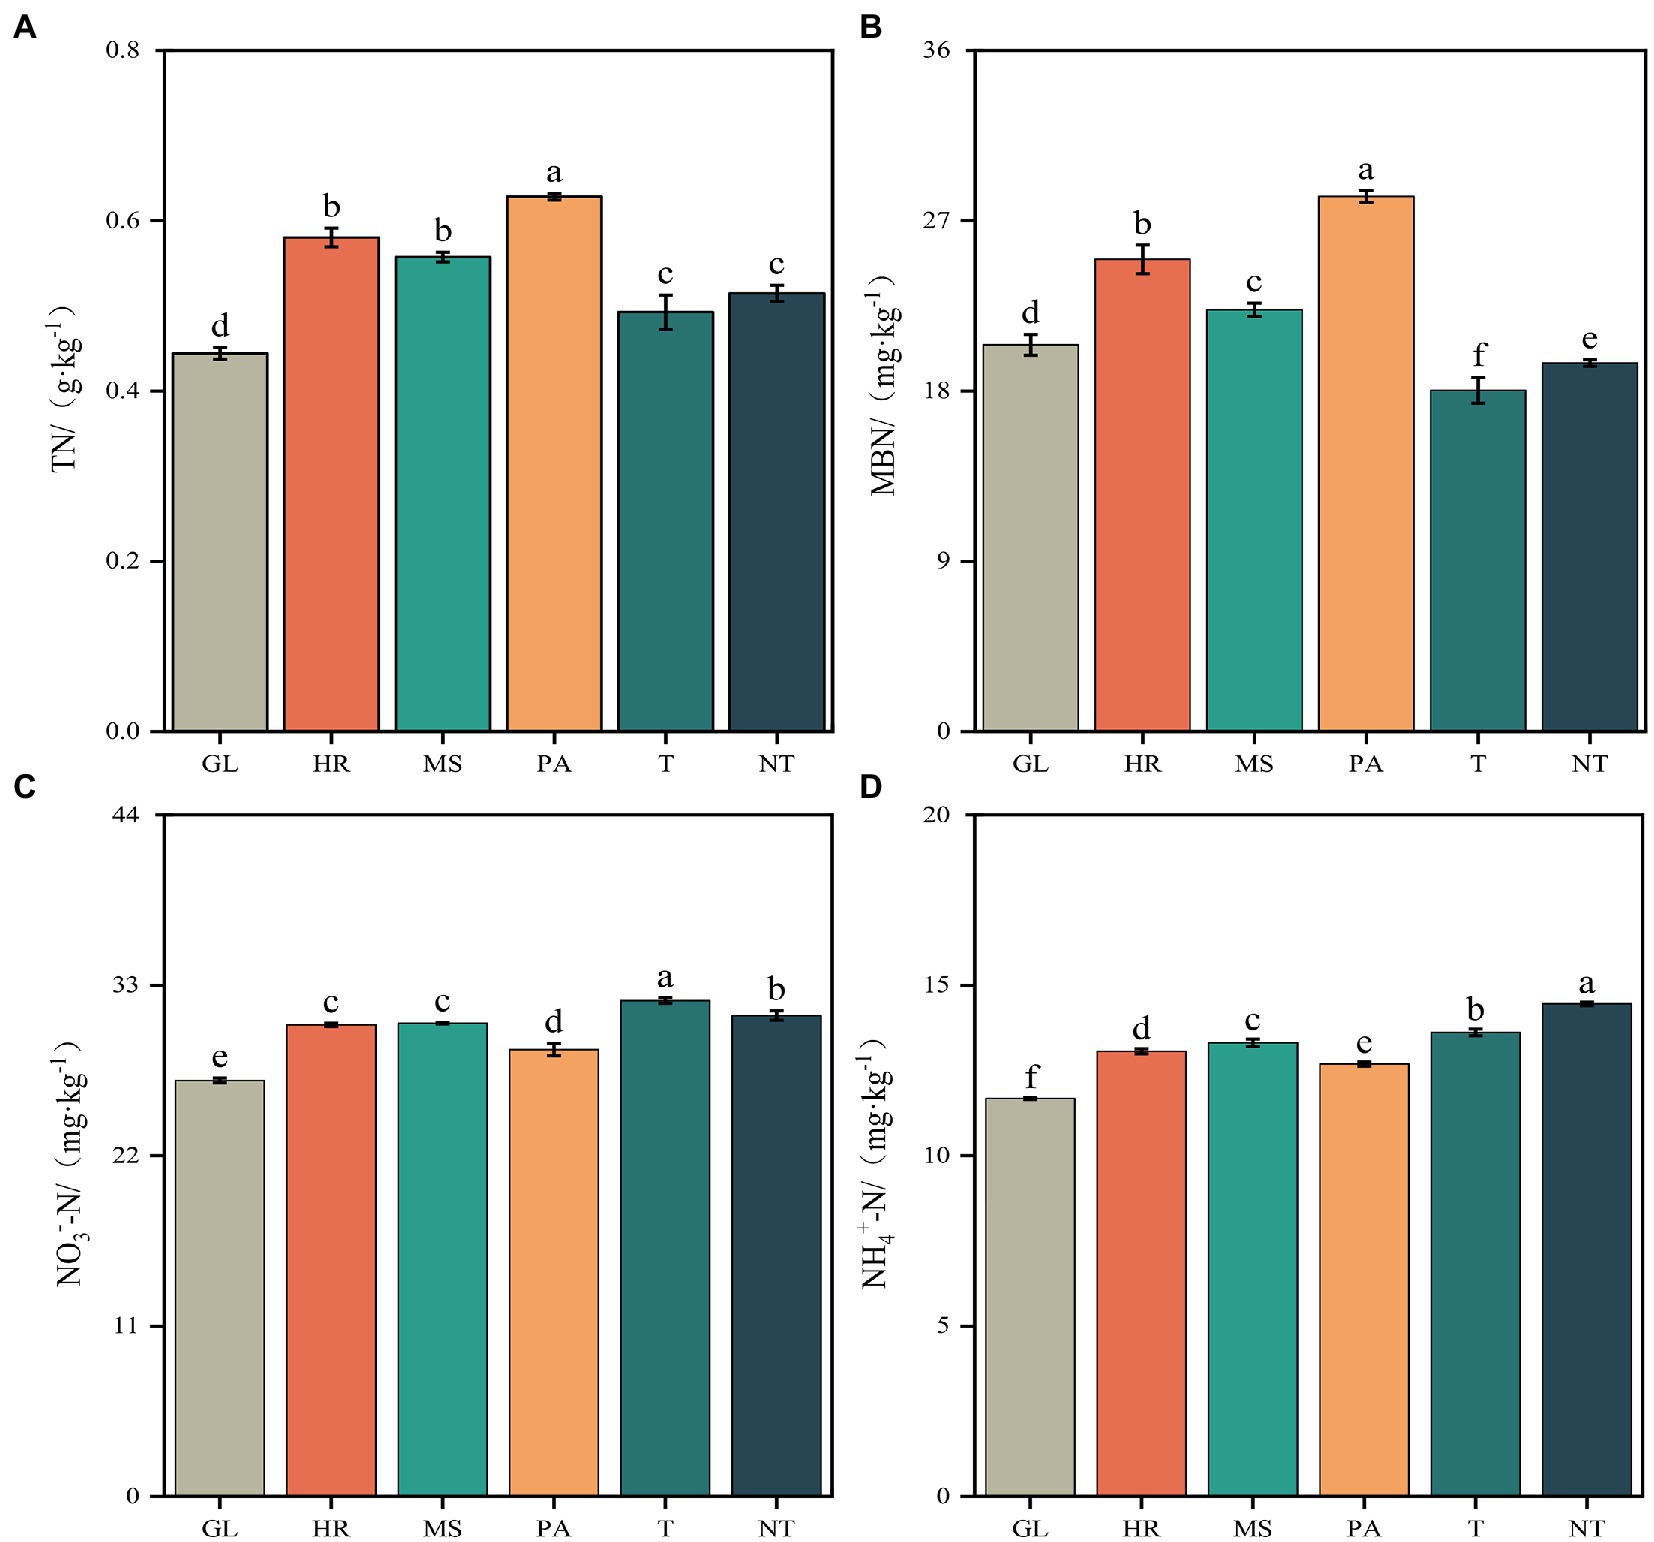
Figure 4. Changes in soil nitrogen composition under different land use patterns. Response of soil nitrogen contents to different land use patterns. Vertical error bars represent the standard error of mean values. Different lower-case letters show significant differences between different treatments at p < 0.05. Panel (A) is the soil total nitrogen values as influenced by the land use patterns. Panel (B) is the microbial biomass nitrogen under different land use patterns. Panel (C) is the nitrate nitrogen under different land use patterns. Panel (D) is the ammonium nitrogen as affected by the different land use patterns.
The content of soil NO3−-N (32.02 mg/kg) was the highest under T treatment and the lowest in treatment GL (26.85 mg/kg), followed the trend of T > NT > MS > HR > PA > GL. In addition, the content of NH4+-N under GL treatment was lower than that of other land use patterns. Compared with GL treatment, the NT, T, MS, HR, and PA treatments increased soil NH4+-N by 23.8, 16.61, 14.04, 11.9 and 8.65%, respectively. In general; compared with GL, the contents of NO3−-N and NH4+-N in soil under other land use patterns increased with varying degrees especially in conventional and no-tillage system in wheat field.
3.2. Response of soil N2O flux to different land use patterns
Our study data depicted apparent seasonal variations in N2O emission. The highest N2O emission risen during summer months being peak occurring in July under CT followed by NT, HR, GL, MS and PA. In addition, there was no significant difference in soil N2O emissions under the different land use patterns during autumn and winter months (Figure 5).
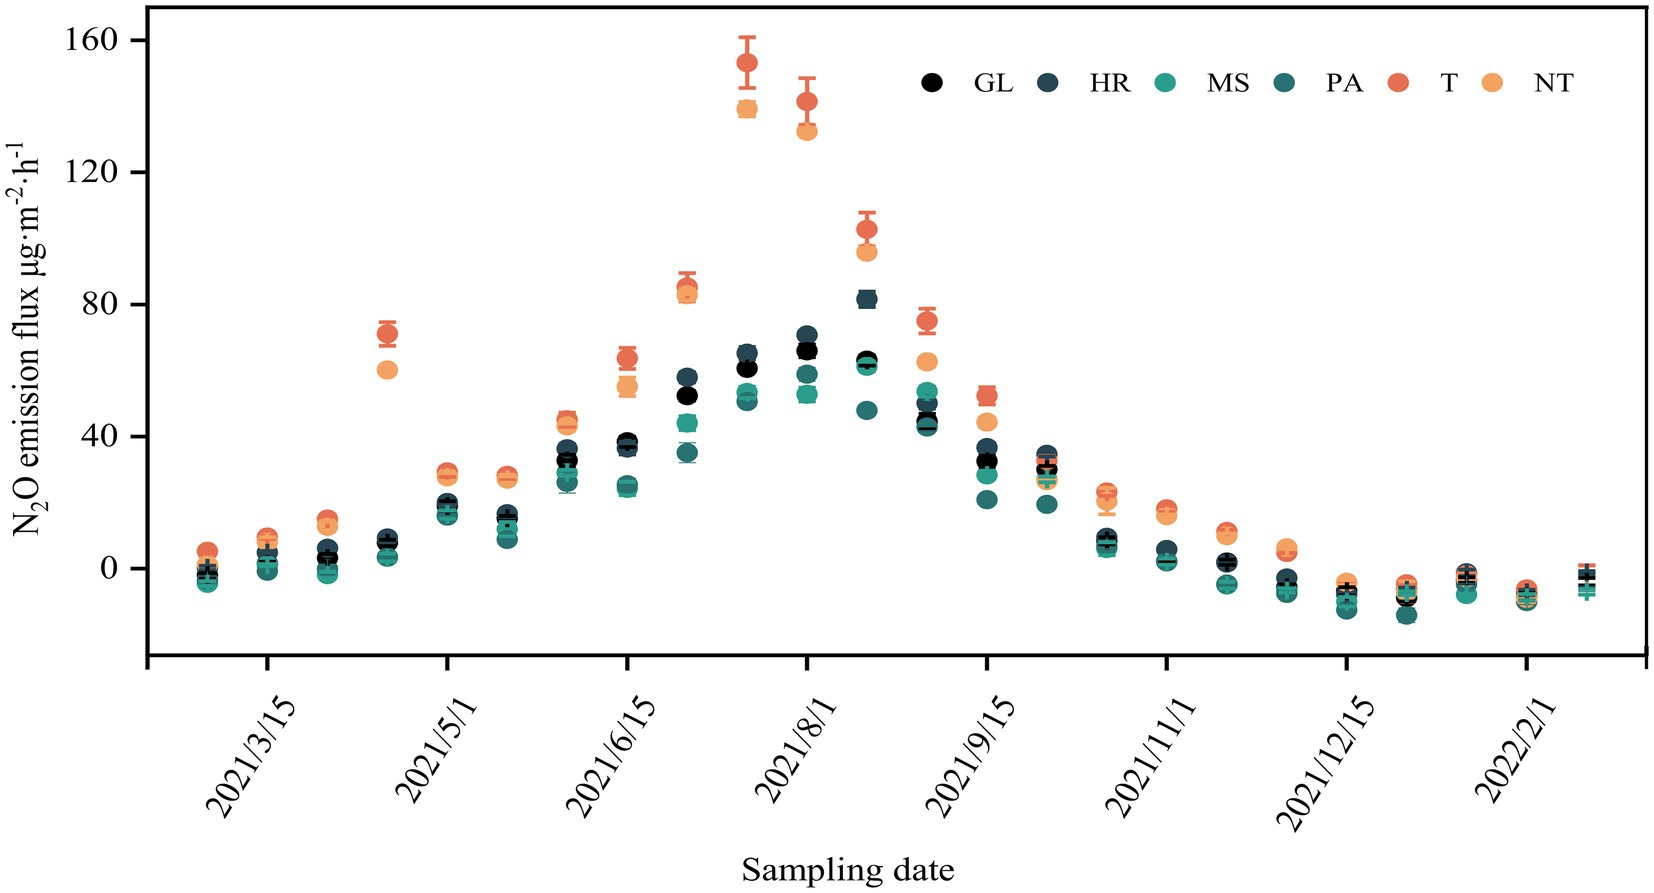
Figure 5. Seasonal changes of N2O emission under different land use patterns.
All land use patterns served as nitrous oxide emitters during the study period. Our results showed that the T treatment had highest cumulative N2O flux value whilst PA treatment had lowest cumulative N2O flux value. The order of cumulative N2O flux under all treatments was T > NT > HR > GL > MS > PA (Figure 6). Compared with PA, the T, NT and HR treatments increased cumulative N2O emission by 113.64, 91.02 and 16.66%, respectively.
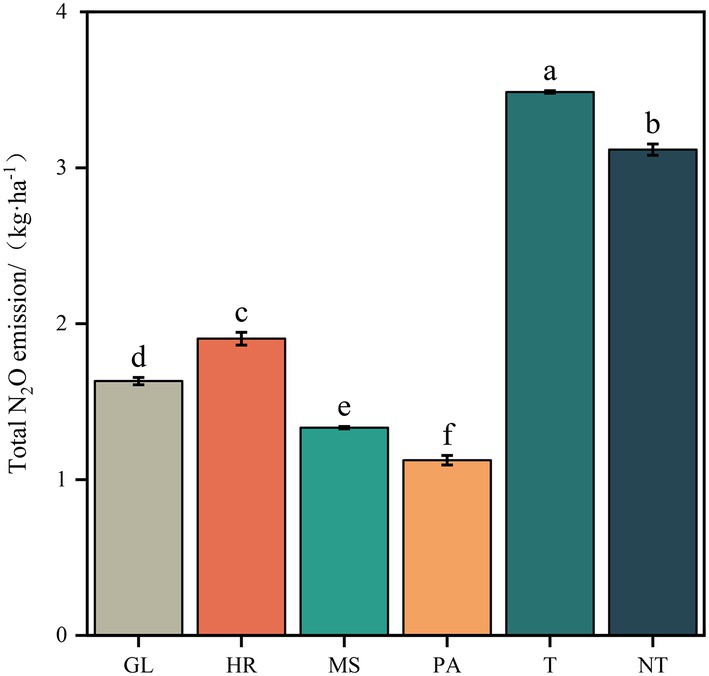
Figure 6. Response of cumulative N2O flux to different land use patterns on a semi-arid Dingxi. Vertical error bars represent the standard error of mean values. Different lower-case letters show significant differences between different treatments at p < 0.05.
3.3. Principle component analysis
According to Jolliffe cut-off value the Principle component analysis (PCA) permitted for isolating five principal components. The observation point made by a collaboration of PC1 and PC2 shows the general variance defined by the five main components in accordance with PCA analysis.
In the PCA analysis of nine variables (viz., ST, SWC, pH SOC, MBN, TN, N2O, NO3−-N and NH4 +-N), PC1 and PC2 were extracted with eigenvalues (>1) and explained 63.8% of the total variance. However, PC3, PC4, and PC5 do not permit the supplementary information addition; that is why they are not involved. The maximum loadings of PC1 comprise 42.3% of the total variance and in PC2 the higher loadings of 21.5% of the total variance were detected (Figure 7).
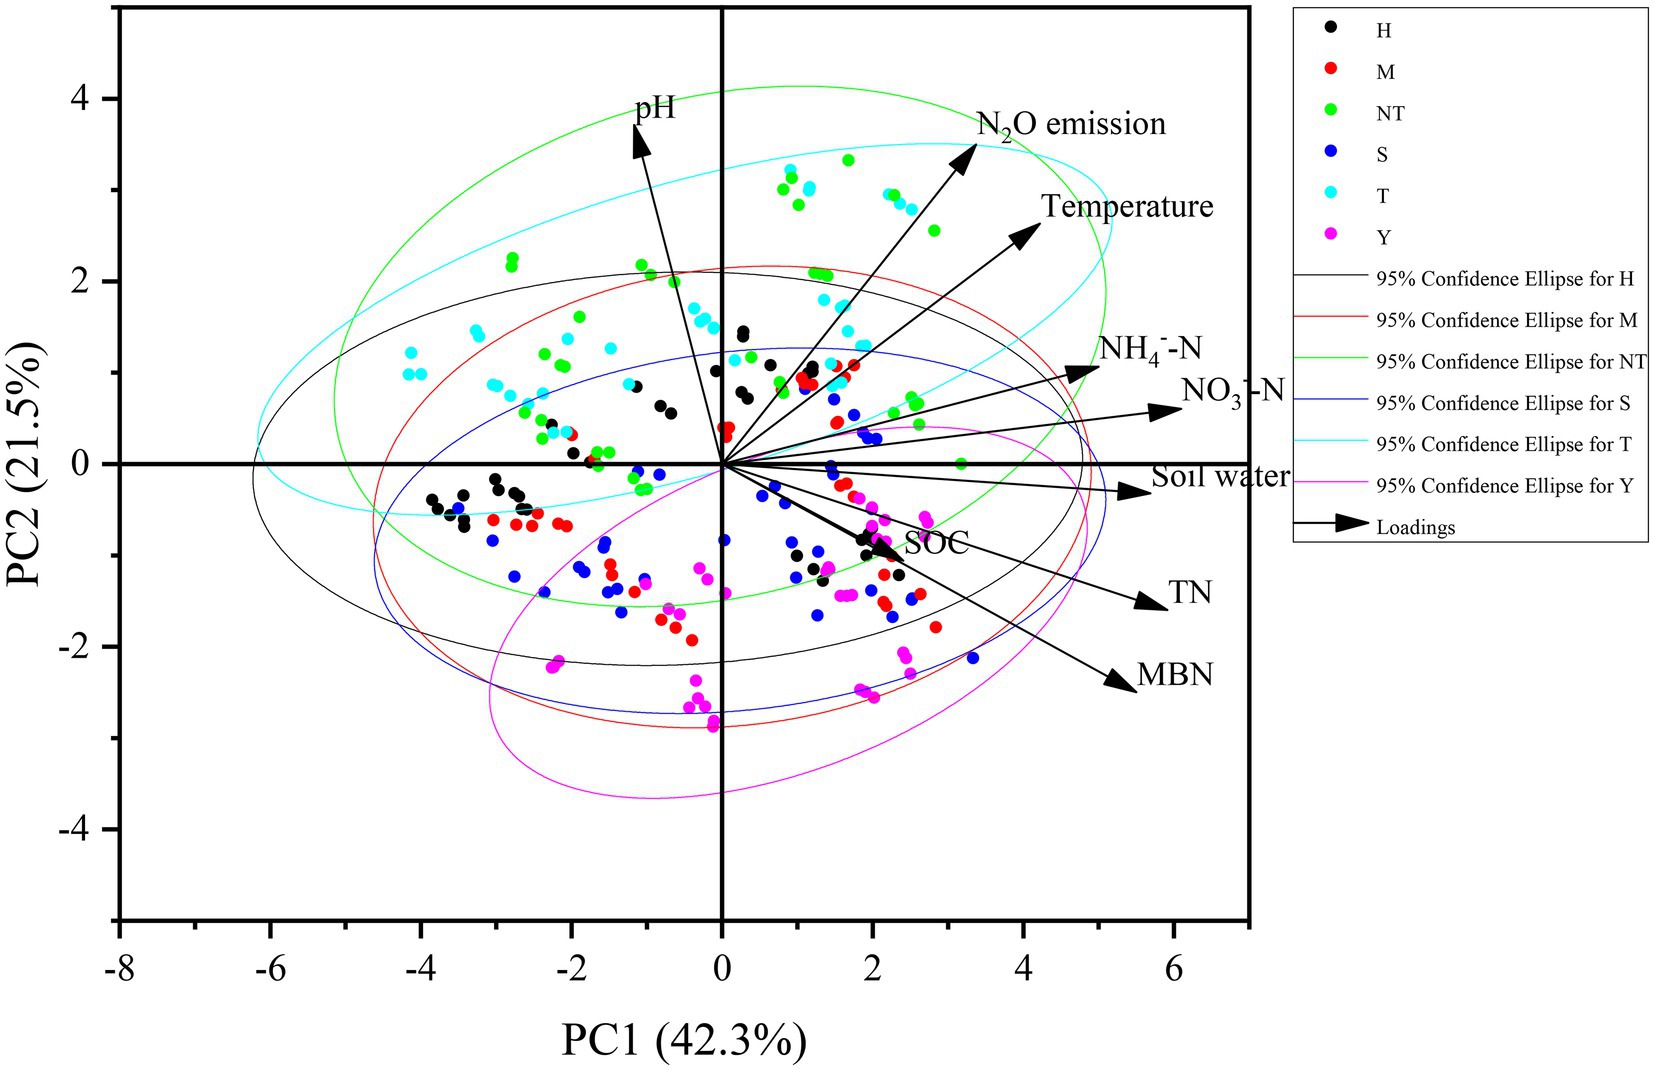
Figure 7. Principal component analysis of soil properties and N2O emission under land use patterns.
3.4. Factors influencing N2O emissions
Our study showed significant positive correlation between N2O emission and soil and environmental factors. Soil temperature had significant positive correlation with N2O emission. Furthermore, soil water content, soil pH, and soil NO3−-N, NH4+-N, TN and MBN were significantly positively correlated with N2O emission. Additionally, a negative correlation was observed between N2O emission with soil organic carbon. Fluctuations in N2O emission appeared to be described by dissimilarities in soil temperature, moisture content and nitrogen contents with data variance 95% described by these soil and environmental variables (Figure 8).
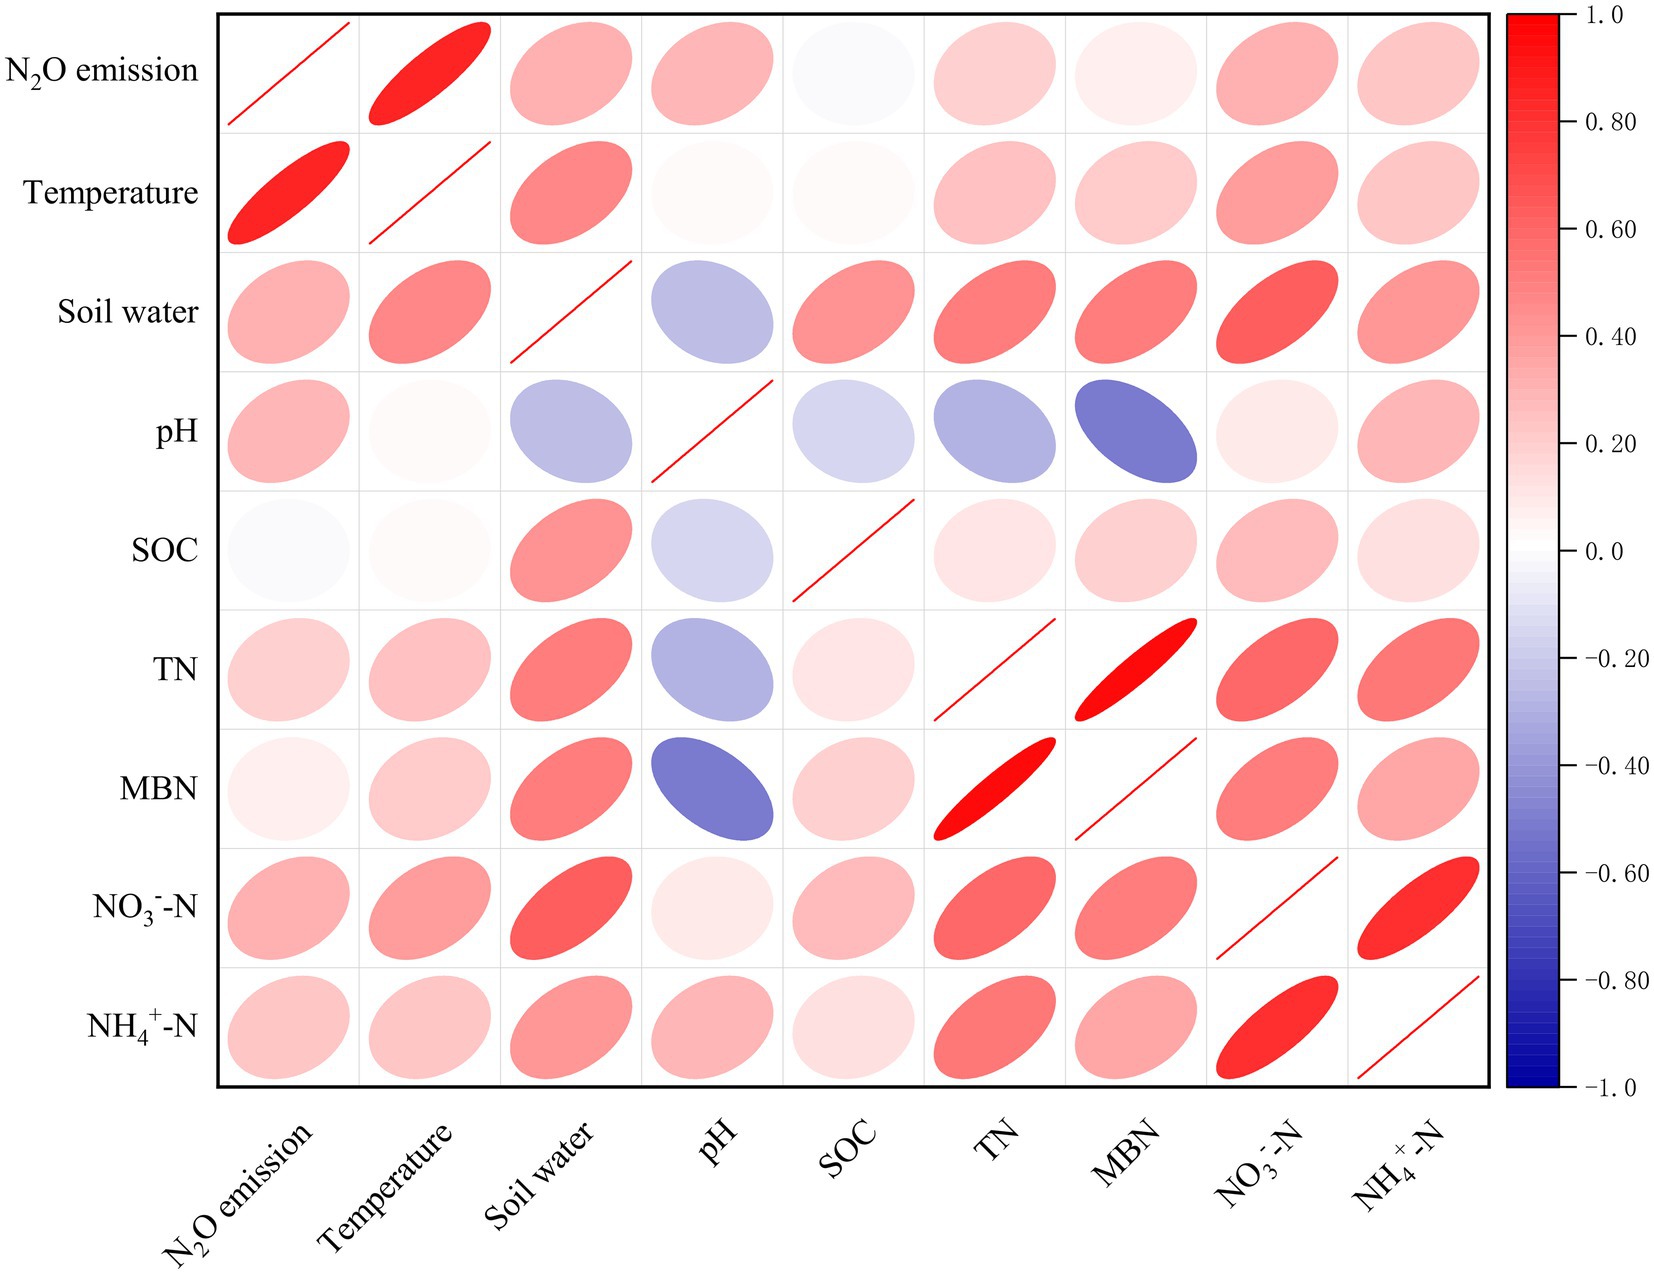
Figure 8. Correlation between soil N2O emissions and soil properties under land use patterns.
4. Discussion
4.1. Effects of land use patterns on soil properties
Land use is one of the essential components of an ecosystem and its changes have a significant impact on soil properties (Deng et al., 2018). Previous study by Yan et al. (2021) have shown that there are overall soil pH differences among land use patterns and forest land has the lowest pH. Another study by Wang et al. (2020) found that the forest soil system has better water holding capacity and water supply capacity, and the SOC content in the forest is significantly higher than shrubs and grasslands. Our results found that compared with Grassland, Picea asperata woodland significantly increased soil bulk density, soil water content and soil SOC content, and decreased soil pH because arbor forest land was richer in vegetation, litter and root systems There are more secretions, and the decomposition process of litter will cause soil acidification (Qiao et al., 2014). At the same time, forest vegetation can also change the forest environment, reduce solar radiation and temperature differences and increase soil moisture (Özkan and Gökbulak, 2017), Creating a stable environment for litter decomposition. In addition, due to the large degree of human disturbance in wheat fields and shrub grasslands, the vegetation community structure is relatively simple, and the litter and root densities are lower than those of arbor fields. Therefore, Picea asperata woodland can increase the soil bulk density, organic matter and water content and reduce the soil pH value.
Different land use patterns can affect the content and distribution of nitrogen components in the soil to varying degrees (Cheng et al., 2013). Studies have shown that nitrogen-fixing tree species in forests can increase soil nitrogen stocks and promote soil nitrogen cycling (Rothe et al., 2002). This study showed that the soil N content of the five land-use patterns increased to varying degrees compared with that of the Grassland, with the total N and microbial N content of the Picea asperata woodland being significantly higher than that of the shrub grassland and wheatland. On the one hand, the Picea asperata woodlands have lush vegetation growth and are accompanied by a large number of herbs, so the Picea asperata woodlands provide a large amount of litter, animals, and microbial residues for the soil surface, which can effectively speed up the decomposition rate of vegetation litter and promote the return rate of nutrients. (Anurag et al., 2019). On the other hand, because the biomass of woodland vegetation is mainly concentrated in the above-ground part, and the surface soil is well-aerated and nutrient-rich, it is more conducive to soil microbial activity. In addition, the ripe harvest of crops will lead to the loss of a large amount of organic matter in the soil, and various tillage measures led to soil system changes, which accelerate the mineralization and decomposition of soil organic matter (Shi et al., 2013), thus leading to TN and MBN accumulation in forest soils. The content is significantly higher than that of agricultural grassland. The content of ammonium and nitrate nitrogen in wheat field was significantly higher than in the other treatments. The specific performance was that the soil ammonium nitrogen content was the largest under the NT treatment and the nitrate nitrogen content was higher under the T treatment. This is because the human disturbance in wheat fields is higher than that in forest and grassland, and the application of basal fertilizer during sowing will lead to the accumulation of ammonium and nitrate nitrogen in the soil. In addition, NT treatment reduced soil compaction and soil disturbance benefits the nutrient accumulation and crop root growth whereas plough layer under CT increased the soil compaction (Fiorini et al., 2020). The high NO3−- N content of the soil surface under conventional tillage is due to the destruction of the soil surface layer by conventional tillage, which results in the loss of soil nutrients and reduced moisture content, making it easier to convert NH4+-N to NO3−- N which in turn leads to an increase in soil NO3−- N content (Pisani et al., 2017).
4.2. Effects of different land use patterns on soil N2O emissions
The N2O flux varies significantly under different land use patterns. In this study, the average N2O flux from agricultural soils was more significant than that from grassland, which is consistent with the findings of Lin et al. (2009). The cumulative N2O flux of farmland soil was highest, possibly due to the increase of nitrogen content by nitrogen fertilizer application in farmland, thus promoting N2O emission. Furthermore, the systematic plowing of farmland can promote mineralization to generate ammonium and nitrate nitrogen thus increasing soil nitrogen accumulation. When soil temperature and humidity conditions are suitable, a large amount of N2O is released. However, there is also a study by Schaufler et al. (2010) who declared that the grassland had more N2O emission than farmland. The high activity of microorganisms in grassland stimulates the accumulation of soil nitrogen and the dense roots of grassland and litter on the ground are the reasons for the high N2O emission from grassland. The N2O flux is higher in spring and summer but lower in autumn and winter. The first emission peak of N2O occurred around April 15, specifically for the T treatment. This is due to the application of basal fertilizer at sowing, which starts to take effect and allows some of the nitrogen to enter the soil and the soil to emit some of the N2O through respiration but due to the low temperature and weak microbial activity of the soil at this time, the N2O emissions are relatively low and therefore a small emission occurs. From July to August, the soil N2O emission was more under all treatments being highest under T treatment because during summer the hydrothermal conditions are more good and suitable. The temperature regulates the N2O emission from the soil through its influence on the activities of nitrifying bacteria, denitrifying bacteria and other microorganisms. In addition, the rainfall during summer months was relatively more concentrated and rainfall water infiltrated into the soil which led to an anaerobic conditions and promotes nitrification and denitrification processes. This is consistent with the findings of Pendall et al. (2010). In addition, at the end of spring wheat growth, the demand for nitrogen in the soil becomes less. At the same time, the surface litter returns nitrogen source to the soil through decomposers’ decomposition, hence the contentration of nitrogen in the soil increases, thereby enhancing denitrification (Cao et al., 2019). The N2O emission during winter months was very low and there was almost no difference in the soil N2O emission under different land use patterns. This might be due to the low winter temperature, the soil’s low moisture content and the inorganic nitrogen. The results of this study showed that compared with the GL treatment, the T treatment significantly increased soil N2O emissions specifically T > NT > HR > GL > MS > PA. This is because of good and better water permeability and air permeability under conventional tillage. The conventional tillage system favors to the transformation of soil anaerobic environment to an aerobic environment, thus promotes the nitrification process to produce N2O and also strengthen the gas diffusion and nutrient cycling, so that soil SOC, NH4+-N, and NO3−-N move up from deep soil to surface soil again, so that surface dead vegetation enters into the lower soil layer and accelerates its decomposition, thereby promoting the emission of N2O in the soil (Du et al., 2022). In addition, no-tillage increases the soil capacity and reduces the gas diffusion rate, which in turn allows the N2O produced by nitrification and denitrification to be further reduced to N2 before it can emit from the surface soil, thus reducing N2O emissions (Du et al., 2022). In general, the woodland had lowest N2O emissions, probably due to unfertilized woodland and also might be taller plants, denser plants growth, shady conditions throughout the year and relatively low soil temperature which reduces evaporation and leaching losses.
4.3. Factors affecting N2O emission
N2O emission is mediated by microbial nitrification (autotrophic/heterotrophic nitrification) and denitrification (Bond-Lamberty et al., 2004; Guetlein et al., 2018). Nitrifying (ammonia-oxidizing archaea, AOA; ammonia-oxidizing bacteria, AOB) and denitrifying genes [nitrite reductase (encoded by nirS/nirK)], are considered to be the rate-limiting step in nitrification and denitrification, respectively, which are main process in the production of N2O (Jones et al., 2014; Kits et al., 2019). At the same time, The environmental factors such as soil temperature and soil moisture influence on soil N2O emissions. Our correlation analysis showed a very significant positive correlation between soil N2O emissions and soil temperature. This is because of the nitrification and denitrification processes that can be carried out from 5°C to 35°C. The soil temperature regulates N2O emissions mainly by influencing the structure of the nirS-type denitrifying microbial community, and the activity of denitrifying bacteria increases by 1.5 to 3.0 times for every 10°C increase in temperature (Xing et al., 2021). On the other hand, the soil temperature also increases the respiration of microorganisms in the soil which produces the anaerobic conditions for denitrifying organism’s resultant in higher N2O emission (Braker et al., 2010). This study also showed that soil N2O emissions were significantly and positively correlated with soil water content, pH, and NO3−-N, TN and NH4+-N which is consistent with the results of previous study (Qin et al., 2021). The higher soil moisture mainly affects the community structure of nirK and nosZ gene-containing microorganisms, stimulating the growth of some microorganisms in small abundance, including Bradyrhizobium with the nirK gene and Tardiphaga with the nosZ gene, thus regulating the emission of N2O (Qin et al., 2021). In addition, an increase in soil moisture content also increases the enrichment of effective soil carbon and oxygen, affecting the distribution of oxygen concentrations in the soil and the activity of nitrifying and denitrifying microorganisms, which in turn causes N2O emissions (Hu et al., 2015). Moreover, the soil pH can directly regulate N2O emissions by affecting biological and abiotic processes (Zaman et al., 2012). It is generally believed that the pH in between 6 and 8 is most favorable for denitrifying bacterial activity. Soil microbial activity significantly enhanced with the increasing pH value, leading to enhanced soil denitrification and increased N2O emission (Zaman et al., 2012). Moreover, increasing soil TN, nitrate nitrogen and ammonium nitrogen content will provide a good nitrogen source for nitrification and denitrification. It has been found that ammonia-oxidizing bacteria start to grow immediately after the addition of a nitrogen source. Ammonia-oxidizing bacteria (AOB) and ammonia-oxidizing archaea (AOA) can oxidize ammonia and produce N2O (Kou et al., 2015; Dong et al., 2018). NO2− from soil denitrification, which can accumulate under certain conditions also has a large potential for N2O emissions (Giguere et al., 2017). At the same time, available nitrogen in soil provides an electron donor for denitrifying microorganisms, promoting the occurrence of denitrification, thus increasing N2O emissions (Cao et al., 2019).
5. Conclusion
Our results showed that Picea asperata woodland increased the soil bulk density, organic matter, soil water content, total nitrogen and microbial biomass nitrogen accumulation and decreased soil pH compared with other treatments. Moreover, the wheat field is more favorable to the accumulation of soil NO3−-N and NH4+-N. In this study, land use patterns had a more significant impact on N2O flux. Compared with abandoned land, Picea asperata woodland significantly reduced N2O flux, specifically T > NT > HR > GL > MS > PA. The correlation study showed that soil physicochemical properties were closely related to N2O emission fluxes and soil temperature was the most significant factor affecting N2O emission. Therefore, in combination with the restoration and sustainable development of the terrestrial ecosystem on the Loess Plateau in Central Gansu, we suggest that more forest land should be selected as the optimal site for nitrogen fixation and emission reduction in the future projects of returning farmland to forests and grasslands. This study provides vital scientific support for efficient land use and ecological environmental protection in the Loess Plateau of Central Gansu with poor soil and low land carrying capacity. However, considering that climatic factors, soil microbial community structure and field management measures will jointly affect soil N2O emissions, we still need a deeper understanding and a more comprehensive study of the mechanism of different land use patterns on soil physical and chemical properties and greenhouse gases to achieve higher climate change mitigation.
Data availability statement
The raw data supporting the conclusions of this article will be made available by the authors, without undue reservation.
Author contributions
MD and JY: data processing, methodology, visualization, and writing – original draft. MZ: data processing. JW: investigation. GX, SL, and JL: sample collection and experimental operation. GL and LY: design test, supervision, and funding acquisition. All authors contributed to the article and approved the submitted version.
Funding
This research was honored to be supported by the Excellent doctoral program in Gansu Province (22JR5RA843), Key R&D Plan of Gansu Province (22YF7FA116), Gansu Provincial Science and Technology Department Youth Science and Technology Fund Project (20JR10RA493), the “Innovation star” project of excellent graduate students in Gansu Province (2022CXZX-641), the Industrial support plan project, China (2021CYZC-15), the Key Talent Projects in Gansu Province, China (LRYCZ-2020-1), and Industrial support projects for colleges and universities in Gansu Province, China (2022CYZC-41).
Acknowledgments
We would like to sincerely thank all those who participated in this research (outdoor work and laboratory work).
Conflict of interest
The authors declare that the research was conducted in the absence of any commercial or financial relationships that could be construed as a potential conflict of interest.
Publisher’s note
All claims expressed in this article are solely those of the authors and do not necessarily represent those of their affiliated organizations, or those of the publisher, the editors and the reviewers. Any product that may be evaluated in this article, or claim that may be made by its manufacturer, is not guaranteed or endorsed by the publisher.
References
Anurag, M., Anil, K., and Rajesh, P. (2019). Application of heuristic approaches for prediction of hydrological drought using multi-scalar streamflow drought index. Water Resour. Manag. 33, 3985–4006. doi: 10.1007/s11269-019-02350-4
Arneth, A., Sitch, S., Pongratz, J., Stocker, B. D., Ciais, P., Poulter, B., et al. (2017). Historical carbon dioxide emissions caused by land-use changes are possibly larger than assumed. Nat. Geosci. 10, 79–84. doi: 10.1038/ngeo2882
Bond-Lamberty, B., Wang, C., and Gower, S. T. (2004). A global relationship between the heterotrophic and autotrophic components of soil respiration? Glob. Chang. Biol. 10, 1756–1766. doi: 10.1111/j.1365-2486.2004.00816.x
Braker, G., Schwarz, J., and Conrad, R. (2010). Influence of temperature on the composition and activity of denitrifying soil communities. FEMS Microbiol. Ecol. 73, 134–148. doi: 10.1111/j.1574-6941.2010.00884.x
Cao, W. C., Song, H., Wang, Y. J., Tan, W., Guo, J. H., Chen, Q., et al. (2019). Key production processes and influencing factors of nitrous oxide emissions from agricultural soils. J. Nutr. Fertil. 25, 1781–1798. doi: 10.11674/zwyf.18441
Chadwick, D. R., Pain, B. F., and Brookman, S. K. E. (2000). Nitrous oxide and methane emissions following application of animal manures to grassland. J. Environ. Qual. 29, 277–287. doi: 10.2134/jeq2000.00472425002900010035x
Chen, N., Li, X., Shi, H., Hu, Q., Zhang, Y., and Leng, X. (2021). Effect of biodegradable film mulching on crop yield, soil microbial and enzymatic activities, and optimal levels of irrigation and nitrogen fertilizer for the Zea mays crops in arid region. Sci. Total Environ. 776, –145970. doi: 10.1016/j.scitotenv.2021.145970
Cheng, Y., Wang, J., Mary, B., Zhang, J. B., Cai, Z. C., and Chang, S. X. (2013). Soil pH has contrasting effects on gross and net nitrogen mineralizations in adjacent forest and grassland soils in Central Alberta Canada. Soil Biol. Biochem. 57, 848–857. doi: 10.1016/j.soilbio.2012.08.021
Chiti, T., Díaz-Pinés, E., Butterbach-Bahl, K., Marzaioli, F., and Valentini, R. (2018). Soil organic carbon changes following degradation and conversion to cypress and tea plantations in a tropical mountain forest in Kenya. Plant Soil 422, 527–539. doi: 10.1007/s11104-017-3489-1
Défossez, P., Veylon, G., Yang, M., Bonnefond, J. M., Garrigou, D., Trichet, P., et al. (2021). Impact of soil water content on the overturning resistance of young Pinus Pinaster in sandy soil. For. Ecol. Manag. 480:118614. doi: 10.1016/j.foreco.2020.118614
Deng, L., Wang, K., Zhu, G., Liu, Y., Chen, L., and Shangguan, Z. (2018). Changes of soil carbon in five land use stages following 10 years of vegetation succession on the Loess Plateau, China. Catena 171, 185–192. doi: 10.1016/j.catena.2018.07.014
Dong, D., Kou, Y. P., Yang, W. C., Chen, G., and Xu, H. (2018). Effects of urease and nitrification inhibitors on nitrous oxide emissions and nitrifying/denitrifying microbial communities in a rainfed maize soil: a 6-year field observation. Soil Tillage Res. 180, 82–90. doi: 10.1016/j.still.2018.02.010
Du, M. Y., Yuan, J. Y., Li, G., Yan, L. J., Liu, X. Y., Qi, X. P., et al. (2022). The effect of conservation tillage on impact of N2O emissions. Res. Arid Areas 39, 493–501. doi: 10.13866/j.azr.2022.02.17
Eduardo, S. M., Freese, D., Mendonça, E. S., Slazak, A., and Hüttl, R. F. (2011). Carbon, nitrogen and organic C fractions in topsoil affected by conversion from silvopastoral to different land use systems. Agrofor. Syst. 81, 203–211. doi: 10.1007/s10457-010-9314-y
Fiorini, A., Boselli, R., Maris, S. C., Santelli, S., Ardenti, F., Capra, F., et al. (2020). May conservation tillage enhance soil C and N accumulation without decreasing yield in intensive irrigated croplands? Results from an eight-year maize monoculture. Agric. Ecosyst. Environ. 296:106926. doi: 10.1016/j.agee.2020.106926
Frey, S. D., Lee, J., Melillo, J. M., and Six, J. (2013). The temperature response of soil microbial efficiency and its feedback to climate. Nat. Clim. Chang. 3, 395–398. doi: 10.1038/nclimate1796
Giguere, A. T., Taylor, A. E., Suwa, Y., Myrold, D. D., and Bottomley, P. J. (2017). Uncoupling of ammonia oxidation from nitrite oxidation: impact upon nitrous oxide production in non-cropped Oregon soils. Soil Biol. Biochem. 104, 30–38. doi: 10.1016/j.soilbio.2016.10.011
Guetlein, A., Gerschlauer, F., Kikoti, I., and Kiese, R. (2018). Impacts of climate and land use on N2O and CH4 fluxes from tropical ecosystems in the Mt. Kilimanjaro region, Tanzania. Glob. Change Biol. 24, 1239–1255. doi: 10.1111/gcb.13944
Hong, C. P., Burney, J. A., Pongratz, J., Nabel, J., Mueller, N. D., Jackson, R. B., et al. (2021). Global and regional drivers of land use emissions in 1961–2017. Nature 589, 554–561. doi: 10.1038/s41586-020-03138-y
Hu, H. W., Chen, D., and He, J. Z. (2015). Microbial regulation of terrestrial nitrous oxide formation: understanding the biological pathways for prediction of emission rates. FEMS Microbiol. Rev. 39, 729–749. doi: 10.1093/femsre/fuv021
Huang, T. T., Yang, N., Lu, C., Qin, X. L., and Siddique, K. (2021). Soil organic carbon, total nitrogen, available nutrients, and yield under different straw returning methods. Soil Tillage Res. 214:105171. doi: 10.1016/j.still.2021.105171
IPCC (2013). Climate change 2021: The physical science basis. Cambridge University 541 Press, Cambridge.
IPCC, (2021). Climate change 2021: The physical science basis. Cambridge University 541 Press, Cambridge.
Jones, C. M., Spor, A., Brennan, F. P., Breuil, M.-C., Bru, D., Lemanceau, P., et al. (2014). Recently identified microbial guild mediates soil N2O sink capacity. Nat. Clim. Chang. 4, 801–805. doi: 10.1038/nclimate2301
Kits, K. D., Jung, M.-Y., Vierheilig, J., Pjevac, P., Sedlacek, C. J., Liu, S., et al. (2019). Low yield and abiotic origin of N2O formed by the complete nitrifier Nitrospira inopinata. Nat. Commun. 10:1836. doi: 10.1038/s41467-019-09790-x
Kou, Y. P., Wei, K., Chen, G. X., Wang, Z. Y., and Xu, H. (2015). Effects of 3,4-dimethylpyrazole phosphate and dicyandiamide on nitrous oxide emission in a greenhouse vegetable soil. Plant Soil Environ. 61, 29–35. doi: 10.17221/762/2014-PSE
Lagomarsino, A., Agnelli, A. E., Pastorelli, R., Pallara, G., Rasse, D. P., and Silvennoinen, H. (2016). Past water management affected GHG production and microbial community pattern in Italian rice paddy soils. Soil Biol. Biochem. 93, 17–27. doi: 10.1016/j.soilbio.2015.10.016
Li, D., Niu, S., and Luo, Y. (2012). Global patterns of the dynamics of soil carbon and nitrogen stocks following afforestation: a meta-analysis. New Phytol. 195, 172–181. doi: 10.1111/j.1469-8137.2012.04150.x
Lin, S., Iqbal, J., Ronggui, H., and Feng, M. (2009). N2O emissions from different land uses in mid-subtropical China. Agric. Ecosyst. Environ. 136, 40–48. doi: 10.1016/j.agee.2009.11.005
Liu, X. R., Tang, Z. M., Zhang, Q. W., and Kong, W. D. (2021). The contrasting effects of biochar and straw on N2O emissions in the maize season in intensively farmed soil. Environ. Sci. Pollut. Res. 28, 29806–29819. doi: 10.1007/s11356-021-12722-2
Lu, Y., Si, B., Li, H., and Biswas, A. (2019). Elucidating controls of the variability of deep soil bulk density. Geoderma 348, 146–157. doi: 10.1016/j.geoderma.2019.04.033
Lubbers, I. M., Van Groenigen, K. J., Fonte, S. J., Six, J., Brussaard, L., and Van Groenigen, J. W. (2013). Greenhouse-gas emissions from soils increased by earthworms. Nat. Clim. Chang. 3, 187–194. doi: 10.1038/nclimate1692
Ma, W., Alhassan, A. R. M., Wang, Y., Li, G., Wang, H., and Zhao, J. (2018). Greenhouse gas emissions as influenced by wetland vegetation degradation along a moisture gradient on the eastern Qinghai-Tibet Plateau of North-West China. Nutr. Cycl. Agroecosys. 112, 335–354. doi: 10.1007/s10705-018-9950-6
Mao, J. F., Nierop, K. G. J., Rietkerk, M., Sinninghe Damsté, J. S., and Dekker, S. C. (2016). The influence of vegetation on soil water repellency-markers and soil hydrophobicity. Sci. Total Environ. 566-567, 608–620. doi: 10.1016/j.scitotenv.2016.05.077
Merino, P., Ramirez-Fanlo, E., Arriaga, H., del Hierro, O., Artetxe, A., and Viguria, M. (2011). Regional inventory of methane and nitrous oxide emission from ruminant livestock in the Basque Country. Anim. Feed Sci. Technol. 166-167, 628–640. doi: 10.1016/j.anifeedsci.2011.04.081
Na, J. M., Yang, X., Tang, G., Dang, W., and Strobl, J. (2020). Population characteristics of loess gully system in the loess plateau of China. Remote Sens. 12:2639. doi: 10.3390/rs12162639
Nelson, D. W. (1982). Total carbon, organic carbon and organic matter. Methods Soil Anal. 9, 961–1010.
Özkan, U., and Gökbulak, F. (2017). Effect of vegetation change from forest to herbaceous vegetation cover on soil moisture and temperature regimes and soil water chemistry. Catena 149, 158–166. doi: 10.1016/j.catena.2016.09.017
Pendall, E., Schwendenmann, L., Rahn, T., Miller, J. B., Tans, P. P., and White, J. W. C. (2010). Land use and season affect fluxes of CO2, CH4, CO, N2O, H2 and isotopic source signatures in Panama: evidence from nocturnal boundary layer profiles. Glob. Chang. Biol. 16, 2721–2736. doi: 10.1111/j.1365-2486.2010.02199.x
Pisani, O., Strickland, T. C., Hubbard, R. K., Bosch, D. D., Coffin, A. W., Endale, D. M., et al. (2017). Soil nitrogen dynamics and leaching under conservation tillage in the Atlantic Coastal Plain, Georgia, United States. Soil Water Conserv. 72, 519–529. doi: 10.2489/jswc.72.5.519
Qiao, Y., Miao, S., Silva, L. C. R., and Horwath, W. R. (2014). Understory species regulate litter decomposition and accumulation of C and N in forest soils: a long-term dual-isotope experiment. For. Ecol. Manag. 329, 318–327. doi: 10.1016/j.foreco.2014.04.025
Qin, H. L., Wang, D., Xing, X. Y., Tang,, Wei, X., Chen, X., et al. (2021). A few key nirK- and nosZ-denitrifier taxa play a dominant role in moisture-enhanced N2O emissions in acidic paddy soil. Geoderma 385:114917. doi: 10.1016/j.geoderma.2020.114917
Ravishankara, A. R., Daniel, J. S., and Portmann, R. W. (2009). Nitrous oxide (N2O): the dominant ozone-depleting substance emitted in the 21st century. Science 326, 123–125. doi: 10.1126/science.1176985
Rothe, A., Cromack, J. K., Resh, S. C., Makeneci, E., and Son, Y. (2002). Soil carbon and nitrogen changes under Douglas-fir with and without red alder. Soil Sci. Soc. Am. J. 66, 1988–1995. doi: 10.2136/sssaj2002.1988
Schaufler, G., Kitzler, B., Schindlbacher, A., Skiba, U., Sutton, M. A., and Zechmeister-Boltenstern, S. (2010). Greenhouse gas emissions from European soils under different land use: effects of soil moisture and temperature. Eur. J. Soil Sci. 61, 683–696. doi: 10.1111/j.1365-2389.2010.01277.x
Shi, R. A., Li, L. J., You, M. Y., Ding, J., Wang, S., and Han, X. Z. (2013). Impact of soil temperature and moisture on soil N2O emission from mollisols under different land-use types. J. Agro Environ. Sci. 32, 2286–2292. doi: 10.11654/jaes.2013.11.026
Shi, W. Y., Yan, M. J., Zhang, J. G., Guan, J.-H., and du, S. (2014). Soil CO2 emissions from five different types of land use on the semiarid Loess Plateau of China, with emphasis on the contribution of winter soil respiration. Atmos. Environ. 88, 74–82. doi: 10.1016/j.atmosenv.2014.01.066
Shigehiro, I., Tsuruta, H., and Murdiyarso, D. (2002). An intensive field study on CO2, CH4, and N2O emissions from soils at four land-use types in Sumatra, Indonesia. Glob. Biogeochem. Cycl. 16, 22-1–22-11. doi: 10.1029/2001GB001614
Sun, C. J., Hou, H. X., and Chen, W. (2021). Effects of vegetation cover and slope on soil erosion in the Eastern Chinese Loess Plateau under different rainfall regimes. PeerJ 9:e11226. doi: 10.7717/peerj.11226
Wang, H. Y., Wu, J. Q., Li, G., and Yan, L. J. (2020). Changes in soil carbon fractions and enzyme activities under different vegetation types of the northern Loess Plateau. Ecology and evolution. 10, 12211–12223. doi: 10.1002/ece3.6852
Xing, X. Y., Tang, Y. F., Xu, H. F., and Qin, H. L. (2021). Warming shapes nirS- and nosZ-type denitrifier communities and stimulates N2O emission in acidic paddy soil. Appl. Environ. Microbiol. 87:e0296520. doi: 10.1128/AEM.02965-20
Yan, P., Lin, K. R., Wang, Y. R., Tu, X., Bai, C., and Yan, L. (2021). Assessment of influencing factors on the spatial variability of SOM in the red beds of the Nanxiong Basin of China, using GIS and geo-statistical methods. ISPRS Int. J. Geo Inf. 10, 366–379. doi: 10.3390/ijgi10060366
Yang, J. M., Zhang, Z. Q., and Cao, G. J. (2014). Soil nitrate and nitrite content determined by Skalar SAN. Soil Fertil. Sci. China 2, 101–105. doi: 10.11838/sfsc.20140221
Yao, Z., Zheng, X., Wang, R., Dong, H., Xie, B., Mei, B., et al. (2013). Greenhouse gas fluxes and NO release from a Chinese subtropical rice-winter wheat rotation system under nitrogen fertilizer management. J. Geophys. Res Biogeosci. 118, 623–638. doi: 10.1002/jgrg.20061
Zaman, M., Nguyen, M. L., imek, M., Nawaz, S., Khan, M. J., Babar, M. N., et al. (2012). “Emissions of nitrous oxide (N2O) and Di-nitrogen (N2) from the agricultural landscapes, sources, sinks, and factors affecting N2O and N2 ratios [a]” in Greenhouse gases-emission, measurement and management[M]. ed. G. X. Liu (Croatia: InTech)
Zhang, Z. Y., Wei, H. Y., Ma, J. W., Shang, H. Y., Yan, Y. F., and Li, K. (2019). Effects of different land use types on soil nitrogen. For. Sci. Technol. 44, 28–30. doi: 10.19750/j.cnki
Keywords: land use patterns, microbial biomass nitrogen, N2O emission, nitrogen accumulation, soil properties, semi-arid
Citation: Du M, Yuan J, Zhuo M, Sadiq M, Wu J, Xu G, Liu S, Li J, Li G and Yan L (2023) Effects of different land use patterns on soil properties and N2O emissions on a semi-arid Loess Plateau of Central Gansu. Front. Ecol. Evol. 11:1128236. doi: 10.3389/fevo.2023.1128236
Edited by:
Arnaldo Marín, University of Murcia, SpainReviewed by:
Yan Ruirui, Chinese Academy of Agricultural Sciences, ChinaTao Huang, Nanjing Normal University, China
Copyright © 2023 Du, Yuan, Zhuo, Sadiq, Wu, Xu, Liu, Li, Li and Yan. This is an open-access article distributed under the terms of the Creative Commons Attribution License (CC BY). The use, distribution or reproduction in other forums is permitted, provided the original author(s) and the copyright owner(s) are credited and that the original publication in this journal is cited, in accordance with accepted academic practice. No use, distribution or reproduction is permitted which does not comply with these terms.
*Correspondence: Guang Li, lig@gsau.edu.cn; Lijuan Yan, yanlj@gsau.edu.cn
†These authors have contributed equally to this work